Embed Size (px)
Citation preview
REVISED
Strategic Plan Goal I. Educator Quality
b) Develop, maintain, and promote high quality authentic, consistent educator assessments and examinations that support development and certification of educators who have demonstrated the capacity to be effective practitioners.
April 2016
5C Information
Educator Preparation Committee
Annual Report on Passing Rates of Commission-Approved Examinations from 2010-2011 to 2014-2015
Executive Summary: This agenda item reports the passing rates of Commission-approved examinations. For each examination, the purpose of the examination, its structure, the scoring process, the examination volume, the first-time passing rate, and the cumulative passing rate are discussed. When available, the passing rate by demographic data is also discussed.
Recommended Action: For information only Presenter: Michael Taylor, Consultant, Professional Services Division
REVISED
EPC 5C-1 April 2016
Annual Report on Passing Rates of Commission-Approved Examinations from 2010-2011 to 2014-2015
Introduction This agenda item presents the passing rates for Commission-approved examinations over the past five years, 2010-2011 through 2014-2015. The purpose of each examination, the structure, the scoring process, the volume, and the first-time and cumulative passing rates are discussed in detail. Additional data tables referenced throughout this item are presented in the Appendices on the Commission website. Background The Commission on Teacher Credentialing (Commission) issues credentials, certificates, and permits that authorize service as a teacher, administrator, counselor, or other professional service provider in California’s public schools. California uses a series of Commission-approved examinations to assess candidates’ competencies in basic skills, subject matter proficiency, and/or professional knowledge. Basic Skills Examinations Candidates for most credentials, certificates, and permits are required to demonstrate proficiency in basic reading, mathematics, and writing skills. The California Basic Educational Skills Test (CBEST) is one approved method used to verify basic proficiency in reading, mathematics, and writing to meet this requirement. Candidates who have not yet met this requirement are also required to take a basic skills exam for diagnostic purposes prior to admission to a program of professional preparation, and must pass the examination or meet the basic skills requirement by another Commission-approved means prior to certification. The CBEST was first administered in 1982. Subject Matter Competency Examinations Current law requires candidates for a preliminary multiple or single subject teaching credential to demonstrate competency in the content area(s) they will teach. Under California’s No Child Left Behind federal compliance plan, candidates for the Multiple Subject Credential must meet this requirement through passing the Commission’s adopted subject matter examination, currently the California Subject Examinations for Teachers (CSET) Multiple Subjects examination. The Every Student Succeeds Act (ESSA) has been recently signed into law and will affect this policy. There is a separate agenda item on ESSA being presented for discussion at this meeting. Single Subject Credential candidates may meet the subject matter requirement either by completing a Commission-approved subject matter program or by passing the appropriate content area CSET Single Subject examination. Education specialist candidates also use this option to verify subject matter knowledge. Both the subject matter programs and the CSET series of examinations are aligned with the state’s K-12 student academic content standards. It is important to note that the CSET examinations measure candidates’ subject matter knowledge, skills, and abilities, not their pedagogical knowledge. The CSET was first administered in 2003. Beginning with the May 2007 administration of the CSET: Multiple Subjects examination, an optional fourth subtest known as the CSET: Writing Skills examination was added. Candidates for a
REVISED
EPC 5C-2 April 2016
multiple subject credential may use the CSET: Multiple Subjects examination plus the CSET: Writing Skills subtest to verify basic skills as an alternative to passing the CBEST. The California Teachers of English Learners (CTEL) examination is used by candidates other than those prepared in SB 2042 teacher preparation programs (such as, for example, out of state candidates) to demonstrate they have the level of knowledge and skills required to effectively teach English learners (EL). For candidates seeking a bilingual authorization via examination, the bilingual-specific subtests of the CSET: World Language examinations are used to demonstrate bilingual language and cultural knowledge and skills. The Teaching Foundations Examinations (TFE), historically, and the National Evaluation Series (NES), currently, satisfy a part of the pedagogical portion of the Early Completion Option of the intern program for multiple subject and selected single subject credentials. The TFE was used from 2004 - 2013. The NES was adopted by the Commission beginning in 2013. The TFE is owned and administered by the Educational Testing Service. The NES is owned and administered by the Evaluation Systems group of Pearson. Neither is a Commission-owned examination. Beginning in June 2011, the California Preliminary Administrative Credential Examination (CPACE), an exam aligned specifically to California standards, replaced the prior School Leaders Licensure Assessment (SLLA). The SLLA is no longer used by California candidates for an administrative services credential. The Commission more recently decided to update CPACE to include both content assessment and performance assessment components. The updated CPACE was first administered in July 2015. Caveats about the Data Passing rate data are based on examinees’ test scores. When the total number of examinees for a given examination is less than 10, pass rate data will not be reported. Preparation and demographic data are self-reported by examinees, and thus these data may not be available for all candidates or all questions. Whenever demographic variables are available, the passing rate by demographic variables such as gender, ethnicity, educational level, preparation, and parents’ education levels are presented in the Appendix. Definition of Terms Some of the commonly used terms in this agenda item are:
• Cohort – a group of examinees who took a particular examination in a particular year. • Criterion-referenced test – a test designed to measure an examinee’s knowledge and skills in
relation to an established standard rather than in relation to the performance of other examinees. Examinees who possess the knowledge and skills being measured are expected to perform well.
• Cumulative passing rate – the number of examinees who have passed the examination divided by the number of examinees who have taken all sections or subtests of the examination. Cumulative passing rate takes into account the fact that examinees can take the examination as many times as needed in order to pass. Please note that the 2014-2015 cohort for any
REVISED
EPC 5C-3 April 2016
examination has had fewer opportunities to retake the examination at the time of preparation of this report than prior cohorts, which would affect the cumulative passing rate.
• First-time passing rate – the number of examinees who passed all sections or subtests of the examination the first time they took each divided by the total number of first-time examinees who took all sections or subtests.
Institutional Data Reports The Commission’s examinations contractor provides institutional data reports concerning each institution’s candidates for those candidates who chose to list the institution at the time of registration as a score recipient. The Commission determines which institutions are authorized score report recipients, and those institutions are listed in each registration bulletin under “Score Reporting Institutions.” The individual at each authorized score recipient institution who receives the reports is determined by that institution. Each year, the Commission’s examinations contractor requests each institution to designate an individual with his/her contact information. Throughout the year, however, institutions may contact the contractors to update their score reporting contact information. Score reports are provided following each test administration, and include data for examinees who selected that institution as a score recipient. The institutional score reports are posted one week after the examinee score data are available, and can be accessed by the institutional contact person from a secure, password-protected web site. Information is made available to the institutions based on their needs. The files available for downloading may include the following:
• Instruction manual • Examinee roster report • Institution and statewide summary report
Summary statistics are provided for the institution based on all examinees who selected that institution as a score recipient when they registered may include:
• Number of examinees tested • Mean scaled score • Number and percentage of examinees passing or not passing • Performance by skill area
Individual examinee information provided for examinees who selected that institution as a score recipient when they registered may include:
• Name and other identifying information • Test administration date • Tests/subtests taken • Passing status • Scaled scores for tests not passed • Multiple choice section performance • Constructed response section performance • Performance by skill area
REVISED
EPC 5C-4 April 2016
All of the Commission examinations are criterion-referenced examinations that measure the examinees’ knowledge and skills in relation to an established standard rather than in relation to the performance of other examinees. Generally, examinees are only provided with scaled scores if they do not pass an examination. Examinees who pass an examination are notified only that they passed. Teaching Performance Assessment (TPA) California’s teaching performance assessment requirement is currently being met by individual preparation programs where TPAs are administered and scored locally. The Commission is moving toward centrally scored models of TPA which we anticipate will provide statewide data in the near future. When they are available statewide passing rates for California’s TPA will be provided in subsequent versions of this report.
REVISED
EPC 5C-5 April 2016
Report on Individual Commission Examinations CBEST: California Basic Educational Skills Test The California Basic Educational Skills Test (CBEST) measures basic proficiency in reading, mathematics, and writing. The examination is given in English, and all responses must be in English. Verifying basic skills proficiency is a requirement for nearly all credentials, certificates, and permits. California Education Code sections 44252 and 44252.6 allow several options for individuals to meet the basic skills requirement. Currently individuals can demonstrate basic skills proficiency by:
• passing the CBEST; or • passing a basic skills examination from another state; or • passing the CSET: Multiple Subjects plus the CSET: Writing Skills Test; or • achieving qualifying scores on the SAT or ACT; or • achieving a qualifying score on College Board Advanced Placement (AP) examinations; or • passing both the math and the English sections of the California State University (CSU) Early
Assessment Program (EAP); or • passing both of the CSU placement examinations: English Placement Test and Entry Level
Mathematics. The CBEST consists of three sections – reading, mathematics, and writing. Each section assesses basic skills and concepts that are important to performing the job of an educator in California. At each administration, examinees can take one, two, or three sections of the test during a single four-hour testing session. No individual test section is timed. Beginning in 2011, the computer-based CBEST became available on demand throughout the year at the contractor’s computer-based testing centers along with the six times per year paper-based test administrations.
Reading Section: The CBEST Reading section consists of 50 multiple-choice questions: 40 “scorable” questions used to determine a candidate’s score, and 10 “nonscorable” questions that are being field-tested and are not used to determine a candidate’s score. The questions assess the candidate’s ability to comprehend information presented in written passages, tables, and graphs. Two major skill areas are covered: (a) critical analysis and evaluation, and (b) comprehension and research skills. Approximately 40 percent of the questions assess critical analysis and evaluation skills, and approximately 60 percent assess comprehension and research skills. Mathematics Section: The CBEST Mathematics section consists of 50 multiple-choice questions: 40 “scorable” and 10 “nonscorable.” The questions require the candidate to solve mathematical problems, and most are presented as word problems. The questions assess skills in three major areas: (a) estimation, measurement, and statistical principles; (b) computation and problem solving; and (c) numerical and graphic relationships. Approximately 30 percent of the questions are from skill area (a), 35 percent from skill area (b), and 35 percent from skill area (c). Writing Section: The CBEST Writing section assesses the candidate’s ability to write effectively. Candidates are provided two essay topics and are asked to write a response to each. One of the topics requires a
REVISED
EPC 5C-6 April 2016
written analysis of a specific situation or statement; the other asks the candidate to write about a personal experience. Examinees are not expected to demonstrate specialized knowledge of any topic in their response.
Scoring of the CBEST The Reading and Mathematics sections of the CBEST consist entirely of multiple-choice questions that are machine-scored. A raw score for each of these sections is calculated by totaling the number of questions answered correctly. There is no penalty for incorrect answers. The raw scores are then converted to scaled scores. The Writing Section consists of two essays, each of which is double-scored, using a holistic rubric that ranges from a low score of one to a high score of four. The scores from both essays are summed, yielding a Writing Section raw score that can range from 4 to 16. The raw score is then converted to a scaled score. The total score is obtained by adding the Mathematics, Reading and Writing scaled scores together. Table 1: CBEST State Passing Score Standard and Score Range
Test Name State Passing Score Standard Score Range
CBEST
Reading
Mathematics
Writing
a scaled score of 41 in each of the three sections (a score as low as 37 on any section is
acceptable if the minimum total score is 123)
20 – 80 for each section
Examination Volume The volume of CBEST examinations administered declined dramatically for a decade, from a high of 128,000 in 2001-2002 to less than 40,000 in 2011-2012. Since 2012 the number of administrations has been steadily increasing, climbing to more than 50,000 in 2014-2015. Beginning in May 2007, two additional Commission examination options became available for individuals to meet the basic skills requirement. The first allows out-of-state individuals to use their home state’s basic skills examination, if the examination is comparable to CBEST, to satisfy this requirement. The second option allows individuals to satisfy this requirement by passing the California Subject Examinations for Teachers: Multiple Subjects (CSET: MS) plus the CSET: Writing Skills subtest. In 2014-15, 664 examinees took the CSET: Writing Skills examination, which is the best indicator for determining the number of people using this alternative option to meet the basic skills requirement. See Appendix B2 for details on the CSET: Writing Skills subtest. Table 2 provides the number of CBEST examinees and test sections administered for the past five testing years. These data include all examinees who took the CBEST for California purposes, either within or outside California.
REVISED
EPC 5C-7 April 2016
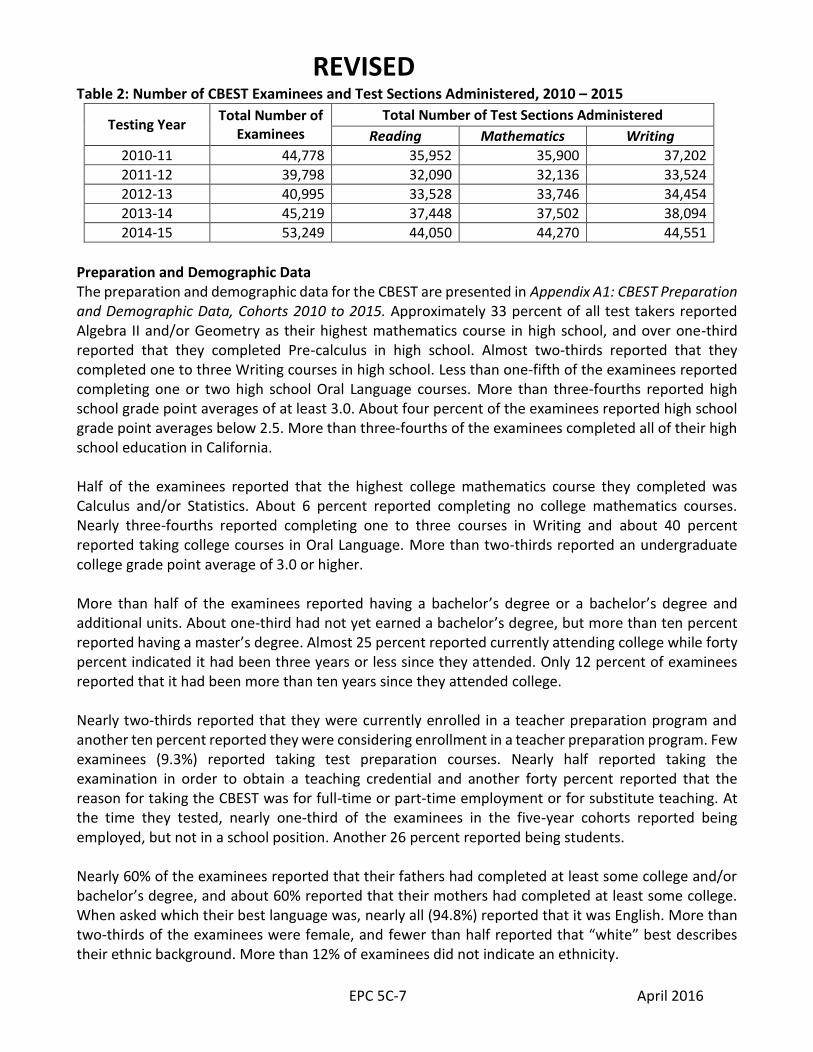
Table 2: Number of CBEST Examinees and Test Sections Administered, 2010 – 2015
Testing Year Total Number of
Examinees Total Number of Test Sections Administered
Reading Mathematics Writing
2010-11 44,778 35,952 35,900 37,202
2011-12 39,798 32,090 32,136 33,524
2012-13 40,995 33,528 33,746 34,454
2013-14 45,219 37,448 37,502 38,094
2014-15 53,249 44,050 44,270 44,551
Preparation and Demographic Data The preparation and demographic data for the CBEST are presented in Appendix A1: CBEST Preparation and Demographic Data, Cohorts 2010 to 2015. Approximately 33 percent of all test takers reported Algebra II and/or Geometry as their highest mathematics course in high school, and over one-third reported that they completed Pre-calculus in high school. Almost two-thirds reported that they completed one to three Writing courses in high school. Less than one-fifth of the examinees reported completing one or two high school Oral Language courses. More than three-fourths reported high school grade point averages of at least 3.0. About four percent of the examinees reported high school grade point averages below 2.5. More than three-fourths of the examinees completed all of their high school education in California. Half of the examinees reported that the highest college mathematics course they completed was Calculus and/or Statistics. About 6 percent reported completing no college mathematics courses. Nearly three-fourths reported completing one to three courses in Writing and about 40 percent reported taking college courses in Oral Language. More than two-thirds reported an undergraduate college grade point average of 3.0 or higher. More than half of the examinees reported having a bachelor’s degree or a bachelor’s degree and additional units. About one-third had not yet earned a bachelor’s degree, but more than ten percent reported having a master’s degree. Almost 25 percent reported currently attending college while forty percent indicated it had been three years or less since they attended. Only 12 percent of examinees reported that it had been more than ten years since they attended college. Nearly two-thirds reported that they were currently enrolled in a teacher preparation program and another ten percent reported they were considering enrollment in a teacher preparation program. Few examinees (9.3%) reported taking test preparation courses. Nearly half reported taking the examination in order to obtain a teaching credential and another forty percent reported that the reason for taking the CBEST was for full-time or part-time employment or for substitute teaching. At the time they tested, nearly one-third of the examinees in the five-year cohorts reported being employed, but not in a school position. Another 26 percent reported being students. Nearly 60% of the examinees reported that their fathers had completed at least some college and/or bachelor’s degree, and about 60% reported that their mothers had completed at least some college. When asked which their best language was, nearly all (94.8%) reported that it was English. More than two-thirds of the examinees were female, and fewer than half reported that “white” best describes their ethnic background. More than 12% of examinees did not indicate an ethnicity.
REVISED
EPC 5C-8 April 2016
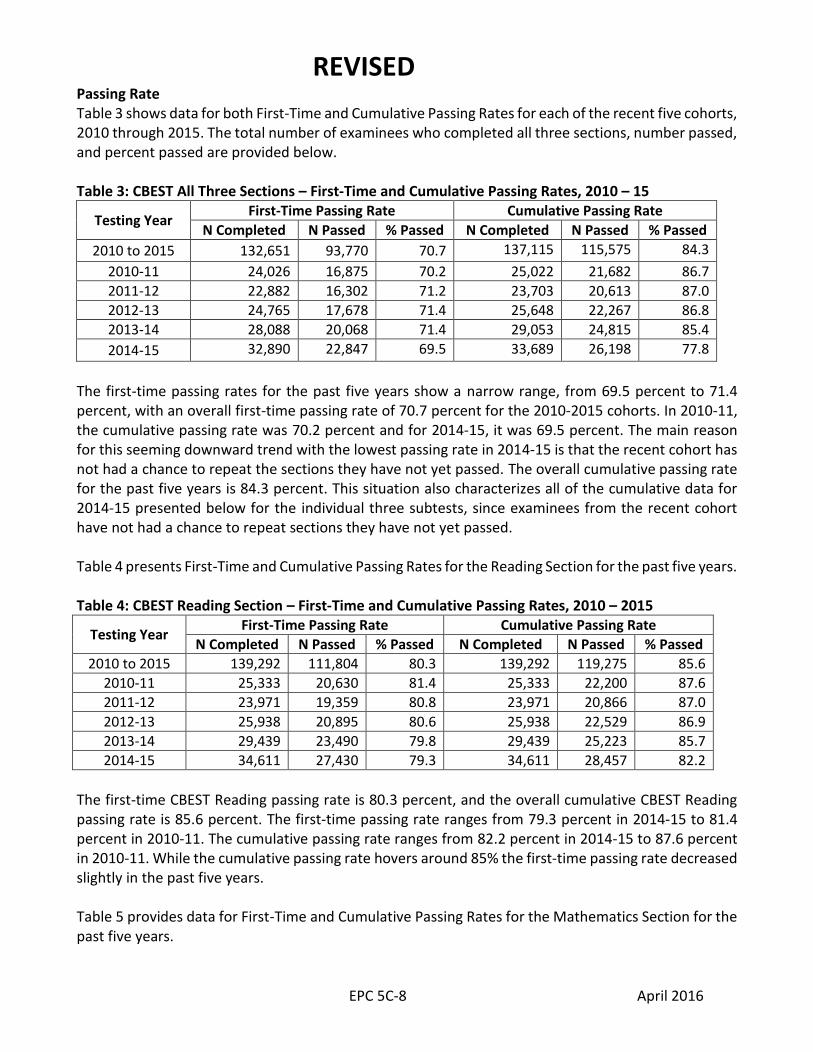
Passing Rate Table 3 shows data for both First-Time and Cumulative Passing Rates for each of the recent five cohorts, 2010 through 2015. The total number of examinees who completed all three sections, number passed, and percent passed are provided below. Table 3: CBEST All Three Sections – First-Time and Cumulative Passing Rates, 2010 – 15
Testing Year First-Time Passing Rate Cumulative Passing Rate
N Completed N Passed % Passed N Completed N Passed % Passed
2010 to 2015 132,651 93,770 70.7 137,115 115,575 84.3
2010-11 24,026 16,875 70.2 25,022 21,682 86.7
2011-12 22,882 16,302 71.2 23,703 20,613 87.0
2012-13 24,765 17,678 71.4 25,648 22,267 86.8
2013-14 28,088 20,068 71.4 29,053 24,815 85.4
2014-15 32,890 22,847 69.5 33,689 26,198 77.8
The first-time passing rates for the past five years show a narrow range, from 69.5 percent to 71.4 percent, with an overall first-time passing rate of 70.7 percent for the 2010-2015 cohorts. In 2010-11, the cumulative passing rate was 70.2 percent and for 2014-15, it was 69.5 percent. The main reason for this seeming downward trend with the lowest passing rate in 2014-15 is that the recent cohort has not had a chance to repeat the sections they have not yet passed. The overall cumulative passing rate for the past five years is 84.3 percent. This situation also characterizes all of the cumulative data for 2014-15 presented below for the individual three subtests, since examinees from the recent cohort have not had a chance to repeat sections they have not yet passed. Table 4 presents First-Time and Cumulative Passing Rates for the Reading Section for the past five years. Table 4: CBEST Reading Section – First-Time and Cumulative Passing Rates, 2010 – 2015
Testing Year First-Time Passing Rate Cumulative Passing Rate
N Completed N Passed % Passed N Completed N Passed % Passed
2010 to 2015 139,292 111,804 80.3 139,292 119,275 85.6
2010-11 25,333 20,630 81.4 25,333 22,200 87.6
2011-12 23,971 19,359 80.8 23,971 20,866 87.0
2012-13 25,938 20,895 80.6 25,938 22,529 86.9
2013-14 29,439 23,490 79.8 29,439 25,223 85.7
2014-15 34,611 27,430 79.3 34,611 28,457 82.2
The first-time CBEST Reading passing rate is 80.3 percent, and the overall cumulative CBEST Reading passing rate is 85.6 percent. The first-time passing rate ranges from 79.3 percent in 2014-15 to 81.4 percent in 2010-11. The cumulative passing rate ranges from 82.2 percent in 2014-15 to 87.6 percent in 2010-11. While the cumulative passing rate hovers around 85% the first-time passing rate decreased slightly in the past five years. Table 5 provides data for First-Time and Cumulative Passing Rates for the Mathematics Section for the past five years.
REVISED
EPC 5C-9 April 2016
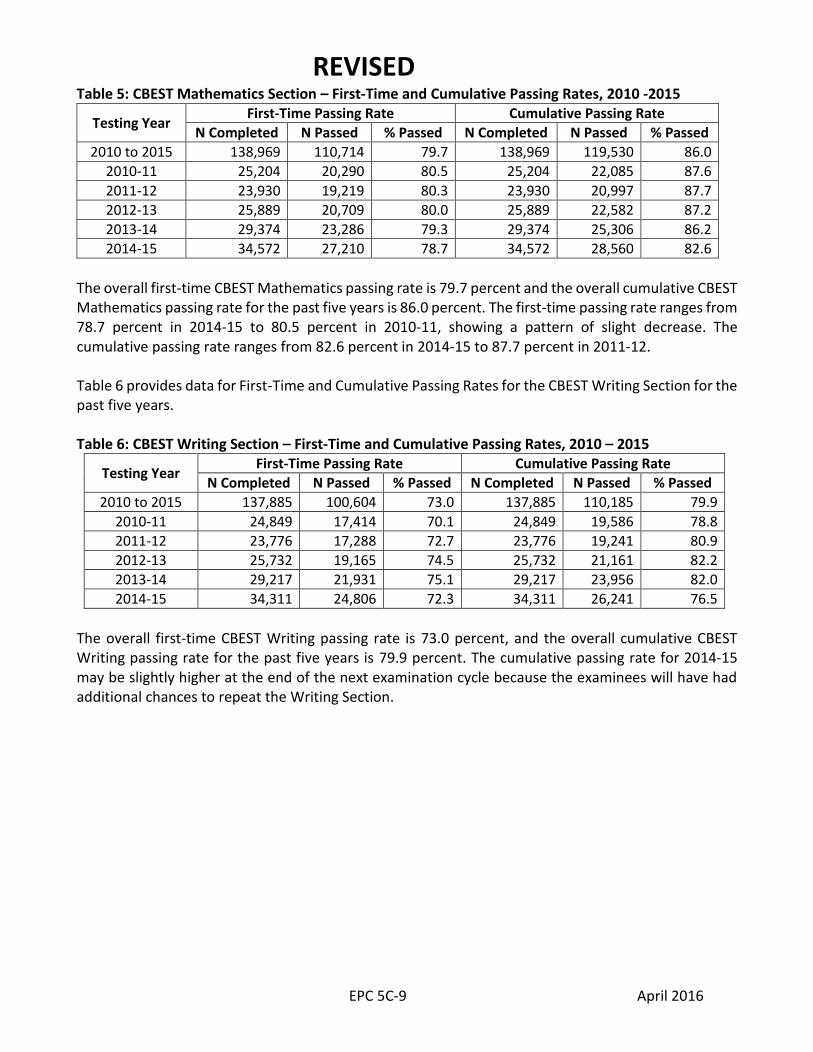
Table 5: CBEST Mathematics Section – First-Time and Cumulative Passing Rates, 2010 -2015
Testing Year First-Time Passing Rate Cumulative Passing Rate
N Completed N Passed % Passed N Completed N Passed % Passed
2010 to 2015 138,969 110,714 79.7 138,969 119,530 86.0
2010-11 25,204 20,290 80.5 25,204 22,085 87.6
2011-12 23,930 19,219 80.3 23,930 20,997 87.7
2012-13 25,889 20,709 80.0 25,889 22,582 87.2
2013-14 29,374 23,286 79.3 29,374 25,306 86.2
2014-15 34,572 27,210 78.7 34,572 28,560 82.6
The overall first-time CBEST Mathematics passing rate is 79.7 percent and the overall cumulative CBEST Mathematics passing rate for the past five years is 86.0 percent. The first-time passing rate ranges from 78.7 percent in 2014-15 to 80.5 percent in 2010-11, showing a pattern of slight decrease. The cumulative passing rate ranges from 82.6 percent in 2014-15 to 87.7 percent in 2011-12. Table 6 provides data for First-Time and Cumulative Passing Rates for the CBEST Writing Section for the past five years. Table 6: CBEST Writing Section – First-Time and Cumulative Passing Rates, 2010 – 2015
Testing Year First-Time Passing Rate Cumulative Passing Rate
N Completed N Passed % Passed N Completed N Passed % Passed
2010 to 2015 137,885 100,604 73.0 137,885 110,185 79.9
2010-11 24,849 17,414 70.1 24,849 19,586 78.8
2011-12 23,776 17,288 72.7 23,776 19,241 80.9
2012-13 25,732 19,165 74.5 25,732 21,161 82.2
2013-14 29,217 21,931 75.1 29,217 23,956 82.0
2014-15 34,311 24,806 72.3 34,311 26,241 76.5
The overall first-time CBEST Writing passing rate is 73.0 percent, and the overall cumulative CBEST Writing passing rate for the past five years is 79.9 percent. The cumulative passing rate for 2014-15 may be slightly higher at the end of the next examination cycle because the examinees will have had additional chances to repeat the Writing Section.
REVISED
EPC 5C-10 April 2016
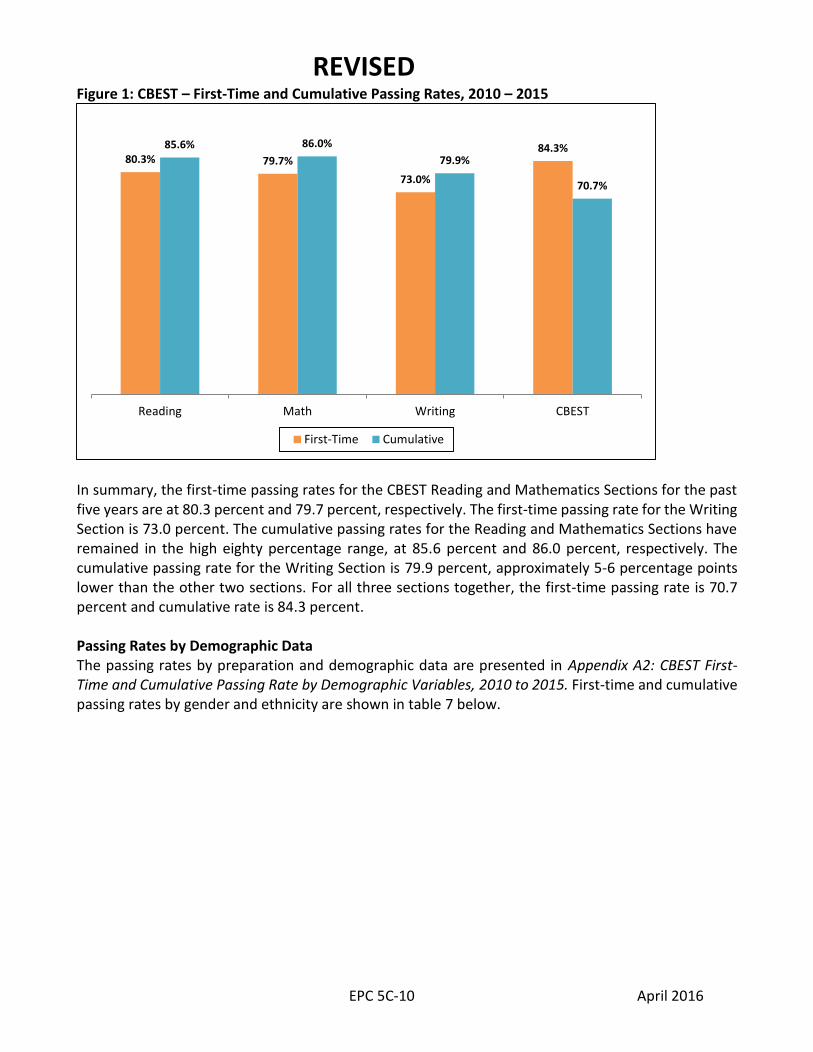
Figure 1: CBEST – First-Time and Cumulative Passing Rates, 2010 – 2015
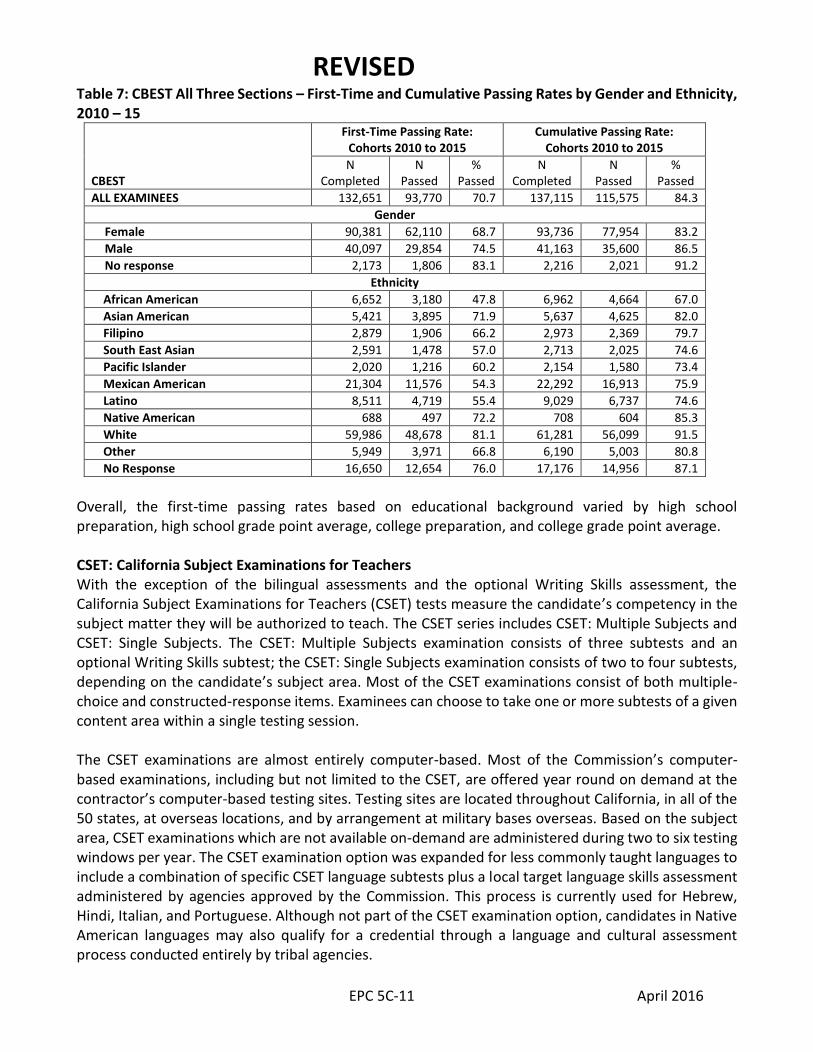
In summary, the first-time passing rates for the CBEST Reading and Mathematics Sections for the past five years are at 80.3 percent and 79.7 percent, respectively. The first-time passing rate for the Writing Section is 73.0 percent. The cumulative passing rates for the Reading and Mathematics Sections have remained in the high eighty percentage range, at 85.6 percent and 86.0 percent, respectively. The cumulative passing rate for the Writing Section is 79.9 percent, approximately 5-6 percentage points lower than the other two sections. For all three sections together, the first-time passing rate is 70.7 percent and cumulative rate is 84.3 percent. Passing Rates by Demographic Data The passing rates by preparation and demographic data are presented in Appendix A2: CBEST First-Time and Cumulative Passing Rate by Demographic Variables, 2010 to 2015. First-time and cumulative passing rates by gender and ethnicity are shown in table 7 below.
80.3% 79.7%
73.0%
84.3%85.6% 86.0%
79.9%
70.7%
Reading Math Writing CBEST
First-Time Cumulative
REVISED
EPC 5C-11 April 2016
Table 7: CBEST All Three Sections – First-Time and Cumulative Passing Rates by Gender and Ethnicity, 2010 – 15
CBEST
First-Time Passing Rate: Cohorts 2010 to 2015
Cumulative Passing Rate: Cohorts 2010 to 2015
N Completed
N Passed
% Passed
N Completed
N Passed
% Passed
ALL EXAMINEES 132,651 93,770 70.7 137,115 115,575 84.3
Gender
Female 90,381 62,110 68.7 93,736 77,954 83.2
Male 40,097 29,854 74.5 41,163 35,600 86.5
No response 2,173 1,806 83.1 2,216 2,021 91.2
Ethnicity
African American 6,652 3,180 47.8 6,962 4,664 67.0
Asian American 5,421 3,895 71.9 5,637 4,625 82.0
Filipino 2,879 1,906 66.2 2,973 2,369 79.7
South East Asian 2,591 1,478 57.0 2,713 2,025 74.6
Pacific Islander 2,020 1,216 60.2 2,154 1,580 73.4
Mexican American 21,304 11,576 54.3 22,292 16,913 75.9
Latino 8,511 4,719 55.4 9,029 6,737 74.6
Native American 688 497 72.2 708 604 85.3
White 59,986 48,678 81.1 61,281 56,099 91.5
Other 5,949 3,971 66.8 6,190 5,003 80.8
No Response 16,650 12,654 76.0 17,176 14,956 87.1
Overall, the first-time passing rates based on educational background varied by high school preparation, high school grade point average, college preparation, and college grade point average. CSET: California Subject Examinations for Teachers With the exception of the bilingual assessments and the optional Writing Skills assessment, the California Subject Examinations for Teachers (CSET) tests measure the candidate’s competency in the subject matter they will be authorized to teach. The CSET series includes CSET: Multiple Subjects and CSET: Single Subjects. The CSET: Multiple Subjects examination consists of three subtests and an optional Writing Skills subtest; the CSET: Single Subjects examination consists of two to four subtests, depending on the candidate’s subject area. Most of the CSET examinations consist of both multiple-choice and constructed-response items. Examinees can choose to take one or more subtests of a given content area within a single testing session. The CSET examinations are almost entirely computer-based. Most of the Commission’s computer-based examinations, including but not limited to the CSET, are offered year round on demand at the contractor’s computer-based testing sites. Testing sites are located throughout California, in all of the 50 states, at overseas locations, and by arrangement at military bases overseas. Based on the subject area, CSET examinations which are not available on-demand are administered during two to six testing windows per year. The CSET examination option was expanded for less commonly taught languages to include a combination of specific CSET language subtests plus a local target language skills assessment administered by agencies approved by the Commission. This process is currently used for Hebrew, Hindi, Italian, and Portuguese. Although not part of the CSET examination option, candidates in Native American languages may also qualify for a credential through a language and cultural assessment process conducted entirely by tribal agencies.
REVISED
EPC 5C-12 April 2016
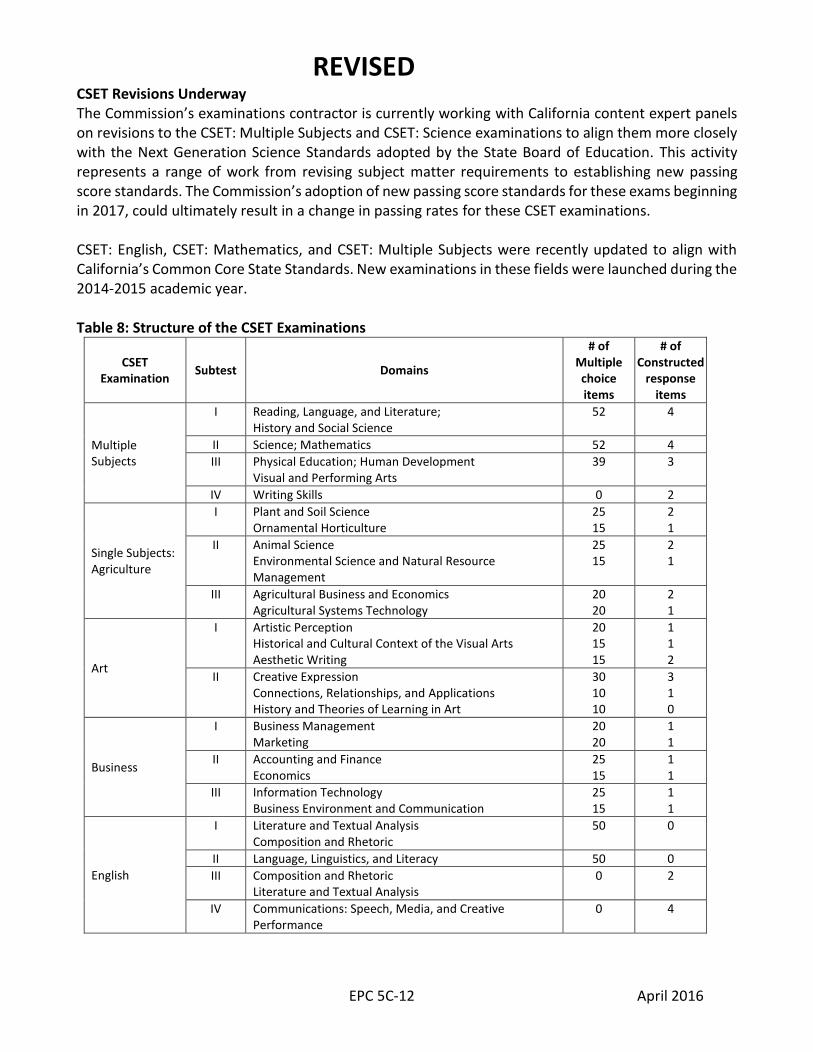
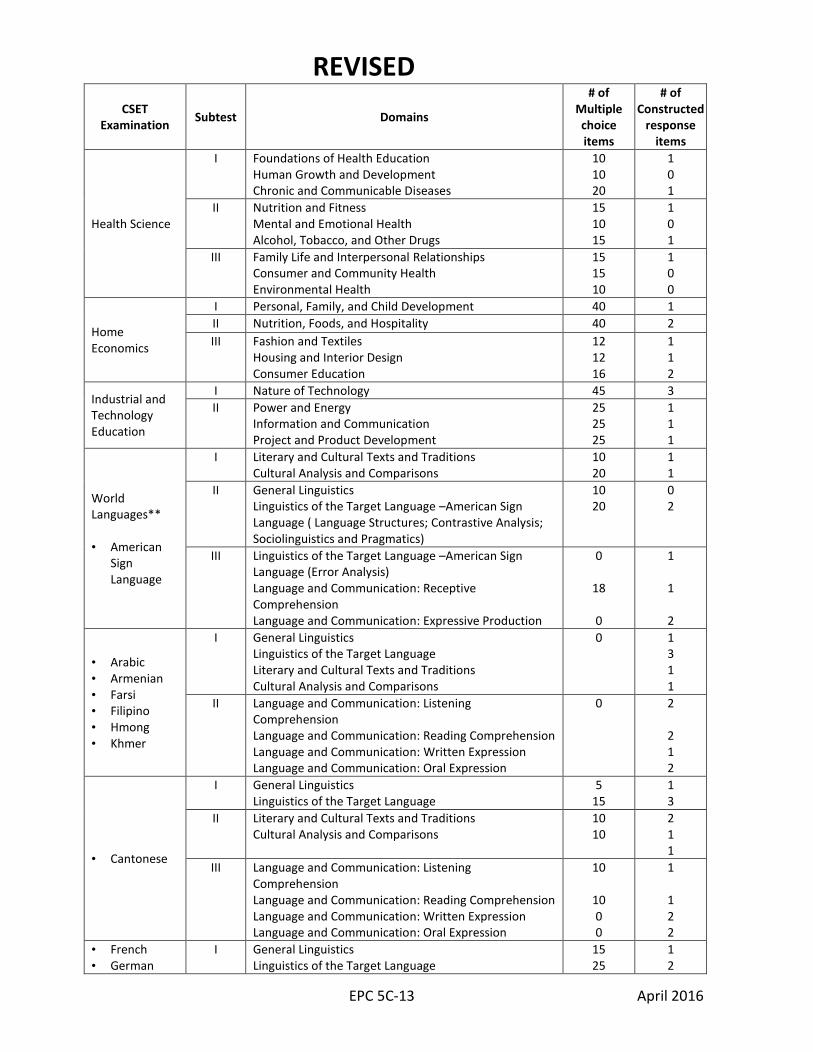
CSET Revisions Underway The Commission’s examinations contractor is currently working with California content expert panels on revisions to the CSET: Multiple Subjects and CSET: Science examinations to align them more closely with the Next Generation Science Standards adopted by the State Board of Education. This activity represents a range of work from revising subject matter requirements to establishing new passing score standards. The Commission’s adoption of new passing score standards for these exams beginning in 2017, could ultimately result in a change in passing rates for these CSET examinations. CSET: English, CSET: Mathematics, and CSET: Multiple Subjects were recently updated to align with California’s Common Core State Standards. New examinations in these fields were launched during the 2014-2015 academic year. Table 8: Structure of the CSET Examinations
CSET Examination
Subtest Domains
# of Multiple choice items
# of Constructed
response items
Multiple Subjects
I Reading, Language, and Literature; History and Social Science
52 4
II Science; Mathematics 52 4
III Physical Education; Human Development Visual and Performing Arts
39 3
IV Writing Skills 0 2
Single Subjects: Agriculture
I Plant and Soil Science Ornamental Horticulture
25 15
2 1
II Animal Science Environmental Science and Natural Resource Management
25 15
2 1
III Agricultural Business and Economics Agricultural Systems Technology
20 20
2 1
Art
I Artistic Perception Historical and Cultural Context of the Visual Arts Aesthetic Writing
20 15 15
1 1 2
II Creative Expression Connections, Relationships, and Applications History and Theories of Learning in Art
30 10 10
3 1 0
Business
I Business Management Marketing
20 20
1 1
II Accounting and Finance Economics
25 15
1 1
III Information Technology Business Environment and Communication
25 15
1 1
English
I Literature and Textual Analysis Composition and Rhetoric
50 0
II Language, Linguistics, and Literacy 50 0
III Composition and Rhetoric Literature and Textual Analysis
0 2
IV Communications: Speech, Media, and Creative Performance
0 4
REVISED
EPC 5C-13 April 2016
CSET Examination
Subtest Domains
# of Multiple choice items
# of Constructed
response items
Health Science
I Foundations of Health Education Human Growth and Development Chronic and Communicable Diseases
10 10 20
1 0 1
II Nutrition and Fitness Mental and Emotional Health Alcohol, Tobacco, and Other Drugs
15 10 15
1 0 1
III Family Life and Interpersonal Relationships Consumer and Community Health Environmental Health
15 15 10
1 0 0
Home Economics
I Personal, Family, and Child Development 40 1
II Nutrition, Foods, and Hospitality 40 2
III Fashion and Textiles Housing and Interior Design Consumer Education
12 12 16
1 1 2
Industrial and Technology Education
I Nature of Technology 45 3
II Power and Energy Information and Communication Project and Product Development
25 25 25
1 1 1
World Languages** • American
Sign Language
I Literary and Cultural Texts and Traditions Cultural Analysis and Comparisons
10 20
1 1
II General Linguistics Linguistics of the Target Language –American Sign Language ( Language Structures; Contrastive Analysis; Sociolinguistics and Pragmatics)
10 20
0 2
III Linguistics of the Target Language –American Sign Language (Error Analysis) Language and Communication: Receptive Comprehension Language and Communication: Expressive Production
0
18
0
1
1
2
• Arabic • Armenian • Farsi • Filipino • Hmong • Khmer
I General Linguistics Linguistics of the Target Language Literary and Cultural Texts and Traditions Cultural Analysis and Comparisons
0 1 3 1 1
II Language and Communication: Listening Comprehension Language and Communication: Reading Comprehension Language and Communication: Written Expression Language and Communication: Oral Expression
0 2
2 1 2
• Cantonese
I General Linguistics Linguistics of the Target Language
5 15
1 3
II Literary and Cultural Texts and Traditions Cultural Analysis and Comparisons
10 10
2 1 1
III Language and Communication: Listening Comprehension Language and Communication: Reading Comprehension Language and Communication: Written Expression Language and Communication: Oral Expression
10
10 0 0
1
1 2 2
• French • German
I General Linguistics Linguistics of the Target Language
15 25
1 2
REVISED
EPC 5C-14 April 2016
CSET Examination
Subtest Domains
# of Multiple choice items
# of Constructed
response items
• Japanese • Korean • Mandarin • Punjabi • Russian • Spanish • Vietnamese
II Literary and Cultural Texts and Traditions Cultural Analysis and Comparisons
20 20
1
III Language and Communication: Listening Comprehension Reading Comprehension Written Comprehension Oral Expression
15 15 - -
1 1 2 2
• Hebrew** • Hindi • Italian • Portuguese • Turkish
I General Linguistics Linguistics of the Target Language Literary and Cultural Texts and Traditions Cultural Analysis and Comparisons
- - - -
1 2 1 2
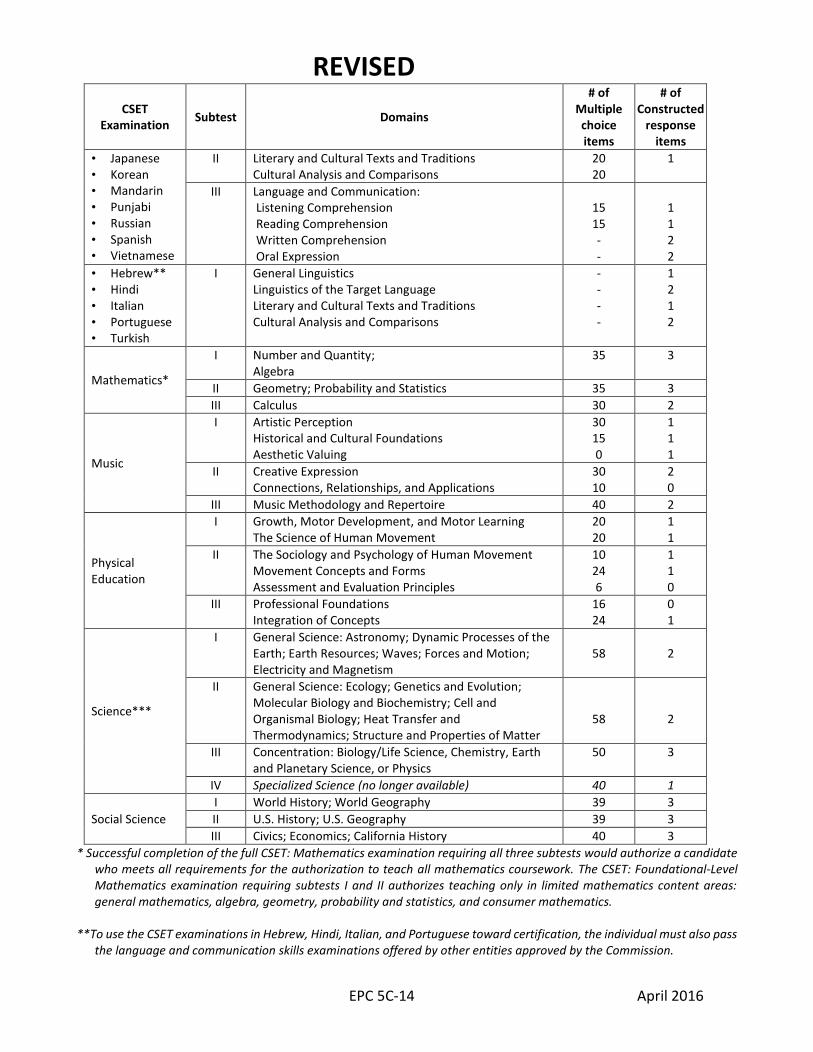
Mathematics*
I Number and Quantity; Algebra
35 3
II Geometry; Probability and Statistics 35 3
III Calculus 30 2
Music
I Artistic Perception Historical and Cultural Foundations Aesthetic Valuing
30 15 0
1 1 1
II Creative Expression Connections, Relationships, and Applications
30 10
2 0
III Music Methodology and Repertoire 40 2
Physical Education
I Growth, Motor Development, and Motor Learning The Science of Human Movement
20 20
1 1
II The Sociology and Psychology of Human Movement Movement Concepts and Forms Assessment and Evaluation Principles
10 24 6
1 1 0
III Professional Foundations Integration of Concepts
16 24
0 1
Science***
I General Science: Astronomy; Dynamic Processes of the Earth; Earth Resources; Waves; Forces and Motion; Electricity and Magnetism
58
2
II General Science: Ecology; Genetics and Evolution; Molecular Biology and Biochemistry; Cell and Organismal Biology; Heat Transfer and Thermodynamics; Structure and Properties of Matter
58
2
III Concentration: Biology/Life Science, Chemistry, Earth and Planetary Science, or Physics
50 3
IV Specialized Science (no longer available) 40 1
Social Science
I World History; World Geography 39 3
II U.S. History; U.S. Geography 39 3
III Civics; Economics; California History 40 3
* Successful completion of the full CSET: Mathematics examination requiring all three subtests would authorize a candidate who meets all requirements for the authorization to teach all mathematics coursework. The CSET: Foundational-Level Mathematics examination requiring subtests I and II authorizes teaching only in limited mathematics content areas: general mathematics, algebra, geometry, probability and statistics, and consumer mathematics.
**To use the CSET examinations in Hebrew, Hindi, Italian, and Portuguese toward certification, the individual must also pass
the language and communication skills examinations offered by other entities approved by the Commission.
REVISED
EPC 5C-15 April 2016
***The CSET: Science subtests I and II cover general science content while subtest III covers the candidate’s area of
concentration. A credential in this subject matter based on subtests I, II, and the specific science in III authorizes teaching general and integrated science and the area of concentration. The CSET: Science (specialized), which required passing the specific area of concentration in both subtests III and IV authorized teaching only in the specialized area and did not authorize teaching general and integrated science. The CSET Science (specialized) credential has been discontinued and the exams are no longer offered. The CSET: Foundational-Level General Science requires subtests I and II and authorizes teaching only in general, introductory, and integrated science (integrated science through Grade 8 only).
Scoring of the CSET To pass an examination of the CSET, candidates must earn a passing score on each of the examination’s subtests. Each CSET subtest is scored separately. For each CSET subtest, an individual’s performance is evaluated against an established standard. Passing status is determined based on total subtest performance. The total subtest score is based on the number of raw score points earned on each section (multiple-choice section and/or constructed-response section) and the weighting of each section. Raw scores are converted to a scale of 100 to 300, with the scaled score of 220 representing the minimum passing score for each subtest. Examination Volume The first administration of the initial CSET examinations was in January 2003. During this first phase, CSET examinations in Multiple Subjects, English, Mathematics, Science, and Social Science were offered as well as Foundational-Level Mathematics. CSET examinations in Science (Specialized) were added in fall 2003. CSET examinations in World Languages (French, German, Japanese, Korean, Mandarin, Punjabi, Russian, Spanish, and Vietnamese) were first administered in fall 2004 as well as CSET examinations in Art, Music, and Physical Education. CSET examinations in Agriculture, American Sign Language, Business, Health Science, Home Economics, and Industrial and Technology Education were first administered in fall 2005. The CSET examination in Filipino was first administered in fall 2006. The CSET: Arabic, Armenian, Cantonese, Farsi, Hmong, and Khmer examinations, and the CSET: Bilingual Methodology and CSET: Bilingual Culture subtests were added in 2007-2008 (see the section below regarding English Learner-related examinations for information on these two subtests). The Foundational-Level General Science authorization was added in 2009. The CSET: World Language examinations in Hebrew, Italian, and Portuguese were added in 2009-2010. Hindi was added in 2013. The CSET: Multiple Subjects, CSET: English, and CSET: Mathematics examinations were recently updated to align with California’s Common Core State Standards. Updated Multiple Subjects and English examinations were launched beginning in 2014-2015, and an updated Mathematics examination was launched in early 2015. The updated versions of these examinations function as new examinations and as such are shown on separate rows in the tables below. CSET: Science and CSET: Multiple Subjects are currently being updated to align with the Next Generation Science Standards. Passing rates for the updated Science examinations will be presented in future reports. More than 330,000 examinees took multiple and single subject examinations since the inception of CSET in 2003. Among the total examinees, about half (49%) have been Multiple Subjects examinees.
REVISED
EPC 5C-16 April 2016
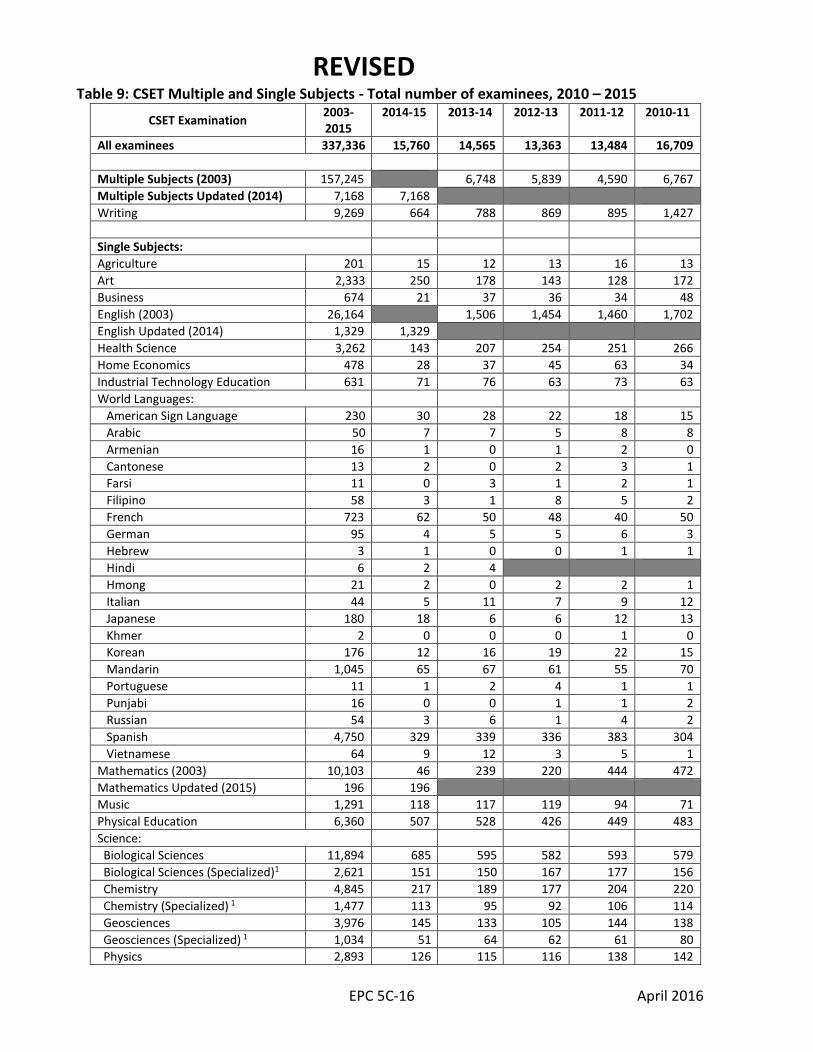
Table 9: CSET Multiple and Single Subjects - Total number of examinees, 2010 – 2015
CSET Examination 2003-2015
2014-15 2013-14 2012-13 2011-12 2010-11
All examinees 337,336 15,760 14,565 13,363 13,484 16,709
Multiple Subjects (2003) 157,245 6,748 5,839 4,590 6,767
Multiple Subjects Updated (2014) 7,168 7,168
Writing 9,269 664 788 869 895 1,427
Single Subjects:
Agriculture 201 15 12 13 16 13
Art 2,333 250 178 143 128 172
Business 674 21 37 36 34 48
English (2003) 26,164 1,506 1,454 1,460 1,702
English Updated (2014) 1,329 1,329
Health Science 3,262 143 207 254 251 266
Home Economics 478 28 37 45 63 34
Industrial Technology Education 631 71 76 63 73 63
World Languages:
American Sign Language 230 30 28 22 18 15
Arabic 50 7 7 5 8 8
Armenian 16 1 0 1 2 0
Cantonese 13 2 0 2 3 1
Farsi 11 0 3 1 2 1
Filipino 58 3 1 8 5 2
French 723 62 50 48 40 50
German 95 4 5 5 6 3
Hebrew 3 1 0 0 1 1
Hindi 6 2 4
Hmong 21 2 0 2 2 1
Italian 44 5 11 7 9 12
Japanese 180 18 6 6 12 13
Khmer 2 0 0 0 1 0
Korean 176 12 16 19 22 15
Mandarin 1,045 65 67 61 55 70
Portuguese 11 1 2 4 1 1
Punjabi 16 0 0 1 1 2
Russian 54 3 6 1 4 2
Spanish 4,750 329 339 336 383 304
Vietnamese 64 9 12 3 5 1
Mathematics (2003) 10,103 46 239 220 444 472
Mathematics Updated (2015) 196 196
Music 1,291 118 117 119 94 71
Physical Education 6,360 507 528 426 449 483
Science:
Biological Sciences 11,894 685 595 582 593 579
Biological Sciences (Specialized)1 2,621 151 150 167 177 156
Chemistry 4,845 217 189 177 204 220
Chemistry (Specialized) 1 1,477 113 95 92 106 114
Geosciences 3,976 145 133 105 144 138
Geosciences (Specialized) 1 1,034 51 64 62 61 80
Physics 2,893 126 115 116 138 142
REVISED
EPC 5C-17 April 2016
CSET Examination 2003-2015
2014-15 2013-14 2012-13 2011-12 2010-11
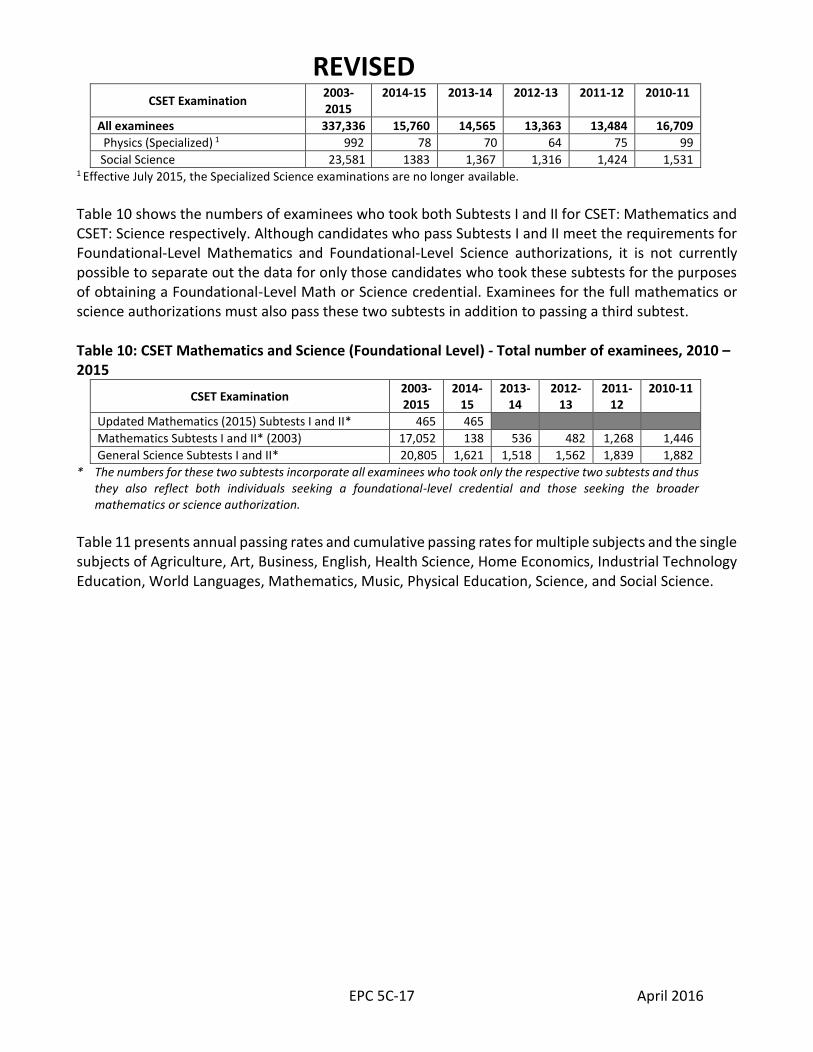
All examinees 337,336 15,760 14,565 13,363 13,484 16,709
Physics (Specialized) 1 992 78 70 64 75 99
Social Science 23,581 1383 1,367 1,316 1,424 1,531 1 Effective July 2015, the Specialized Science examinations are no longer available. Table 10 shows the numbers of examinees who took both Subtests I and II for CSET: Mathematics and CSET: Science respectively. Although candidates who pass Subtests I and II meet the requirements for Foundational-Level Mathematics and Foundational-Level Science authorizations, it is not currently possible to separate out the data for only those candidates who took these subtests for the purposes of obtaining a Foundational-Level Math or Science credential. Examinees for the full mathematics or science authorizations must also pass these two subtests in addition to passing a third subtest. Table 10: CSET Mathematics and Science (Foundational Level) - Total number of examinees, 2010 – 2015
CSET Examination 2003-2015
2014-15
2013-14
2012-13
2011-12
2010-11
Updated Mathematics (2015) Subtests I and II* 465 465
Mathematics Subtests I and II* (2003) 17,052 138 536 482 1,268 1,446
General Science Subtests I and II* 20,805 1,621 1,518 1,562 1,839 1,882
* The numbers for these two subtests incorporate all examinees who took only the respective two subtests and thus they also reflect both individuals seeking a foundational-level credential and those seeking the broader mathematics or science authorization.
Table 11 presents annual passing rates and cumulative passing rates for multiple subjects and the single subjects of Agriculture, Art, Business, English, Health Science, Home Economics, Industrial Technology Education, World Languages, Mathematics, Music, Physical Education, Science, and Social Science.
REVISED
EPC 5C-18 April 2016
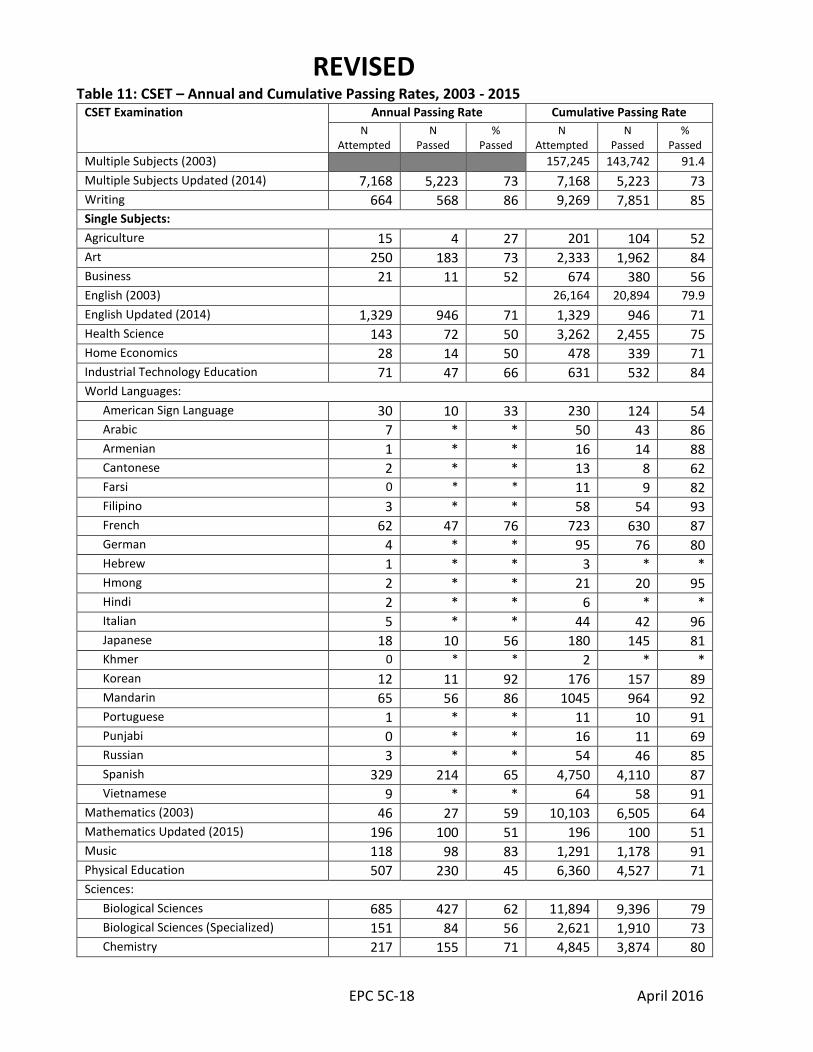
Table 11: CSET – Annual and Cumulative Passing Rates, 2003 - 2015 CSET Examination Annual Passing Rate
September 2014 – July 2015 Cumulative Passing Rate
September 2003 – July 2015 N Attempted
N Passed
% Passed
N Attempted
N Passed
% Passed
Multiple Subjects (2003) 157,245 143,742 91.4
Multiple Subjects Updated (2014) 7,168 5,223 73 7,168 5,223 73 Writing 664 568 86 9,269 7,851 85 Single Subjects:
Agriculture 15 4 27 201 104 52 Art 250 183 73 2,333 1,962 84 Business 21 11 52 674 380 56 English (2003) 26,164 20,894 79.9
English Updated (2014) 1,329 946 71 1,329 946 71 Health Science 143 72 50 3,262 2,455 75 Home Economics 28 14 50 478 339 71 Industrial Technology Education 71 47 66 631 532 84 World Languages:
American Sign Language 30 10 33 230 124 54 Arabic 7 * * 50 43 86 Armenian 1 * * 16 14 88 Cantonese 2 * * 13 8 62 Farsi 0 * * 11 9 82 Filipino 3 * * 58 54 93 French 62 47 76 723 630 87 German 4 * * 95 76 80 Hebrew 1 * * 3 * * Hmong 2 * * 21 20 95 Hindi 2 * * 6 * * Italian 5 * * 44 42 96 Japanese 18 10 56 180 145 81 Khmer 0 * * 2 * * Korean 12 11 92 176 157 89 Mandarin 65 56 86 1045 964 92 Portuguese 1 * * 11 10 91 Punjabi 0 * * 16 11 69 Russian 3 * * 54 46 85 Spanish 329 214 65 4,750 4,110 87 Vietnamese 9 * * 64 58 91 Mathematics (2003) 46 27 59 10,103 6,505 64 Mathematics Updated (2015) 196 100 51 196 100 51 Music 118 98 83 1,291 1,178 91 Physical Education 507 230 45 6,360 4,527 71 Sciences:
Biological Sciences 685 427 62 11,894 9,396 79 Biological Sciences (Specialized) 151 84 56 2,621 1,910 73 Chemistry 217 155 71 4,845 3,874 80
REVISED
EPC 5C-19 April 2016
CSET Examination Annual Passing Rate September 2014 – July 2015
Cumulative Passing Rate September 2003 – July 2015 N
Attempted N
Passed %
Passed N
Attempted N
Passed %
Passed
Chemistry (Specialized) 113 90 80 1,477 1,280 87 Geosciences 145 87 60 3,976 3,064 77 Geosciences (Specialized) 51 36 71 1,034 866 84 Physics 126 85 68 2,893 1,902 66 Physics (Specialized) 78 57 73 992 767 77 Social Science 1,383 798 58 23,581 18,739 80
*Note: Pass rates are not reported for exams with fewer than ten candidates
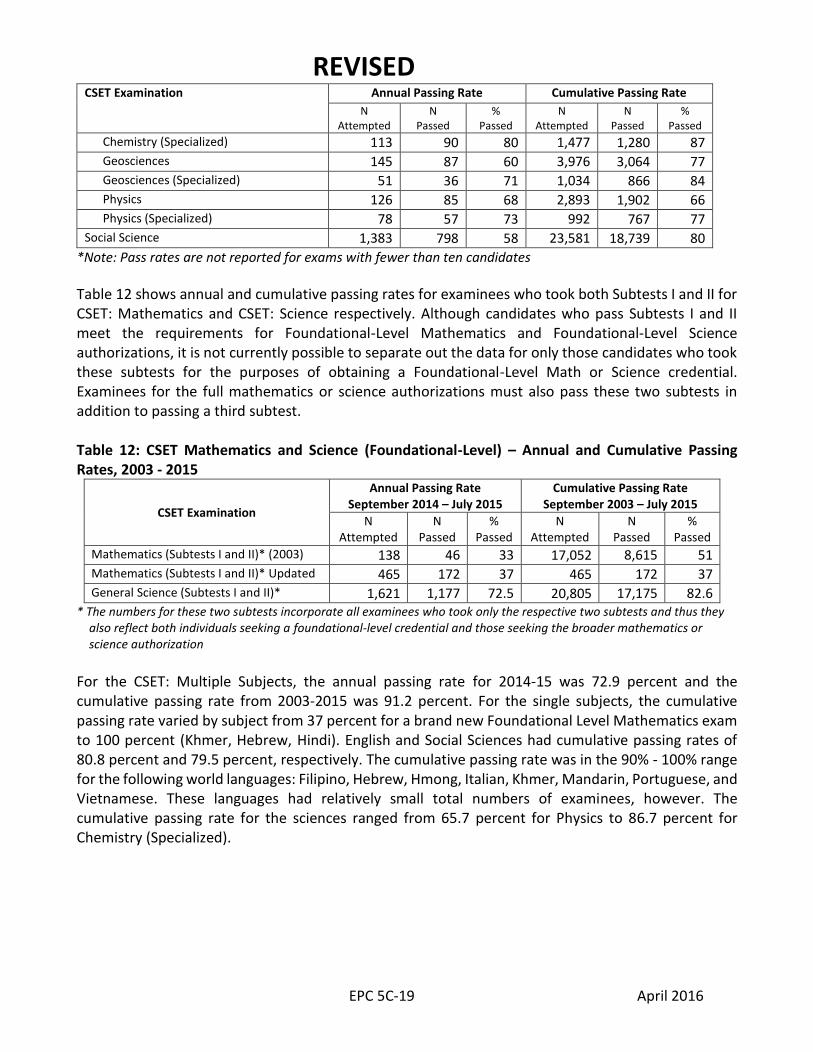
Table 12 shows annual and cumulative passing rates for examinees who took both Subtests I and II for CSET: Mathematics and CSET: Science respectively. Although candidates who pass Subtests I and II meet the requirements for Foundational-Level Mathematics and Foundational-Level Science authorizations, it is not currently possible to separate out the data for only those candidates who took these subtests for the purposes of obtaining a Foundational-Level Math or Science credential. Examinees for the full mathematics or science authorizations must also pass these two subtests in addition to passing a third subtest. Table 12: CSET Mathematics and Science (Foundational-Level) – Annual and Cumulative Passing Rates, 2003 - 2015
CSET Examination
Annual Passing Rate September 2014 – July 2015
Cumulative Passing Rate September 2003 – July 2015
N Attempted
N Passed
% Passed
N Attempted
N Passed
% Passed
Mathematics (Subtests I and II)* (2003) 138 46 33 17,052 8,615 51 Mathematics (Subtests I and II)* Updated (2015)
465 172 37 465 172 37 General Science (Subtests I and II)* 1,621 1,177 72.5 20,805 17,175 82.6
* The numbers for these two subtests incorporate all examinees who took only the respective two subtests and thus they also reflect both individuals seeking a foundational-level credential and those seeking the broader mathematics or science authorization
For the CSET: Multiple Subjects, the annual passing rate for 2014-15 was 72.9 percent and the cumulative passing rate from 2003-2015 was 91.2 percent. For the single subjects, the cumulative passing rate varied by subject from 37 percent for a brand new Foundational Level Mathematics exam to 100 percent (Khmer, Hebrew, Hindi). English and Social Sciences had cumulative passing rates of 80.8 percent and 79.5 percent, respectively. The cumulative passing rate was in the 90% - 100% range for the following world languages: Filipino, Hebrew, Hmong, Italian, Khmer, Mandarin, Portuguese, and Vietnamese. These languages had relatively small total numbers of examinees, however. The cumulative passing rate for the sciences ranged from 65.7 percent for Physics to 86.7 percent for Chemistry (Specialized).
REVISED
EPC 5C-20 April 2016
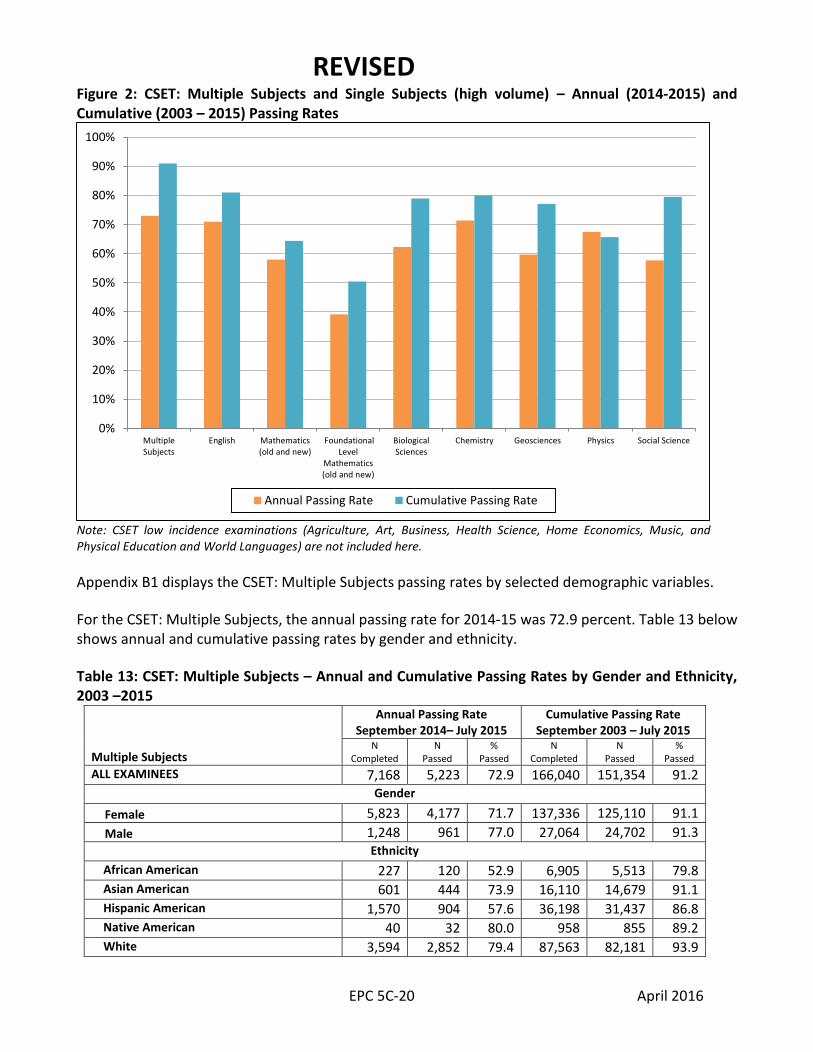
Figure 2: CSET: Multiple Subjects and Single Subjects (high volume) – Annual (2014-2015) and Cumulative (2003 – 2015) Passing Rates
Note: CSET low incidence examinations (Agriculture, Art, Business, Health Science, Home Economics, Music, and Physical Education and World Languages) are not included here.
Appendix B1 displays the CSET: Multiple Subjects passing rates by selected demographic variables.
For the CSET: Multiple Subjects, the annual passing rate for 2014-15 was 72.9 percent. Table 13 below shows annual and cumulative passing rates by gender and ethnicity.
Table 13: CSET: Multiple Subjects – Annual and Cumulative Passing Rates by Gender and Ethnicity, 2003 –2015
Multiple Subjects
Annual Passing Rate September 2014– July 2015
Cumulative Passing Rate September 2003 – July 2015
N Completed
N Passed
% Passed
N Completed
N Passed
% Passed
ALL EXAMINEES 7,168 5,223 72.9 166,040 151,354 91.2 Gender
Female 5,823 4,177 71.7 137,336 125,110 91.1
Male 1,248 961 77.0 27,064 24,702 91.3 Ethnicity
African American 227 120 52.9 6,905 5,513 79.8 Asian American 601 444 73.9 16,110 14,679 91.1 Hispanic American 1,570 904 57.6 36,198 31,437 86.8 Native American 40 32 80.0 958 855 89.2 White 3,594 2,852 79.4 87,563 82,181 93.9
0%
10%
20%
30%
40%
50%
60%
70%
80%
90%
100%
MultipleSubjects
English Mathematics(old and new)
FoundationalLevel
Mathematics(old and new)
BiologicalSciences
Chemistry Geosciences Physics Social Science
Annual Passing Rate Cumulative Passing Rate
REVISED
EPC 5C-21 April 2016
The cumulative passing rate for Multiple Subjects was 91.2 percent. Although, as expected, the cumulative passing rate was higher than the annual rate due to multiple testing opportunities, a similar pattern was observed: passing rates differed by ethnicity, reason for taking the CSET, college/university training, and highest educational level.
Examinees who took the CSET to obtain an initial multiple subject teaching credential or education specialist credential had similar passing rates: 83.6 percent and 83.4 percent, respectively. However, those who took the examination to add an authorization to an existing credential had a slightly lower passing rate of 72 percent.
Appendices B2 through B30 display CSET: Single Subject passing rates by selected demographic variables. Similar to the CSET: Multiple Subjects, the passing rates differed by gender, ethnicity, GPA, reason for taking the CSET, college/university training, and highest education level attained. As an example, for the highest cumulative passing rates, scores for California trained candidates were higher in Agriculture than those trained outside the state, and females scored higher in English than males.
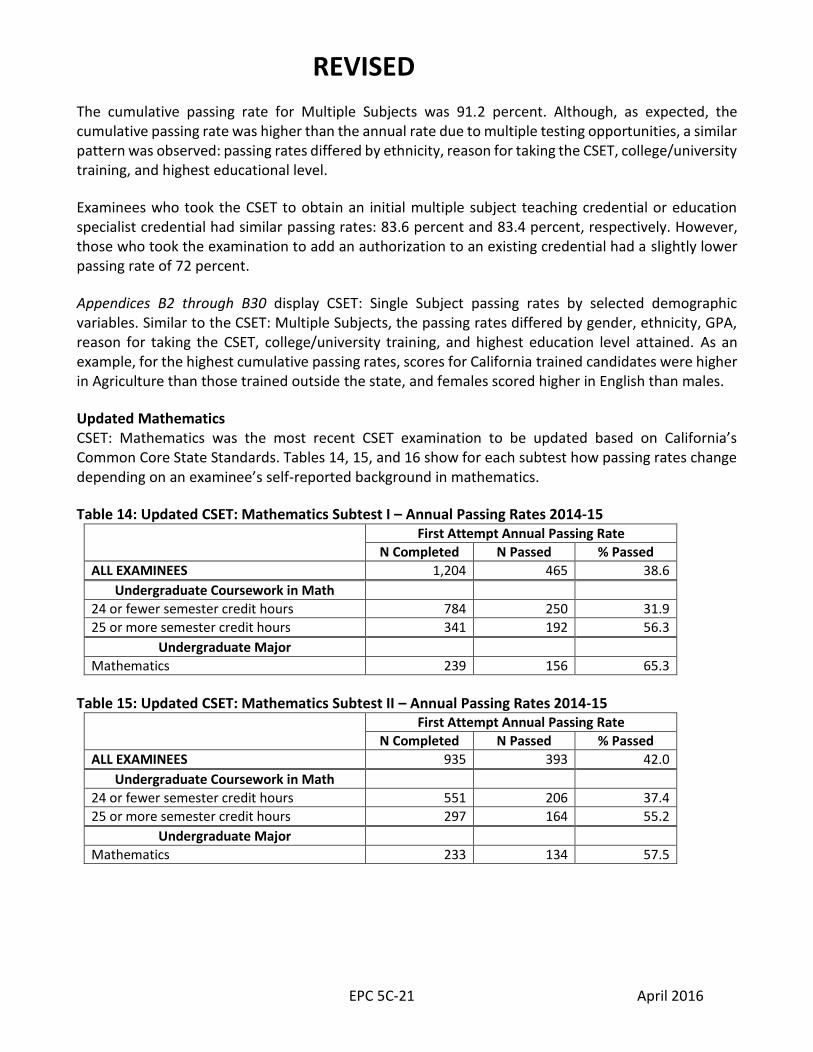
Updated Mathematics CSET: Mathematics was the most recent CSET examination to be updated based on California’s Common Core State Standards. Tables 14, 15, and 16 show for each subtest how passing rates change depending on an examinee’s self-reported background in mathematics.
Table 14: Updated CSET: Mathematics Subtest I – Annual Passing Rates 2014-15 First Attempt Annual Passing Rate
N Completed N Passed % Passed
ALL EXAMINEES 1,204 465 38.6
Undergraduate Coursework in Math
24 or fewer semester credit hours 784 250 31.9
25 or more semester credit hours 341 192 56.3
Undergraduate Major
Mathematics 239 156 65.3
Table 15: Updated CSET: Mathematics Subtest II – Annual Passing Rates 2014-15 First Attempt Annual Passing Rate
N Completed N Passed % Passed
ALL EXAMINEES 935 393 42.0
Undergraduate Coursework in Math
24 or fewer semester credit hours 551 206 37.4
25 or more semester credit hours 297 164 55.2
Undergraduate Major
Mathematics 233 134 57.5
REVISED
EPC 5C-22 April 2016
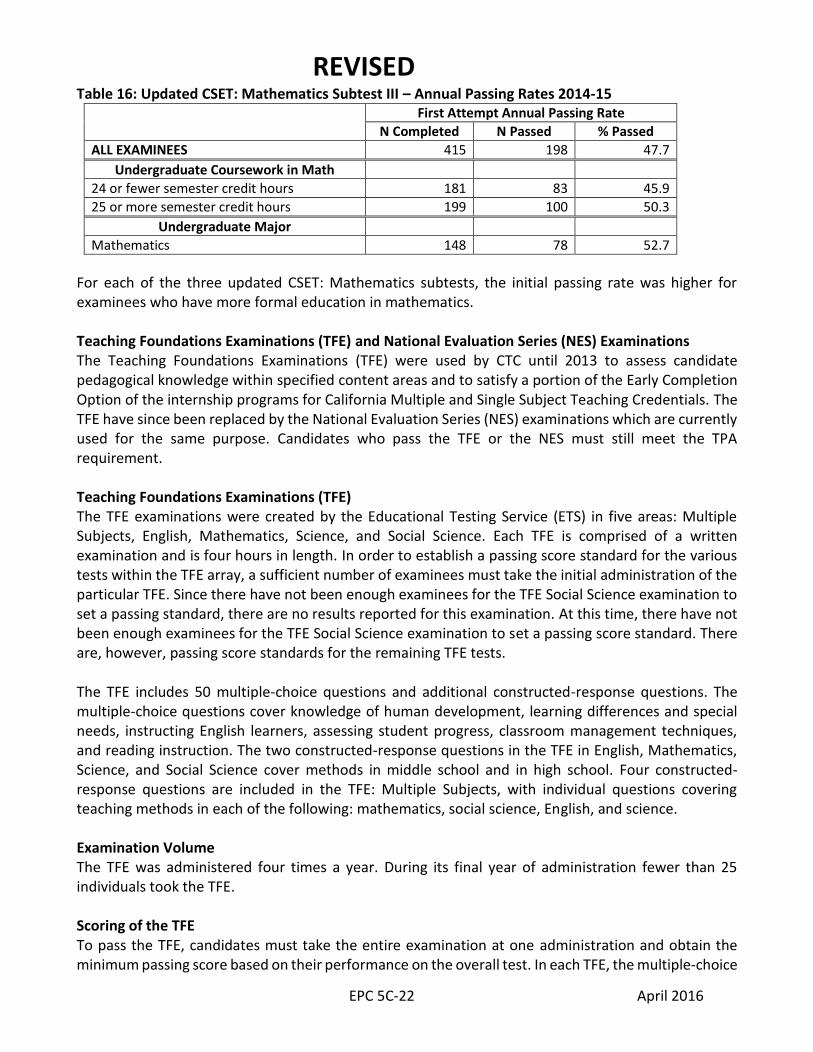
Table 16: Updated CSET: Mathematics Subtest III – Annual Passing Rates 2014-15 First Attempt Annual Passing Rate
N Completed N Passed % Passed
ALL EXAMINEES 415 198 47.7
Undergraduate Coursework in Math
24 or fewer semester credit hours 181 83 45.9
25 or more semester credit hours 199 100 50.3
Undergraduate Major
Mathematics 148 78 52.7
For each of the three updated CSET: Mathematics subtests, the initial passing rate was higher for examinees who have more formal education in mathematics. Teaching Foundations Examinations (TFE) and National Evaluation Series (NES) Examinations The Teaching Foundations Examinations (TFE) were used by CTC until 2013 to assess candidate pedagogical knowledge within specified content areas and to satisfy a portion of the Early Completion Option of the internship programs for California Multiple and Single Subject Teaching Credentials. The TFE have since been replaced by the National Evaluation Series (NES) examinations which are currently used for the same purpose. Candidates who pass the TFE or the NES must still meet the TPA requirement. Teaching Foundations Examinations (TFE) The TFE examinations were created by the Educational Testing Service (ETS) in five areas: Multiple Subjects, English, Mathematics, Science, and Social Science. Each TFE is comprised of a written examination and is four hours in length. In order to establish a passing score standard for the various tests within the TFE array, a sufficient number of examinees must take the initial administration of the particular TFE. Since there have not been enough examinees for the TFE Social Science examination to set a passing standard, there are no results reported for this examination. At this time, there have not been enough examinees for the TFE Social Science examination to set a passing score standard. There are, however, passing score standards for the remaining TFE tests. The TFE includes 50 multiple-choice questions and additional constructed-response questions. The multiple-choice questions cover knowledge of human development, learning differences and special needs, instructing English learners, assessing student progress, classroom management techniques, and reading instruction. The two constructed-response questions in the TFE in English, Mathematics, Science, and Social Science cover methods in middle school and in high school. Four constructed-response questions are included in the TFE: Multiple Subjects, with individual questions covering teaching methods in each of the following: mathematics, social science, English, and science. Examination Volume The TFE was administered four times a year. During its final year of administration fewer than 25 individuals took the TFE. Scoring of the TFE To pass the TFE, candidates must take the entire examination at one administration and obtain the minimum passing score based on their performance on the overall test. In each TFE, the multiple-choice
REVISED
EPC 5C-23 April 2016
questions comprise one-third of the total score and the constructed-response questions the remaining two-thirds. Candidates receive a scaled score computed from the total number of raw points in each component and the weighting of each component in a way that adjusts for the complexities of the questions. The raw scores for the TFE tests are converted to a scaled score. Table 17: TFE California State Passing Score Standard and Score Range
TFE Examination State Passing Score
Standard Score Range
TFE: Multiple Subject 155 100-200
TFE: English 173 100-200
TFE: Mathematics 153 100-200
TFE: Science 171 100-200
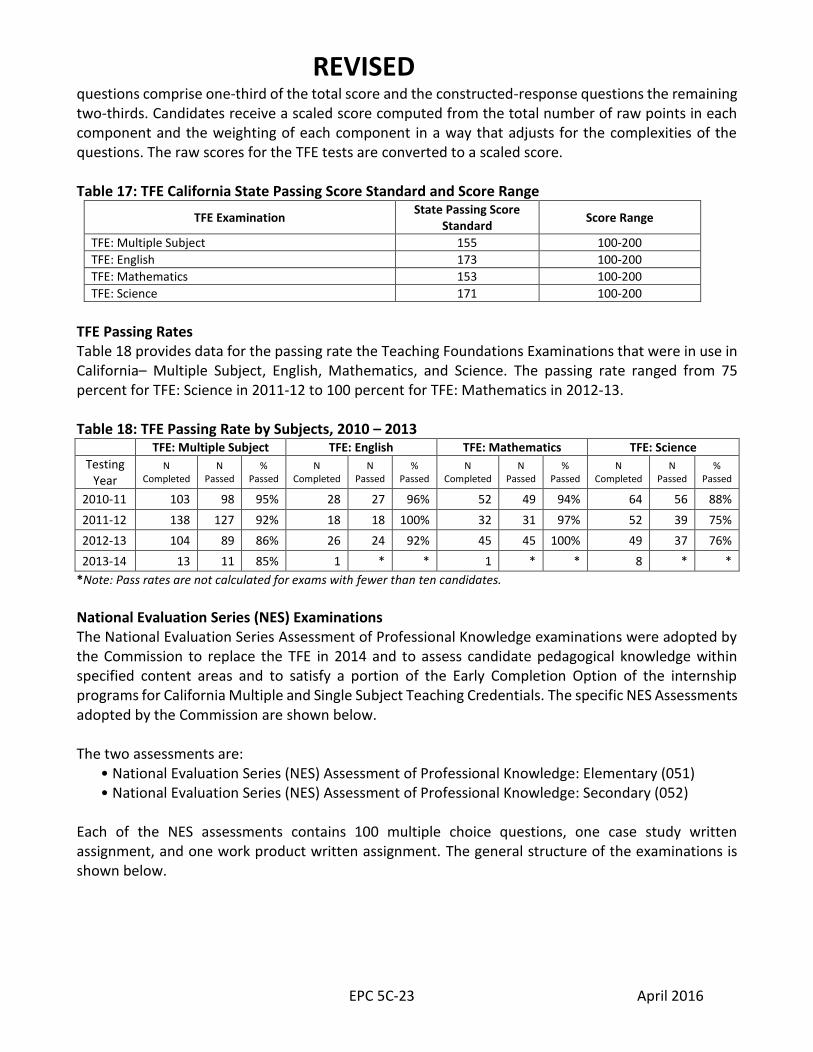
TFE Passing Rates Table 18 provides data for the passing rate the Teaching Foundations Examinations that were in use in California– Multiple Subject, English, Mathematics, and Science. The passing rate ranged from 75 percent for TFE: Science in 2011-12 to 100 percent for TFE: Mathematics in 2012-13. Table 18: TFE Passing Rate by Subjects, 2010 – 2013
TFE: Multiple Subject TFE: English TFE: Mathematics TFE: Science
Testing Year
N Completed
N Passed
% Passed
N Completed
N Passed
% Passed
N Completed
N Passed
% Passed
N Completed
N Passed
% Passed
2010-11 103 98 95% 28 27 96% 52 49 94% 64 56 88%
2011-12 138 127 92% 18 18 100% 32 31 97% 52 39 75%
2012-13 104 89 86% 26 24 92% 45 45 100% 49 37 76%
2013-14 13 11 85% 1 * * 1 * * 8 * *
*Note: Pass rates are not calculated for exams with fewer than ten candidates.
National Evaluation Series (NES) Examinations The National Evaluation Series Assessment of Professional Knowledge examinations were adopted by the Commission to replace the TFE in 2014 and to assess candidate pedagogical knowledge within specified content areas and to satisfy a portion of the Early Completion Option of the internship programs for California Multiple and Single Subject Teaching Credentials. The specific NES Assessments adopted by the Commission are shown below. The two assessments are:
• National Evaluation Series (NES) Assessment of Professional Knowledge: Elementary (051) • National Evaluation Series (NES) Assessment of Professional Knowledge: Secondary (052)
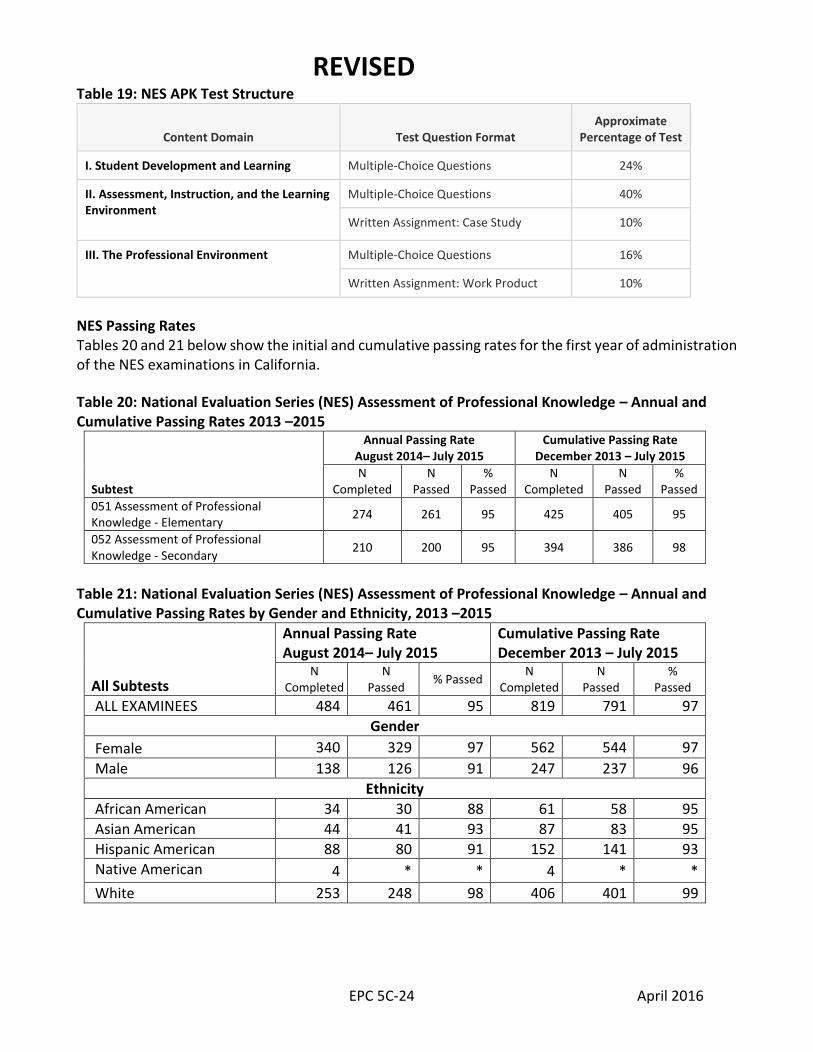
Each of the NES assessments contains 100 multiple choice questions, one case study written assignment, and one work product written assignment. The general structure of the examinations is shown below.
REVISED
EPC 5C-24 April 2016
Table 19: NES APK Test Structure
Content Domain Test Question Format Approximate
Percentage of Test
I. Student Development and Learning Multiple-Choice Questions 24%
II. Assessment, Instruction, and the Learning Environment
Multiple-Choice Questions 40%
Written Assignment: Case Study 10%
III. The Professional Environment
Multiple-Choice Questions 16%
Written Assignment: Work Product 10%
NES Passing Rates Tables 20 and 21 below show the initial and cumulative passing rates for the first year of administration of the NES examinations in California.
Table 20: National Evaluation Series (NES) Assessment of Professional Knowledge – Annual and Cumulative Passing Rates 2013 –2015
Subtest
Annual Passing Rate August 2014– July 2015
Cumulative Passing Rate December 2013 – July 2015
N Completed
N Passed
% Passed
N Completed
N Passed
% Passed
051 Assessment of Professional Knowledge - Elementary
274 261 95 425 405 95
052 Assessment of Professional Knowledge - Secondary
210 200 95 394 386 98
Table 21: National Evaluation Series (NES) Assessment of Professional Knowledge – Annual and Cumulative Passing Rates by Gender and Ethnicity, 2013 –2015
All Subtests
Annual Passing Rate August 2014– July 2015
Cumulative Passing Rate December 2013 – July 2015
N Completed
N Passed
% Passed N
Completed N
Passed %
Passed
ALL EXAMINEES 484 461 95 819 791 97
Gender
Female 340 329 97 562 544 97
Male 138 126 91 247 237 96
Ethnicity
African American 34 30 88 61 58 95
Asian American 44 41 93 87 83 95
Hispanic American 88 80 91 152 141 93
Native American 4 * * 4 * *
White 253 248 98 406 401 99
REVISED
EPC 5C-25 April 2016
RICA: Reading Instruction Competence Assessment The Reading Instruction Competence Assessment (RICA) tests professional knowledge related to the teaching of reading. The RICA is the only Commission examination to assess candidate knowledge of content delivered as part of a Commission-approved educator preparation program. Effective October 1, 1998, most California-trained candidates for multiple subject credentials and, effective January 1, 2000, most California-trained education specialist candidates are required to pass the RICA. The RICA was revised in 2009 based on changes to the Reading/Language Arts Framework for California Public Schools, K-12 and, beginning with the August 2009 administration, covers content within the following five domains:
Domain 1: Planning, Organizing, and Managing Reading Instruction Based on Ongoing Assessment
Domain 2: Word Analysis
Domain 3: Fluency
Domain 4: Vocabulary, Academic Language, and Background Knowledge
Domain 5: Comprehension Approximately 10 percent of the revised RICA assesses competencies in Domain 1; 33 percent assesses competencies in Domain 2; 13 percent in Domain 3; 20 percent in Domain 4; and 23 percent in Domain 5. A. The RICA Written Examination The RICA Written Examination is a computer-based examination that consists of two sections: a multiple-choice section and a constructed-response section. RICA Multiple-Choice Section: This section consists of 70 multiple-choice questions: 60 “scorable” and 10 “nonscorable.” The questions include both content questions, in which knowledge about reading and reading instruction is directly assessed, and contextualized questions that assess the candidate’s ability to apply specific knowledge, to analyze specific problems, or to conduct specific tasks related to reading instruction. RICA Constructed-Response Section: The constructed-response section includes two types of items for which candidates have to write an original response. These are: 1. Focused educational problems and instructional tasks – These items present problems or tasks in educational contexts, and require candidates first to consider information about a class, a group of students, an individual student, or an instructional situation, and then to provide explanations related to or devise appropriate instructional strategies or assessment approaches for the specified student(s). Four focused educational problems and instructional tasks are included in each examination. Each problem or task assesses one or more competencies in Domains 2 through 5, with one problem or task for each domain. The problem or task for Domains 3 and 4 each requires a written response of approximately 75-125 words and those in Domains 2 and 5 each require a written response of approximately 150-300 words.
REVISED
EPC 5C-26 April 2016
2. A case study based on a student profile – For this item type, candidates receive substantial background information about a student and samples of materials illustrating the student’s reading performance. Candidates are asked to assess the student’s reading performance, describe appropriate instructional strategies, and explain why these strategies would be effective. Each examination has one case study, which includes content related to all five domains. Candidates provide a written response of approximately 300-600 words. B. The RICA Video Performance Assessment The RICA Video Performance Assessment is designed to allow the candidate to choose and submit videos of his/her best classroom work related to teaching reading. Candidates must create three “video packets,” each of which includes:
• a completed Instructional Context Form, on which the candidate provides information relevant to understanding the video recorded instruction, such as information about the students in the class/group, a lesson plan, and a description of assessment methods the candidate used to determine the appropriateness of the planned lesson;
• a ten-minute video of the candidate providing the reading instruction; and • a completed Reflection Form, in which the candidate provides an appraisal of the video-
recorded instruction, suggestions for further or alternative instructional strategies, and similar information.
One video packet must be based on whole-class instruction, one on small-group instruction, and the third on individual instruction. In addition, one videotape should demonstrate the candidate’s competencies in Domains 1 and 2, one should demonstrate the candidate’s competencies in Domains 1 and 4, and the last Domains 1 and 5. Doman 3: Fluency was not included as a separate video requirement because its content is extensively interrelated with the areas already covered by Domains 2, 4, and 5. Scoring the RICA The RICA Written Examination consists of multiple-choice and constructed-response sections, with five constructed-response items in that section. The score for the multiple-choice section is based on the number of questions candidates correctly answer with no penalty for wrong answers. On the constructed-response section, each response receives two scores from independent scorers and the sum of the two scores for a response represents that response’s raw score. The raw scores for each of the five items are then weighted. A candidate’s total score for the RICA Written Examination is the sum of the scores on the multiple-choice section and the weighted score from the constructed responses, which are then converted to a scaled score. Responses to the constructed-response items account for half of a candidate’s total score, so candidates must perform well on both the multiple-choice and constructed-response sections to pass the RICA. Each of the three Video Performance Assessment video packets is scored as a single unit, covering the candidate’s instructional context form, the videotaped instruction, and the reflection form. Each packet is evaluated by two independent scorers with no scorer reviewing more than one of the candidate’s packets. A candidate’s raw score is the sum of the six scores from the independent scorers. This raw score is then converted to a scaled score.
REVISED
EPC 5C-27 April 2016
Table 22: RICA State Passing Score Standard and Score range
Test Name State Passing Score
Standard Score Range
Written Examination (WE) 220 100-300
Video Performance Assessment (VPA) 220 100-300
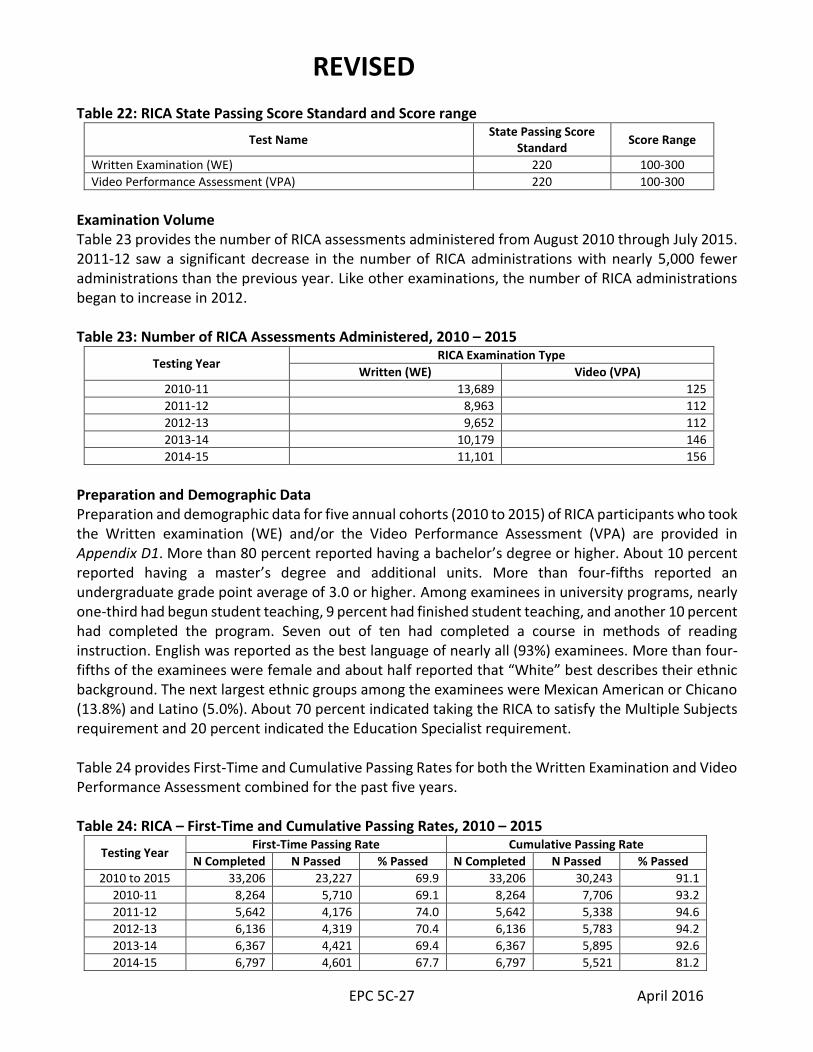
Examination Volume Table 23 provides the number of RICA assessments administered from August 2010 through July 2015. 2011-12 saw a significant decrease in the number of RICA administrations with nearly 5,000 fewer administrations than the previous year. Like other examinations, the number of RICA administrations began to increase in 2012. Table 23: Number of RICA Assessments Administered, 2010 – 2015
Testing Year RICA Examination Type
Written (WE) Video (VPA)
2010-11 13,689 125
2011-12 8,963 112
2012-13 9,652 112
2013-14 10,179 146
2014-15 11,101 156
Preparation and Demographic Data Preparation and demographic data for five annual cohorts (2010 to 2015) of RICA participants who took the Written examination (WE) and/or the Video Performance Assessment (VPA) are provided in Appendix D1. More than 80 percent reported having a bachelor’s degree or higher. About 10 percent reported having a master’s degree and additional units. More than four-fifths reported an undergraduate grade point average of 3.0 or higher. Among examinees in university programs, nearly one-third had begun student teaching, 9 percent had finished student teaching, and another 10 percent had completed the program. Seven out of ten had completed a course in methods of reading instruction. English was reported as the best language of nearly all (93%) examinees. More than four-fifths of the examinees were female and about half reported that “White” best describes their ethnic background. The next largest ethnic groups among the examinees were Mexican American or Chicano (13.8%) and Latino (5.0%). About 70 percent indicated taking the RICA to satisfy the Multiple Subjects requirement and 20 percent indicated the Education Specialist requirement. Table 24 provides First-Time and Cumulative Passing Rates for both the Written Examination and Video Performance Assessment combined for the past five years. Table 24: RICA – First-Time and Cumulative Passing Rates, 2010 – 2015
Testing Year First-Time Passing Rate Cumulative Passing Rate
N Completed N Passed % Passed N Completed N Passed % Passed
2010 to 2015 33,206 23,227 69.9 33,206 30,243 91.1
2010-11 8,264 5,710 69.1 8,264 7,706 93.2
2011-12 5,642 4,176 74.0 5,642 5,338 94.6
2012-13 6,136 4,319 70.4 6,136 5,783 94.2
2013-14 6,367 4,421 69.4 6,367 5,895 92.6
2014-15 6,797 4,601 67.7 6,797 5,521 81.2
REVISED
EPC 5C-28 April 2016
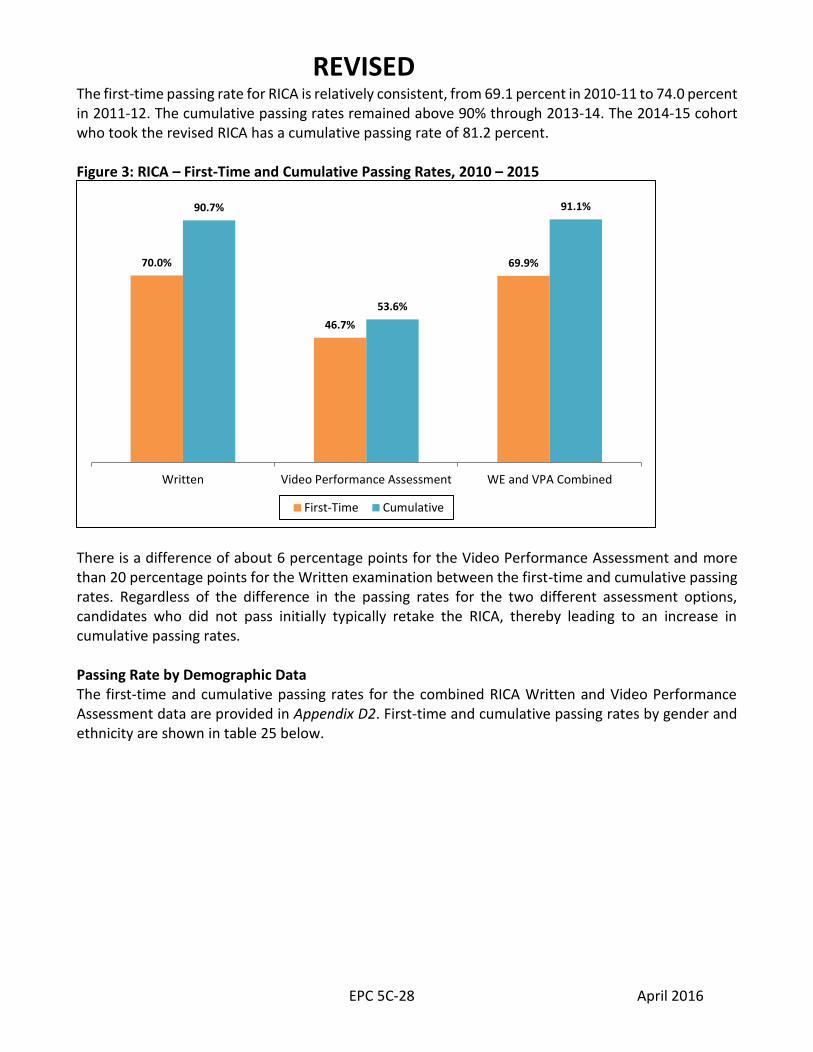
The first-time passing rate for RICA is relatively consistent, from 69.1 percent in 2010-11 to 74.0 percent in 2011-12. The cumulative passing rates remained above 90% through 2013-14. The 2014-15 cohort who took the revised RICA has a cumulative passing rate of 81.2 percent. Figure 3: RICA – First-Time and Cumulative Passing Rates, 2010 – 2015
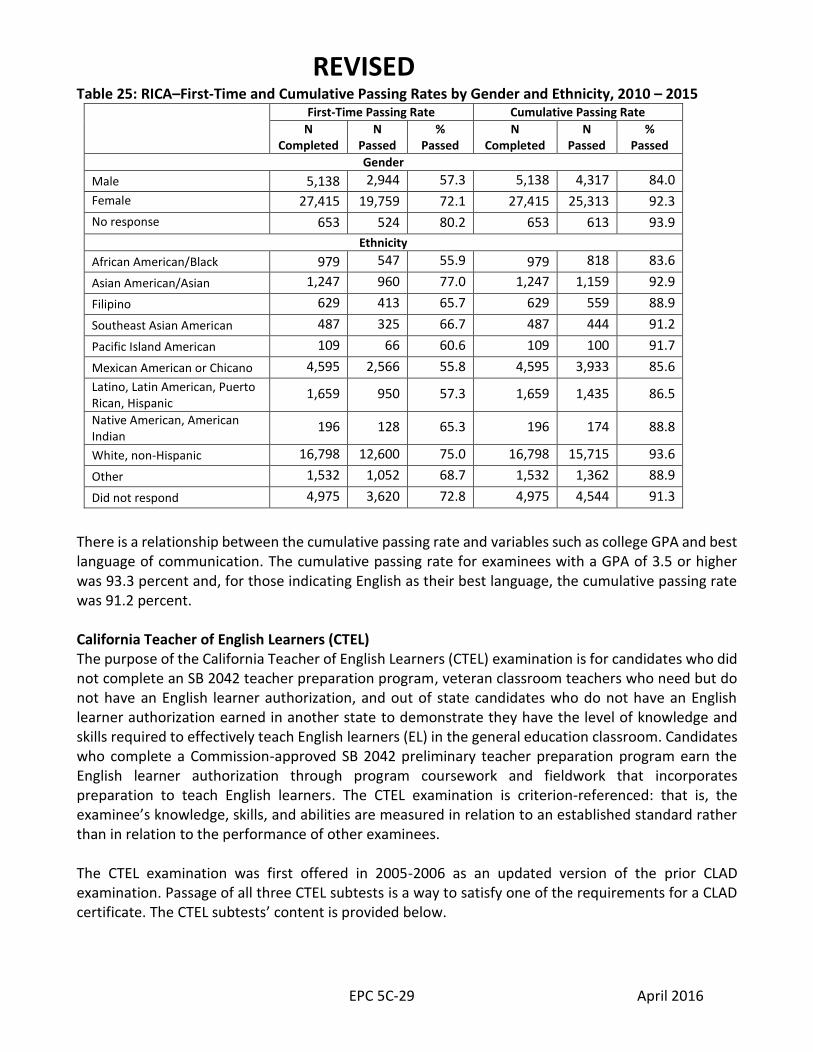
There is a difference of about 6 percentage points for the Video Performance Assessment and more than 20 percentage points for the Written examination between the first-time and cumulative passing rates. Regardless of the difference in the passing rates for the two different assessment options, candidates who did not pass initially typically retake the RICA, thereby leading to an increase in cumulative passing rates. Passing Rate by Demographic Data The first-time and cumulative passing rates for the combined RICA Written and Video Performance Assessment data are provided in Appendix D2. First-time and cumulative passing rates by gender and ethnicity are shown in table 25 below.
70.0%
46.7%
69.9%
90.7%
53.6%
91.1%
Written Video Performance Assessment WE and VPA Combined
First-Time Cumulative
REVISED
EPC 5C-29 April 2016
Table 25: RICA–First-Time and Cumulative Passing Rates by Gender and Ethnicity, 2010 – 2015
There is a relationship between the cumulative passing rate and variables such as college GPA and best language of communication. The cumulative passing rate for examinees with a GPA of 3.5 or higher was 93.3 percent and, for those indicating English as their best language, the cumulative passing rate was 91.2 percent. California Teacher of English Learners (CTEL) The purpose of the California Teacher of English Learners (CTEL) examination is for candidates who did not complete an SB 2042 teacher preparation program, veteran classroom teachers who need but do not have an English learner authorization, and out of state candidates who do not have an English learner authorization earned in another state to demonstrate they have the level of knowledge and skills required to effectively teach English learners (EL) in the general education classroom. Candidates who complete a Commission-approved SB 2042 preliminary teacher preparation program earn the English learner authorization through program coursework and fieldwork that incorporates preparation to teach English learners. The CTEL examination is criterion-referenced: that is, the examinee’s knowledge, skills, and abilities are measured in relation to an established standard rather than in relation to the performance of other examinees. The CTEL examination was first offered in 2005-2006 as an updated version of the prior CLAD examination. Passage of all three CTEL subtests is a way to satisfy one of the requirements for a CLAD certificate. The CTEL subtests’ content is provided below.
First-Time Passing Rate Cumulative Passing Rate
N Completed
N Passed
% Passed
N Completed
N Passed
% Passed
Gender
Male 5,138 2,944 57.3 5,138 4,317 84.0
Female 27,415 19,759 72.1 27,415 25,313 92.3
No response 653 524 80.2 653 613 93.9
Ethnicity
African American/Black 979 547 55.9 979 818 83.6
Asian American/Asian 1,247 960 77.0 1,247 1,159 92.9
Filipino 629 413 65.7 629 559 88.9
Southeast Asian American 487 325 66.7 487 444 91.2
Pacific Island American 109 66 60.6 109 100 91.7
Mexican American or Chicano 4,595 2,566 55.8 4,595 3,933 85.6
Latino, Latin American, Puerto Rican, Hispanic
1,659 950 57.3 1,659 1,435 86.5
Native American, American Indian
196 128 65.3 196 174 88.8
White, non-Hispanic 16,798 12,600 75.0 16,798 15,715 93.6
Other 1,532 1,052 68.7 1,532 1,362 88.9
Did not respond 4,975 3,620 72.8 4,975 4,544 91.3
REVISED
EPC 5C-30 April 2016
CTEL Subtest 1: Language and Language Development This subtest covers language structure and use and first- and second-language development and their relationship to academic achievement. This subtest is in English and consists of 50 multiple-choice questions and one essay. CTEL Subtest 2: Assessment and Instruction This subtest covers the assessment of English learners, the foundations of English language and literacy development and content instruction, and approaches and methods for English language development and content instruction. This subtest is in English and consists of 60 multiple-choice questions and two essays. CTEL Subtest 3: Culture and Inclusion This subtest covers culture and cultural diversity and their relationship to academic achievement and culturally inclusive instruction. This subtest is in English, does not focus on any specific cultural group, and has 40 multiple-choice questions and one essay.
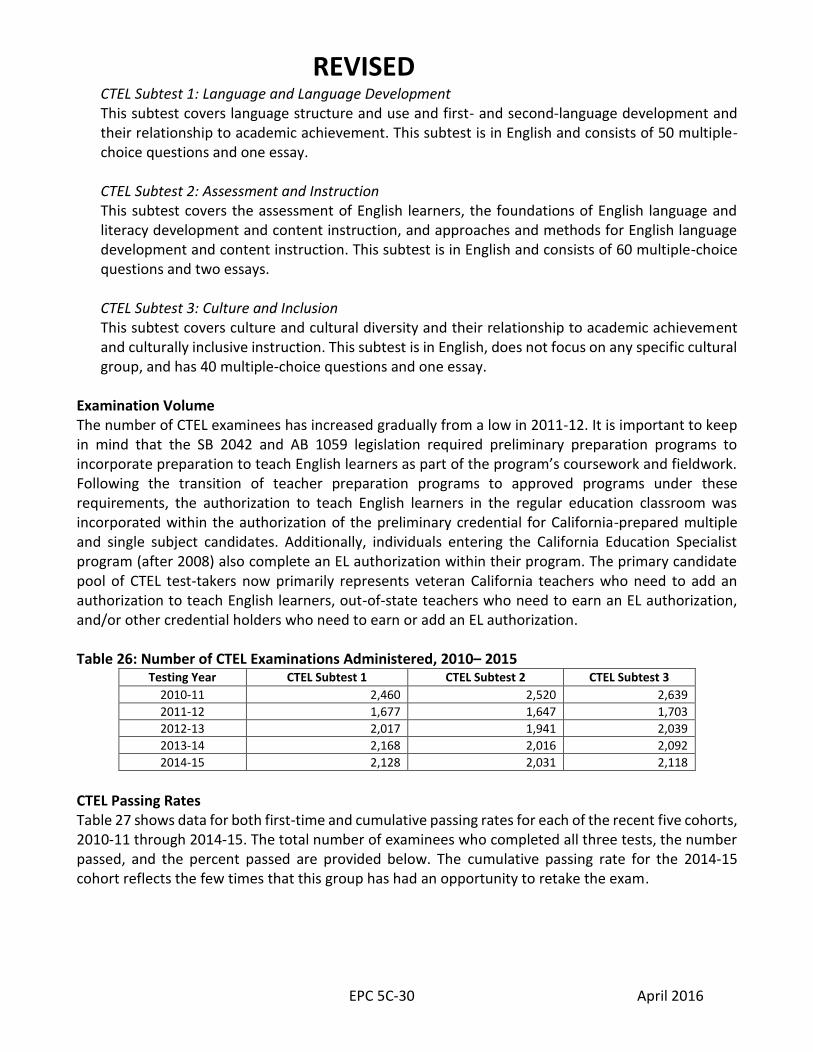
Examination Volume The number of CTEL examinees has increased gradually from a low in 2011-12. It is important to keep in mind that the SB 2042 and AB 1059 legislation required preliminary preparation programs to incorporate preparation to teach English learners as part of the program’s coursework and fieldwork. Following the transition of teacher preparation programs to approved programs under these requirements, the authorization to teach English learners in the regular education classroom was incorporated within the authorization of the preliminary credential for California-prepared multiple and single subject candidates. Additionally, individuals entering the California Education Specialist program (after 2008) also complete an EL authorization within their program. The primary candidate pool of CTEL test-takers now primarily represents veteran California teachers who need to add an authorization to teach English learners, out-of-state teachers who need to earn an EL authorization, and/or other credential holders who need to earn or add an EL authorization. Table 26: Number of CTEL Examinations Administered, 2010– 2015
Testing Year CTEL Subtest 1 CTEL Subtest 2 CTEL Subtest 3
2010-11 2,460 2,520 2,639
2011-12 1,677 1,647 1,703
2012-13 2,017 1,941 2,039
2013-14 2,168 2,016 2,092
2014-15 2,128 2,031 2,118
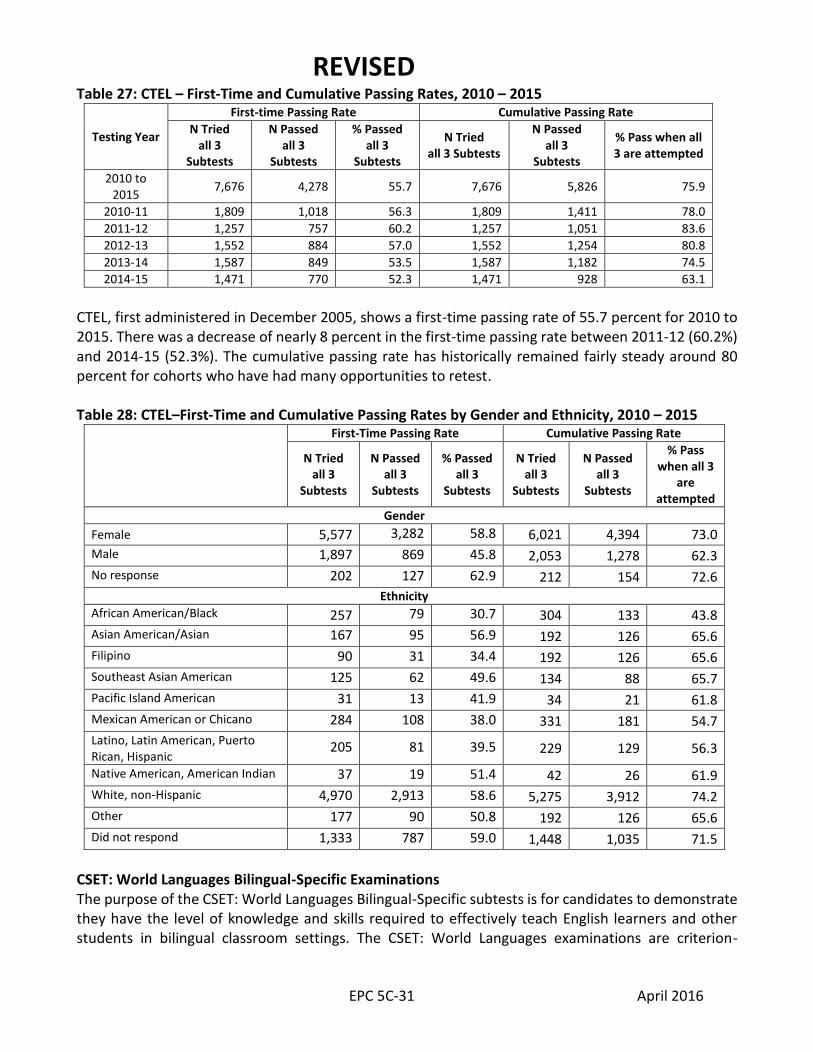
CTEL Passing Rates Table 27 shows data for both first-time and cumulative passing rates for each of the recent five cohorts, 2010-11 through 2014-15. The total number of examinees who completed all three tests, the number passed, and the percent passed are provided below. The cumulative passing rate for the 2014-15 cohort reflects the few times that this group has had an opportunity to retake the exam.
REVISED
EPC 5C-31 April 2016
Table 27: CTEL – First-Time and Cumulative Passing Rates, 2010 – 2015
Testing Year
First-time Passing Rate Cumulative Passing Rate
N Tried all 3
Subtests
N Passed all 3
Subtests
% Passed all 3
Subtests
N Tried all 3 Subtests
N Passed all 3
Subtests
% Pass when all 3 are attempted
2010 to 2015
7,676 4,278 55.7 7,676 5,826 75.9
2010-11 1,809 1,018 56.3 1,809 1,411 78.0
2011-12 1,257 757 60.2 1,257 1,051 83.6
2012-13 1,552 884 57.0 1,552 1,254 80.8
2013-14 1,587 849 53.5 1,587 1,182 74.5
2014-15 1,471 770 52.3 1,471 928 63.1
CTEL, first administered in December 2005, shows a first-time passing rate of 55.7 percent for 2010 to 2015. There was a decrease of nearly 8 percent in the first-time passing rate between 2011-12 (60.2%) and 2014-15 (52.3%). The cumulative passing rate has historically remained fairly steady around 80 percent for cohorts who have had many opportunities to retest. Table 28: CTEL–First-Time and Cumulative Passing Rates by Gender and Ethnicity, 2010 – 2015
First-Time Passing Rate Cumulative Passing Rate
N Tried all 3
Subtests
N Passed all 3
Subtests
% Passed all 3
Subtests
N Tried all 3
Subtests
N Passed all 3
Subtests
% Pass when all 3
are attempted
Gender
Female 5,577 3,282 58.8 6,021 4,394 73.0
Male 1,897 869 45.8 2,053 1,278 62.3
No response 202 127 62.9 212 154 72.6
Ethnicity
African American/Black 257 79 30.7 304 133 43.8
Asian American/Asian 167 95 56.9 192 126 65.6
Filipino 90 31 34.4 192 126 65.6
Southeast Asian American 125 62 49.6 134 88 65.7
Pacific Island American 31 13 41.9 34 21 61.8
Mexican American or Chicano 284 108 38.0 331 181 54.7
Latino, Latin American, Puerto Rican, Hispanic
205 81 39.5 229 129 56.3
Native American, American Indian 37 19 51.4 42 26 61.9
White, non-Hispanic 4,970 2,913 58.6 5,275 3,912 74.2
Other 177 90 50.8 192 126 65.6
Did not respond 1,333 787 59.0 1,448 1,035 71.5
CSET: World Languages Bilingual-Specific Examinations The purpose of the CSET: World Languages Bilingual-Specific subtests is for candidates to demonstrate they have the level of knowledge and skills required to effectively teach English learners and other students in bilingual classroom settings. The CSET: World Languages examinations are criterion-
REVISED
EPC 5C-32 April 2016
referenced: that is, the examinee’s knowledge, skills, and abilities are measured in relation to an established standard rather than in relation to the performance of other examinees. In 2007, the CSET: World Languages Bilingual-Specific examination series updated and replaced the three former BCLAD subtests, and the former CLAD and BCLAD examinations were discontinued as separate entities. Passage of the two CSET: World Languages Bilingual-Specific subtests plus the CSET: World Language target language proficiency skills subtest is one way to satisfy the bilingual portion of the requirements for a Bilingual Authorization. An individual also needs an English learner authorization as well as an appropriate prerequisite credential as part of the requirements for a bilingual authorization. The information below describes the content of the CSET: World Languages subtests which incorporate the former BCLAD examination content. Examinations are available for Arabic, Armenian, Cantonese, Farsi, Filipino, French, German, Hmong, Japanese, Khmer, Korean, Mandarin, Punjabi, Russian, Spanish, and Vietnamese.
CSET: World Languages: Subtest III (or Subtest II, for low incidence languages): Listening Comprehension, Reading Comprehension, Written Expression, and Oral Expression There are multiple versions of this subtest, each focusing on a specific language. Each version consists of four separate components: listening, speaking, reading, and writing the target language. This subtest is used by all candidates for a single subject World Language credential as well as by candidates for a bilingual credential to ensure that all candidates using a language other than English for instructional purposes meet the same standards of language proficiency as established by the Commission. The specific number of multiple-choice items and constructed-response items may vary across languages. For the Listening component, examinees listen to oral language samples and answer questions; for the Reading component, examinees read passages written in the target language and respond to questions; for the Speaking component, candidates respond orally in the target language to speaking assignment prompts; and for the Writing component, examinee write responses in the target language to specific writing prompts.
Note: For the less commonly taught languages of Hebrew, Hindi, Italian, and Portuguese, candidates must pass the alternative language assessment approved by the Commission for this purpose.
CSET: World Languages: Subtest IV: Bilingual Education and Bilingualism; Intercultural Communication; and Instruction and Assessment This test covers foundations of bilingual education; bilingualism and biliteracy; intercultural communication and culturally inclusive instruction; school, home, and community collaboration; language and literacy instruction and assessment in bilingual education settings; content instruction and assessment in bilingual education settings; and evaluation, use, and augmentation of materials in bilingual education settings. Subtest 4 is in English, does not focus on any specific language, and consists of 50 multiple-choice questions.
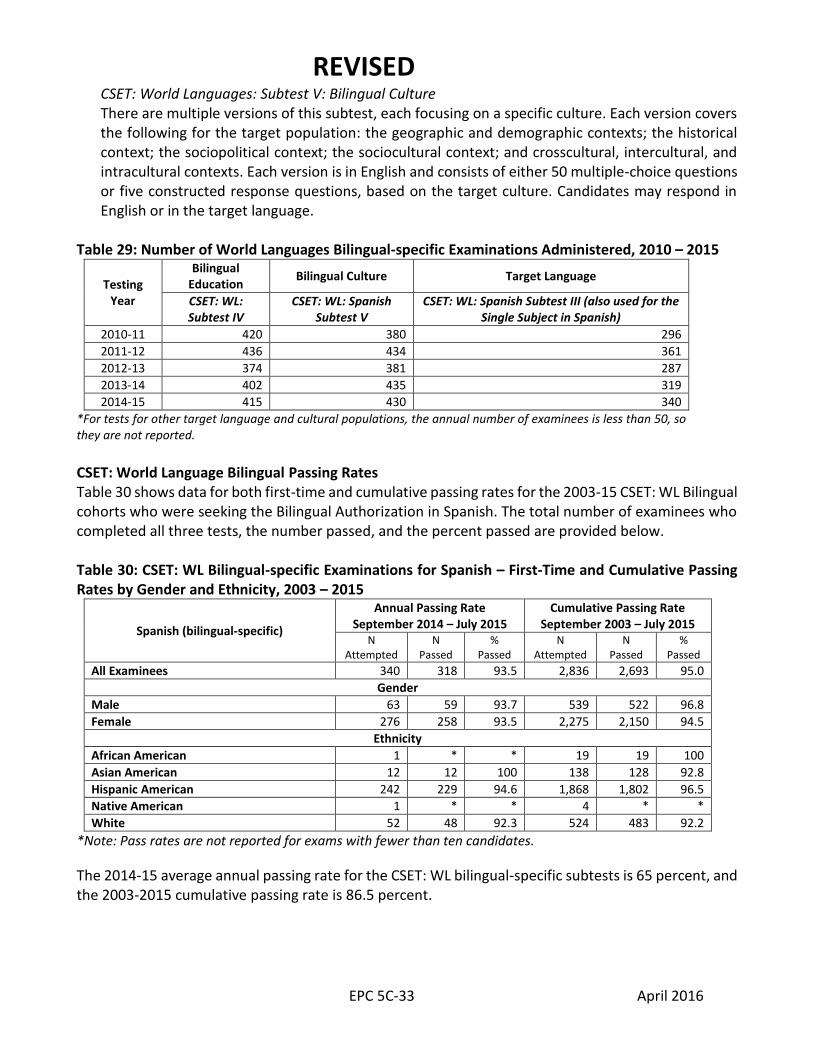
REVISED
EPC 5C-33 April 2016
CSET: World Languages: Subtest V: Bilingual Culture There are multiple versions of this subtest, each focusing on a specific culture. Each version covers the following for the target population: the geographic and demographic contexts; the historical context; the sociopolitical context; the sociocultural context; and crosscultural, intercultural, and intracultural contexts. Each version is in English and consists of either 50 multiple-choice questions or five constructed response questions, based on the target culture. Candidates may respond in English or in the target language.
Table 29: Number of World Languages Bilingual-specific Examinations Administered, 2010 – 2015
Testing Year
Bilingual Education
Bilingual Culture Target Language
CSET: WL: Subtest IV
CSET: WL: Spanish Subtest V
CSET: WL: Spanish Subtest III (also used for the Single Subject in Spanish)
2010-11 420 380 296
2011-12 436 434 361
2012-13 374 381 287
2013-14 402 435 319
2014-15 415 430 340
*For tests for other target language and cultural populations, the annual number of examinees is less than 50, so they are not reported.
CSET: World Language Bilingual Passing Rates Table 30 shows data for both first-time and cumulative passing rates for the 2003-15 CSET: WL Bilingual cohorts who were seeking the Bilingual Authorization in Spanish. The total number of examinees who completed all three tests, the number passed, and the percent passed are provided below. Table 30: CSET: WL Bilingual-specific Examinations for Spanish – First-Time and Cumulative Passing Rates by Gender and Ethnicity, 2003 – 2015
Spanish (bilingual-specific)
Annual Passing Rate September 2014 – July 2015
Cumulative Passing Rate September 2003 – July 2015
N Attempted
N Passed
% Passed
N Attempted
N Passed
% Passed
All Examinees 340 318 93.5 2,836 2,693 95.0
Gender
Male 63 59 93.7 539 522 96.8
Female 276 258 93.5 2,275 2,150 94.5
Ethnicity
African American 1 * * 19 19 100
Asian American 12 12 100 138 128 92.8
Hispanic American 242 229 94.6 1,868 1,802 96.5
Native American 1 * * 4 * *
White 52 48 92.3 524 483 92.2
*Note: Pass rates are not reported for exams with fewer than ten candidates.
The 2014-15 average annual passing rate for the CSET: WL bilingual-specific subtests is 65 percent, and the 2003-2015 cumulative passing rate is 86.5 percent.
REVISED
EPC 5C-34 April 2016
California Preliminary Administrative Credential Examination (CPACE) From 2002-2011 the School Leaders Licensure Assessment (SLLA) was used as the Commission- adopted exam option for a preliminary administrative services credential. In 2008, the Commission approved the development of a California-specific examination to replace the SLLA for this purpose, and in 2011 the Commission-owned CPACE replaced the SLLA. The purpose of the California Preliminary Administrative Credential Examination (CPACE) is to measure whether entry-level principals and other school administrators have the standards-relevant knowledge necessary for competent professional practice. The CPACE was first developed during 2010-11 and the initial CPACE administration was held in June 2011. At the February 2014 Commission meeting, the Commission authorized updating the CPACE to include a more performance-based approach to measuring the skills necessary for performing the job of a school site principal. At its August 2015 meeting the Commission adopted a new passing score standard for the updated CPACE. CPACE is administered during four windows annually in February, June, July and October. The set of administrator knowledge and skills described in the CPACE Content Specifications and reflected in the CPACE is organized into the following four domains:
Domain I: Visionary and Inclusive Leadership Domain II: Student Learning Domain III: Systems for Capacity Building Domain IV: Resource Management and Educational Law
To pass the CPACE, an examinee must pass two components or subtests. For the original CPACE (2011-2014), examinees needed to pass both the CPACE-Written and the CPACE-Video. For the updated CPACE (2015), examinees need to pass both the CPACE – Content Examination and the CPACE – Performance Assessment. CPACE scores are reported on a standard range of 100-300, with the scaled score of 220 representing the minimum passing score as determined by the Commission. Tables 31 and 32 below show annual and cumulative passing rates for the previous version of CPACE (2011-2014). Table 31: CPACE (2011-2014) Annual Passing Rates August 2014 to February 2015
CPACE Written CPACE Video Total CPACE
N Completed
N Passed
% Passed
N Completed
N Passed
% Passed N
Completed N
Passed % Passed
1,667 308 18.5 1,032 814 78.9 1,022 246 24.1
Table 32: CPACE (2011-2014) Cumulative Passing Rates (Life of Exam) June 2011 to February 2015
CPACE Written CPACE Video Total CPACE
N Completed
N Passed
% Passed
N Completed
N Passed
% Passed N
Completed N
Passed % Passed
4,489 1,458 32.5 3,404 2,846 83.6 3,349 1,351 40.3
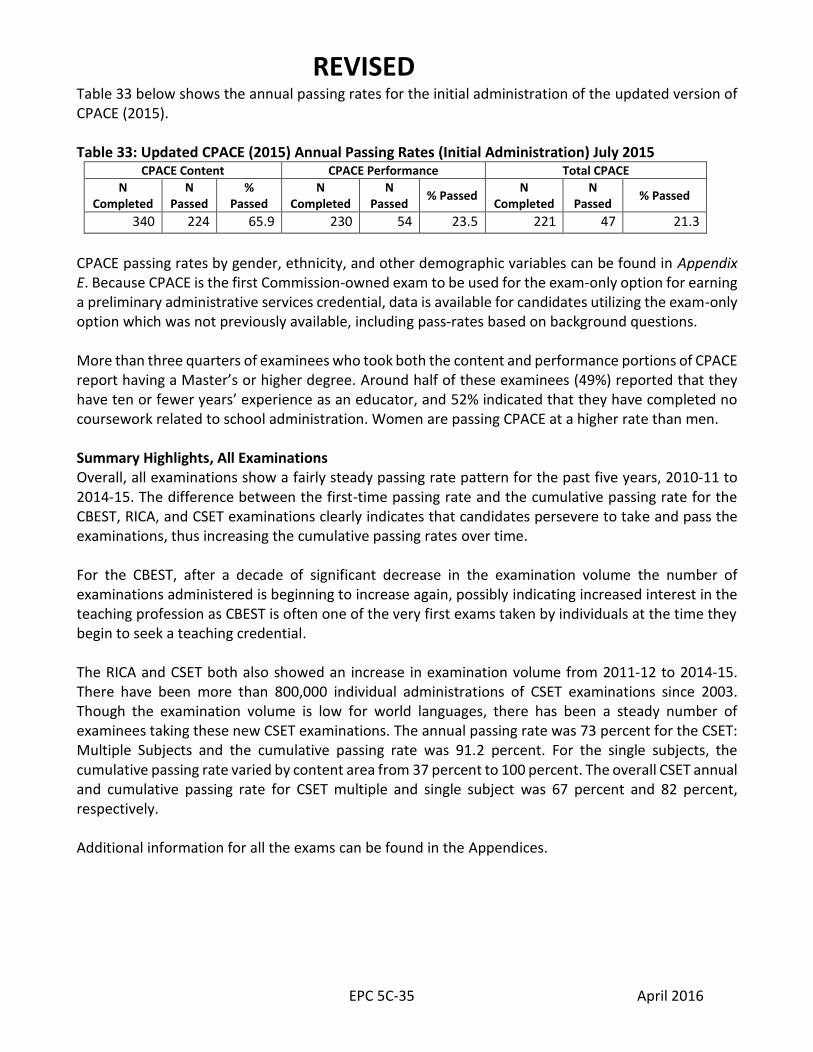
REVISED
EPC 5C-35 April 2016
Table 33 below shows the annual passing rates for the initial administration of the updated version of CPACE (2015). Table 33: Updated CPACE (2015) Annual Passing Rates (Initial Administration) July 2015
CPACE Content CPACE Performance Total CPACE
N Completed
N Passed
% Passed
N Completed
N Passed
% Passed N
Completed N
Passed % Passed
340 224 65.9 230 54 23.5 221 47 21.3
CPACE passing rates by gender, ethnicity, and other demographic variables can be found in Appendix E. Because CPACE is the first Commission-owned exam to be used for the exam-only option for earning a preliminary administrative services credential, data is available for candidates utilizing the exam-only option which was not previously available, including pass-rates based on background questions. More than three quarters of examinees who took both the content and performance portions of CPACE report having a Master’s or higher degree. Around half of these examinees (49%) reported that they have ten or fewer years’ experience as an educator, and 52% indicated that they have completed no coursework related to school administration. Women are passing CPACE at a higher rate than men. Summary Highlights, All Examinations Overall, all examinations show a fairly steady passing rate pattern for the past five years, 2010-11 to 2014-15. The difference between the first-time passing rate and the cumulative passing rate for the CBEST, RICA, and CSET examinations clearly indicates that candidates persevere to take and pass the examinations, thus increasing the cumulative passing rates over time. For the CBEST, after a decade of significant decrease in the examination volume the number of examinations administered is beginning to increase again, possibly indicating increased interest in the teaching profession as CBEST is often one of the very first exams taken by individuals at the time they begin to seek a teaching credential. The RICA and CSET both also showed an increase in examination volume from 2011-12 to 2014-15. There have been more than 800,000 individual administrations of CSET examinations since 2003. Though the examination volume is low for world languages, there has been a steady number of examinees taking these new CSET examinations. The annual passing rate was 73 percent for the CSET: Multiple Subjects and the cumulative passing rate was 91.2 percent. For the single subjects, the cumulative passing rate varied by content area from 37 percent to 100 percent. The overall CSET annual and cumulative passing rate for CSET multiple and single subject was 67 percent and 82 percent, respectively. Additional information for all the exams can be found in the Appendices.