Embed Size (px)
Citation preview
©2008 Nalco Company • All Rights Reserved
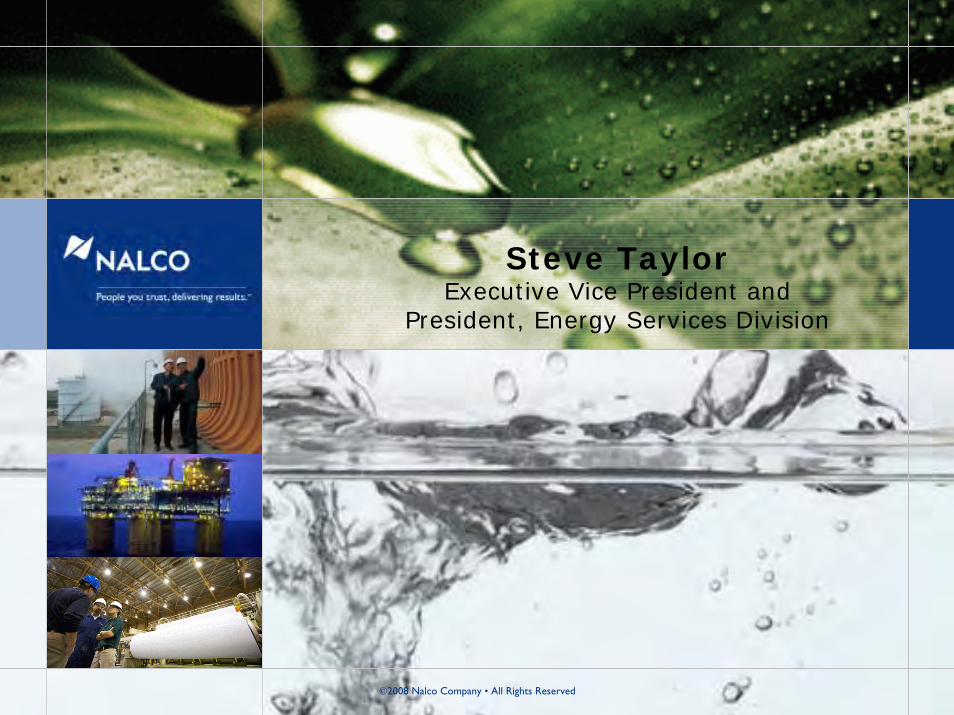
Steve TaylorExecutive Vice President and
President, Energy Services Division

1
Forward-Looking Statements and Regulation G
This presentation includes “forward-looking statements” within the meaning of Section 27A of the Securities Act of 1933 and Section 21E of the Securities Exchange Act of 1934. These forward-looking statements include statements concerning our plans, objectives, goals, strategies, future events, future revenue or performance, capital expenditures, financing needs, plans or intentions relating to acquisitions, business trends and other information that is not historical information. When used in this presentation, the words “estimates,” “expects,” “anticipates,” “projects,” “plans,” “intends,” “believes,” “forecasts,” or future or conditional verbs, such as “will,” “should,” “could” or “may,” and variations of such words or similar expressions are intended to identify forward-looking statements. All forward-looking statements, including, without limitation, management’s examination of historical operating trends and data are based upon our current expectations and various assumptions. Our expectations, beliefs and projections are expressed in good faith and we believe there is a reasonable basis for them. However, there can be no assurance that management’s expectations, beliefs and projections will be achieved.
There are a number of risks and uncertainties that could cause our actual results to differ materially from the forward-looking statements contained in this presentation. Important factors that could cause our actual results to differ materially from the forward-looking statements we make in this presentation. Such risks, uncertainties and other important factors include, among others: our leverage; limitations on flexibility in operating our business contained in our debt agreements; increases in interest rates as a result of our variable rate indebtedness; pricing pressure from our customers; technological change and innovation; risks associated with our non-U.S. operations; fluctuations in currency exchange rates; high competition in the markets in which we operate; adverse changes to environmental, health and safety regulations; operating hazards in our production facilities; inability to achieve expected cost savings; difficulties in securing or changes in the pricing of the raw materials we use; our significant pension benefit obligations and the current underfunding of our pension plans; our ability to realize the full value of our intangible assets; our ability to attract and retain skilled employees, particularly research scientists, technical sales professionals and engineers; and our ability to protect our intellectual property rights. There may be other factors that may cause our actual results to differ materially from the forward-looking statements.
All forward-looking statements attributable to us or persons acting on our behalf apply only as of the date of this presentation and are expressly qualified in their entirety by the cautionary statements included in this presentation. We undertake no obligation to update or revise forward-looking statements which may be made to reflect events or circumstances that arise after the date made or to reflect the occurrence of unanticipated events.
Non-GAAP measures may be discussed in today’s presentation. Management believes that discussion of these measures provides investors with additional insight into the ongoing operations of Nalco Holding Company. Non-GAAP measures are reconciled to the closest GAAP measure in schedules attached to our earnings releases, which may be found at www.nalco.com. Adjusted EBITDA is a non-GAAP measure used to determine compliance with the Company’s debt covenants. Free Cash Flow is defined as Cash from Operations less Capital Expenditures and Minority Interest charges. In addition, Nalco may discuss sales growth in terms of nominal (actual), organic (nominal less foreign currency and acquisition/divestiture/merger/joint venture impacts), and real (organic growth less that portion of the growth which consists of price increases that simply pass along higher raw and purchased material costs). The non-GAAP measures should not be viewed as an alternative to GAAP measures of performance. Furthermore, these measures may not be consistent with similar measures provided by other companies.

2
Investment Highlights
Leading Market Positions
Integrated, Innovative Technology, Sales and Service Model
Unmatched Global Presence
Significant Top-line Growth Potential
World Class Selling and Service Team
Strong, Growing Free Cash Flows
Continued Cost Saving Opportunities
Deep Management Team
Financial Targets:6-8% Real Revenue Growth by 2011
EBITDA Growth Targets:
2009 – Environment DependentMid-term – High single digits Longer-term – Double-digits
Significant EPS Growth
Financial Targets:6-8% Real Revenue Growth by 2011
EBITDA Growth Targets:
2009 – Environment DependentMid-term – High single digits Longer-term – Double-digits
Significant EPS Growth
Nalco is a Service Company with:

3
Success Driven by Annuity-like Service Model
Propriety and non-
proprietary chemistry, equipment,
services, and software
frequently used in
solutions
Sources of Value
• Energy savings• Water savings, recycling & quality• Increased capacity utilization• Asset reliability and preservation• Product quality gains• Improved environment, safety and health performance
Dynamic materials - water, oil, pulp, minerals and air –create performance variability for customers.
Additional performance variability created when customers change processes and/or people in operations.
Nalco brings material and operational
expertise to the site through
sales engineers, service
technicians and research experts

4
A Service Company
Cooling water treatment– Scale control, microbial fouling,
corrosion controlBoiling water treatment– Pre-treatment, condensate
control, internal treatmentRaw and wastewater treatmentMining and mineral process aidsOther water- and air-based process applicationsAir emission control and combustion efficiency
$7.4 billion global market(1)(2)
#1 Market Position
18% Market Share(3)
$1,506 million $777 million$1,813 million
Industrial & Industrial & Institutional ServicesInstitutional Services
2007Market
Positions
Products andServices
2008 NetSales(4)
Flow assuranceOil/water separationHeavy crude desaltingMonomer inhibitorsAnti-oxidantsFuel and lubricant additivesBoiler, cooling water, raw water and wastewater applicationsCombustion efficiency and air emission control
$3.9 billion global market(2)
#1 Market Position
32% Market Share
Paper ServicesPaper Services
Digester AdditivesDefoamers & Wash AidsDe-Inking ChemicalsFelt CleanersCoating AdditivesBoiler, cooling water, raw water and wastewater applicationsCombustion efficiency and air emission control
$8.5 billion global market(2)
#3 Market Position
9% Market Share
Energy ServicesEnergy Services
Limited economic sensitivity(1) Represents water treatment and services markets, which accounted for 73% of I&IS net sales in 2007,exclusive of synfuel business that does not recur in 2008.
(2) Approximate market size based on internal estimates and industry publications and surveys.(3) Market share data factors in appropriate allocation of sales shown in Other segment.(4) Divisional net sales exclude $116 million of sales allocated to the “Other” segment.

5
More than Twice the Size of Nearest Competitor
Nalco has a sizable scale advantage across the $19.8 billion water and water-related services and chemicals market space*
* Note: Uses 2007 sales and market size data in share chart. Excludes equipment, municipal, and process chemical and service sales in the I&IS and Other segment, which collectively were more than $540 million in sales for Nalco in 2007. Includes relevant sales reported in our Other segment. Reflects management estimates of 2007 sales in relevant competing markets, based on published data and management estimates. BASF agreement to acquire Ciba is pending.
17.0%
6.8%
6.2%
4.9%
4.4%
1.7%
1.9%3.3%
1.7%1.4%1.3%1.2%
48.1%
Nalco
Ashland/Hercules
Baker Petrolite
GE Water
Ciba
Kemira
Kurita
Champion
Buckman
EKA
BASF
Danaher (Chemtreat)
All Other

6
Growing Revenue and EBITDA
Nalco is a consistently growing performer with a service-annuity model
$2,430
$3,033
$1,574$1,434$1,304
$1,215$1,247$1,292$1,287$1,164
$1,013$899$843$738
$2,367
$2,767$2,644$2,620
$0
$500
$1,000
$1,500
$2,000
$2,500
$3,000
1987 1988 1989 1990 1991 1992 1993 1994 1995 1996 1997 1998 1999 2000 2001 2002 2003 2004
$161 $176 $195$227
$264$306 $306 $289 $290 $312
$346 $342
$433$466 $458
$517 $528$585
19.1%19.6%17.5%19.2%
18.3%
21.8% 20.9% 21.7% 22.4% 22.6% 23.8% 23.7% 23.2% 23.9% 23.9% 24.1%21.7%
$0
$100
$200
$300
$400
$500
$600
1987 1988 1989 1990 1991 1992 1993 1994 1995 1996 1997 1998 1999 2000 2001 2002 2003
0%
5%
10%
15%
20%
25%
30%
Revenue
Suez acquired Nalco and merged Nalco with Calgon and Aquazur in 1999
Adjusted EBITDA and EBITDA Margins
Note: 1987- ‘98 based on Nalco Chemical Co. public filings. 1999 and 2000 based on unaudited Suez reported results.2003 data excludes $30 million in pro forma cost savings
2004
19.3%
2005
$3,312
$603
18.2%
+11% +3%
+9%+10%
Private equity purchase of Nalco $3,603
+9%
2006
2005 2006
$680
18.9%
+13%
$3,912
+9%
2007
2007
$730
18.7%
+7%
$4,212
+8%
2008
2008
$732
17.4%
Up 3.7% excl. synfuels
7
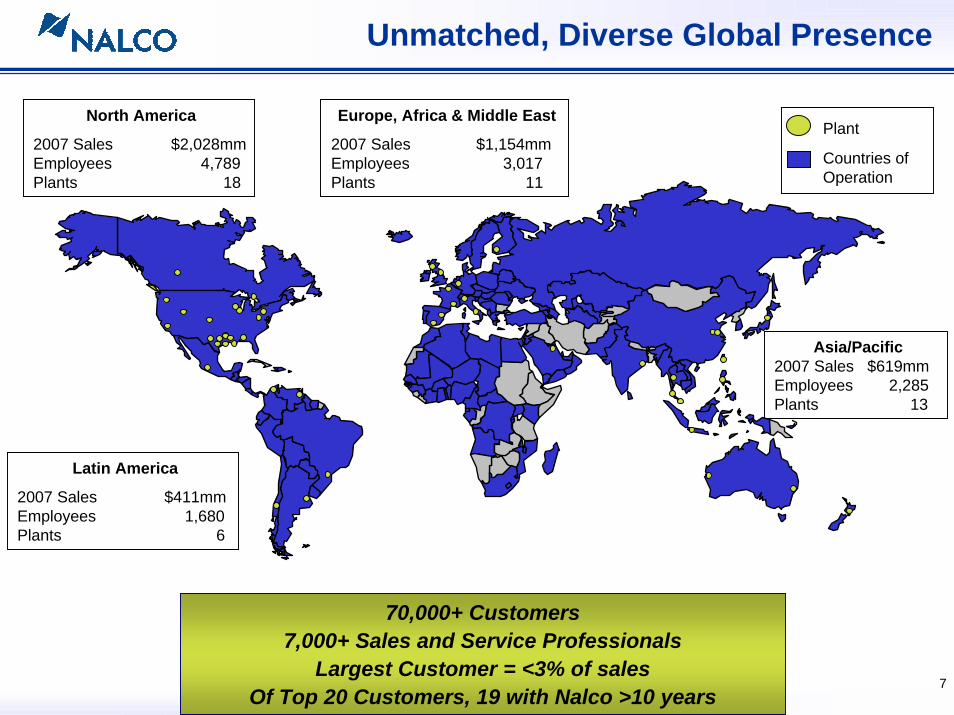
Unmatched, Diverse Global Presence
Latin America
2007 Sales $411mmEmployees 1,680Plants 6
North America
2007 Sales $2,028mmEmployees 4,789Plants 18
Europe, Africa & Middle East
2007 Sales $1,154mmEmployees 3,017Plants 11
Asia/Pacific2007 Sales $619mmEmployees 2,285Plants 13
Countries of Operation
Plant
70,000+ Customers7,000+ Sales and Service Professionals
Largest Customer = <3% of salesOf Top 20 Customers, 19 with Nalco >10 years

8
Integrated Technology and Service Approach
Implement existing solutions• 6,000+ sales engineers and service technicians • 2000+ patents• R&D and industry expert support• Follow Six Service Standards
Create new solutions• 500 researchers• >200 PhDs• Increasingly focused on breakthrough developments•Partner with customers
Formal training• 50% or more of first year• Accelerated universities set for rapid-growth industries and geographies•District Managers average 15 years Nalco experience
Focus on source of value for customer
Informal training –• Local sales teams -- average 9 years experience in U.S.• Industry technical consultants• Expertise Centers• Knowledge Management System
Energy Savings
Water Savings
Product quality
gains
Improved Safety,
Health and Environment Performance
Reduced Operating
Costs
Asset Preservation & Reliability
Compliance Savings

9
Sustain Base Real Growth 3-4%
Strengthen Key Geographies– BRIC+ 2%+ – EAME .5%+
New Technology Platforms/Businessmodels: (Water, Energy, Air)– Water Automation Build-Out .5%+ – Enhanced Oil Recovery .3%+– Nalco Mobotec .5%+– M&A .5%+
Total Added Growth Potential 4%+
Expected Real Growth by 2011 6-8%
Growth Drivers
2008 Progress>20% Nominal1.7% Organic
40% unit growthNew platform>75% growth4 small deals
* Real growth is defined as organic growth less the impact of sizable cost-driven price swings. Organic growth excludes FX and M&A impacts.

10
Five Priorities in 2009
1. Improve Safety
2. Gain Step Change in Productivity
3. Generate Focused, Profitable Growth
4. Improve Cash Flows
5. Strengthen Future through improvements in customer service, technology pipeline, employee engagement and brand
Great success in 2008 against priorities we established, but need greater emphasis on productivity and cash flows going forward.

11
Key Changes in Emphasis for 2009
2009 efforts balance productivity and focused growth. Key changes:
Headcount Control – Will continue to add in high-growth markets, but additions will be entirely through redeployment. Net reductions in 2009.Productivity/Cost Savings – Expect to at least meet $100MM cost savings target in 2009. Five-year average savings at $84MM annually.Pricing – Despite positive gains in Q4, 2008 ended with price increases of $159MM trailing $170MM in product and freight cost hikes. Need to hold price as costs drop and begin to restore margin. Cash Flow – Will reverse substantial 2008 inventory build in 2009. Emphasis placed on not becoming bank to our customers through receivables. Working capital expected to be meaningful cash source.Deleveraging – Expect optional deleveraging ahead of late 2010 refinancing efforts.
12
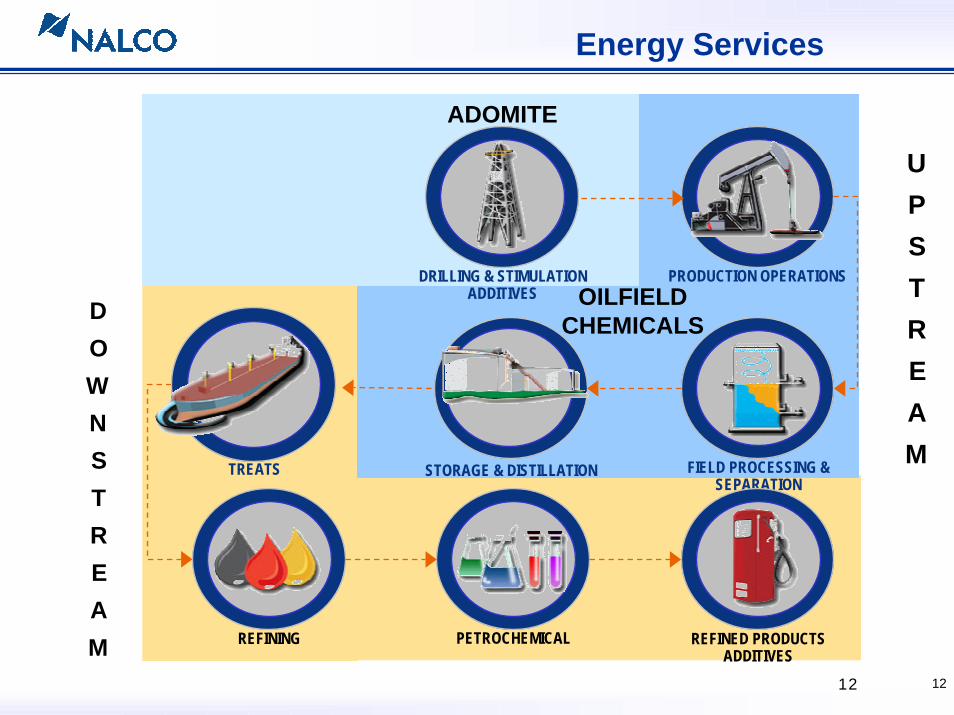
Energy Services
Long Distance Transportation
ADOMITE
DRILLING & STIMULATIONADDITIVES
PRODUCTION OPERATIONS
FIELD PROCESSING &SEPARATION
REFINING PETROCHEMICAL REFINED PRODUCTSADDITIVES
STORAGE & DISTILLATION
U
P
S
T
R
E
A
MTREATS
OILFIELDCHEMICALSD
O
W
N
S
T
R
E
A
M12

13
Downstream
0 20 40 60 80 100
China
India
Korea
Taiwan
MidEast
Other
New Downstream Capacity
• New Technology- Metal removal- Green retarder
• Advanced Automation- 3D TRASAR® Technology for
Cooling Water- 3D TRASAR Technology for Boilers- Opportunity crude treatment
• Focus on Growth Geographies• Middle East – 75% win rate in ‘08• Asia/Pacific – 50% win rate in ‘08
• Expand Sales Bandwidth- Wastewater- Additional process offerings- Treats
• Opportunity Crudes13
14
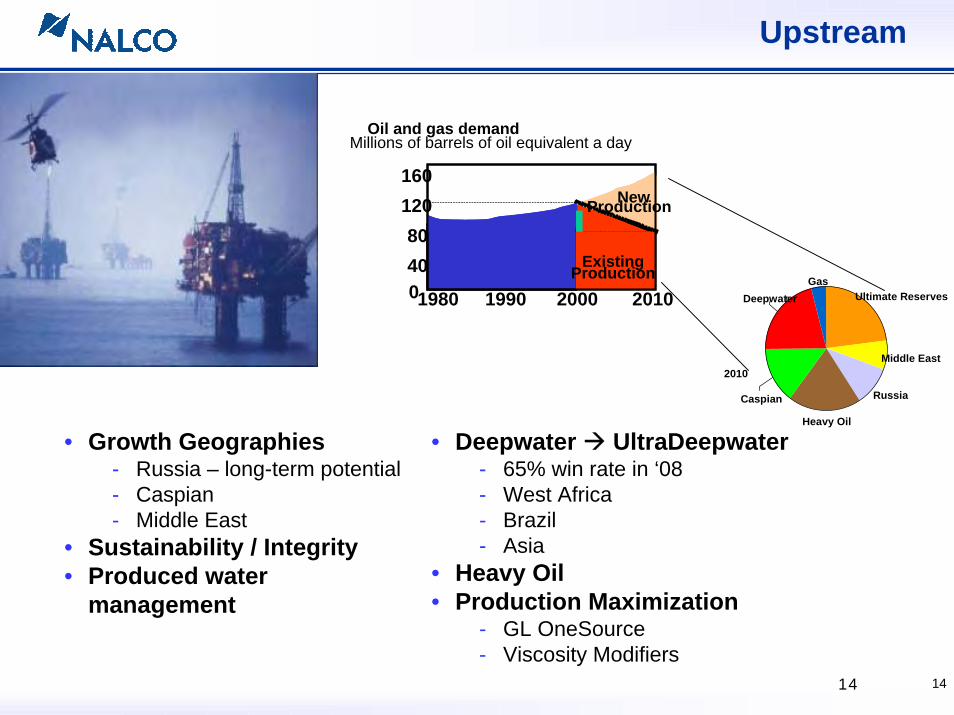
Upstream
Ultimate Reserves
Middle East
Russia
Heavy Oil
GasDeepwaterr
Caspian
2010
• Growth Geographies- Russia – long-term potential- Caspian- Middle East
• Sustainability / Integrity• Produced water
management
• Deepwater UltraDeepwater- 65% win rate in ‘08- West Africa- Brazil- Asia
• Heavy Oil• Production Maximization
- GL OneSource- Viscosity Modifiers
Oil and gas demandMillions of barrels of oil equivalent a day
0Existing
New
4080
120160
1980 1990 2000 2010
ExistingProduction
NewProduction
14
15
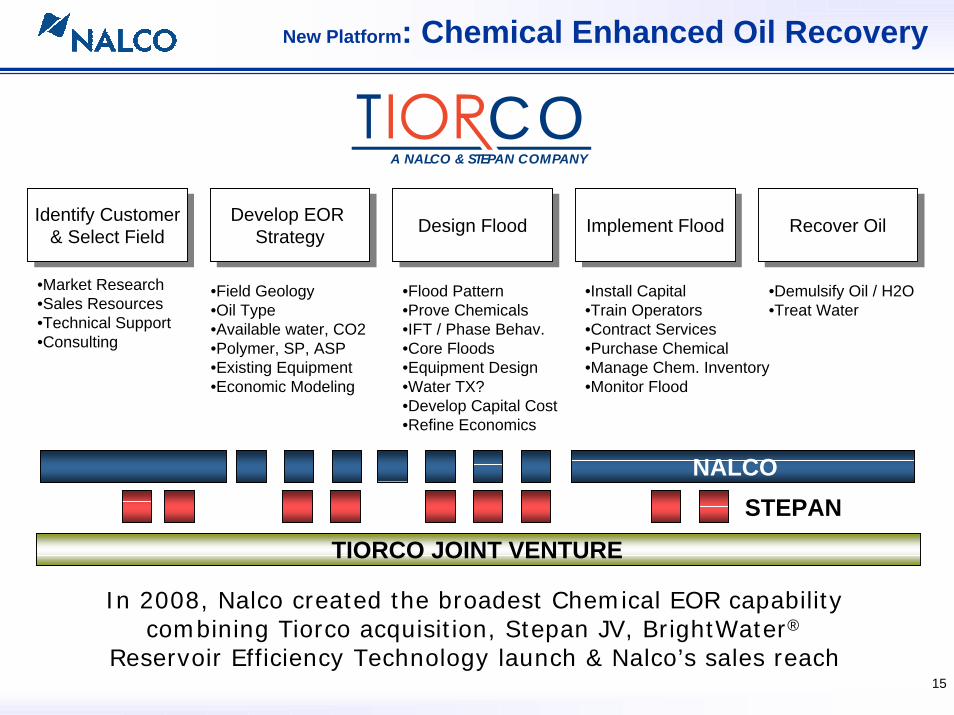
Develop EOR Strategy
Develop EOR Strategy Implement FloodImplement FloodDesign FloodDesign Flood Recover OilRecover OilIdentify Customer
& Select FieldIdentify Customer
& Select Field
•Field Geology•Oil Type•Available water, CO2•Polymer, SP, ASP•Existing Equipment•Economic Modeling
•Flood Pattern•Prove Chemicals•IFT / Phase Behav.•Core Floods•Equipment Design•Water TX?•Develop Capital Cost•Refine Economics
•Install Capital•Train Operators•Contract Services•Purchase Chemical•Manage Chem. Inventory•Monitor Flood
•Demulsify Oil / H2O•Treat Water
•Market Research•Sales Resources•Technical Support•Consulting
COA NALCO & STEPAN COMPANY
New Platform: Chemical Enhanced Oil Recovery
NALCOSTEPAN
TIORCO JOINT VENTURE
In 2008, Nalco created the broadest Chemical EOR capability combining Tiorco acquisition, Stepan JV, BrightWater®
Reservoir Efficiency Technology launch & Nalco’s sales reach

16
External forces driving water and air opportunities, in addition to energy growth
Scarcity (recycling)Energy efficiencyRegulations & Enforcement
Water Treatment /Automation Build-Out
Energy Resources
Air Pollution Control
Reservoir efficiency (EOR)Hard-to-reach (deep/ultradeep)Opportunity crudesProduced water purificationNew energy
Sulfur and nitrogen oxides, mercury, particulatesCombustion/energy efficiencyGreenhouse gases

17
Strong Cash Generating Ability
Made debt payments of more than $600 million(1). Optional deleveraging an increasingly important expected use of cash.Initiated dividend payment in 2007 (~$20 million annual cash use)Share repurchase program of $300 million authorized by Board. 9.5 million shares repurchased since mid-2007 authorization. $89 million remaining on authorization.
Traditional Metrics Understate Nalco’s Cash-Generating Capabilities.Recommend Investors Compare Cash PE, EV/(EBITDA-CapEx)
and FCF Yield to Understand Nalco as a Cash-Generating Business.
12/31/0312/31/03
($ in millions)
Cash & Cash Equivalents 100$ 31$ Total Debt 3,765 (2) 3,267Net Debt 3,665 (2) 3,236
LTM Adjusted EBITDA 528$ (3) 603$
Total Net Debt / LTM EBITDA 6.9x 5.4x
12/31/0512/31/05 12/31/0612/31/06
37$ 3,1893,152
680$
4.6x
12/31/0412/31/04
33$ 3,4423,409
585$
5.8x
Free Cash Flow $119.6 $183.5$139.9Year-end Free Cash Flow Yield (4) 4.6% 6.1%
12/31/0712/31/07
120$ 3,3243,204
730$
4.4x
$200.65.8%
12/31/0812/31/08
62$ 3,2233,162
732$
4.3x
$142.08.9%
(1) Includes $164mm of 9.0% senior discount notes redeemed in conjunction with IPO.(2) Includes senior discount note debt issued January 2004.(3) Excludes $30mm pro forma future cost savings.(4) Calculated using year-end closing stock price, 4th quarter average diluted shares outstanding and full-year Free Cash Flow. Not
calculated in 2004 because Initial Public Offering launched during middle of fourth quarter, distorting average shares outstanding.

18
Investment Highlights
Leading Market Positions
Integrated, Innovative Technology, Sales and Service Model
Unmatched Global Presence
Significant Top-line Growth Potential
World Class Selling and Service Team
Strong, Growing Free Cash Flows
Continued Cost Saving Opportunities
Deep Management Team
Nalco is a Service Company with:
Questions?