Embed Size (px)
Citation preview
Exemplar for internal assessment resource Physics for Achievement Standard 91168
Exemplar for Internal Achievement Standard
91168 Level 2
This exemplar supports assessment against:
Achievement Standard 91168
Carry out a practical physics investigation that leads to a non-linear mathematical relationship
An annotated exemplar is an extract of student evidence, with a commentary, to explain key aspects of the standard. It assists teachers to make assessment judgements at the grade boundaries.
New Zealand Qualifications Authority
To support internal assessment from
© NZQA 2014
Exemplar for internal assessment resource Physics for Achievement Standard 91168
Grade Boundary: Low Excellence
1. For Excellence, the student needs to carry out a comprehensive practical physics investigation that leads to a non-linear mathematical relationship.
This involves writing a discussion that addresses critical issues. Each discussion point could relate to:
• a justification for an action that was taken • an explanation for how a difficulty was dealt with • an explanation for an unexpected result • a link between the experimental result and physics ideas.
See Explanatory Note 2 (EN2) for more detail.
This student has comprehensively investigated the non-linear relationship between the distance that a marble travels down a ramp and the time it takes to do so. This student has attempted to justify the accuracy improving techniques that have been used (1) (2), and has made two attempts to explain the lower than expected value for the acceleration of the marble (4) (5). For a more secure Excellence, the student could make their investigation more comprehensive by:
• stating why there was likely to be a parallax error in the distance measurement, relating the required positioning of the zero mark on the ruler to the starting position of the marble, and explaining why repeating and averaging reduces the error in the timing measurements
• calculating the value of the friction force, and make a judgement on how likely it is that the lower than expected value for the acceleration could be attributed to friction only.
© NZQA 2014
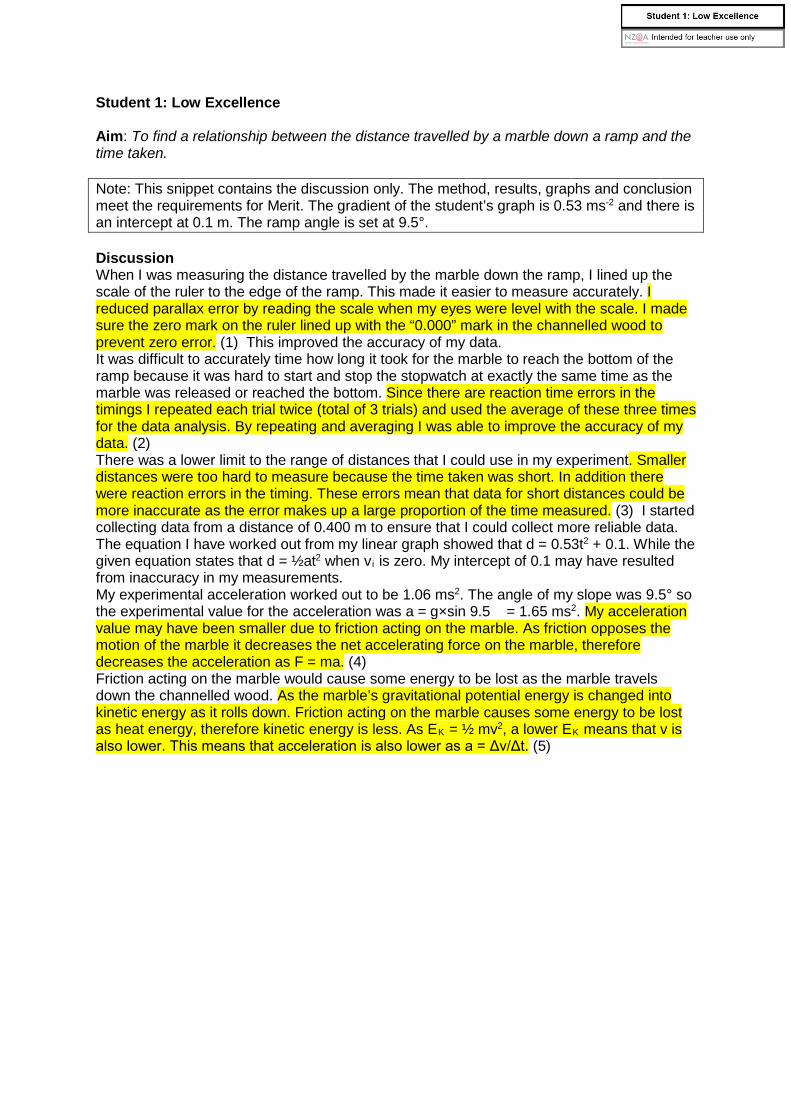
Student 1: Low Excellence Aim: To find a relationship between the distance travelled by a marble down a ramp and the time taken. Note: This snippet contains the discussion only. The method, results, graphs and conclusion meet the requirements for Merit. The gradient of the student’s graph is 0.53 ms-2 and there is an intercept at 0.1 m. The ramp angle is set at 9.5°. Discussion When I was measuring the distance travelled by the marble down the ramp, I lined up the scale of the ruler to the edge of the ramp. This made it easier to measure accurately. I reduced parallax error by reading the scale when my eyes were level with the scale. I made sure the zero mark on the ruler lined up with the “0.000” mark in the channelled wood to prevent zero error. (1) This improved the accuracy of my data. It was difficult to accurately time how long it took for the marble to reach the bottom of the ramp because it was hard to start and stop the stopwatch at exactly the same time as the marble was released or reached the bottom. Since there are reaction time errors in the timings I repeated each trial twice (total of 3 trials) and used the average of these three times for the data analysis. By repeating and averaging I was able to improve the accuracy of my data. (2) There was a lower limit to the range of distances that I could use in my experiment. Smaller distances were too hard to measure because the time taken was short. In addition there were reaction errors in the timing. These errors mean that data for short distances could be more inaccurate as the error makes up a large proportion of the time measured. (3) I started collecting data from a distance of 0.400 m to ensure that I could collect more reliable data. The equation I have worked out from my linear graph showed that d = 0.53t2 + 0.1. While the given equation states that d = ½at2 when vi is zero. My intercept of 0.1 may have resulted from inaccuracy in my measurements. My experimental acceleration worked out to be 1.06 ms2. The angle of my slope was 9.5° so the experimental value for the acceleration was a = g×sin 9.5 = 1.65 ms2. My acceleration value may have been smaller due to friction acting on the marble. As friction opposes the motion of the marble it decreases the net accelerating force on the marble, therefore decreases the acceleration as F = ma. (4) Friction acting on the marble would cause some energy to be lost as the marble travels down the channelled wood. As the marble’s gravitational potential energy is changed into kinetic energy as it rolls down. Friction acting on the marble causes some energy to be lost as heat energy, therefore kinetic energy is less. As EK = ½ mv2, a lower EK means that v is also lower. This means that acceleration is also lower as a = Δv/Δt. (5)
Exemplar for internal assessment resource Physics for Achievement Standard 91168
Grade Boundary: High Merit
2. For Merit, the student needs to carry out an in-depth practical physics investigation that leads to a non-linear mathematical relationship. This involves:
• controlling significant variable(s) • using appropriate accuracy improving techniques • stating the mathematical relationship.
See Explanatory Note 2 (EN2) for more detail. This student has investigated, in depth, the non-linear relationship between the distance that a marble travels down a ramp and the time it takes to do so. This student has gathered and processed data appropriately and has stated the mathematical relationship. An attempt has been made to justify the accuracy improving techniques that have been used (1) and to explain the control of a significant variable (2). The student has attempted to explain the unexpected difference between the theory and experimental results (3) (4). To reach Excellence, the student could make their investigation comprehensive by:
• explaining why repeating and averaging makes reaction time error less apparent.
• giving a reason, that relates specifically to this experimental set up, for the need to control the angle of the slope
• giving an accurate explanation for why friction affects the acceleration of the marble down the ramp.
© NZQA 2014
Student 2: High Merit Aim: To find a relationship between the distance travelled by a marble down a ramp and the time taken.
Note: This snippet contains the discussion only. All other aspects of the method, results, graphs and conclusion meet the requirements for Merit. The gradient of the student’s graph is 0.83 ms-2 and there is an intercept at -0.03 m. The ramp angle is set at 13.6°.
Discussion I used repeats and averaging to improve the accuracy of my investigation. This technique allows me to discard any random errors. By repeating the experiment 3 times and averaging the results I am making my data more accurate and reaction time error less apparent. (1) As well as this, I double checked the measurements on my ramp to make sure they were correctly marked. This reduced the chances of glitches in my data as my distance was always as accurate as possible. I also made sure I always used the same angle of elevation so all the trials are fair and non-biased. (2) I secured the ramp on to the table and the clamp stand so as to avoid any movement and change in the angle so that all the trials were held in a constant set up. The same stopwatch was used which meant that if the stopwatch was running fast or slow the difference would be apparent in all data as the times would increase by the same amount thus making no difference to the gradient of the curve. The same mass marble was also used so that the speed did not increase or decrease depending on mass of the marble. As we can see in my non-linear graph the y intercept is not zero but -0.03. This could be because of my reaction time error. The angle of my slope was 13.6⁰ so the acceleration should have been a = 10 × sin 13.6 = 2.4. So the gradient should have been ½ this gradient = ½ a = 1.2. (3) The gradient is greater than my gradient which suggests my curve should have been steeper. An explanation for this could be as the number of trials increased my reaction time slowed down. Thus at first my reaction time error was at its minimum. But as the number of trials increased my reaction nerves slowed down. Because the gradient is incorrect this rules out the possibility of my stopwatch being slower or the measurements on my ruler being wrong as that would have caused a constant increase in all the data and values collected. Another explanation could be that as the distance covered on the ramp increased so did friction. (4) It could be possible that the topmost length of my ramp had the least friction because the bottom part may have been dirty.
Exemplar for internal assessment resource Physics for Achievement Standard 91168
Grade Boundary: Low Merit
3. For Merit, the student needs to carry out an in-depth practical physics investigation that leads to a non-linear mathematical relationship. This involves:
• controlling significant variable(s) • using appropriate accuracy improving techniques • stating the mathematical relationship.
See Explanatory Note 2 (EN2) for more detail. This student has investigated, in depth, the non-linear relationship between the distance that a marble travels down a ramp and the time it takes to do so. This student has used appropriate accuracy improving techniques (1) (3). The student has attempted to describe the control of significant variables (2) and has attempted to identify the mathematical relationship (4). For a more secure Merit, the student could make their investigation more in-depth by:
• making it clear that the the variables described needed to be kept constant in order to control them
• including details of how the gradient was calculated, in order to confirm that the correct technique was used.
© NZQA 2014
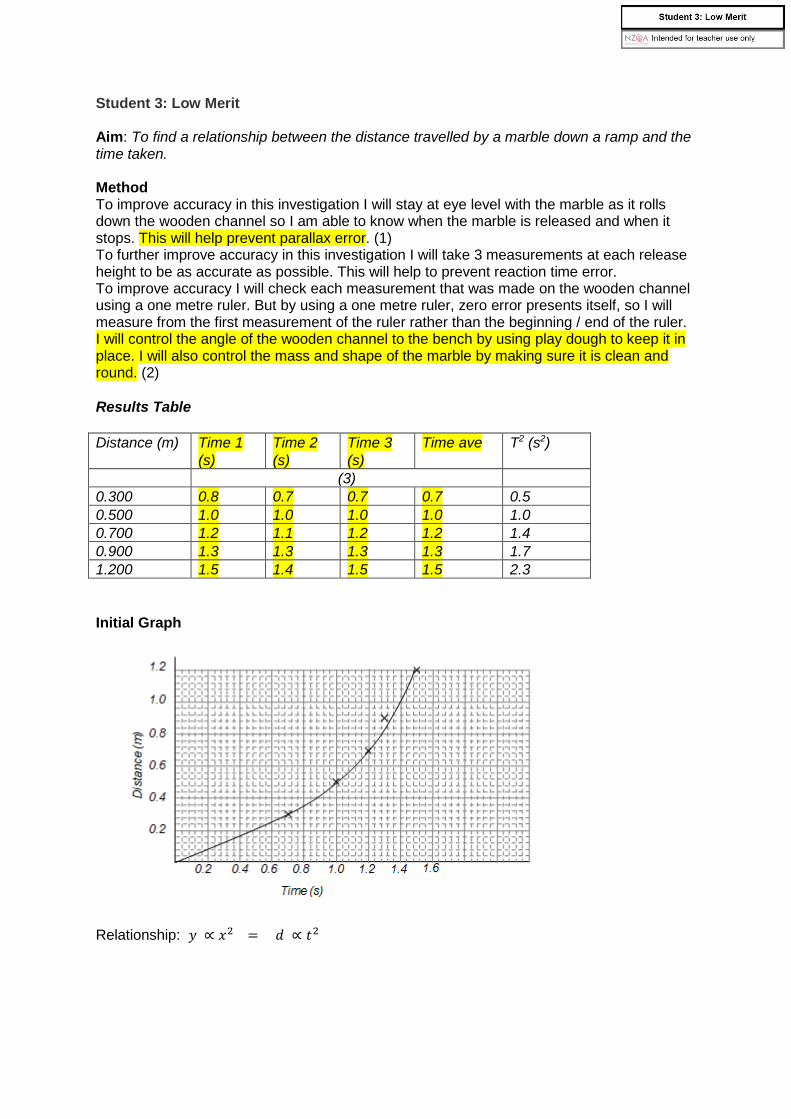
Student 3: Low Merit Aim: To find a relationship between the distance travelled by a marble down a ramp and the time taken. Method To improve accuracy in this investigation I will stay at eye level with the marble as it rolls down the wooden channel so I am able to know when the marble is released and when it stops. This will help prevent parallax error. (1) To further improve accuracy in this investigation I will take 3 measurements at each release height to be as accurate as possible. This will help to prevent reaction time error. To improve accuracy I will check each measurement that was made on the wooden channel using a one metre ruler. But by using a one metre ruler, zero error presents itself, so I will measure from the first measurement of the ruler rather than the beginning / end of the ruler. I will control the angle of the wooden channel to the bench by using play dough to keep it in place. I will also control the mass and shape of the marble by making sure it is clean and round. (2) Results Table Distance (m) Time 1
(s) Time 2 (s)
Time 3 (s)
Time ave T2 (s2)
(3) 0.300 0.8 0.7 0.7 0.7 0.5 0.500 1.0 1.0 1.0 1.0 1.0 0.700 1.2 1.1 1.2 1.2 1.4 0.900 1.3 1.3 1.3 1.3 1.7 1.200 1.5 1.4 1.5 1.5 2.3 Initial Graph
Relationship: 𝑦𝑦 ∝ 𝑥𝑥2 = 𝑑𝑑 ∝ 𝑡𝑡2

Linear Graph
Conclusion Gradient = 0.52 m s-2 Equation is d = 0.52t2 + 0.00 (4)
Exemplar for internal assessment resource Physics for Achievement Standard 91168
Grade Boundary: High Achieved
4. For Achieved, the student needs to carry out a practical physics investigation that leads to a non-linear mathematical relationship.
This involves:
• collecting relevant data over a reasonable range and number of values • drawing a graph that shows the required relationship • writing a conclusion which describes the type of mathematical relationship.
See Explanatory Note 2 (EN2) for more detail.
This student has investigated, in depth, the non-linear relationship between the distance that a marble travels down a ramp and the time it takes to do so.
This student has collected six sets of data over an appropriate range of values (2). An appropriate non-linear graph has been drawn (3) and the student has correctly stated the type of relationship (4).
The student has used increased accuracy by repeating and averaging the time measurements (2) and has reduced parallax error when measuring distances (6). The student has made an attempt to identify a variable that needs to be controlled (1) and to construct the correct mathematical equation (5).
To reach Merit, the student could:
• state that the appropriate angle identified for the ramp should be controlled by keeping it constant
• draw a correct linear graph from which to construct the equation, by correctly labelling the transformed variable axis
• using the transformed variable in the equation of the relationship.
© NZQA 2014
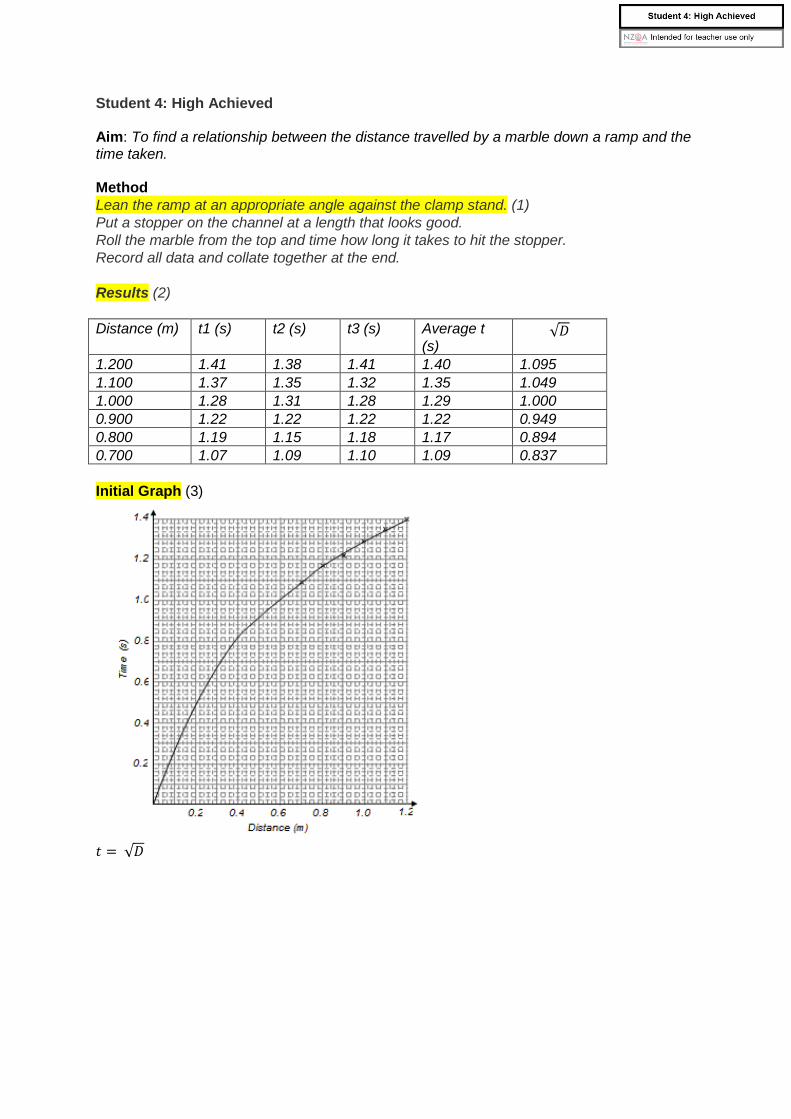
Student 4: High Achieved Aim: To find a relationship between the distance travelled by a marble down a ramp and the time taken. Method Lean the ramp at an appropriate angle against the clamp stand. (1) Put a stopper on the channel at a length that looks good. Roll the marble from the top and time how long it takes to hit the stopper. Record all data and collate together at the end. Results (2) Distance (m) t1 (s) t2 (s) t3 (s) Average t
(s) √𝐷𝐷
1.200 1.41 1.38 1.41 1.40 1.095 1.100 1.37 1.35 1.32 1.35 1.049 1.000 1.28 1.31 1.28 1.29 1.000 0.900 1.22 1.22 1.22 1.22 0.949 0.800 1.19 1.15 1.18 1.17 0.894 0.700 1.07 1.09 1.10 1.09 0.837 Initial Graph (3)
𝑡𝑡 = √𝐷𝐷
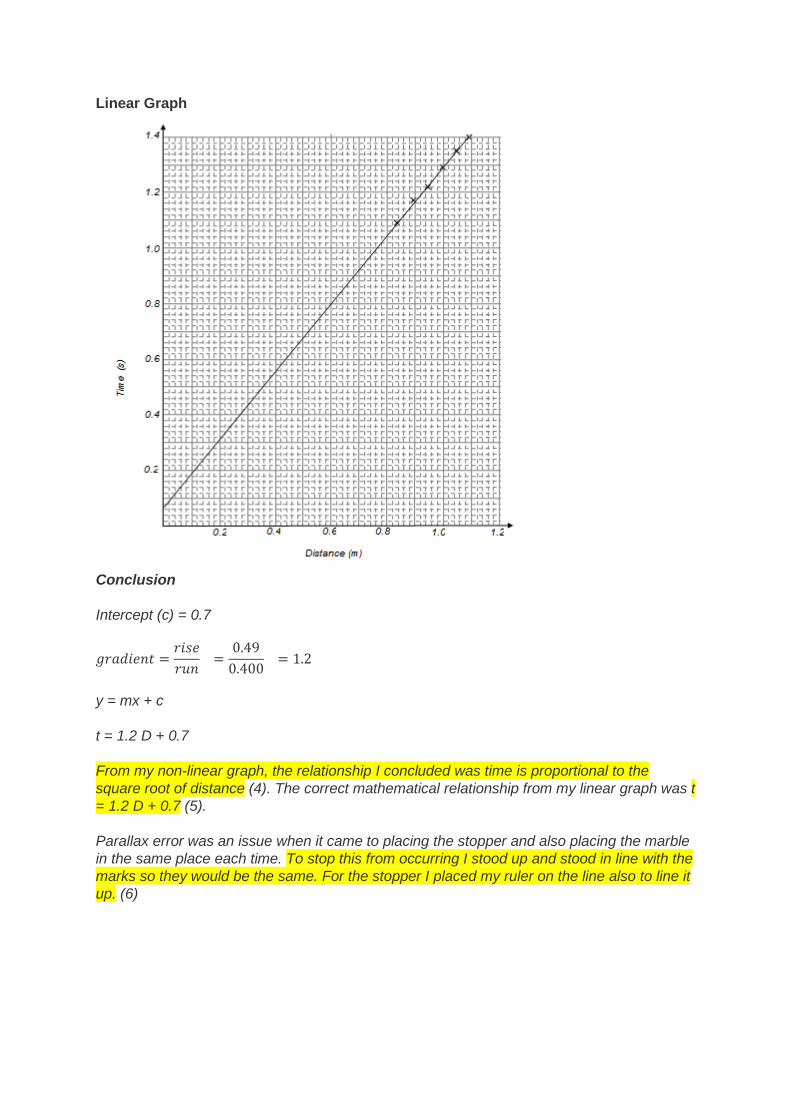
Linear Graph
Conclusion Intercept (c) = 0.7
𝑔𝑔𝑔𝑔𝑔𝑔𝑔𝑔𝑔𝑔𝑔𝑔𝑔𝑔𝑡𝑡 =𝑔𝑔𝑔𝑔𝑟𝑟𝑔𝑔𝑔𝑔𝑟𝑟𝑔𝑔
=0.49
0.400 = 1.2
y = mx + c t = 1.2 D + 0.7 From my non-linear graph, the relationship I concluded was time is proportional to the square root of distance (4). The correct mathematical relationship from my linear graph was t = 1.2 D + 0.7 (5). Parallax error was an issue when it came to placing the stopper and also placing the marble in the same place each time. To stop this from occurring I stood up and stood in line with the marks so they would be the same. For the stopper I placed my ruler on the line also to line it up. (6)
Exemplar for internal assessment resource Physics for Achievement Standard 91168
Grade Boundary: Low Achieved
5. For Achieved, the student needs to carry out a practical physics investigation that leads to a non-linear mathematical relationship.
This involves:
• collecting relevant data over a reasonable range and number of values • drawing a graph that shows the required relationship • writing a conclusion which describes the type of mathematical relationship.
See Explanatory Note 2 (EN2) for more detail.
This student has investigated, in depth, the non-linear relationship between the distance that a marble travels down a ramp and the time it takes to do so.
This student has collected six sets of data over an appropriate range of values (1). An attempt has been made to process the data so that an appropriate non-linear graph can be drawn (2). The student has correctly stated the type of relationship (3).
For a more secure Achieved, the student could:
• use more appropriate rounding when processing the data • plot all of the data points correctly • draw a graph line that is a better fit to the plotted points.
© NZQA 2014
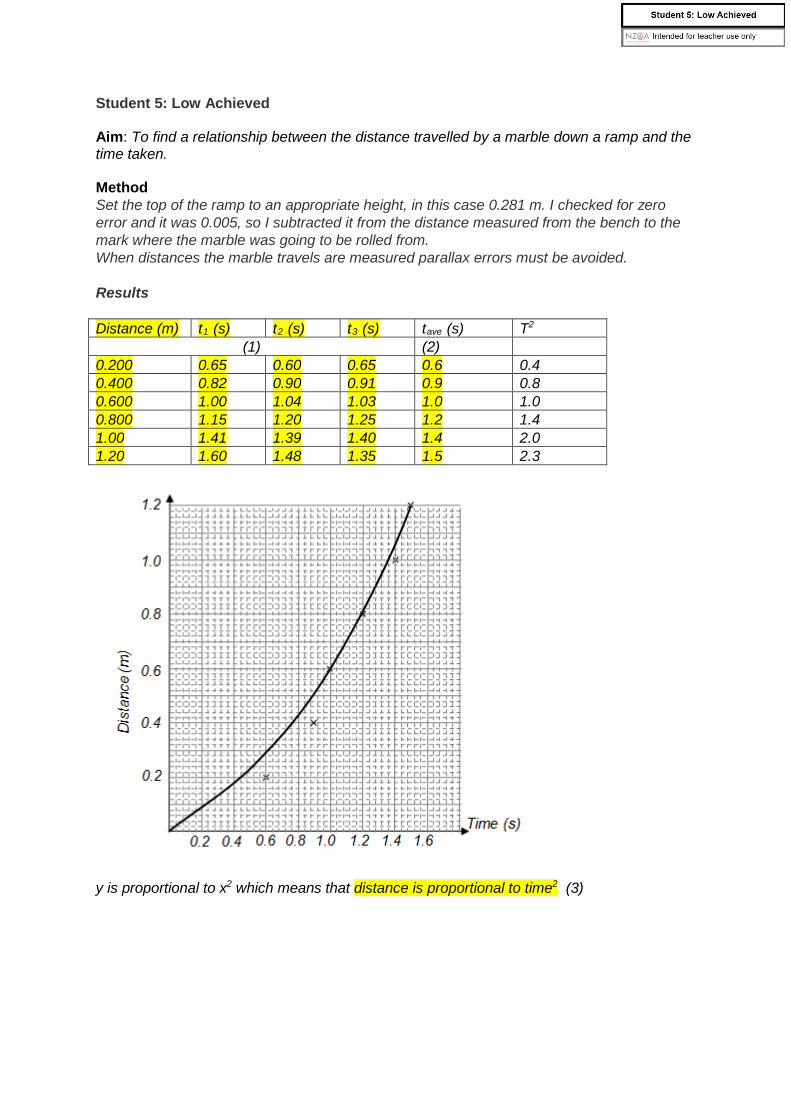
Student 5: Low Achieved Aim: To find a relationship between the distance travelled by a marble down a ramp and the time taken. Method Set the top of the ramp to an appropriate height, in this case 0.281 m. I checked for zero error and it was 0.005, so I subtracted it from the distance measured from the bench to the mark where the marble was going to be rolled from. When distances the marble travels are measured parallax errors must be avoided. Results Distance (m) t1 (s) t2 (s) t3 (s) tave (s) T2
(1) (2) 0.200 0.65 0.60 0.65 0.6 0.4 0.400 0.82 0.90 0.91 0.9 0.8 0.600 1.00 1.04 1.03 1.0 1.0 0.800 1.15 1.20 1.25 1.2 1.4 1.00 1.41 1.39 1.40 1.4 2.0 1.20 1.60 1.48 1.35 1.5 2.3
y is proportional to x2 which means that distance is proportional to time2 (3)
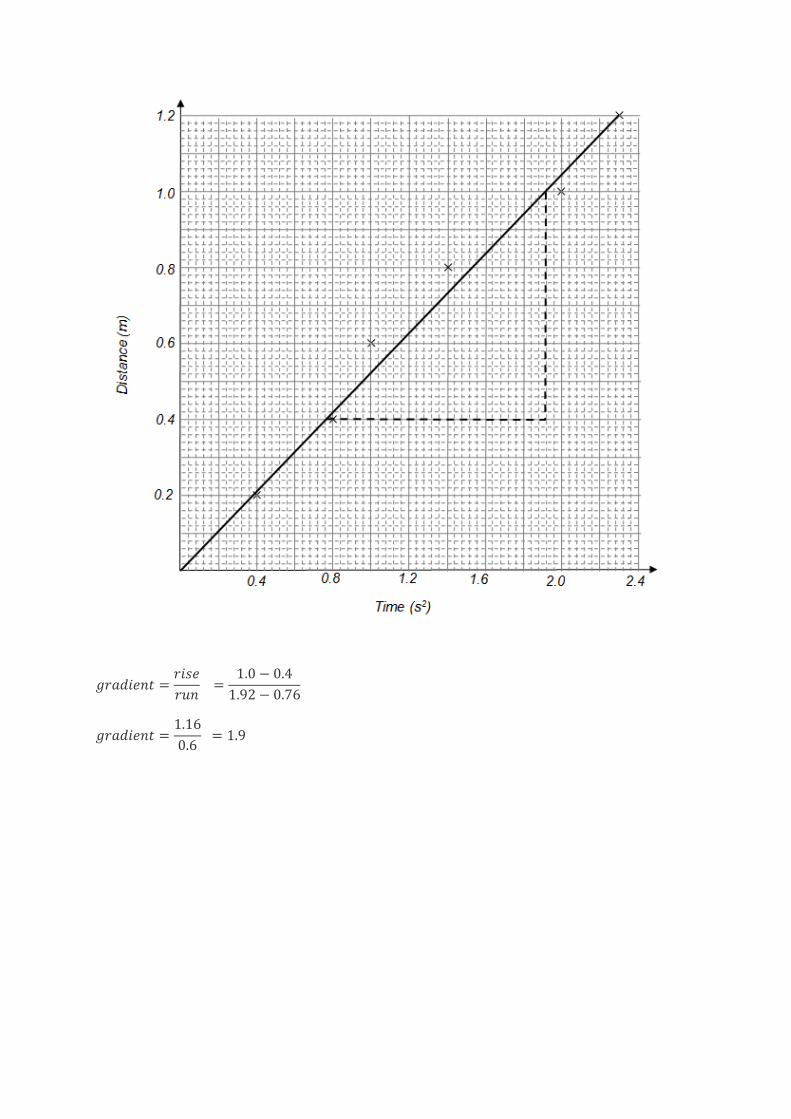
𝑔𝑔𝑔𝑔𝑔𝑔𝑔𝑔𝑔𝑔𝑔𝑔𝑔𝑔𝑔𝑔 =𝑔𝑔𝑔𝑔𝑟𝑟𝑔𝑔𝑔𝑔𝑟𝑟𝑔𝑔
=1.0 − 0.4
1.92 − 0.76
𝑔𝑔𝑔𝑔𝑔𝑔𝑔𝑔𝑔𝑔𝑔𝑔𝑔𝑔𝑔𝑔 =1.160.6
= 1.9
Exemplar for internal assessment resource Physics for Achievement Standard 91168
Grade Boundary: High Not Achieved
6. For Achieved, the student needs to carry out a practical physics investigation that leads to a non-linear mathematical relationship.
This involves:
• collecting relevant data over a reasonable range and number of values • drawing a graph that shows the required relationship • writing a conclusion which describes the type of mathematical relationship.
See Explanatory Note 2 (EN2) for more detail.
This student has investigated, in depth, the non-linear relationship between the distance that a marble travels down a ramp and the time it takes to do so.
The student has collected data over an appropriate range of values (1) and has attempted to draw an appropriate graph to show the relationship (2).
To reach Achieved, the student could:
• plot all of the points on the graph accurately • describe the type of mathematical relationship that exists between the
variables.
© NZQA 2014
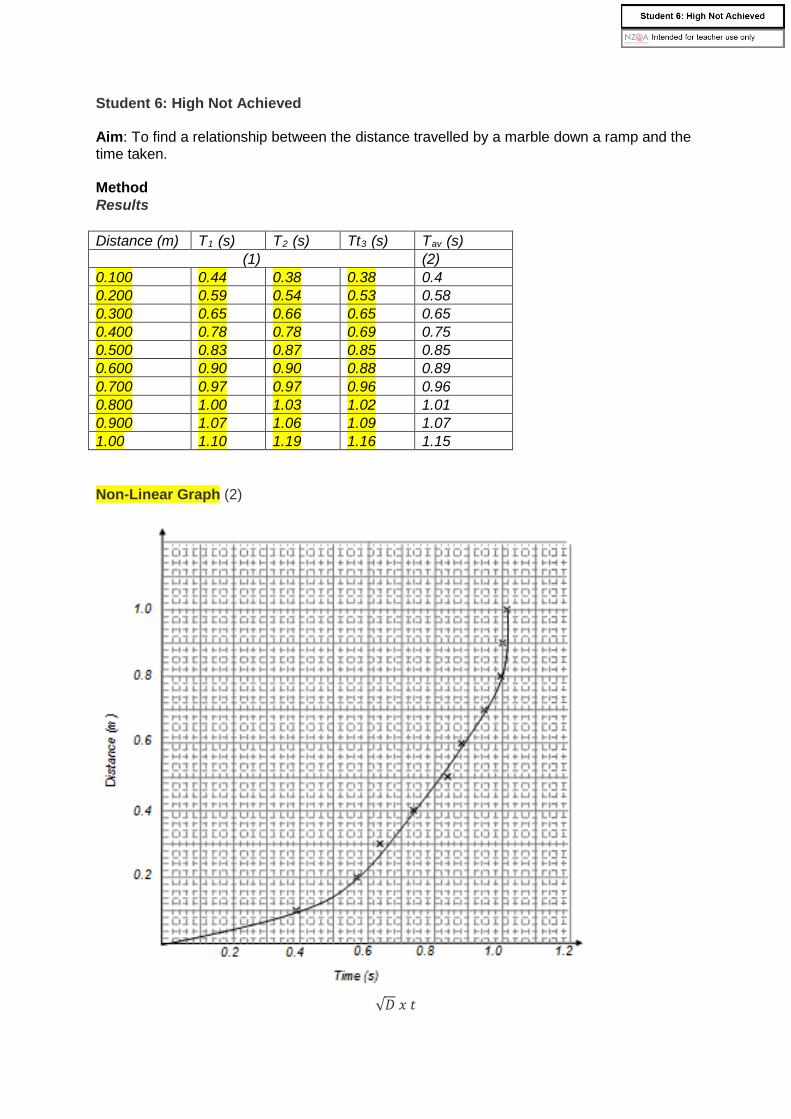
Student 6: High Not Achieved Aim: To find a relationship between the distance travelled by a marble down a ramp and the time taken. Method Results Distance (m) T1 (s) T2 (s) Tt3 (s) Tav (s)
(1) (2) 0.100 0.44 0.38 0.38 0.4 0.200 0.59 0.54 0.53 0.58 0.300 0.65 0.66 0.65 0.65 0.400 0.78 0.78 0.69 0.75 0.500 0.83 0.87 0.85 0.85 0.600 0.90 0.90 0.88 0.89 0.700 0.97 0.97 0.96 0.96 0.800 1.00 1.03 1.02 1.01 0.900 1.07 1.06 1.09 1.07 1.00 1.10 1.19 1.16 1.15 Non-Linear Graph (2)
√𝐷𝐷 𝑥𝑥 𝑡𝑡