Embed Size (px)
Citation preview
CP3-Exercise 3 - Crime Analysis in Washington.doc 1
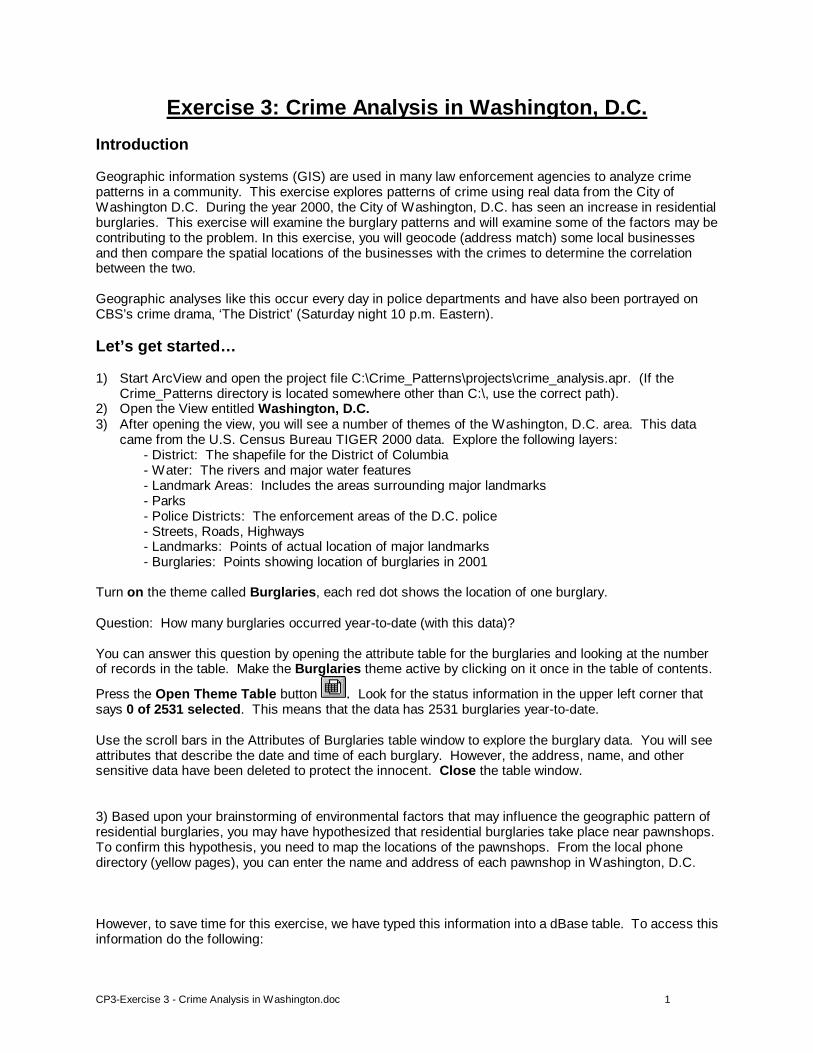
Exercise 3: Crime Analysis in Washington, D.C. Introduction Geographic information systems (GIS) are used in many law enforcement agencies to analyze crime patterns in a community. This exercise explores patterns of crime using real data from the City of Washington D.C. During the year 2000, the City of Washington, D.C. has seen an increase in residential burglaries. This exercise will examine the burglary patterns and will examine some of the factors may be contributing to the problem. In this exercise, you will geocode (address match) some local businesses and then compare the spatial locations of the businesses with the crimes to determine the correlation between the two. Geographic analyses like this occur every day in police departments and have also been portrayed on CBS’s crime drama, ‘The District’ (Saturday night 10 p.m. Eastern). Let’s get started… 1) Start ArcView and open the project file C:\Crime_Patterns\projects\crime_analysis.apr. (If the
Crime_Patterns directory is located somewhere other than C:\, use the correct path). 2) Open the View entitled Washington, D.C. 3) After opening the view, you will see a number of themes of the Washington, D.C. area. This data
came from the U.S. Census Bureau TIGER 2000 data. Explore the following layers: - District: The shapefile for the District of Columbia - Water: The rivers and major water features - Landmark Areas: Includes the areas surrounding major landmarks - Parks - Police Districts: The enforcement areas of the D.C. police - Streets, Roads, Highways - Landmarks: Points of actual location of major landmarks - Burglaries: Points showing location of burglaries in 2001
Turn on the theme called Burglaries, each red dot shows the location of one burglary. Question: How many burglaries occurred year-to-date (with this data)? You can answer this question by opening the attribute table for the burglaries and looking at the number of records in the table. Make the Burglaries theme active by clicking on it once in the table of contents.
Press the Open Theme Table button . Look for the status information in the upper left corner that says 0 of 2531 selected. This means that the data has 2531 burglaries year-to-date. Use the scroll bars in the Attributes of Burglaries table window to explore the burglary data. You will see attributes that describe the date and time of each burglary. However, the address, name, and other sensitive data have been deleted to protect the innocent. Close the table window. 3) Based upon your brainstorming of environmental factors that may influence the geographic pattern of residential burglaries, you may have hypothesized that residential burglaries take place near pawnshops. To confirm this hypothesis, you need to map the locations of the pawnshops. From the local phone directory (yellow pages), you can enter the name and address of each pawnshop in Washington, D.C. However, to save time for this exercise, we have typed this information into a dBase table. To access this information do the following:

CP3-Exercise 3 - Crime Analysis in Washington.doc 2
- Make the project window active.
- Click on the Tables icon and hit the Add button. - Navigate to c:\Crime_Patterns\tables and add the file pawnshops.dbf.
4) In the pawnshops.dbf table you will see the names and addresses of sixteen pawnshops. To locate these on the map, you need to match the addresses against the addresses in the street database. Make the Streets theme active by clicking on it in the table of contents and turn it on. Press the Identify button
and click on a street. You can see in the Identify Results window that each street in the map has an address range and a street name. You can use these streets and your pawnshops table to map the locations of the pawnshops. Close the Identify Results window and the pawnshops.dbf table. Make the Washington, D.C. view the active document. Under the View menu, select Geocode Addresses. Set he Reference Theme to Streets. Set the Address Table to pawnshops.dbf. Make sure the menu looks like the example below and then press the Batch Match button.
A menu will appear showing the percentage of records that were matched, it should be 100%. Press the Done button.

CP3-Exercise 3 - Crime Analysis in Washington.doc 3
A new theme will be added to the table of contents called Geocd1.shp. Turn this theme on. These are the locations of the pawnshops. 5) To avoid confusion, change the new Geocod1.shp theme name to Pawnshops.
- To do this, make the Geocd1.shp theme active; - On the main menu press Theme and then select Properties. - Change the Theme Name to Pawnshops. Press the OK button.
6) Let’s make the pawnshops easier to see on the map. To change the symbology of the pawnshops theme do the following:
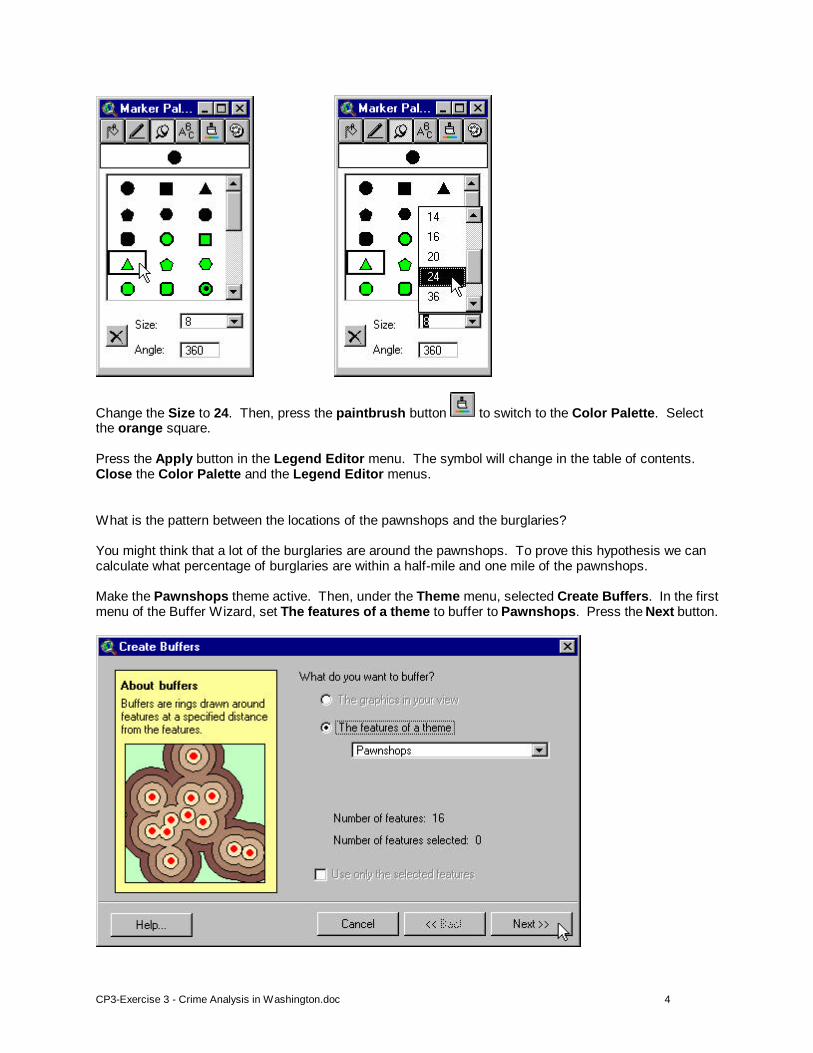
- Double click on the Pawnshops theme in the table of contents to bring up the Legend Editor. - Double click on the symbol in the Legend Editor menu to bring up the Marker Palette menu. - In the Marker Palette menu, click on the triangle with an outline.
CP3-Exercise 3 - Crime Analysis in Washington.doc 4
Change the Size to 24. Then, press the paintbrush button to switch to the Color Palette. Select the orange square. Press the Apply button in the Legend Editor menu. The symbol will change in the table of contents. Close the Color Palette and the Legend Editor menus. What is the pattern between the locations of the pawnshops and the burglaries? You might think that a lot of the burglaries are around the pawnshops. To prove this hypothesis we can calculate what percentage of burglaries are within a half-mile and one mile of the pawnshops. Make the Pawnshops theme active. Then, under the Theme menu, selected Create Buffers. In the first menu of the Buffer Wizard, set The features of a theme to buffer to Pawnshops. Press the Next button.

CP3-Exercise 3 - Crime Analysis in Washington.doc 5
In the next menu, press the At a specified distance option and enter 0.5. This will create a 0.5-mile buffer (about 3 city blocks) around the features. Press the Next button.
In the next menu, press the Yes option to Dissolve barriers between buffers. Press the in a new theme option to save the buffers to a shapefile. Save the shapefile in c:\Crime_Patterns\tmp. Press the Finish button.
A new buffer theme will be added to the table of contents. 7) Click and hold the theme Buffer 1 of Pawnshops and slide this theme until it is just below the Streets theme. You can now see which burglaries are within 0.5 miles of the pawnshops. To count the number of burglaries, you need to do a little more analysis.
CP3-Exercise 3 - Crime Analysis in Washington.doc 6
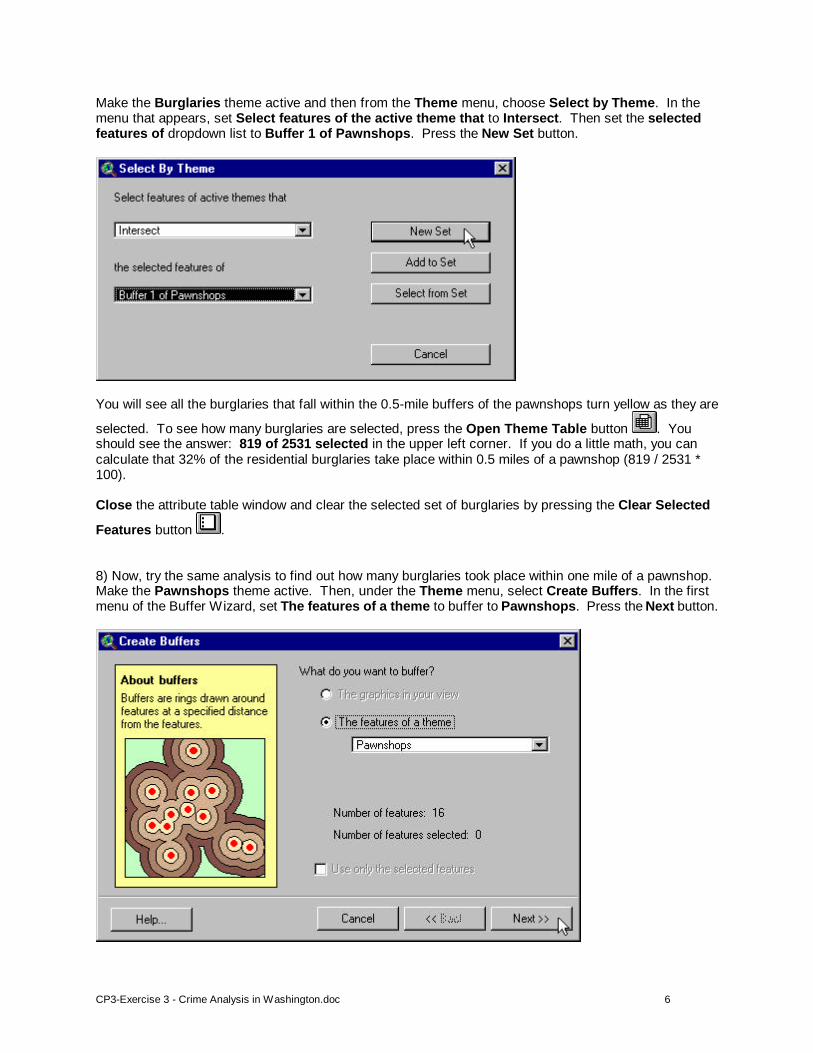
Make the Burglaries theme active and then from the Theme menu, choose Select by Theme. In the menu that appears, set Select features of the active theme that to Intersect. Then set the selected features of dropdown list to Buffer 1 of Pawnshops. Press the New Set button.
You will see all the burglaries that fall within the 0.5-mile buffers of the pawnshops turn yellow as they are
selected. To see how many burglaries are selected, press the Open Theme Table button . You should see the answer: 819 of 2531 selected in the upper left corner. If you do a little math, you can calculate that 32% of the residential burglaries take place within 0.5 miles of a pawnshop (819 / 2531 * 100). Close the attribute table window and clear the selected set of burglaries by pressing the Clear Selected
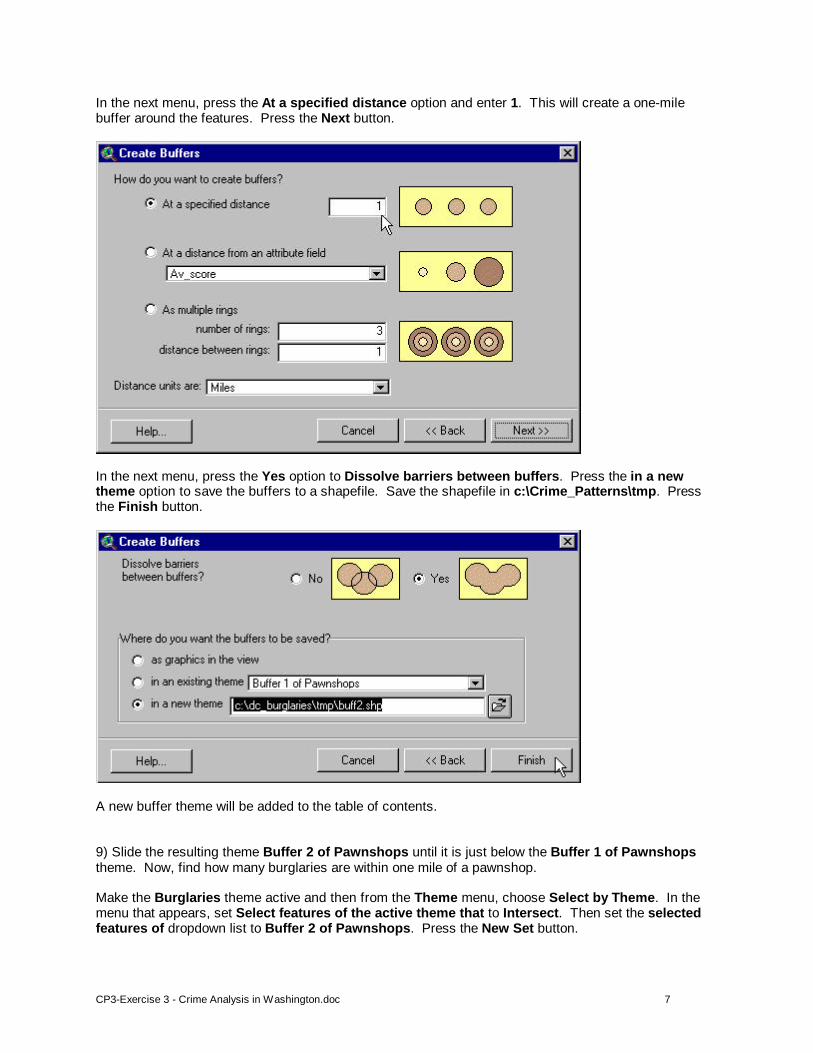
Features button . 8) Now, try the same analysis to find out how many burglaries took place within one mile of a pawnshop. Make the Pawnshops theme active. Then, under the Theme menu, select Create Buffers. In the first menu of the Buffer Wizard, set The features of a theme to buffer to Pawnshops. Press the Next button.
CP3-Exercise 3 - Crime Analysis in Washington.doc 7
In the next menu, press the At a specified distance option and enter 1. This will create a one-mile buffer around the features. Press the Next button.
In the next menu, press the Yes option to Dissolve barriers between buffers. Press the in a new theme option to save the buffers to a shapefile. Save the shapefile in c:\Crime_Patterns\tmp. Press the Finish button.
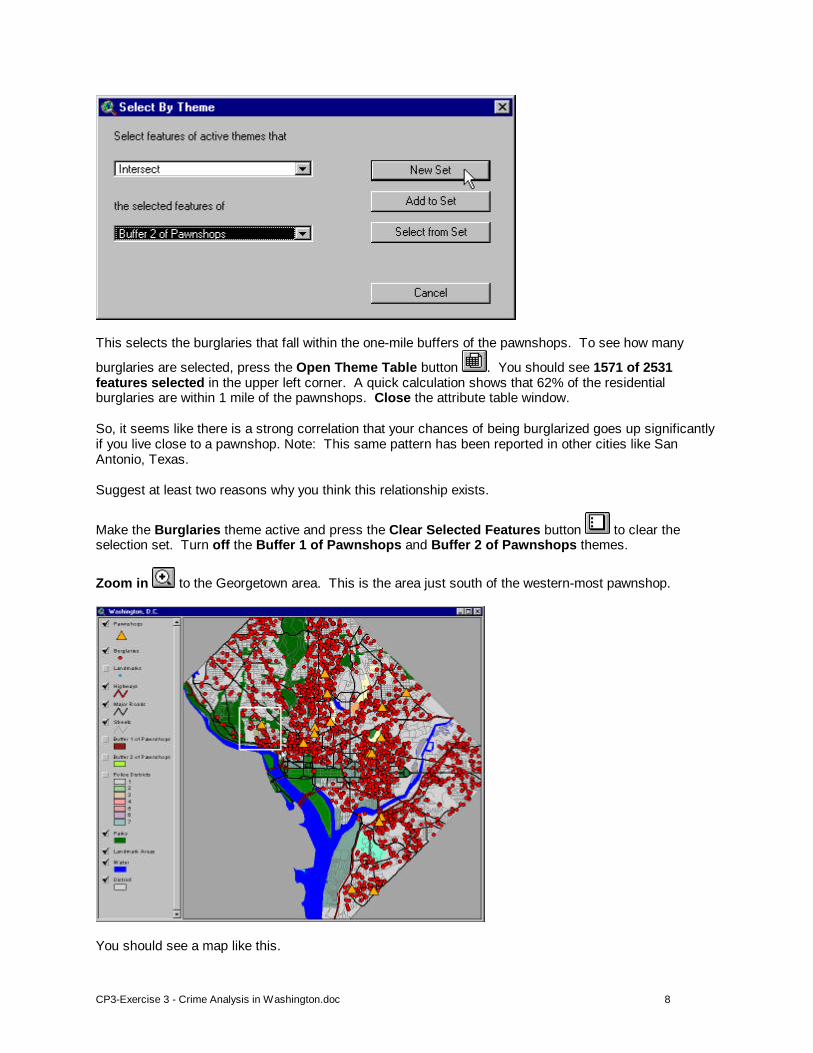
A new buffer theme will be added to the table of contents. 9) Slide the resulting theme Buffer 2 of Pawnshops until it is just below the Buffer 1 of Pawnshops theme. Now, find how many burglaries are within one mile of a pawnshop. Make the Burglaries theme active and then from the Theme menu, choose Select by Theme. In the menu that appears, set Select features of the active theme that to Intersect. Then set the selected features of dropdown list to Buffer 2 of Pawnshops. Press the New Set button.
CP3-Exercise 3 - Crime Analysis in Washington.doc 8
This selects the burglaries that fall within the one-mile buffers of the pawnshops. To see how many
burglaries are selected, press the Open Theme Table button . You should see 1571 of 2531 features selected in the upper left corner. A quick calculation shows that 62% of the residential burglaries are within 1 mile of the pawnshops. Close the attribute table window. So, it seems like there is a strong correlation that your chances of being burglarized goes up significantly if you live close to a pawnshop. Note: This same pattern has been reported in other cities like San Antonio, Texas. Suggest at least two reasons why you think this relationship exists.
Make the Burglaries theme active and press the Clear Selected Features button to clear the selection set. Turn off the Buffer 1 of Pawnshops and Buffer 2 of Pawnshops themes.
Zoom in to the Georgetown area. This is the area just south of the western-most pawnshop.
You should see a map like this.

CP3-Exercise 3 - Crime Analysis in Washington.doc 9
Let’s ask some questions about the map we are viewing.
- What do you notice about the distribution of these burglaries? - Where are the burglaries mostly located? - Are there exceptions to the general pattern of burglaries? - Is there a relationship between burglary and road type?
Let’s look at the burglaries compared to the road type. We are going to calculate the percentage of the burglaries which have taken place within 500 feet (about two blocks) of the major roads. However, we want to restrict this analysis to just the northwest side of the City and in the Police District 2. You should note that the northwest side of the city is the wealthier part of D.C.
Zoom back out to the whole City by either pressing the Zoom to Previous Extent button , Turn on the Police Districts theme and note the area that District 2 covers.
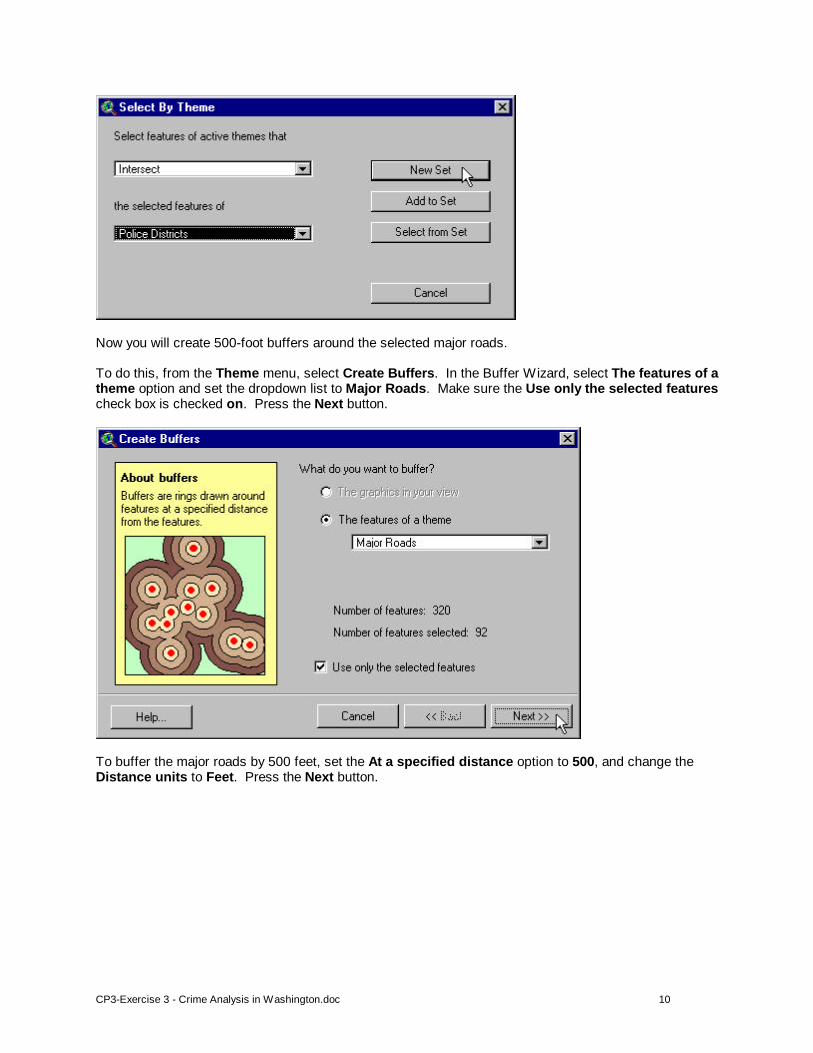
Make the Police Districts the active theme. Press the Select Feature tool and click on District 2 to select it. You will now select all the major roads that intersect Police District 2. Make the Major Roads theme active. The click on the Theme menu and choose Select By Theme. In the menu that appears, set the first dropdown list to Intersect and set the selected features of dropdown list to Police Districts. Press the New Set button.
CP3-Exercise 3 - Crime Analysis in Washington.doc 10
Now you will create 500-foot buffers around the selected major roads. To do this, from the Theme menu, select Create Buffers. In the Buffer Wizard, select The features of a theme option and set the dropdown list to Major Roads. Make sure the Use only the selected features check box is checked on. Press the Next button.
To buffer the major roads by 500 feet, set the At a specified distance option to 500, and change the Distance units to Feet. Press the Next button.

CP3-Exercise 3 - Crime Analysis in Washington.doc 11
In the next menu, press the Yes option to Dissolve barriers between buffers. Press the in a new theme option to save the buffers to a shapefile. Save the shapefile in c:\Crime_Patterns\tmp. Press the Finish button.
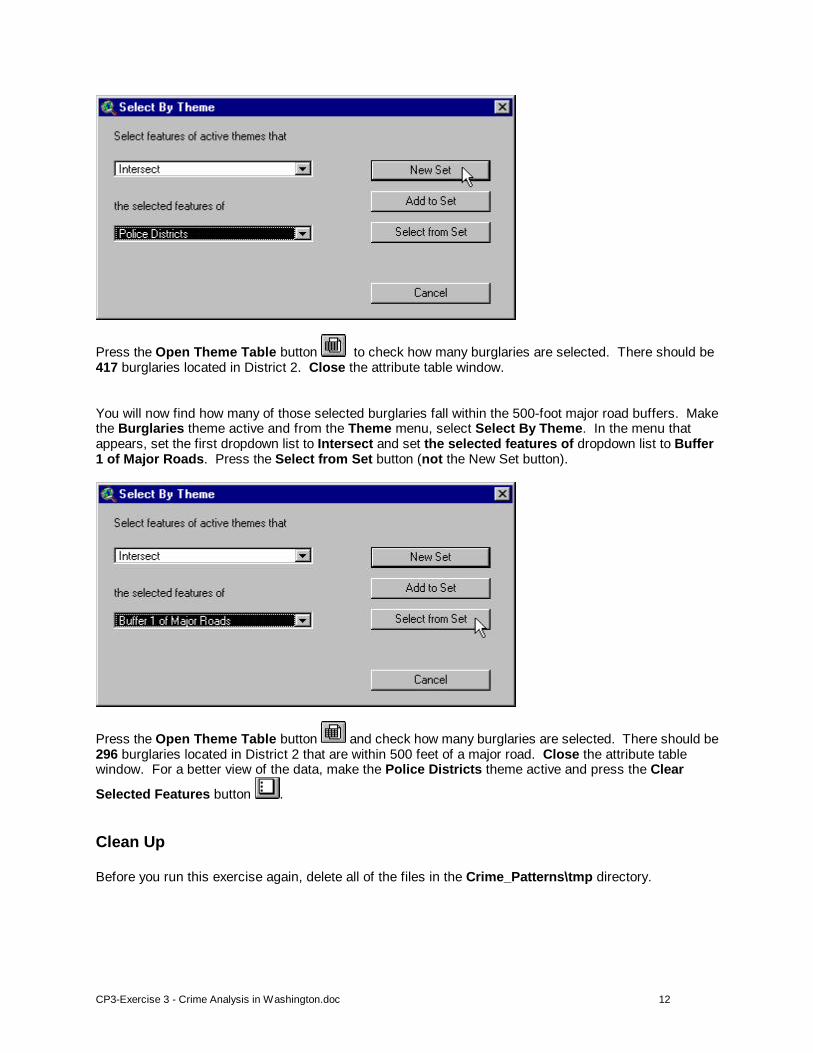
The buffer theme will be added to the view. Slide the Buffer 1 of Major Roads theme below the Burglaries theme. You will now select the burglaries that fall within Police District 2. Make the Burglaries theme active and from the Theme menu, select Select By Theme. In the menu that appears, set the first dropdown list to Intersect and set the selected features of dropdown list to Police Districts. Press the New Set button.
CP3-Exercise 3 - Crime Analysis in Washington.doc 12
Press the Open Theme Table button to check how many burglaries are selected. There should be 417 burglaries located in District 2. Close the attribute table window. You will now find how many of those selected burglaries fall within the 500-foot major road buffers. Make the Burglaries theme active and from the Theme menu, select Select By Theme. In the menu that appears, set the first dropdown list to Intersect and set the selected features of dropdown list to Buffer 1 of Major Roads. Press the Select from Set button (not the New Set button).
Press the Open Theme Table button and check how many burglaries are selected. There should be 296 burglaries located in District 2 that are within 500 feet of a major road. Close the attribute table window. For a better view of the data, make the Police Districts theme active and press the Clear
Selected Features button . Clean Up Before you run this exercise again, delete all of the files in the Crime_Patterns\tmp directory.
CP3-Exercise 3 - Crime Analysis in Washington.doc 13
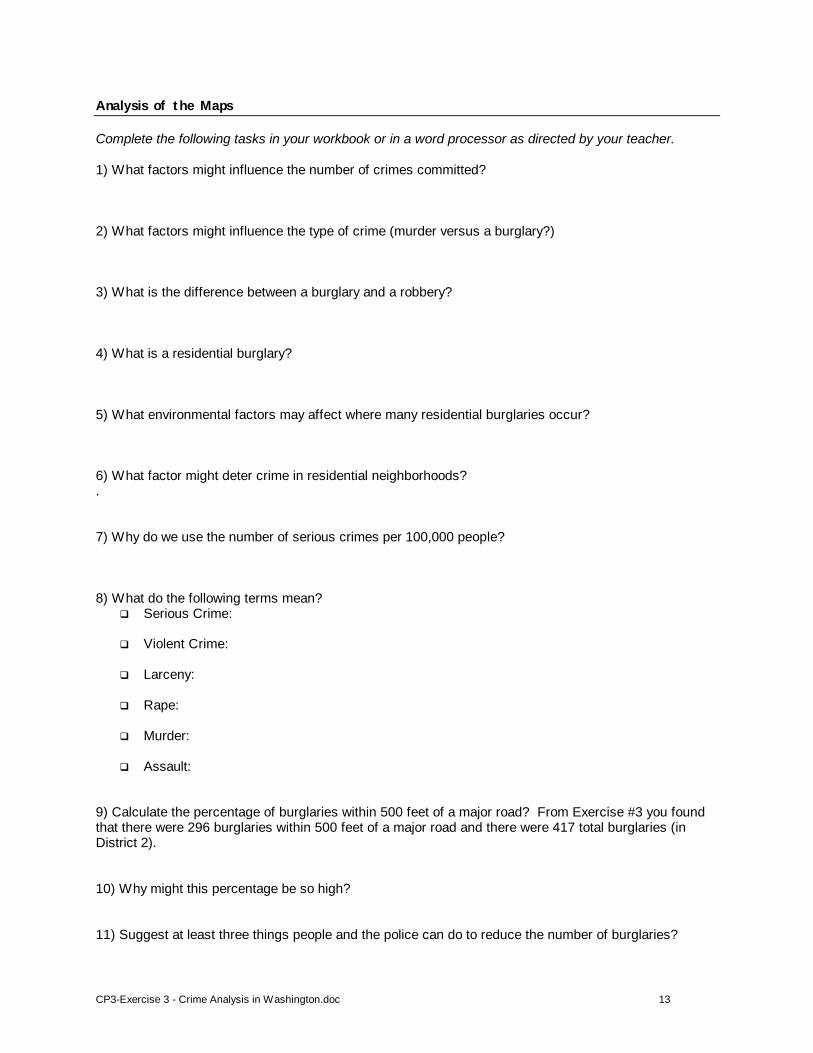
Analysis of the Maps Complete the following tasks in your workbook or in a word processor as directed by your teacher. 1) What factors might influence the number of crimes committed? 2) What factors might influence the type of crime (murder versus a burglary?) 3) What is the difference between a burglary and a robbery?
4) What is a residential burglary?
5) What environmental factors may affect where many residential burglaries occur? 6) What factor might deter crime in residential neighborhoods? . 7) Why do we use the number of serious crimes per 100,000 people? 8) What do the following terms mean?
q Serious Crime: q Violent Crime: q Larceny: q Rape: q Murder: q Assault:
9) Calculate the percentage of burglaries within 500 feet of a major road? From Exercise #3 you found that there were 296 burglaries within 500 feet of a major road and there were 417 total burglaries (in District 2). 10) Why might this percentage be so high? 11) Suggest at least three things people and the police can do to reduce the number of burglaries?