Embed Size (px)
Citation preview

EXERCISE 5.1
1. For which of these would you use a histogram to show the data?(a) The number of letters for different areas in a postman’s bag.(b) The height of competitors in an athletics meet.(c) The number of cassettes produced by 5 companies.(d) The number of passengers boarding trains from 7:00 a.m. to 7:00 p.m. at a station.Give reasons for each.
Answer: Data in (b) and (d) can be represented using a histogram. These data can be arranged in class intervals. This is what is required to depict a histogram. There should be no gap between two bars.
2. The shoppers who come to a departmental store are marked as: man (M), woman (W), boy (B) or girl (G). The following list gives the shoppers who came during the first hour in the morning: W W W G B W W M G G M M W W W W G B M W B G G M W W M M W WW M W B W G M W W W W G W M M W W M W G W M G W M M B G G W Make a frequency distribution table using tally marks. Draw a bar graph to illustrate it.
2. The shoppers who come to a departmental store are marked as: man (M), woman (W), boy (B) or girl (G). The following list gives the shoppers who came during the first hour in the morning: W W W G B W W M G G M M W W W W G B M W B G G M W W M M W WW M W B W G M W W W W G W M M W W M W G W M G W M M B G G W Make a frequency distribution table using tally marks. Draw a bar graph to illustrate it.
Answer:-

3. The weekly wages (in Rs) of 30 workers in a factory are.
830, 835, 890, 810, 835, 836, 869, 845, 898, 890, 820, 860, 832, 833, 855, 845, 804, 808, 812, 840, 885, 835, 835, 836, 878, 840, 868, 890, 806, 840
Using tally marks make a frequency table with intervals as 800–810, 810–820 and so on.
Answer:

4. Draw a histogram for the frequency table made for the data in Question 3, and answer the following questions.(i) Which group has the maximum number of workers?(ii) How many workers earn Rs 850 and more?(iii) How many workers earn less than Rs 850?Answer:
(i) The group earning Rs. 830-840 per week is having the most number of workers.(ii) 10 workers are earning Rs. 850 or more.(iii) 20 workers are earning less than Rs. 850.

5. The number of hours for which students of a particular class watched television during holidays is shown through the given graph.(i) For how many hours did the maximum number of students watch TV?(ii) How many students watched TV for less than 4 hours?(iii) How many students spent more than 5 hours in watching TV?
Answer: (i) Most of the students watched TV for 4 to 6 hours.(ii) 34 students watched TV for less than 4 hours.(iii) 14 students watch TV for more than 5 hours

EXERCISE 5.21. A survey was made to find the type of music that a certain group of young people liked in a city. Adjoining pie chart shows the findings of this survey.
From this pie chart answer the following:(i) If 20 people liked classical music, how many young people were surveyed?

ii) Which type of music is liked by the maximum number of people?Answer: Light music is liked by maximum number of people. (iii) If a cassette company were to make 1000 CD’s, how many of each type would they make?Answer: Number of CD’s for different musicSemi Classical = 1000 x 20% = 200Classical = 1000 x 10% = 100Folk = 1000 x 30% = 300Light = 1000 x 40% = 400

2. A group of 360 people were asked to vote for their favourite season from the three seasons rainy, winter and summer.i) Which season got the most votes?(ii) Find the central angle of each sector.(iii) Draw a pie chart to show this information.
Answer: (i) Winter got the most number of votes.(ii) Central Angle can be calculated as follows:

(iii) Pie Chart is as follows:

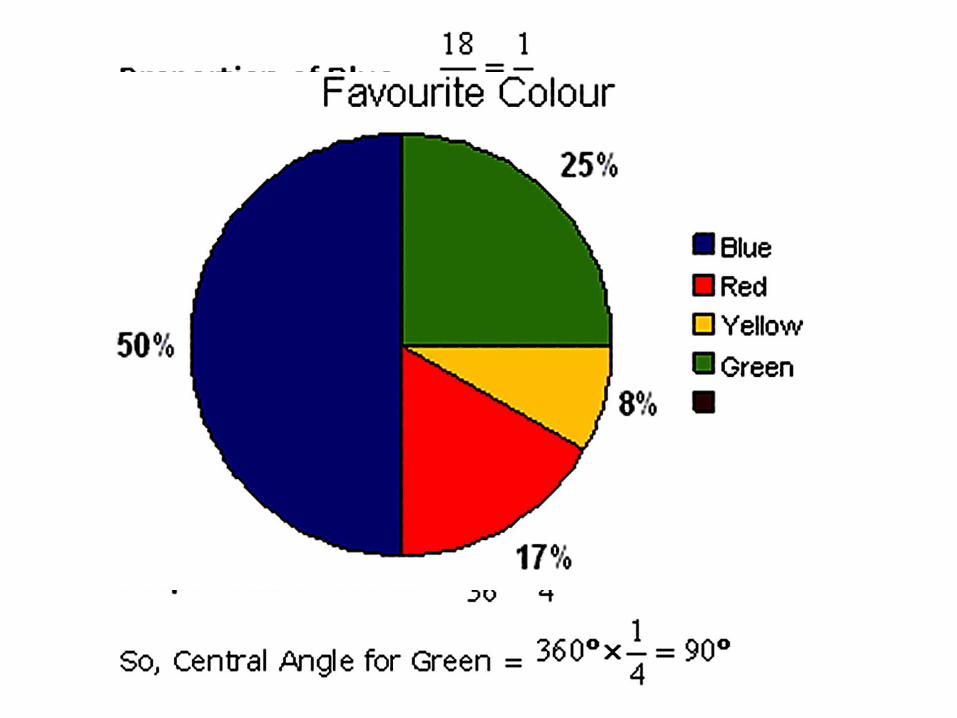
3. Draw a pie chart showing the following information. The table shows the colours preferred by a group of people.
Calculate respective proportion of each colour and use that proportion to find the central angle.

4. The adjoining pie chart gives the marks scored in an examination by a student in Hindi, English, Mathematics, Social Science and Science. If the total marks obtained by the students were 540, answer the following questions. All values are shown in degrees.

(i) In which subject did the student score 105 marks?
In the pie chart 70° is the angle for Math, so the student scored 105 marks in math.
(ii) How many more marks were obtained by the student in Mathematics than in Hindi?
Answer: The difference in central angle between Math and Hindi = 90°-70°=20°
(iii) Examine whether the sum of the marks obtained in Social Science and Mathematics is more than that in Science and Hindi.
Answer: Total of Angles of Social Science and Math = 80°+70°=150°Total of Angles of Science and Hindi = 65°+90°=155°It is clear that sum of marks obtained in Social Science and Math is less than that in Science and Hindi.

5. The number of students in a hostel, speaking different languages is given below. Display the data in a pie chart.


![영상처리 실습 #4 Histogram 연산 [ Histogram 대화상자 만들기 ]. Histogram 대화상자 만들기](https://img.pdfslide.net/doc/110x75/5697bfe71a28abf838cb5e1a/-4-histogram-histogram-.jpg)