Embed Size (px)
Citation preview

Exercise TestingExercise Testing
Theodore D. Fraker, Jr., MDTheodore D. Fraker, Jr., MD
Associate Division Director, Cardiovascular DiseasesAssociate Division Director, Cardiovascular Diseases
Ohio State University Medical CenterOhio State University Medical Center

Why do an exercise test?Why do an exercise test?
To diagnose coronary artery diseaseTo diagnose coronary artery disease To assess the response to therapy:To assess the response to therapy:
– For CADFor CAD– For HypertensionFor Hypertension– For atrial fibrillationFor atrial fibrillation
To establish prognosisTo establish prognosis To elicit arrythmiasTo elicit arrythmias

Criteria for a Positive Stress Test:Criteria for a Positive Stress Test:
> 1mm (0.1mV) of ST depression or > 1mm (0.1mV) of ST depression or elevation (compared to baseline) at 60-80 elevation (compared to baseline) at 60-80 msec after the j-pointmsec after the j-point
Downsloping ST segmentsDownsloping ST segments Horizontal or upsloping ST segments adds Horizontal or upsloping ST segments adds
to sensitivity but decreases specificityto sensitivity but decreases specificity

Criteria for a Positive Stress Test:Criteria for a Positive Stress Test:

The Problem Stress ECGThe Problem Stress ECG
Uninterpretable ECG’s:Uninterpretable ECG’s:– Ventricular Pre-excitationVentricular Pre-excitation– Paced RhythmsPaced Rhythms– LBBBLBBB– Resting ST depression > 1 mmResting ST depression > 1 mm
Problematic ECG’s:Problematic ECG’s:– DigoxinDigoxin– LVHLVH– Resting ST depression < 1 mmResting ST depression < 1 mm

Pretest Probability of CADPretest Probability of CAD
Gibbons, et al. JACC 2002:40;1531

Pretest Probability of CADPretest Probability of CAD
Framingham 10 year CAD risk calculator:Framingham 10 year CAD risk calculator:– http://hp2010.nhlbihin.net/atpiii/calculator.asp?
usertype=prof– http://www.mdcalc.com/framingham-cardiac-http://www.mdcalc.com/framingham-cardiac-
risk-scorerisk-score

Pretest Probability of CADPretest Probability of CAD
ACC/AHA 2013 risk calculator:ACC/AHA 2013 risk calculator:– http://
my.americanheart.org/professional/StatementsGuidelines/Prevention-Guidelines_UCM_457698_SubHomePage.jsp
– Individuals with > 7.5% 10-year risk of cardiac events Individuals with > 7.5% 10-year risk of cardiac events should be recommended for moderate or high-dose should be recommended for moderate or high-dose statin therapystatin therapy
– No specific LDLc target in this recommendationNo specific LDLc target in this recommendation

Atherosclerosis RiskAtherosclerosis Risk
Major Risk Factors:Major Risk Factors:– LDL-cholesterolLDL-cholesterol– Low HDL-cholesterolLow HDL-cholesterol– Family History (male<55; female<65)Family History (male<55; female<65)– HypertensionHypertension– SmokingSmoking– DiabetesDiabetes– LVH by ECGLVH by ECG

Atherosclerosis RiskAtherosclerosis Risk
Lesser Risk Factors:Lesser Risk Factors:– AgeAge– Male SexMale Sex– Elevated Insulin levelsElevated Insulin levels– Elevated triglyceridesElevated triglycerides– Physicial inactivityPhysicial inactivity– Postmenopausal statusPostmenopausal status– Obesity (especially central obesity)Obesity (especially central obesity)– Stress & DepressionStress & Depression

Atherosclerosis RiskAtherosclerosis Risk
Thrombogenic Factors:Thrombogenic Factors:– Lipoprotein (a) [Lp(a)]Lipoprotein (a) [Lp(a)]– HomocysteineHomocysteine– FibrinogenFibrinogen– C-reactive proteinC-reactive protein– Plasminogen Activator InhibitorPlasminogen Activator Inhibitor– Chlamydia pneumoniae infectionChlamydia pneumoniae infection

Pretest Probability of CADPretest Probability of CAD
Gibbons, et al. JACC 2002:40;1531

Pretest Probability of CADPretest Probability of CAD
Gibbons, et al. JACC 2002:40;1531

Diagnostic Accuracy of the ETTDiagnostic Accuracy of the ETT
Gibbons, et al. JACC 2002:40;1531

Useful Data from Stress Testing:Useful Data from Stress Testing:
Electrocardiographic:Electrocardiographic:– Maximum ST depression or elevationMaximum ST depression or elevation– ST-depression slope (downsloping vs ST-depression slope (downsloping vs
horizontal)horizontal)– Number of leads with ST depressionNumber of leads with ST depression– Exercise-induced arrythmiasExercise-induced arrythmias– Time to ST deviationTime to ST deviation

Useful Data from Stress Testing:Useful Data from Stress Testing:
Hemodynamic:Hemodynamic:– Maximum heart rateMaximum heart rate– Maximum systolic blood pressureMaximum systolic blood pressure– Maximum double product (HR x systolic BP)Maximum double product (HR x systolic BP)– Total exercise durationTotal exercise duration– Exercise-induced hypotensionExercise-induced hypotension– Chronotropic incompetenceChronotropic incompetence

Useful Data from Stress Testing:Useful Data from Stress Testing:
Symptomatic:Symptomatic:– Symptoms of angina or severe SOBSymptoms of angina or severe SOB– Time to exercise-induced anginaTime to exercise-induced angina– Time to exercise-induced SOBTime to exercise-induced SOB

The Rate-Pressure ProductThe Rate-Pressure Product
Low: < 200 x 100Low: < 200 x 100 Moderate: 200-300 x 100Moderate: 200-300 x 100 High: > 300 x 100High: > 300 x 100
The rate-pressure is a surrogate for maximum oxygen uptake

Borg Scale: Rate of Perceived ExertionBorg Scale: Rate of Perceived Exertion

Indications for Terminating ETTIndications for Terminating ETT
Fall in BP > 10 mm Hg when accompanied Fall in BP > 10 mm Hg when accompanied by signs of ischemiaby signs of ischemia
Moderate to severe anginaModerate to severe angina Ataxia, dizziness or near syncopeAtaxia, dizziness or near syncope Technical difficulties with ECG monitoringTechnical difficulties with ECG monitoring Sustained V-tachSustained V-tach ST elevation in leads w/o Q-waves (not ST elevation in leads w/o Q-waves (not
aVR or V1)aVR or V1)

Duke Treadmill Score:Duke Treadmill Score:
Treadmill Score = Exercise time – 5 x Treadmill Score = Exercise time – 5 x (amount of ST depression in mm) – 4 x (amount of ST depression in mm) – 4 x (exercise angina index) [index: 0 for no (exercise angina index) [index: 0 for no angina; 1 if angina occurred; 2 in angina angina; 1 if angina occurred; 2 in angina was the reason to stop the test]was the reason to stop the test]
Risk Assessment:Risk Assessment:– High risk (score < -11: annual mortality > 5%High risk (score < -11: annual mortality > 5%– Low risk (score > +5: annual mortality of 0.5%Low risk (score > +5: annual mortality of 0.5%

Duke Treadmill Score:Duke Treadmill Score:

Exercise ProtocolsExercise Protocols
BruceBruce– Most commonly used protocolMost commonly used protocol– Abundant prognostic informationAbundant prognostic information
BalkeBalke– Developed in the militaryDeveloped in the military
RampRamp– More physiologic approach to achieving More physiologic approach to achieving
maximum VO2maximum VO2

Exercise ProtocolsExercise Protocols


Ramp ProtocolRamp Protocol

Overview of Exercise PhysiologyOverview of Exercise Physiology
• During exercise CV system must deliver During exercise CV system must deliver increased blood flow by increasing cardiac increased blood flow by increasing cardiac output (Q)output (Q)
• CAD impairs the ability to achieve a peak Q CAD impairs the ability to achieve a peak Q and maximal oxygen uptake (VOand maximal oxygen uptake (VO22 max) max)
• Signs and symptoms of CAD are Signs and symptoms of CAD are proportional to the relative intensity proportional to the relative intensity (%VO(%VO22max) and/or duration of exercisemax) and/or duration of exercise

Normal cardiovascular Normal cardiovascular responses to exerciseresponses to exercise
• During exercise VODuring exercise VO22 increases linearly and increases linearly and plateaus at VOplateaus at VO22 max max
• The “anaerobic threshold” (AT) is an The “anaerobic threshold” (AT) is an important clinical endpoint for patients important clinical endpoint for patients with cardiac diseasewith cardiac disease
• Increasing dyspnea and muscle fatigue are Increasing dyspnea and muscle fatigue are symptoms experienced at exercise symptoms experienced at exercise intensities which exceed the “AT”intensities which exceed the “AT”

Oxygen uptake (VOOxygen uptake (VO22) versus ) versus
treadmill exercise intensitytreadmill exercise intensity

Exercise capacity expressed as VOExercise capacity expressed as VO2 2
max & MET’smax & MET’s
• VOVO22 max in normal subjects varies from 20 max in normal subjects varies from 20 to 80 ml/kg/minto 80 ml/kg/min
• Patients with CAD range from 3 to 30 Patients with CAD range from 3 to 30 ml/kg/minml/kg/min
• Exercise capacity is expressed in MET’s Exercise capacity is expressed in MET’s with 1 MET = resting VOwith 1 MET = resting VO22 (3.5 ml/kg/min) (3.5 ml/kg/min)
• Activities are described as multiples of Activities are described as multiples of 1 MET (1 MET (MMetabolic etabolic EEquivalenquivalenTT))

MET Cost of Common ActivitiesMET Cost of Common Activities

Max VOMax VO2 2 in sedentary, normal, conditioned & in sedentary, normal, conditioned &
endurance athletesendurance athletes

Maximum Recorded VO2Maximum Recorded VO2

Maximum Recorded VO2Maximum Recorded VO2

Maximum Recorded VO2Maximum Recorded VO2
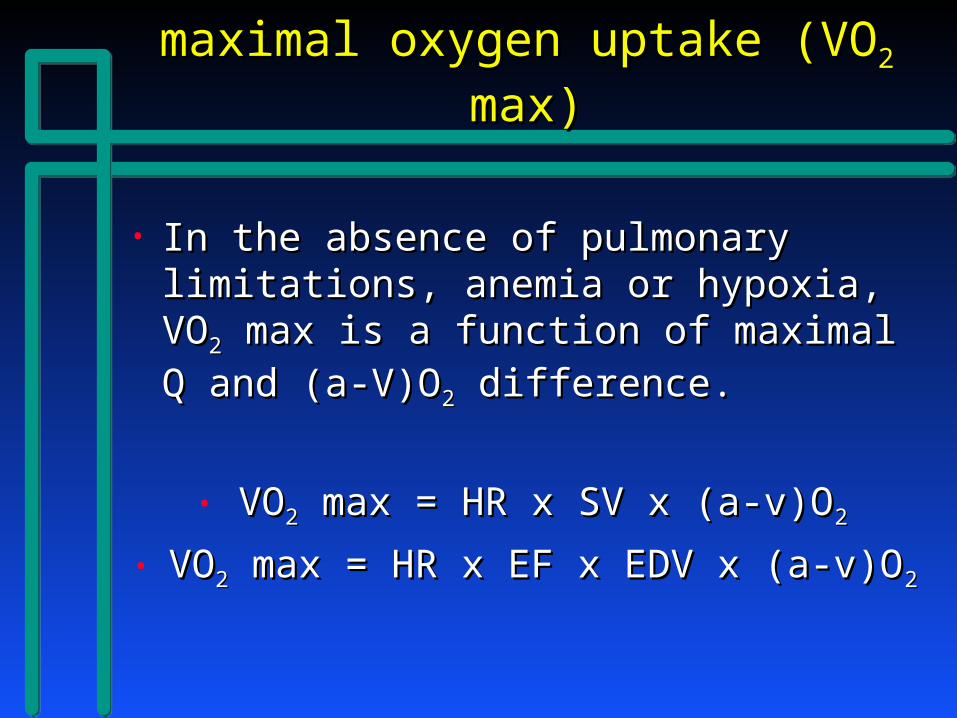
Determination of Determination of maximal oxygen uptake (VOmaximal oxygen uptake (VO22 max) max)
• In the absence of pulmonary limitations, In the absence of pulmonary limitations, anemia or hypoxia, VOanemia or hypoxia, VO22 max is a function max is a function
of maximal Q and (a-V)Oof maximal Q and (a-V)O22 difference. difference.
• VOVO22 max = HR x SV x (a-v)O max = HR x SV x (a-v)O22
• VOVO22 max = HR x EF x EDV x (a-v)O max = HR x EF x EDV x (a-v)O22

Cardiac output response to dynamic Cardiac output response to dynamic exerciseexercise
• Increases in a linear relationship to VOIncreases in a linear relationship to VO22 and and
percent of VOpercent of VO22 max max
• At submaximum exercise intensities Q is At submaximum exercise intensities Q is mediated by combined increases in HR and mediated by combined increases in HR and SVSV
• At higher intensities SV is maximal and At higher intensities SV is maximal and further increases in Q are due to HRfurther increases in Q are due to HR

Heart rate response to Heart rate response to dynamic exercisedynamic exercise
• HR increase is initially determined by HR increase is initially determined by withdraw of vagal tonewithdraw of vagal tone
• Increases in HR above 100 BPM are Increases in HR above 100 BPM are mediated by additional sympathetic drivemediated by additional sympathetic drive
• Peak HR usually occurs near VOPeak HR usually occurs near VO2 2 maxmax
• Maximum heart rate is estimated by:Maximum heart rate is estimated by:• Maximum HR = 220 - age (years) Maximum HR = 220 - age (years)

He
art
Ra
te
Rest Peak Exercise
Exercise
Maximum predicted heart rate
Resting heart rate
Recovery
Heart RateRecovery
VAGAL WITHDRAWAL
SYMPATHETIC ACTIVATION
VAGAL RECOVERY
SYMPATHETIC WITHDRAWAL
HEART RATE PATTERNS WITH EXERCISE

Stroke volume response to dynamic Stroke volume response to dynamic exerciseexercise
• SV increases due to increased LVEDV SV increases due to increased LVEDV (preload) which is dependent on increased (preload) which is dependent on increased venous return and increased LV venous return and increased LV contractility which enhances LV emptying contractility which enhances LV emptying which reduces LVESVwhich reduces LVESV
• Maximal SV is usually achieved at 50% of Maximal SV is usually achieved at 50% of VOVO22 max and usually does not increase at max and usually does not increase at
higher exercise intensitieshigher exercise intensities

Relationship of systolic and diastolic Relationship of systolic and diastolic time to HRtime to HR
• At higher heart rates, stroke volume At higher heart rates, stroke volume may actually decrease because of the may actually decrease because of the disproportionate shortening in disproportionate shortening in diastolic filling timediastolic filling time

Stroke volume response to dynamic Stroke volume response to dynamic exerciseexercise
• SV increases due to increased LVEDV SV increases due to increased LVEDV (preload) which is dependent on increased (preload) which is dependent on increased venous return and increased LV venous return and increased LV contractility which enhances LV emptying contractility which enhances LV emptying which reduces LVESVwhich reduces LVESV
• Maximal SV is usually achieved at 50% of Maximal SV is usually achieved at 50% of VOVO22 max and usually does not increase at max and usually does not increase at
higher exercise intensitieshigher exercise intensities

Ejection fraction response Ejection fraction response to dynamic exerciseto dynamic exercise
• LVEF = EDV - ESV / EDV x 100%LVEF = EDV - ESV / EDV x 100%
OrOr• LVEF = SV / EDV x 100%LVEF = SV / EDV x 100%
• Resting LVEF is 55 - 65% and increases to 75% Resting LVEF is 55 - 65% and increases to 75% or more during maximal exerciseor more during maximal exercise
• EDV increases 5-10%; ESV decreases 5-10%EDV increases 5-10%; ESV decreases 5-10%

Changes in SV from Changes in SV from rest to maximal exerciserest to maximal exercise

Arterial blood pressureArterial blood pressureresponse to dynamic exerciseresponse to dynamic exercise
• Reflects balance between increased Q and Reflects balance between increased Q and decreased SVRdecreased SVR
• SBP increases substantially due to higher SBP increases substantially due to higher SV and LV ejection forceSV and LV ejection force
• DBP is moderately reduced due to lowering DBP is moderately reduced due to lowering of SVR during diastoleof SVR during diastole
• This combination of responses provide a This combination of responses provide a moderate increase in MAPmoderate increase in MAP

(a-v) O(a-v) O22 Response to Response to
Dynamic ExerciseDynamic Exercise
• A typical (a-v)OA typical (a-v)O22 difference at rest is 5 mL O difference at rest is 5 mL O22/dL /dL
(arterial of 20 - mixed venous of 15)(arterial of 20 - mixed venous of 15)• During maximal exercise the mixed venous ODuring maximal exercise the mixed venous O22
content falls to 5 ml Ocontent falls to 5 ml O22/dL, thus widening the (a-/dL, thus widening the (a-
v)Ov)O22 difference from 5 to 15 ml O difference from 5 to 15 ml O22/dL/dL
• Maximal (a-v)OMaximal (a-v)O22 difference of normals subjects, difference of normals subjects,
athletes and cardiac patients is very similar (15-17 athletes and cardiac patients is very similar (15-17 vol%)vol%)

Systemic vascular resistance response to Systemic vascular resistance response to dynamic exercisedynamic exercise
• SVR decreases in an exponential pattern SVR decreases in an exponential pattern proportional to Q and %VOproportional to Q and %VO22 max max
• SVR is determined by the balance between SVR is determined by the balance between marked metabolic vasodilation in exercising marked metabolic vasodilation in exercising muscle and increases in regional muscle and increases in regional sympathetic tone in nonexercising muscle sympathetic tone in nonexercising muscle and visceral organsand visceral organs
• Overall SVR decreases 50% from restOverall SVR decreases 50% from rest

Acute Response to ExerciseAcute Response to Exercise

Acute Blood Pressure Acute Blood Pressure Response to ExerciseResponse to Exercise

Changes in resistance to flow during Changes in resistance to flow during exerciseexercise
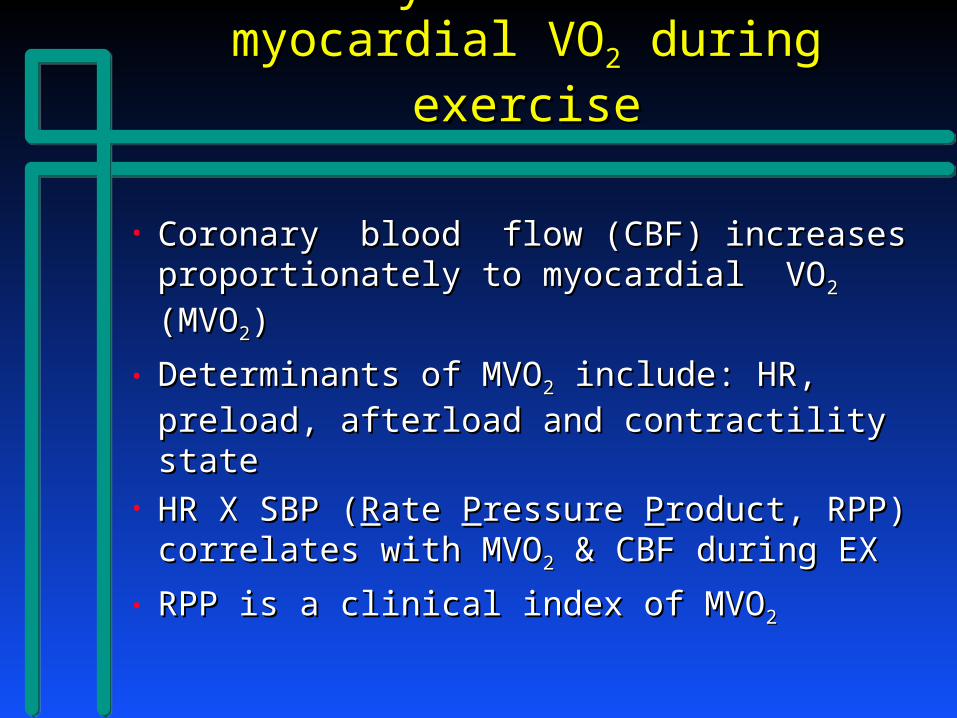
Coronary blood flow and myocardial Coronary blood flow and myocardial VOVO22 during exercise during exercise
• Coronary blood flow (CBF) increases Coronary blood flow (CBF) increases proportionately to myocardial VOproportionately to myocardial VO22 (MVO (MVO22))
• Determinants of MVODeterminants of MVO22 include: HR, include: HR,
preload, afterload and contractility statepreload, afterload and contractility state• HR X SBP (HR X SBP (RRate ate PPressure ressure PProduct, RPP) roduct, RPP)
correlates with MVOcorrelates with MVO22 & CBF during EX & CBF during EX
• RPP is a clinical index of MVORPP is a clinical index of MVO22
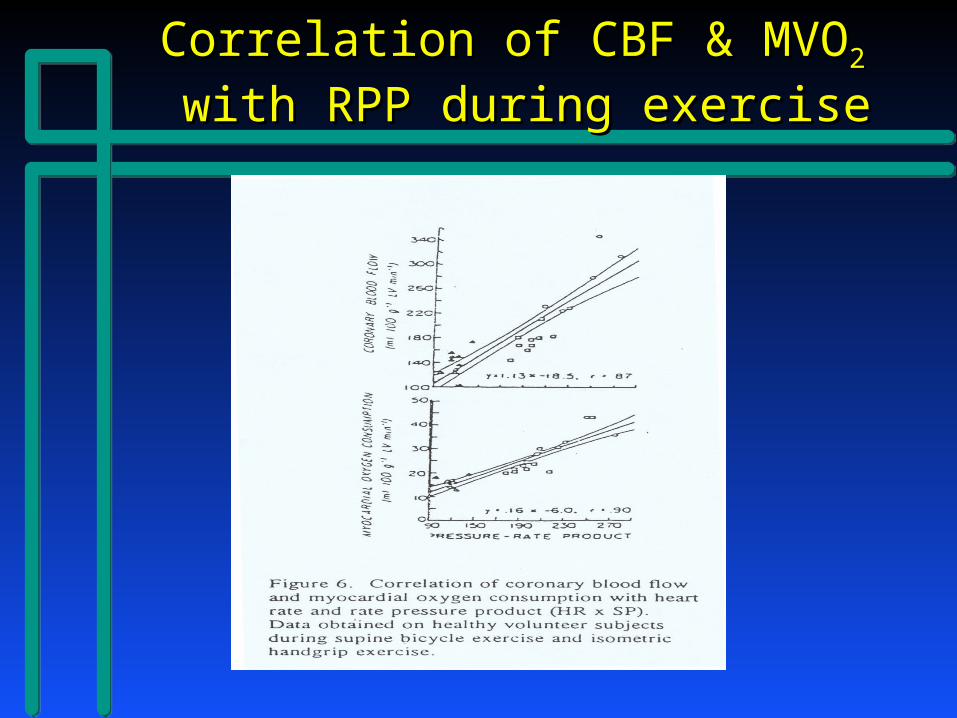
Correlation of CBF & MVOCorrelation of CBF & MVO22
with RPP during exercisewith RPP during exercise

Unravelling the Mysteries of the Unravelling the Mysteries of the Metabolic Stress TestMetabolic Stress Test
What is actually measured?What is actually measured?– Heart RateHeart Rate– Respiratory RateRespiratory Rate– Duration of ExerciseDuration of Exercise– Expired Tidal VolumeExpired Tidal Volume– FiO2 (percent of oxygen in inspired air)FiO2 (percent of oxygen in inspired air)– FeO2 (percent of oxygen in expired air)FeO2 (percent of oxygen in expired air)– FiCO2 (percent of CO2 in inspired air)FiCO2 (percent of CO2 in inspired air)– FeCO2 (percent of CO2 in expired air)FeCO2 (percent of CO2 in expired air)

Unravelling the Mysteries of the Unravelling the Mysteries of the Metabolic Stress TestMetabolic Stress Test
What is calculated?What is calculated?– VE (minute ventilation) = respiratory rate x VE (minute ventilation) = respiratory rate x
tidal volume (L/min)tidal volume (L/min)– VO2 (oxygen uptake) = FF x (FiO2-FeO2) x VO2 (oxygen uptake) = FF x (FiO2-FeO2) x
VEVE– VCO2 (CO2 produced) = VE x FeCO2VCO2 (CO2 produced) = VE x FeCO2
(FF = “fudge factor”)

Unravelling the Mysteries of the Unravelling the Mysteries of the Metabolic Stress TestMetabolic Stress Test
What is calculated?What is calculated?– RER (respiratory exchange ratio) = VCO2/VO2RER (respiratory exchange ratio) = VCO2/VO2
» Roughly 75% of consumed O2 is converted to CO2 thus Roughly 75% of consumed O2 is converted to CO2 thus the resting RER is 0.75-0.85the resting RER is 0.75-0.85
» More O2 is required to burn fat than to burn carbs (RER More O2 is required to burn fat than to burn carbs (RER for fat metabolism ~ 0.7)for fat metabolism ~ 0.7)
» With exercise, more CO2 is produced than O2 consumed: With exercise, more CO2 is produced than O2 consumed: RER > 1.2 = “good” effortRER > 1.2 = “good” effort
» Hyperventilation will raise the RERHyperventilation will raise the RER

Unravelling the Mysteries of the Unravelling the Mysteries of the Metabolic Stress TestMetabolic Stress Test
What is calculated?What is calculated?– Ventilatory Efficiency: VE/VCO2Ventilatory Efficiency: VE/VCO2
» Ventilatory requirement to eliminate CO2Ventilatory requirement to eliminate CO2» Metabolic CO2 is a strong stimulus for ventilationMetabolic CO2 is a strong stimulus for ventilation» VE/VCO2 drops in early exercise and normally rises VE/VCO2 drops in early exercise and normally rises
very little with exercisevery little with exercise» In chronic CHF, VE/VCO2 is shifted upwardIn chronic CHF, VE/VCO2 is shifted upward» VE/VCO2 > 34 signifies severe CHF (or COPD)VE/VCO2 > 34 signifies severe CHF (or COPD)
Unravelling the Mysteries of the Unravelling the Mysteries of the Metabolic Stress TestMetabolic Stress Test
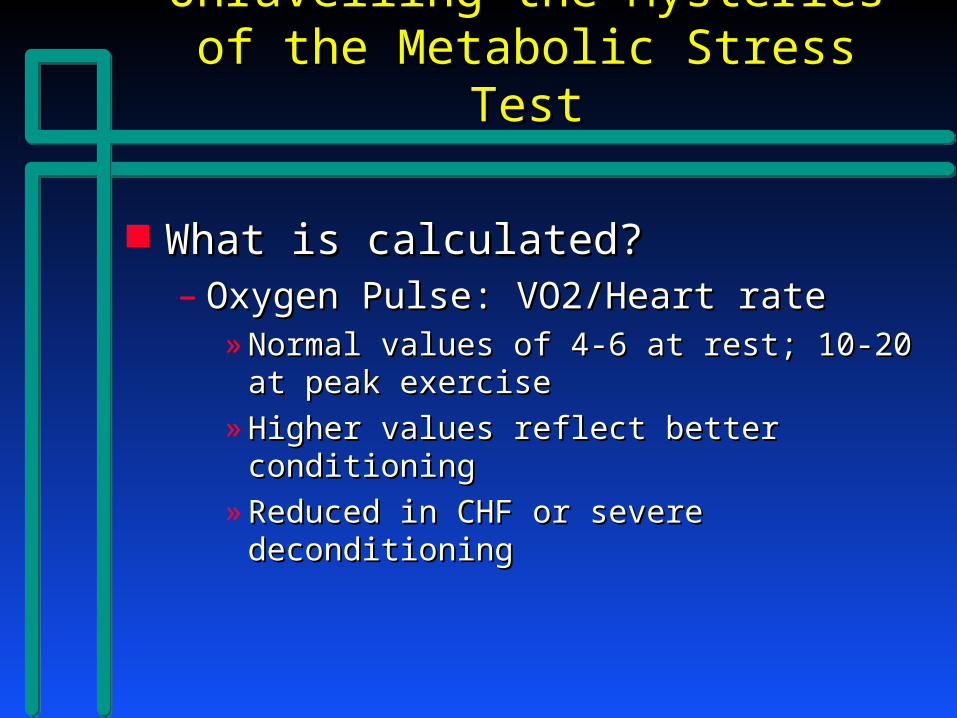
What is calculated?What is calculated?– Oxygen Pulse: VO2/Heart rateOxygen Pulse: VO2/Heart rate
» Normal values of 4-6 at rest; 10-20 at peak exerciseNormal values of 4-6 at rest; 10-20 at peak exercise
» Higher values reflect better conditioningHigher values reflect better conditioning
» Reduced in CHF or severe deconditioningReduced in CHF or severe deconditioning

Unravelling the Mysteries of the Unravelling the Mysteries of the Metabolic Stress TestMetabolic Stress Test
What is calculated?What is calculated?– Breathing Reserve: VE max/MVV (at rest)Breathing Reserve: VE max/MVV (at rest)– MVV is determined by hyperventilation at restMVV is determined by hyperventilation at rest– VE max is minute ventilation at peak exerciseVE max is minute ventilation at peak exercise– Healthy subjects achieve VE max of 60-70% of Healthy subjects achieve VE max of 60-70% of
MVVMVV– Breathing reserve < 30% signifies severe COPDBreathing reserve < 30% signifies severe COPD

Unravelling the Mysteries of the Unravelling the Mysteries of the Metabolic Stress TestMetabolic Stress Test
Interpretation of the MST:Interpretation of the MST:– Refer for CHF managementRefer for CHF management
» Peak VO2 < 16 ml/kg/min (especially < 12)Peak VO2 < 16 ml/kg/min (especially < 12)
» Peak VO2 < 50% of predictedPeak VO2 < 50% of predicted
» VE/VCO2 > 34VE/VCO2 > 34
– Consider Pulmonary DiseaseConsider Pulmonary Disease– Consider DeconditioningConsider Deconditioning

Unravelling the Mysteries of the Unravelling the Mysteries of the Metabolic Stress TestMetabolic Stress Test
Interpretation of the MST:Interpretation of the MST:– Refer for CHF managementRefer for CHF management– Consider Pulmonary DiseaseConsider Pulmonary Disease
» Breathing Reserve < 30%Breathing Reserve < 30%
» Fall in O2 saturation with exerciseFall in O2 saturation with exercise
» Respiratory rate over 60/minRespiratory rate over 60/min
– Consider DeconditioningConsider Deconditioning

Unravelling the Mysteries of the Unravelling the Mysteries of the Metabolic Stress TestMetabolic Stress Test
Interpretation of the MST:Interpretation of the MST:– Refer for CHF managementRefer for CHF management– Consider Pulmonary DiseaseConsider Pulmonary Disease– Consider DeconditioningConsider Deconditioning
» RER < 1.0 = poor effortRER < 1.0 = poor effort
» Failure to reach anaerobic threshholdFailure to reach anaerobic threshhold

Oxygen uptake (VOOxygen uptake (VO22) versus ) versus
treadmill exercise intensitytreadmill exercise intensity