Embed Size (px)
Citation preview
Expe
rim
enta
lPhy
siol
ogy
Exp Physiol 99.2 (2014) pp 403–413 403
Research PaperResearch Paper
Exercise training effects on hypoxic and hypercapnicventilatory responses in mice selected for increasedvoluntary wheel running
Scott A. Kelly1,2, Enrico L. Rezende1, Mark A. Chappell1, Fernando R. Gomes1, Erik M. Kolb1,Jessica L. Malisch1, Justin S. Rhodes3, Gordon S. Mitchell4 and Theodore Garland Jr1
1Department of Biology, University of California, Riverside, Riverside, CA 92521, USA2Department of Zoology, Ohio Wesleyan University, Delaware, OH 43015, USA3Deptartment of Psychology, Beckman Institute, University of Illinois, Urbana, IL 61801, USA4Department of Comparative Biosciences, University of Wisconsin, School of Veterinary Medicine, Madison, WI 53706, USA
New Findings� What is the central question of this study?
We used experimental evolution to determine how selective breeding for high voluntary wheelrunning and exercise training (7–11 weeks) affect ventilatory chemoreflexes of laboratory miceat rest.
� What is the main finding and its importance?Selective breeding, although significantly affecting some traits, did not systematically alterventilation across gas concentrations. As with most human studies, our findings support theidea that endurance training attenuates resting ventilation. However, little evidence was foundfor a correlation between ventilatory chemoreflexes and the amount of individual voluntarywheel running. We conclude that exercise ‘training’ alters respiratory behaviours, but thesechanges may not be necessary to achieve high levels of wheel running.
Ventilatory control is affected by genetics, the environment and gene–environment and gene–gene interactions. Here, we used an experimental evolution approach to test whether 37generations of selective breeding for high voluntary wheel running (genetic effects) and/orlong-term (7–11 weeks) wheel access (training effects) alter acute respiratory behaviour of miceresting in normoxic, hypoxic and hypercapnic conditions. As the four replicate high-runner (HR)lines run much more than the four non-selected control (C) lines, we also examined whetherthe amount of exercise among individual mice was a quantitative predictor of ventilatorychemoreflexes at rest. Selective breeding and/or wheel access significantly affected several traits.In normoxia, HR mice tended to have lower mass-adjusted rates of oxygen consumption andcarbon dioxide production. Chronic wheel access increased oxygen consumption and carbondioxide production in both HR and C mice during hypercapnia. Breathing frequency and minuteventilation were significantly reduced by chronic wheel access in both HR and C mice duringhypoxia. Selection history, while significantly affecting some traits, did not systematically alterventilation across all gas concentrations. As with most human studies, our findings support theidea that endurance training (access to wheel running) attenuates resting ventilation. However,little evidence was found for a correlation at the level of the individual variation betweenventilatory chemoreflexes and performance (amount of individual voluntary wheel running).
C© 2013 The Authors. Experimental Physiology C© 2013 The Physiological Society DOI: 10.1113/expphysiol.2013.076018
) at California Digital Library on March 7, 2014ep.physoc.orgDownloaded from Exp Physiol (
404 S. A. Kelly and others Exp Physiol 99.2 (2014) pp 403–413
We tentatively conclude that exercise ‘training’ alters respiratory behaviours, but these changesmay not be necessary to achieve high levels of wheel running.
(Received 27 August 2013; accepted after revision 18 October 2013; first published online 18 October 2013)Corresponding author S. A. Kelly: Ohio Wesleyan University, Schimmel/Conrades Science Center #346, 61 S. SanduskyStreet, Delaware, OH 43015, USA. Email: [email protected]
Introduction
Complex traits, such as ventilatory behaviour, areregulated by multiple genetic and environmentalinfluences. For example, genetic influences on ventilatorycontrol have been reported in both humans (Hirshmanet al. 1975; Sahn et al. 1977; Collins et al. 1978) androdents (Strohl et al. 1997; Han & Strohl, 2000; Tankersley,2001; Strohl, 2003; Yamaguchi et al. 2003; Tankersley &Broman, 2004; Balbir et al. 2007). Respiratory controlis also affected by experience (i.e. phenotypic plasticity;Mitchell & Johnson, 2003; Kelly et al. 2012). Endurance-trained human athletes exhibit attenuated hypoxic andhypercapnic ventilatory responses at rest, demonstratingdiminished chemoreflex responses (Byrne-Quinn et al.1971; Mirayama et al. 1976; Scoggin et al. 1978; forreview see Dempsey et al. 1984, 1985). However, itis unclear whether these correlations result from acausal relationship (i.e. exercise training reduces restingchemoresponsiveness) or if they are both connected toa common factor (i.e. the same genetic or experience-related factors affect both the exercise ventilatory responseand resting chemoresponsiveness). A major goal of thepresent study was to distinguish between genetic andexercise-training (access to wheel running) effects onresting ventilatory responses to hypoxia and hypercapniaby taking advantage of a rodent model selectively bredfor high levels of voluntary wheel running (Swallowet al. 1998a,b; Rhodes et al. 2005; Careau et al. 2013).We also investigated possible non-additive effects ofselective breeding and exercise, meaning genotype-by-environment interactions.
Although exercise training is associated with alterationsin ventilatory control at rest, it is unknown whetherthese effects enhance exercise performance [here, definedas the amount of wheel running; see Rezende et al.2005, 2006a,b; Meek et al. 2009 for associations betweenamount of wheel running, maximal rates of oxygenconsumption (VO2 max) and treadmill endurance]. Thereare conflicting reports concerning relationships betweenthe resting acute hypoxic ventilatory response (AHVR)and VO2 max in humans; while Byrne-Quinn et al. (1971)observed a positive correlation between the resting AHVRand VO2 max, Sheel et al. (2006) could not confirm thisrelationship in human subjects with variable aerobiccapacities [highly trained (≥60 ml O2 kg−1 min−1),moderately trained (50–60 ml O2 kg−1 min−1), anduntrained (<50 ml O2 kg−1 min−1)]. Thus, another goal of
the present study was to test the hypothesis that diminishedchemoreflex responses at rest are associated with increasedexercise performance.
We used an experimental evolution approach (Garland& Rose, 2009) to determine whether ventilatorychemoreflexes at rest are affected by selective breeding forhigh voluntary wheel running versus exercise training perse (wheel availability). The replicated selection experimentbegan in 1993 from an outbred, genetically variable basepopulation of mice (Hsd:ICR; Swallow et al. 1998a).By generation 16, high-running (HR) lines showed anincrease of ∼170% in total revolutions per day comparedwith control (C lines), with little further change insubsequent generations (Careau et al. 2013). Increasedrunning was primarily due to faster, more intermittentrunning in HR mice, rather than a greater amount of timespent running (Girard et al. 2001). However, the relativeimportance of the two components differs somewhatbetween the sexes, with HR males showing more of anincrease in running duration than HR females (Swallowet al. 1998a; Garland et al. 2011a). Even when deniedaccess to running wheels, the HR lines differ from theircontrol lines in a number of morphological, physiologicaland behavioural traits, including increased VO2 max (Kolbet al. 2010 and references therein), increased open-fieldturning behaviour (Bronikowski et al. 2001) and home-cage activity (Malisch et al. 2009), and altered braindopaminergic function (Rhodes et al. 2001, 2005; Rhodes& Garland, 2003).
Methods
Animals
All procedures in this study were approved by and are inaccordance with guidelines set forth by the InstitutionalAnimal Care and Use Committee at The University ofCalifornia, Riverside. Mice used in this study were fromgeneration 37 of the artificial selection experiment forhigh voluntary wheel-running activity (for full details,see Swallow et al. 1998a; Careau et al. 2013). Twelvefemales from each of the eight lines (four HR and fourC; n = 96) were randomly chosen at weaning (21 days ofage) and were not administered the usual 6 day wheeltest. All individuals from each line came from a differentfamily, with the exception of one selected line that wasrepresented by only nine families. Mice were maintainedin randomly assigned, same-sex groups of four in standard
C© 2013 The Authors. Experimental Physiology C© 2013 The Physiological Society
) at California Digital Library on March 7, 2014ep.physoc.orgDownloaded from Exp Physiol (
Exp Physiol 99.2 (2014) pp 403–413 Artificial selection, exercise and ventilatory chemoreflexes 405
cages. Water and food [Harlan Teklad Laboratory Rodentdiet (W) 8604, Placentia, CA, USA] were provided adlibitum, photoperiod was a constant 12 h–12 h light–dark(lights on at 07.00 h), and rooms were controlled fortemperature (∼22◦C).
At 74–81 days of age (mean, 79 days), mice wereweighed, placed into individual cages, and either granted(active) or denied (sedentary) access to a wheel (1.12 mcircumference, Wahman-type; Lafayette Instruments,Lafayette, IN, USA). Thus, the following four groups ofadult mice were compared: C lines housed without wheels(Sedentary C, n = 24); C lines housed with wheels (ActiveC, n = 24); HR lines housed without wheels (SedentaryHR, n = 24); and HR lines housed with wheels (ActiveHR, n = 24). The treatment was maintained for 13–14 weeks (7–11 weeks prior to ventilation assessment).Wheel running was recorded daily, in 1 min bins for∼23 h, for the duration of the experiment using photocellcounters interfaced with computers. Wheels were checkeddaily to remove food pellets and wood shavings and toensure freedom of rotation.
Ventilation measurements
Seven to eleven weeks after the start of the experiment,ventilatory responses to acute hypoxia (10% O2 andbalance N2) and hypercapnia (21% O2, 5% CO2 andbalance N2) were measured using a flow-through, whole-body plethysmograph (e.g. Drorbaugh & Fenn, 1955;Chappell, 1985; Szewczak & Powell, 2003). Due tologistical constraints and to minimize any time-of-dayeffects, mice were processed in batches (n = 8). Mice(n = 12) were randomly assigned to each batch, withthe constraint that each line was represented at leastonce and half of the mice were assigned to the wheelaccess group (not all from one linetype). Thus, any effectspotentially introduced by the variation in the length ofwheel access (7–11 weeks) were equally distributed acrossall experimental groups.
When assessing ventilation in unrestrained andunanaesthetized mice, behaviour is critically importantto the accuracy of the resting measurements. To minimizeconfounding effects of exposure to a novel environment(e.g. Hennessy, 1991), each mouse had constant accessto an open metabolic chamber (500 ml) placed in itscage 1 week before trials began. This chamber remainedin the cage for the duration of the experiment and wasused during all ventilation trials for that animal. Eachmouse was also acclimated to the chamber with normoxicconditions (flow 1 l min−1 ± 1%) for 1 h, 1 day prior tomeasurements.
On each measurement day, prior to placement ina metabolic chamber, mice were weighed, and bodytemperature (±0.1◦C) was measured using a rectal
thermocouple connected to a Baily BAT-12 thermometer(Sensortek Inc., Fort Wayne, IN, USA). Animals werethen allowed to acclimate to the plethysmograph forat least 60 min (flow 1 l min−1 ± 1%) and to becomequiescent before data collection began. A differentialpressure transducer (PT-100; Sable Systems International,Inc., Las Vegas, NV, USA) was connected to the chamber,and baseline measurements of ventilation (normoxia)were performed for 6 min. Baseline measurements wererepeated prior to exposure to each gas exposure, and allresponses were assessed relative to corresponding baselinevalues. Following baseline measurements, the chamberwas flushed for 3 min with hypoxic or hypercapnic gas,and ventilation was assessed for an additional 6 min.A ‘washout’ period of 3 min was allowed betweennormoxia and experimental gas concentrations. Flow rate(1 l min−1 ± 1%) was maintained with a Tylan massflow controller (Mykrolis Corporation, Billerica, MA,USA), relative chamber relative humidity and temperaturewere constantly monitored with a dew point meter (RH-100; Sable Systems), and temperature was continuouslymonitored (TC-1000; Sable Systems). Gas concentrationswere continuously monitored with O2 and CO2 analysers(S-3A from AEI Technologies, Pittsburgh, PA, USA; andCA-2A from Sable Systems, respectively) to ensure stablegas concentrations during measurements. The system wascalibrated for tidal volume measurements immediatelyafter each trial by repeatedly injecting a known volumeof air (0.5 ml) into the chamber at rates approximatelymatching inhalation cycles. Animals were then removedfrom the chamber, and final body temperature wasassessed.
For each mouse, exposure to the two experimentalgas concentrations occurred on two consecutive days tominimize carry-over effects and, to reduce stress, theorder of gas exposure was always hypoxia followed byhypercapnia. To ameliorate possible detraining effects,mice were returned to their original conditions (wheel orno wheel) following each measurement day. Given that thetotal blood volume for a mouse (weighing 25 g) is ∼2 ml(Wish et al. 1950), arterial blood gases were not assessed(see also Tankersley et al. 1994).
Metabolic measurements
Oxygen consumption (VO2 ; in millilitres per minute)and carbon dioxide production (VCO2 ; in millilitres perminute) were monitored while measuring ventilation.Excurrent air from the chamber was sampled at∼100 ml min−1, dried with magnesium perchlorate,passed through a CO2 analyser (CA-2a; Sable Systems),scrubbed of CO2 (soda lime), redried and, finally,passed through an O2 analyser (S-3A; AEI Technologies,Pittsburgh, PA, USA).
C© 2013 The Authors. Experimental Physiology C© 2013 The Physiological Society
) at California Digital Library on March 7, 2014ep.physoc.orgDownloaded from Exp Physiol (
406 S. A. Kelly and others Exp Physiol 99.2 (2014) pp 403–413
Data acquisition
All data (ventilation and metabolic measurements)were collected automatically (125 Hz) using ‘Labhelper’software (www.warthog.ucr.edu) and analysed with‘LabAnalyst’ software (www.warthog.ucr.edu). Breathingfrequency (f ; in hertz), tidal volume (V T; in millilitres)and minute ventilation (VE; in millilitres per minute)were calculated according to Malan (1973); we assumedthat lung temperature was 37◦C and that gas in therespiratory tract was 100% saturated with water vapour.Although data collection was continuous through the15 min trial, data were analysed only when animals werequiescent and exhibited stable breathing patterns. Withinthe first 6 min (baseline conditions), a 15 s representativesample was chosen to determine f , V T, VE, VO2 andVCO2 . During the final 6 min of exposure to experimentalgases, two 15 s periods were chosen for analysis, oneduring the initial 2 min and one during the final 4 min.This was done because of the known biphasic hypoxicventilatory response in mice, which consists of an initialhyperventilatory response to acute hypoxic stimulusfollowed by a reduction in ventilation within 2–3 minbelow the peak level (roll-off) (e.g. see Hoop et al. 1999).For a graphical representation of the procedure describedabove, see Fig. 1.
Statistical analysis
Changes in ventilatory variables were assessed duringgas exposures (normoxia, hypoxia and hypercapnia) andwere related to selection history or activity conditionby use of a repeated-measures analysis of covariance(ANCOVA) in SAS (SAS Institute, Cary, NC, USA).Here, we are addressing whether ventilatory variableswithin a given gas exposure are altered by effects ofgenetics (HR versus C, in the absence of wheels), theenvironment (wheels versus no wheels) and/or the amountof exposure time (sample). Using the present approach,we can also examine all potential interactions betweenthe main grouping factors. The three main groupingfactors linetype (HR versus C), activity (wheel accessversus no wheel access) and sample (the phase of theexposure to test gases) were considered fixed effects. Trialsconsisted of three samples (normoxia, initial 2 min ofgas exposure and final 4 min of gas exposure; Fig. 1),taken during two separate gas concentrations, resultingin a total of six samples. Sample-by-activity, sample-by-linetype, activity-by-linetype and sample-by-activity-by-linetype interactions were also examined. The variancein the ventilatory traits was assumed to be constant,and the multiple measurements were autocorrelated.Therefore, an autoregressive covariance structure wasused, because it assumes homogeneous variances thatdecline exponentially with distance. Body mass (log10
transformed), VO2 , age, time and batch (never statisticallysignificant) were included as additional covariates, whereapplicable. These analyses revealed significant highest-order interactions (selection-by-sample-by-activity) forsome traits (e.g. breathing frequency, P = 0.0337); thus,for simplicity, each gas concentration trial was consideredseparately. Repeated-measures analyses assessed the effectsof activity (wheels versus no wheels) and selection history(HR versus C) on varying ventilatory patterns within agas trial (normoxia versus experimental gas). Significancewas judged at the level of P = 0.05. In accordance withprevious studies of these lines of mice (e.g. Houle-Leoryet al. 2000), interaction terms were deemed significant at orbelow P = 0.1, because ANOVAs typically have relativelylow power to detect interactions (Wahlsten, 1990, 1991).
We also used one-way and two-way analysis of variance(ANOVA) to test for effects of other factors (e.g. wheelrunning, body mass and body temperature) on ventilatorypatterns. For mice housed with wheel access, we testedwhether the individual variation in running during thefinal week of wheel access (performance) was associatedwith ventilatory patterns. To accomplish this, we usedmethods previously outlined by Garland & Kelly (2006; seetheir Table 2 and accompanying text). Briefly, we used SASProcedure Mixed to implement a mixed-model, nestedANOVA (or ANCOVA if such covariates as age or bodymass are included in the model), in which replicate line isa random effect nested within line type (HR or C). Withinthe active group (with wheel access), we tested whether amodel that does or does not include the amount of wheelrunning as an additional covariate fits the data better.
Results
Wheel running
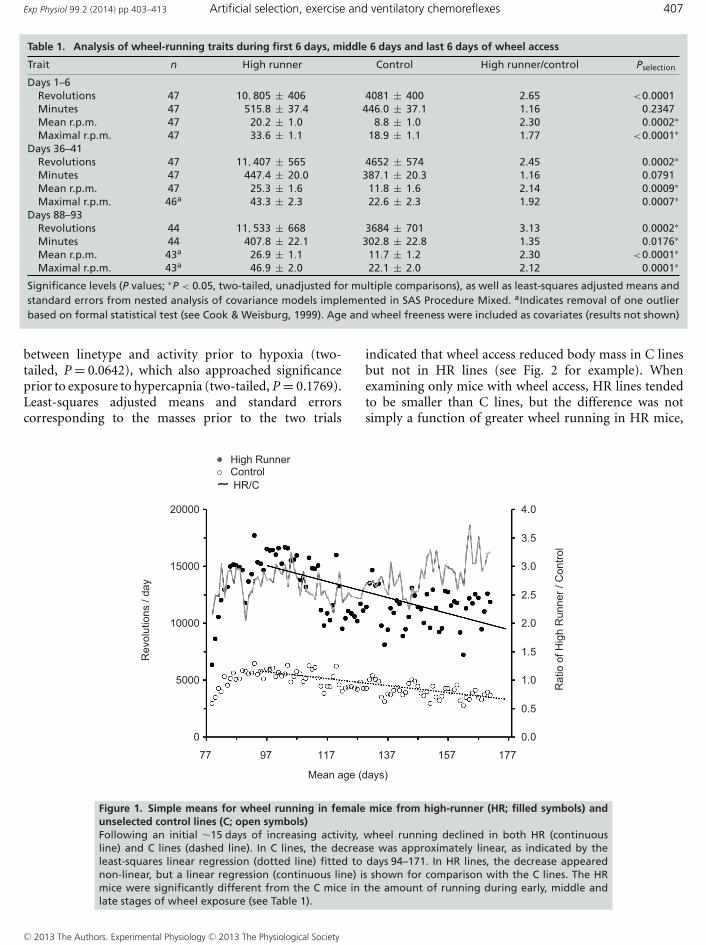
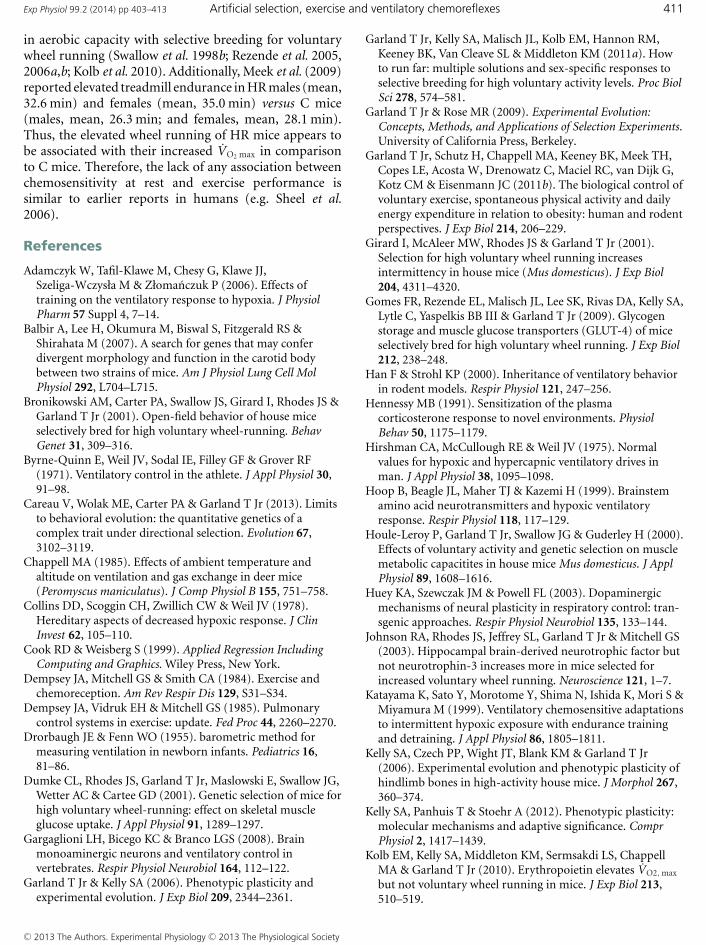
The HR lines ran more than C on the wheels (Table 1),and their increased running was primarily attributableto increased running speed rather than running time,as reported previously (e.g. Girard et al. 2001; Koteja& Garland 2001; Kelly et al. 2006; Malisch et al. 2009;Garland et al. 2011a). Both HR and C mice increased totalrevolutions run from day 1 to 20, which then declined asthe study continued (Fig. 1), similar to previous studieson these lines of mice (e.g. Koteja et al. 1999; Dumke et al.2001; Morgan et al. 2003).
Body temperature and mass
Body temperature (both pre- and postventilationmeasurements) was unaffected by any factor in thisstudy (P > 0.05; results not shown). Mice from HRlines were lighter than C mice, as has been reportedpreviously (e.g. Swallow et al. 1999). For body mass, two-way nested ANCOVAs indicated a significant interaction
C© 2013 The Authors. Experimental Physiology C© 2013 The Physiological Society
) at California Digital Library on March 7, 2014ep.physoc.orgDownloaded from Exp Physiol (
Exp Physiol 99.2 (2014) pp 403–413 Artificial selection, exercise and ventilatory chemoreflexes 407
Table 1. Analysis of wheel-running traits during first 6 days, middle 6 days and last 6 days of wheel access
Trait n High runner Control High runner/control Pselection
Days 1–6Revolutions 47 10, 805 ± 406 4081 ± 400 2.65 <0.0001Minutes 47 515.8 ± 37.4 446.0 ± 37.1 1.16 0.2347Mean r.p.m. 47 20.2 ± 1.0 8.8 ± 1.0 2.30 0.0002∗Maximal r.p.m. 47 33.6 ± 1.1 18.9 ± 1.1 1.77 <0.0001∗
Days 36–41Revolutions 47 11, 407 ± 565 4652 ± 574 2.45 0.0002∗Minutes 47 447.4 ± 20.0 387.1 ± 20.3 1.16 0.0791Mean r.p.m. 47 25.3 ± 1.6 11.8 ± 1.6 2.14 0.0009∗Maximal r.p.m. 46a 43.3 ± 2.3 22.6 ± 2.3 1.92 0.0007∗
Days 88–93Revolutions 44 11, 533 ± 668 3684 ± 701 3.13 0.0002∗Minutes 44 407.8 ± 22.1 302.8 ± 22.8 1.35 0.0176∗Mean r.p.m. 43a 26.9 ± 1.1 11.7 ± 1.2 2.30 <0.0001∗Maximal r.p.m. 43a 46.9 ± 2.0 22.1 ± 2.0 2.12 0.0001∗
Significance levels (P values; ∗P < 0.05, two-tailed, unadjusted for multiple comparisons), as well as least-squares adjusted means andstandard errors from nested analysis of covariance models implemented in SAS Procedure Mixed. aIndicates removal of one outlierbased on formal statistical test (see Cook & Weisburg, 1999). Age and wheel freeness were included as covariates (results not shown)
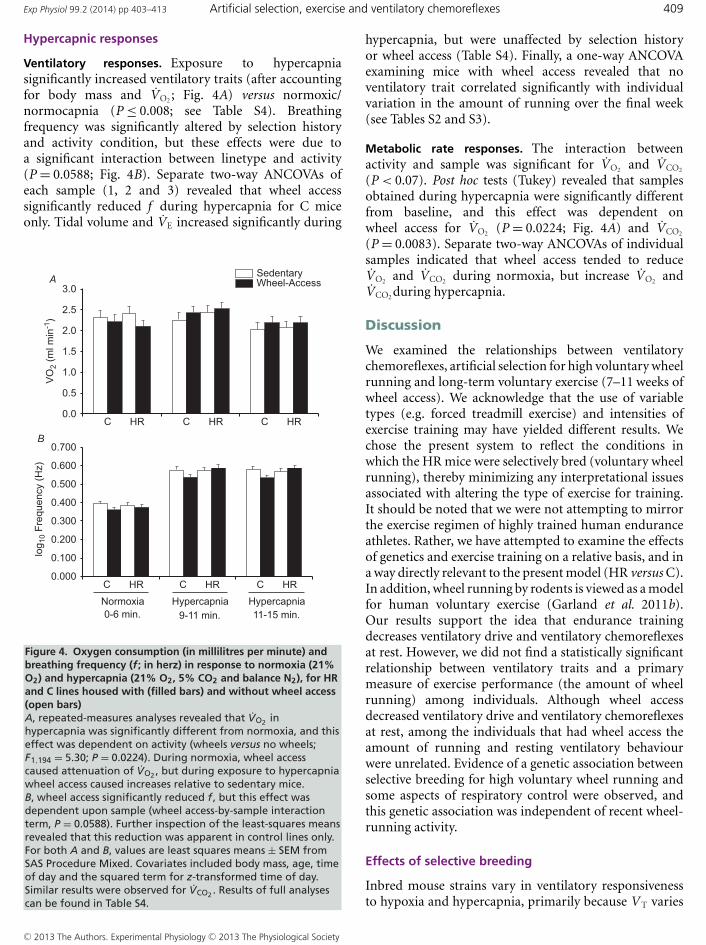
between linetype and activity prior to hypoxia (two-tailed, P = 0.0642), which also approached significanceprior to exposure to hypercapnia (two-tailed, P = 0.1769).Least-squares adjusted means and standard errorscorresponding to the masses prior to the two trials
indicated that wheel access reduced body mass in C linesbut not in HR lines (see Fig. 2 for example). Whenexamining only mice with wheel access, HR lines tendedto be smaller than C lines, but the difference was notsimply a function of greater wheel running in HR mice,
0
5000
10000
15000
20000
77 97 117 137 157 177
0.0
0.5
1.0
1.5
2.0
2.5
3.0
3.5
4.0
Mean age (days)
Rev
olut
ions
/ da
y
High Runner Control HR/C
Rat
io o
f Hig
h R
unne
r / C
ontro
l
Figure 1. Simple means for wheel running in female mice from high-runner (HR; filled symbols) andunselected control lines (C; open symbols)Following an initial ∼15 days of increasing activity, wheel running declined in both HR (continuousline) and C lines (dashed line). In C lines, the decrease was approximately linear, as indicated by theleast-squares linear regression (dotted line) fitted to days 94–171. In HR lines, the decrease appearednon-linear, but a linear regression (continuous line) is shown for comparison with the C lines. The HRmice were significantly different from the C mice in the amount of running during early, middle andlate stages of wheel exposure (see Table 1).
C© 2013 The Authors. Experimental Physiology C© 2013 The Physiological Society
) at California Digital Library on March 7, 2014ep.physoc.orgDownloaded from Exp Physiol (
408 S. A. Kelly and others Exp Physiol 99.2 (2014) pp 403–413
given that HR lines were significantly smaller (P < 0.05)for sedentary mice. Therefore, body mass was used as acovariate for all ventilation and metabolic analyses.
Hypoxic responses
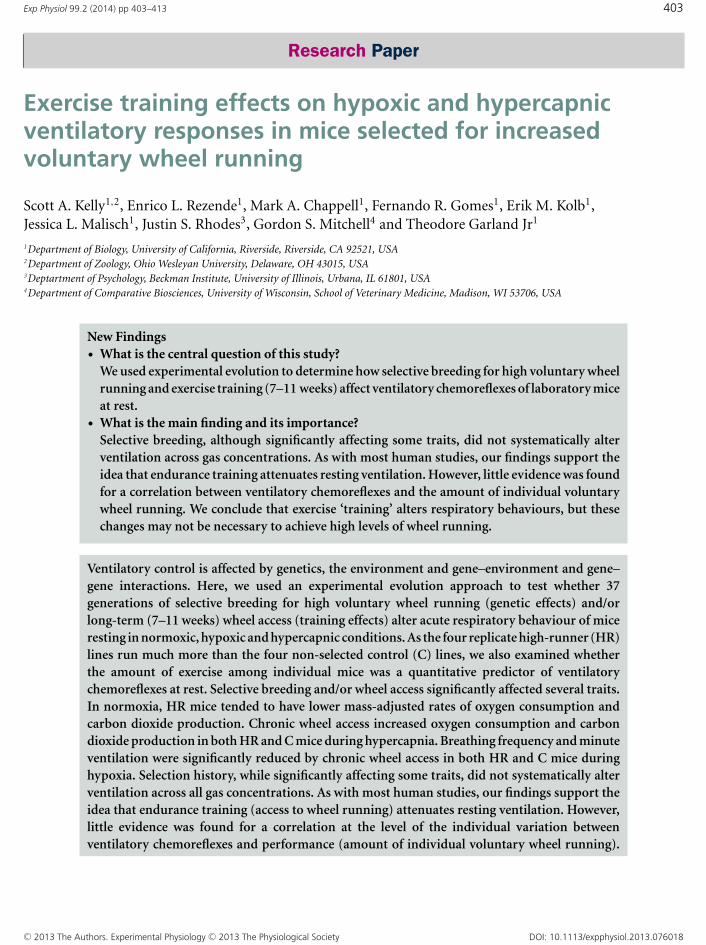
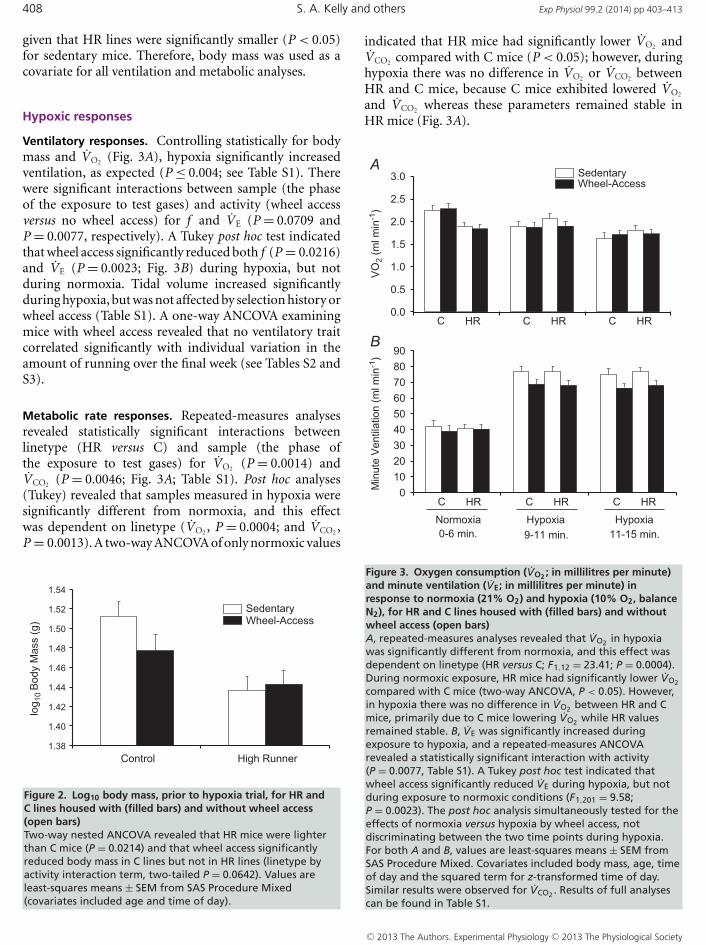
Ventilatory responses. Controlling statistically for bodymass and VO2 (Fig. 3A), hypoxia significantly increasedventilation, as expected (P ≤ 0.004; see Table S1). Therewere significant interactions between sample (the phaseof the exposure to test gases) and activity (wheel accessversus no wheel access) for f and VE (P = 0.0709 andP = 0.0077, respectively). A Tukey post hoc test indicatedthat wheel access significantly reduced both f (P = 0.0216)and VE (P = 0.0023; Fig. 3B) during hypoxia, but notduring normoxia. Tidal volume increased significantlyduring hypoxia, but was not affected by selection history orwheel access (Table S1). A one-way ANCOVA examiningmice with wheel access revealed that no ventilatory traitcorrelated significantly with individual variation in theamount of running over the final week (see Tables S2 andS3).
Metabolic rate responses. Repeated-measures analysesrevealed statistically significant interactions betweenlinetype (HR versus C) and sample (the phase ofthe exposure to test gases) for VO2 (P = 0.0014) andVCO2 (P = 0.0046; Fig. 3A; Table S1). Post hoc analyses(Tukey) revealed that samples measured in hypoxia weresignificantly different from normoxia, and this effectwas dependent on linetype (VO2 , P = 0.0004; and VCO2 ,P = 0.0013). A two-way ANCOVA of only normoxic values
1.38
1.40
1.42
1.44
1.46
1.48
1.50
1.52
1.54
Sedentary Wheel-Access
Control High Runner
log 1
0 B
ody
Mas
s (g
)
Figure 2. Log10 body mass, prior to hypoxia trial, for HR andC lines housed with (filled bars) and without wheel access(open bars)Two-way nested ANCOVA revealed that HR mice were lighterthan C mice (P = 0.0214) and that wheel access significantlyreduced body mass in C lines but not in HR lines (linetype byactivity interaction term, two-tailed P = 0.0642). Values areleast-squares means ± SEM from SAS Procedure Mixed(covariates included age and time of day).
indicated that HR mice had significantly lower VO2 andVCO2 compared with C mice (P < 0.05); however, duringhypoxia there was no difference in VO2 or VCO2 betweenHR and C mice, because C mice exhibited lowered VO2
and VCO2 whereas these parameters remained stable inHR mice (Fig. 3A).
0.0
0.5
1.0
1.5
2.0
2.5
3.0
VO
2 (m
l min
-1)
Sedentary Wheel-Access
C HR C HR C HR
A
0 10 20 30 40 50 60 70 80 90
B
Min
ute
Ven
tilat
ion
(ml m
in-1
)
Normoxia Hypoxia Hypoxia 0-6 min. 9-11 min. 11-15 min.
C HR C HR C HR
Figure 3. Oxygen consumption (VO2 ; in millilitres per minute)and minute ventilation (VE; in millilitres per minute) inresponse to normoxia (21% O2) and hypoxia (10% O2, balanceN2), for HR and C lines housed with (filled bars) and withoutwheel access (open bars)A, repeated-measures analyses revealed that VO2 in hypoxiawas significantly different from normoxia, and this effect wasdependent on linetype (HR versus C; F1,12 = 23.41; P = 0.0004).During normoxic exposure, HR mice had significantly lower VO2
compared with C mice (two-way ANCOVA, P < 0.05). However,in hypoxia there was no difference in VO2 between HR and Cmice, primarily due to C mice lowering VO2 while HR valuesremained stable. B, VE was significantly increased duringexposure to hypoxia, and a repeated-measures ANCOVArevealed a statistically significant interaction with activity(P = 0.0077, Table S1). A Tukey post hoc test indicated thatwheel access significantly reduced VE during hypoxia, but notduring exposure to normoxic conditions (F1,201 = 9.58;P = 0.0023). The post hoc analysis simultaneously tested for theeffects of normoxia versus hypoxia by wheel access, notdiscriminating between the two time points during hypoxia.For both A and B, values are least-squares means ± SEM fromSAS Procedure Mixed. Covariates included body mass, age, timeof day and the squared term for z-transformed time of day.Similar results were observed for VCO2 . Results of full analysescan be found in Table S1.
C© 2013 The Authors. Experimental Physiology C© 2013 The Physiological Society
) at California Digital Library on March 7, 2014ep.physoc.orgDownloaded from Exp Physiol (
Exp Physiol 99.2 (2014) pp 403–413 Artificial selection, exercise and ventilatory chemoreflexes 409
Hypercapnic responses
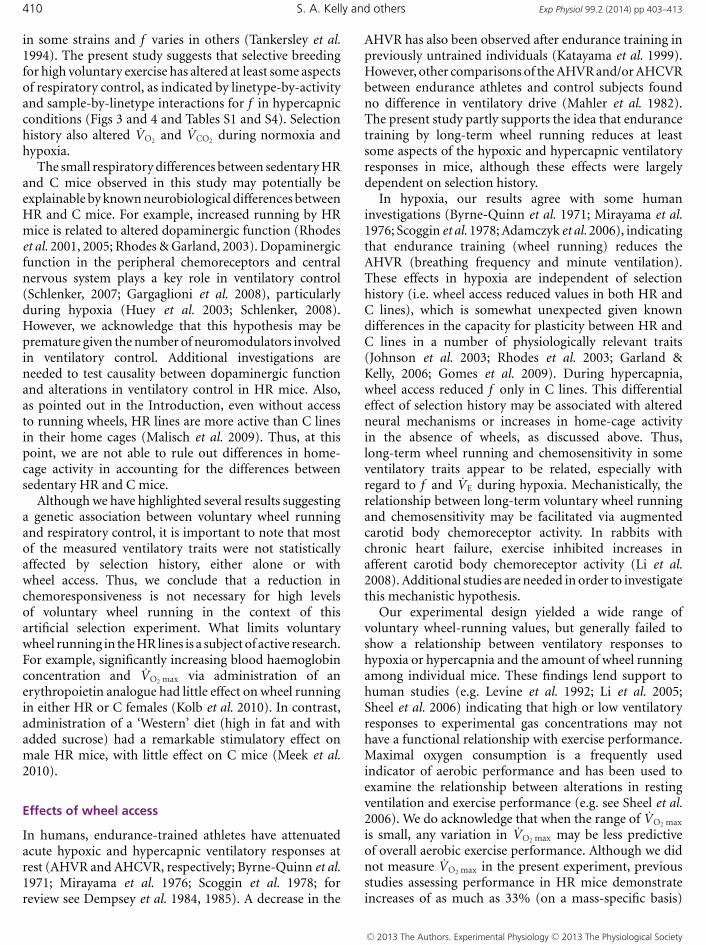
Ventilatory responses. Exposure to hypercapniasignificantly increased ventilatory traits (after accountingfor body mass and VO2 ; Fig. 4A) versus normoxic/normocapnia (P ≤ 0.008; see Table S4). Breathingfrequency was significantly altered by selection historyand activity condition, but these effects were due toa significant interaction between linetype and activity(P = 0.0588; Fig. 4B). Separate two-way ANCOVAs ofeach sample (1, 2 and 3) revealed that wheel accesssignificantly reduced f during hypercapnia for C miceonly. Tidal volume and VE increased significantly during
0.0
0.5
1.0
1.5
2.0
2.5
3.0
1 2 3
VO
2 (m
l min
-1)
A Sedentary Wheel-Access
C HR C HR C HR
0.000
0.100
0.200
0.300
0.400
0.500
0.600
0.700
1 2 3 C HR C HR C HR
log 1
0 Fr
eque
ncy
(Hz)
B
Normoxia Hypercapnia Hypercapnia 0-6 min. 9-11 min. 11-15 min.
Figure 4. Oxygen consumption (in millilitres per minute) andbreathing frequency (f ; in herz) in response to normoxia (21%O2) and hypercapnia (21% O2, 5% CO2 and balance N2), for HRand C lines housed with (filled bars) and without wheel access(open bars)A, repeated-measures analyses revealed that VO2 inhypercapnia was significantly different from normoxia, and thiseffect was dependent on activity (wheels versus no wheels;F1,194 = 5.30; P = 0.0224). During normoxia, wheel accesscaused attenuation of VO2 , but during exposure to hypercapniawheel access caused increases relative to sedentary mice.B, wheel access significantly reduced f , but this effect wasdependent upon sample (wheel access-by-sample interactionterm, P = 0.0588). Further inspection of the least-squares meansrevealed that this reduction was apparent in control lines only.For both A and B, values are least squares means ± SEM fromSAS Procedure Mixed. Covariates included body mass, age, timeof day and the squared term for z-transformed time of day.Similar results were observed for VCO2 . Results of full analysescan be found in Table S4.
hypercapnia, but were unaffected by selection historyor wheel access (Table S4). Finally, a one-way ANCOVAexamining mice with wheel access revealed that noventilatory trait correlated significantly with individualvariation in the amount of running over the final week(see Tables S2 and S3).
Metabolic rate responses. The interaction betweenactivity and sample was significant for VO2 and VCO2
(P < 0.07). Post hoc tests (Tukey) revealed that samplesobtained during hypercapnia were significantly differentfrom baseline, and this effect was dependent onwheel access for VO2 (P = 0.0224; Fig. 4A) and VCO2
(P = 0.0083). Separate two-way ANCOVAs of individualsamples indicated that wheel access tended to reduceVO2 and VCO2 during normoxia, but increase VO2 andVCO2 during hypercapnia.
Discussion
We examined the relationships between ventilatorychemoreflexes, artificial selection for high voluntary wheelrunning and long-term voluntary exercise (7–11 weeks ofwheel access). We acknowledge that the use of variabletypes (e.g. forced treadmill exercise) and intensities ofexercise training may have yielded different results. Wechose the present system to reflect the conditions inwhich the HR mice were selectively bred (voluntary wheelrunning), thereby minimizing any interpretational issuesassociated with altering the type of exercise for training.It should be noted that we were not attempting to mirrorthe exercise regimen of highly trained human enduranceathletes. Rather, we have attempted to examine the effectsof genetics and exercise training on a relative basis, and ina way directly relevant to the present model (HR versus C).In addition, wheel running by rodents is viewed as a modelfor human voluntary exercise (Garland et al. 2011b).Our results support the idea that endurance trainingdecreases ventilatory drive and ventilatory chemoreflexesat rest. However, we did not find a statistically significantrelationship between ventilatory traits and a primarymeasure of exercise performance (the amount of wheelrunning) among individuals. Although wheel accessdecreased ventilatory drive and ventilatory chemoreflexesat rest, among the individuals that had wheel access theamount of running and resting ventilatory behaviourwere unrelated. Evidence of a genetic association betweenselective breeding for high voluntary wheel running andsome aspects of respiratory control were observed, andthis genetic association was independent of recent wheel-running activity.
Effects of selective breeding
Inbred mouse strains vary in ventilatory responsivenessto hypoxia and hypercapnia, primarily because V T varies
C© 2013 The Authors. Experimental Physiology C© 2013 The Physiological Society
) at California Digital Library on March 7, 2014ep.physoc.orgDownloaded from Exp Physiol (
410 S. A. Kelly and others Exp Physiol 99.2 (2014) pp 403–413
in some strains and f varies in others (Tankersley et al.1994). The present study suggests that selective breedingfor high voluntary exercise has altered at least some aspectsof respiratory control, as indicated by linetype-by-activityand sample-by-linetype interactions for f in hypercapnicconditions (Figs 3 and 4 and Tables S1 and S4). Selectionhistory also altered VO2 and VCO2 during normoxia andhypoxia.
The small respiratory differences between sedentary HRand C mice observed in this study may potentially beexplainable by known neurobiological differences betweenHR and C mice. For example, increased running by HRmice is related to altered dopaminergic function (Rhodeset al. 2001, 2005; Rhodes & Garland, 2003). Dopaminergicfunction in the peripheral chemoreceptors and centralnervous system plays a key role in ventilatory control(Schlenker, 2007; Gargaglioni et al. 2008), particularlyduring hypoxia (Huey et al. 2003; Schlenker, 2008).However, we acknowledge that this hypothesis may bepremature given the number of neuromodulators involvedin ventilatory control. Additional investigations areneeded to test causality between dopaminergic functionand alterations in ventilatory control in HR mice. Also,as pointed out in the Introduction, even without accessto running wheels, HR lines are more active than C linesin their home cages (Malisch et al. 2009). Thus, at thispoint, we are not able to rule out differences in home-cage activity in accounting for the differences betweensedentary HR and C mice.
Although we have highlighted several results suggestinga genetic association between voluntary wheel runningand respiratory control, it is important to note that mostof the measured ventilatory traits were not statisticallyaffected by selection history, either alone or withwheel access. Thus, we conclude that a reduction inchemoresponsiveness is not necessary for high levelsof voluntary wheel running in the context of thisartificial selection experiment. What limits voluntarywheel running in the HR lines is a subject of active research.For example, significantly increasing blood haemoglobinconcentration and VO2 max via administration of anerythropoietin analogue had little effect on wheel runningin either HR or C females (Kolb et al. 2010). In contrast,administration of a ‘Western’ diet (high in fat and withadded sucrose) had a remarkable stimulatory effect onmale HR mice, with little effect on C mice (Meek et al.2010).
Effects of wheel access
In humans, endurance-trained athletes have attenuatedacute hypoxic and hypercapnic ventilatory responses atrest (AHVR and AHCVR, respectively; Byrne-Quinn et al.1971; Mirayama et al. 1976; Scoggin et al. 1978; forreview see Dempsey et al. 1984, 1985). A decrease in the
AHVR has also been observed after endurance training inpreviously untrained individuals (Katayama et al. 1999).However, other comparisons of the AHVR and/or AHCVRbetween endurance athletes and control subjects foundno difference in ventilatory drive (Mahler et al. 1982).The present study partly supports the idea that endurancetraining by long-term wheel running reduces at leastsome aspects of the hypoxic and hypercapnic ventilatoryresponses in mice, although these effects were largelydependent on selection history.
In hypoxia, our results agree with some humaninvestigations (Byrne-Quinn et al. 1971; Mirayama et al.1976; Scoggin et al. 1978; Adamczyk et al. 2006), indicatingthat endurance training (wheel running) reduces theAHVR (breathing frequency and minute ventilation).These effects in hypoxia are independent of selectionhistory (i.e. wheel access reduced values in both HR andC lines), which is somewhat unexpected given knowndifferences in the capacity for plasticity between HR andC lines in a number of physiologically relevant traits(Johnson et al. 2003; Rhodes et al. 2003; Garland &Kelly, 2006; Gomes et al. 2009). During hypercapnia,wheel access reduced f only in C lines. This differentialeffect of selection history may be associated with alteredneural mechanisms or increases in home-cage activityin the absence of wheels, as discussed above. Thus,long-term wheel running and chemosensitivity in someventilatory traits appear to be related, especially withregard to f and VE during hypoxia. Mechanistically, therelationship between long-term voluntary wheel runningand chemosensitivity may be facilitated via augmentedcarotid body chemoreceptor activity. In rabbits withchronic heart failure, exercise inhibited increases inafferent carotid body chemoreceptor activity (Li et al.2008). Additional studies are needed in order to investigatethis mechanistic hypothesis.
Our experimental design yielded a wide range ofvoluntary wheel-running values, but generally failed toshow a relationship between ventilatory responses tohypoxia or hypercapnia and the amount of wheel runningamong individual mice. These findings lend support tohuman studies (e.g. Levine et al. 1992; Li et al. 2005;Sheel et al. 2006) indicating that high or low ventilatoryresponses to experimental gas concentrations may nothave a functional relationship with exercise performance.Maximal oxygen consumption is a frequently usedindicator of aerobic performance and has been used toexamine the relationship between alterations in restingventilation and exercise performance (e.g. see Sheel et al.2006). We do acknowledge that when the range of VO2 max
is small, any variation in VO2 max may be less predictiveof overall aerobic exercise performance. Although we didnot measure VO2 max in the present experiment, previousstudies assessing performance in HR mice demonstrateincreases of as much as 33% (on a mass-specific basis)
C© 2013 The Authors. Experimental Physiology C© 2013 The Physiological Society
) at California Digital Library on March 7, 2014ep.physoc.orgDownloaded from Exp Physiol (
Exp Physiol 99.2 (2014) pp 403–413 Artificial selection, exercise and ventilatory chemoreflexes 411
in aerobic capacity with selective breeding for voluntarywheel running (Swallow et al. 1998b; Rezende et al. 2005,2006a,b; Kolb et al. 2010). Additionally, Meek et al. (2009)reported elevated treadmill endurance in HR males (mean,32.6 min) and females (mean, 35.0 min) versus C mice(males, mean, 26.3 min; and females, mean, 28.1 min).Thus, the elevated wheel running of HR mice appears tobe associated with their increased VO2 max in comparisonto C mice. Therefore, the lack of any association betweenchemosensitivity at rest and exercise performance issimilar to earlier reports in humans (e.g. Sheel et al.2006).
References
Adamczyk W, Tafil-Klawe M, Chesy G, Klawe JJ,Szeliga-Wczysła M & Złomanczuk P (2006). Effects oftraining on the ventilatory response to hypoxia. J PhysiolPharm 57 Suppl 4, 7–14.
Balbir A, Lee H, Okumura M, Biswal S, Fitzgerald RS &Shirahata M (2007). A search for genes that may conferdivergent morphology and function in the carotid bodybetween two strains of mice. Am J Physiol Lung Cell MolPhysiol 292, L704–L715.
Bronikowski AM, Carter PA, Swallow JS, Girard I, Rhodes JS &Garland T Jr (2001). Open-field behavior of house miceselectively bred for high voluntary wheel-running. BehavGenet 31, 309–316.
Byrne-Quinn E, Weil JV, Sodal IE, Filley GF & Grover RF(1971). Ventilatory control in the athlete. J Appl Physiol 30,91–98.
Careau V, Wolak ME, Carter PA & Garland T Jr (2013). Limitsto behavioral evolution: the quantitative genetics of acomplex trait under directional selection. Evolution 67,3102–3119.
Chappell MA (1985). Effects of ambient temperature andaltitude on ventilation and gas exchange in deer mice(Peromyscus maniculatus). J Comp Physiol B 155, 751–758.
Collins DD, Scoggin CH, Zwillich CW & Weil JV (1978).Hereditary aspects of decreased hypoxic response. J ClinInvest 62, 105–110.
Cook RD & Weisberg S (1999). Applied Regression IncludingComputing and Graphics. Wiley Press, New York.
Dempsey JA, Mitchell GS & Smith CA (1984). Exercise andchemoreception. Am Rev Respir Dis 129, S31–S34.
Dempsey JA, Vidruk EH & Mitchell GS (1985). Pulmonarycontrol systems in exercise: update. Fed Proc 44, 2260–2270.
Drorbaugh JE & Fenn WO (1955). barometric method formeasuring ventilation in newborn infants. Pediatrics 16,81–86.
Dumke CL, Rhodes JS, Garland T Jr, Maslowski E, Swallow JG,Wetter AC & Cartee GD (2001). Genetic selection of mice forhigh voluntary wheel-running: effect on skeletal muscleglucose uptake. J Appl Physiol 91, 1289–1297.
Gargaglioni LH, Bicego KC & Branco LGS (2008). Brainmonoaminergic neurons and ventilatory control invertebrates. Respir Physiol Neurobiol 164, 112–122.
Garland T Jr & Kelly SA (2006). Phenotypic plasticity andexperimental evolution. J Exp Biol 209, 2344–2361.
Garland T Jr, Kelly SA, Malisch JL, Kolb EM, Hannon RM,Keeney BK, Van Cleave SL & Middleton KM (2011a). Howto run far: multiple solutions and sex-specific responses toselective breeding for high voluntary activity levels. Proc BiolSci 278, 574–581.
Garland T Jr & Rose MR (2009). Experimental Evolution:Concepts, Methods, and Applications of Selection Experiments.University of California Press, Berkeley.
Garland T Jr, Schutz H, Chappell MA, Keeney BK, Meek TH,Copes LE, Acosta W, Drenowatz C, Maciel RC, van Dijk G,Kotz CM & Eisenmann JC (2011b). The biological control ofvoluntary exercise, spontaneous physical activity and dailyenergy expenditure in relation to obesity: human and rodentperspectives. J Exp Biol 214, 206–229.
Girard I, McAleer MW, Rhodes JS & Garland T Jr (2001).Selection for high voluntary wheel running increasesintermittency in house mice (Mus domesticus). J Exp Biol204, 4311–4320.
Gomes FR, Rezende EL, Malisch JL, Lee SK, Rivas DA, Kelly SA,Lytle C, Yaspelkis BB III & Garland T Jr (2009). Glycogenstorage and muscle glucose transporters (GLUT-4) of miceselectively bred for high voluntary wheel running. J Exp Biol212, 238–248.
Han F & Strohl KP (2000). Inheritance of ventilatory behaviorin rodent models. Respir Physiol 121, 247–256.
Hennessy MB (1991). Sensitization of the plasmacorticosterone response to novel environments. PhysiolBehav 50, 1175–1179.
Hirshman CA, McCullough RE & Weil JV (1975). Normalvalues for hypoxic and hypercapnic ventilatory drives inman. J Appl Physiol 38, 1095–1098.
Hoop B, Beagle JL, Maher TJ & Kazemi H (1999). Brainstemamino acid neurotransmitters and hypoxic ventilatoryresponse. Respir Physiol 118, 117–129.
Houle-Leroy P, Garland T Jr, Swallow JG & Guderley H (2000).Effects of voluntary activity and genetic selection on musclemetabolic capacitites in house mice Mus domesticus. J ApplPhysiol 89, 1608–1616.
Huey KA, Szewczak JM & Powell FL (2003). Dopaminergicmechanisms of neural plasticity in respiratory control: tran-sgenic approaches. Respir Physiol Neurobiol 135, 133–144.
Johnson RA, Rhodes JS, Jeffrey SL, Garland T Jr & Mitchell GS(2003). Hippocampal brain-derived neurotrophic factor butnot neurotrophin-3 increases more in mice selected forincreased voluntary wheel running. Neuroscience 121, 1–7.
Katayama K, Sato Y, Morotome Y, Shima N, Ishida K, Mori S &Miyamura M (1999). Ventilatory chemosensitive adaptationsto intermittent hypoxic exposure with endurance trainingand detraining. J Appl Physiol 86, 1805–1811.
Kelly SA, Czech PP, Wight JT, Blank KM & Garland T Jr(2006). Experimental evolution and phenotypic plasticity ofhindlimb bones in high-activity house mice. J Morphol 267,360–374.
Kelly SA, Panhuis T & Stoehr A (2012). Phenotypic plasticity:molecular mechanisms and adaptive significance. ComprPhysiol 2, 1417–1439.
Kolb EM, Kelly SA, Middleton KM, Sermsakdi LS, ChappellMA & Garland T Jr (2010). Erythropoietin elevates VO2, max
but not voluntary wheel running in mice. J Exp Biol 213,510–519.
C© 2013 The Authors. Experimental Physiology C© 2013 The Physiological Society
) at California Digital Library on March 7, 2014ep.physoc.orgDownloaded from Exp Physiol (
412 S. A. Kelly and others Exp Physiol 99.2 (2014) pp 403–413
Koteja P & Garland T Jr (2001). Forum: Response to R.Eikelboom. Anim Behav 61, F25–F26.
Koteja P, Garland T Jr, Sax JN, Swallow JG & Carter PA (1999).Behaviour of house mice artificially selected for high levels ofvoluntary wheel running. Anim Behav 58, 1307–1318.
Levine BD, Friedman DB, Engfred K, Hanel B, Kjaer M,Clifford PS & Secher NH (1992). The effect of normoxic orhypobaric hypoxic endurance training on the hypoxicventilatory response. Med Sci Sports Exerc 24, 769–775.
Li YL, Ding Y, Agnew C & Schulz HD (2008). Exercise trainingimproves peripheral chemoreflex function in heart failurerabbits. J Appl Physiol 105, 782–790.
Li YL, Li YF, Liu D, Cornish KG, Patel KP, Zucker IH, ChannonKM & Schultz HD (2005). Gene transfer of neuronal nitricoxide synthase to carotid body reverses enhancedchemoreceptor function in heart failure rabbits. Circ Res 97,260–267.
Mahler DA, Moritz ED & Loke J (1982). Ventilatory responsesat rest and during exercise in marathon runners. J ApplPhysiol 52, 388–392.
Malan A (1973). Ventilation measured by bodyplethysmograph in hibernating mammals andpoikilotherms. Resp Physiol 17, 32–44.
Malisch JL, Breuner CW, Kolb EM, Wada H, Hannon RM,Chappell MA, Middleton KM & Garland T Jr (2009).Behavioral despair and home-cage activity in mice withchronically elevated baseline corticosterone concentrations.Behav Genet 39, 192–201.
Meek TH, Eisenmann JC & Garland T Jr (2010). Western dietincreases wheel running in mice selectively bred for highvoluntary wheel running. Int J Obes 34, 960–969.
Meek TH, Lonquich BP, Hannon RM & Garland T Jr (2009).Endurance capacity of mice selectively bred for highvoluntary wheel running. J Exp Biol 212, 2908–2917.
Mitchell GS & Johnson SM (2003). Invited Review:Neuroplasticity in respiratory motor control. J Appl Physiol94, 358–374.
Miyamura M, Yamashina T & Honda Y (1976). Ventilatoryresponses to CO2 rebreathing at rest and during exercise inuntrained subjects and athletes. Jpn J Physiol 26, 245–254.
Morgan TJ, Garland T Jr & Carter PA (2003). Ontogenies inmice selected for high voluntary wheel-running activity. I.Mean ontogenies. Evolution 57, 646–657.
Rezende EL, Chappell MA, Gomes FR, Malisch JL & Garland TJr (2005). Maximal metabolic rates during voluntaryexercise, forced exercise, and cold exposure in house miceselectively bred for high wheel-running. J Exp Biol 208,2447–2458.
Rezende EL, Gomes FR, Malisch JL, Chappell MA & Garland TJr (2006a). Maximal oxygen consumption in relation tosubordinate traits in lines of house mice selectively bred forhigh voluntary wheel running. J Appl Physiol 101, 477–485.
Rezende EL, Kelly SA, Gomes FR, Chappell MA & Garland T Jr(2006b). Effects of size, sex, and voluntary running speeds oncosts of locomotion in lines of laboratory mice selectivelybred for high wheel-running activity. Physiol Biochem Zool79, 83–99.
Rhodes JS, Gammie SC & Garland T Jr (2005). Neurobiologyof mice selected for high voluntary wheel-running activity.Integr Comp Biol 45, 438–455.
Rhodes JS & Garland T Jr (2003). Differential sensitivity toacute administration of Ritalin, apormorphine, SCH 23390,but not raclopride in mice selectively bred for hyperactivewheel-running behavior. Psychopharmacology 167,242–250.
Rhodes JS, Hosack GR, Girard I, Kelly AE, Mitchell GS &Garland T Jr (2001). Differential sensitivity to acuteadministration of cocaine, GBR 12909, and fluoxetine inmice selected for hyperactive wheel-running behavior.Psychopharmacology 158, 120–131.
Rhodes JS, van Praag H, Jeffrey S, Girard I, Mitchell GS,Garland T Jr & Gage FH (2003). Exercise increaseshippocampal neurogenesis to high levels but does notimprove spatial learning in mice bred for increased voluntarywheel running. Behav Neurosci 117, 1006–1016.
Sahn SA, Zwillich CW, Dick N, McCullough RE,Lakshminarayan S & Weil JV (1977). Variability ofventilatory responses to hypoxia and hypercapnia. J ApplPhysiol 43, 1019–1025.
Schlenker EH (2007). In hamsters dopamine D2 receptorsaffect ventilation during and following intermittent hypoxia.Comp Biochem Physiol A Mol Integr Physiol 148, 674–680.
Schlenker EH (2008). In hamsters the D1 receptor antagonistSCH23390 depresses ventilation during hypoxia. Brain Res1187, 146–153.
Scoggin CH, Doekel RD, Kryger MH, Zwillich CW & Weil JV(1978). Familial aspects of decreased hypoxic drive inendurance athletes. J Appl Physiol 44, 464–468.
Sheel AW, Koehle MS, Guenette JA, Foster GF, Sporer BC, DiepTT & McKenzie DC (2006). Human ventilatoryresponsiveness to hypoxia is unrelated to maximal aerobiccapacity. J Appl Physiol 100, 1204–1209.
Strohl KP (2003). Periodic breathing and genetics. RespirPhysiol Neurobiol 135, 179–185.
Strohl KP, Thomas AJ, St Jean P, Schlenker EH, Koletsky RJ &Schork NJ (1997). Ventilation and metabolism among ratstrains. J Appl Physiol 82, 317–323.
Swallow JG, Carter PA & Garland T Jr (1998a). Artificialselection for increased wheel-running behavior in housemice. Behav Genet 28, 227–237.
Swallow JG, Garland T Jr, Carter PA, Zhan W-Z & Sieck G(1998b). Effects of voluntary activity and genetic selectionon aerobic capacity in house mice. J Appl Physiol 84, 69–76.
Swallow JG, Koteja P, Carter PA & Garland T Jr (1999).Artificial selection for increased wheel-running activity inhouse mice results in decreased body mass at maturity. J ExpBiol 202, 2513–2520.
Szewczak JM & Powell FL (2003). Open-flow plethysmographywith pressure decay compensation. Respir Physiol Nerobiol134, 57–67.
Tankersley CG (2001). Selected contribution: variation in acutehypoxic ventilatory response is linked to mousechromosome 9. J Appl Physiol 90, 1615–1622.
Tankersley CG & Broman KW (2004). Interactions in hypoxicand hypercapnic breathing are genetically linked to mousechromosomes 1 and 5. J Appl Physiol 97, 77–84.
Tankersley CG, Fitzgerald RS & Kleeberger SR (1994).Differential control of ventilation among inbred strains ofmice. Am J Physiol Regul Integr Comp Physiol 267,R1371–R1377.
C© 2013 The Authors. Experimental Physiology C© 2013 The Physiological Society
) at California Digital Library on March 7, 2014ep.physoc.orgDownloaded from Exp Physiol (
Exp Physiol 99.2 (2014) pp 403–413 Artificial selection, exercise and ventilatory chemoreflexes 413
Wahlsten D (1990). Insensitivity of the analysis of variance toheredity-environment interaction. Behav Brain Sci 13,109–161.
Wahlsten D (1991). Sample size to detect a planned contrastand a one degree-of-freedom interaction effect. Psychol Bull110, 587–595.
Wish L, Furth J & Storey RH (1950). Direct determinations ofplasma, cell, and organ-blood volumes in normal andhypervolemic mice. Proc Soc Exp Biol Med 74, 644–648.
Yamaguchi S, Balbir A, Schofield B, Coram J, Tankersley CG,Fitzgerald RS, O’Donnell CP & Shirahata M (2003).Structural and functional differences of the carotid bodybetween DBA/2J and A/J strains of mice. J Appl Physiol 94,1536–1542.
Additional Information
Competing interests
None declared.
Funding
This work was supported by US NSF grants IOB-0543429and IOS-1121273 to T.G.
Authors’ present addresses
F. R. Gomes: Departamento de Fisiologia – Institutode Biociencias – Universidade de Sao Paulo, Rua doMatao, travessa 14, 321, 05508-090, Sao Paulo/SP,Brasil.E. M. Kolb: Department of Biological Sciences, Universityof Southern California, Los Angeles, CA 90089, USA.
E. L. Rezende: Department of Life Sciences, Universityof Roehampton, Holybourne Avenue, London SW15 4JD,UK.
J. L. Malisch: Keck Science Department, The ClaremontColleges, Claremont, CA 91711, USA.
Supplemental material
The following supporting information is available in theonline version of this article.
Table S1. Repeated-measures analysis of ventilatory traitscomparing the effects of sample (within the hypoxictrial only: normoxia, initial 2 minutes, final 4 minutes),linetype (high runner vs. control), and activity (wheelaccess vs. no wheel access).
Table S2. One-way ANOVA to determine if includingthe amount of wheel running (full model) fits the datasignificantly better than a model that does not includethis covariate (reduced model). The following ventilatorytraits are examined within the within the hypoxic trialonly.
Table S3. One-way ANOVA to determine if includingthe amount of wheel running (full model) fits the datasignificantly better than a model that does not includethis covariate (reduced model). The following ventilatorytraits are examined within the within the hypercapic trialonly.
Table S4. Repeated-measures analysis of ventilatory traitscomparing the effects of sample (within the hypercapnictrial only: normoxia, initial 2 minutes, final 4 minutes),linetype (high runner vs. control), and activity (wheelaccess vs. no wheel access).
C© 2013 The Authors. Experimental Physiology C© 2013 The Physiological Society
) at California Digital Library on March 7, 2014ep.physoc.orgDownloaded from Exp Physiol (
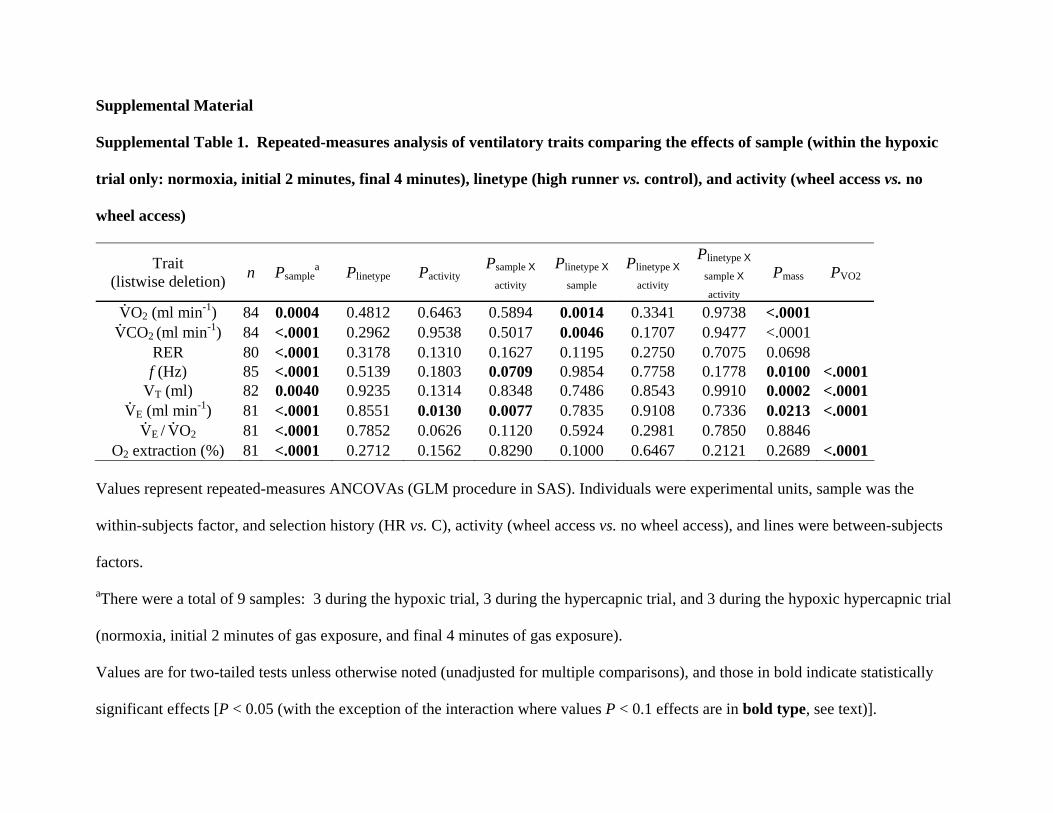
Supplemental Material Supplemental Table 1. Repeated-measures analysis of ventilatory traits comparing the effects of sample (within the hypoxic
trial only: normoxia, initial 2 minutes, final 4 minutes), linetype (high runner vs. control), and activity (wheel access vs. no
wheel access)
Trait (listwise deletion) n Psample
a Plinetype Pactivity Psample X
activity Plinetype X
sample Plinetype X
activity
Plinetype X
sample X
activity Pmass PVO2
V.O2 (ml min-1) 84 0.0004 0.4812 0.6463 0.5894 0.0014 0.3341 0.9738 <.0001
V.CO2 (ml min-1) 84 <.0001 0.2962 0.9538 0.5017 0.0046 0.1707 0.9477 <.0001
RER 80 <.0001 0.3178 0.1310 0.1627 0.1195 0.2750 0.7075 0.0698 f (Hz) 85 <.0001 0.5139 0.1803 0.0709 0.9854 0.7758 0.1778 0.0100 <.0001
VT (ml) 82 0.0040 0.9235 0.1314 0.8348 0.7486 0.8543 0.9910 0.0002 <.0001V.
E (ml min-1) 81 <.0001 0.8551 0.0130 0.0077 0.7835 0.9108 0.7336 0.0213 <.0001V.
E / V.O2 81 <.0001 0.7852 0.0626 0.1120 0.5924 0.2981 0.7850 0.8846
O2 extraction (%) 81 <.0001 0.2712 0.1562 0.8290 0.1000 0.6467 0.2121 0.2689 <.0001 Values represent repeated-measures ANCOVAs (GLM procedure in SAS). Individuals were experimental units, sample was the
within-subjects factor, and selection history (HR vs. C), activity (wheel access vs. no wheel access), and lines were between-subjects
factors.
aThere were a total of 9 samples: 3 during the hypoxic trial, 3 during the hypercapnic trial, and 3 during the hypoxic hypercapnic trial
(normoxia, initial 2 minutes of gas exposure, and final 4 minutes of gas exposure).
Values are for two-tailed tests unless otherwise noted (unadjusted for multiple comparisons), and those in bold indicate statistically
significant effects [P < 0.05 (with the exception of the interaction where values P < 0.1 effects are in bold type, see text)].
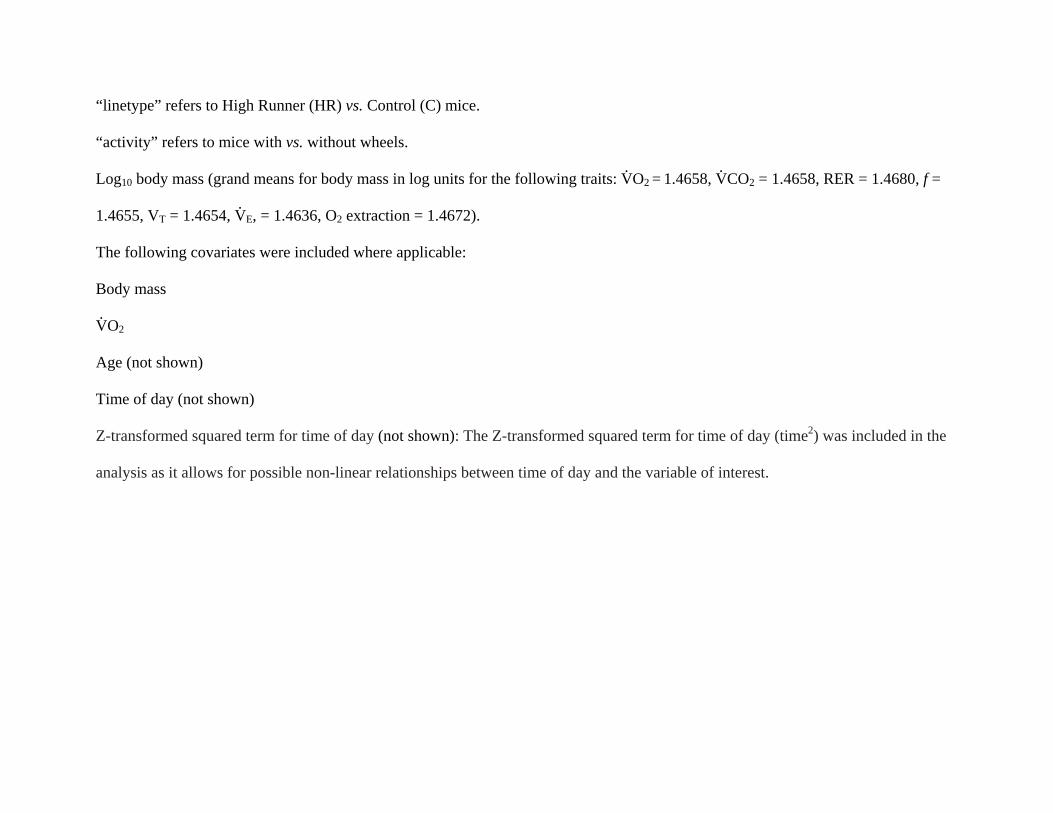
“linetype” refers to High Runner (HR) vs. Control (C) mice.
“activity” refers to mice with vs. without wheels.
Log10 body mass (grand means for body mass in log units for the following traits: V.O2 = 1.4658, V
.CO2 = 1.4658, RER = 1.4680, f =
1.4655, VT = 1.4654, V.
E, = 1.4636, O2 extraction = 1.4672).
The following covariates were included where applicable:
Body mass
V.O2
Age (not shown)
Time of day (not shown)
Z-transformed squared term for time of day (not shown): The Z-transformed squared term for time of day (time2) was included in the
analysis as it allows for possible non-linear relationships between time of day and the variable of interest.
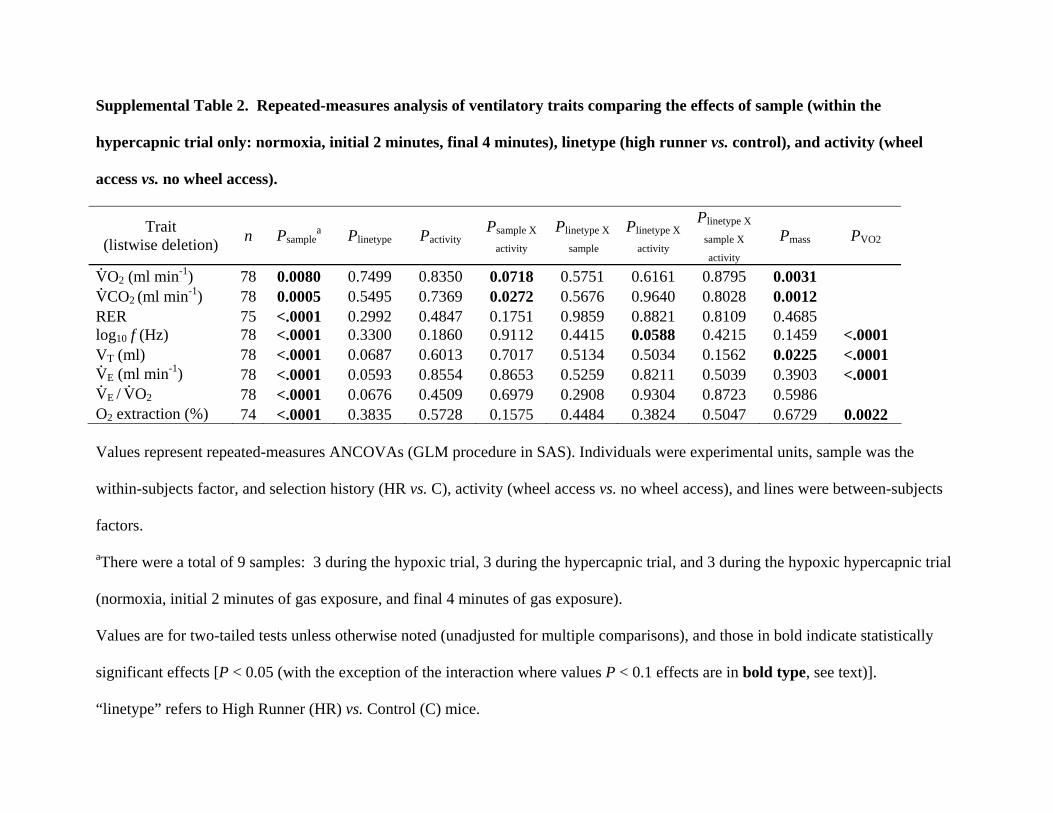
Supplemental Table 2. Repeated-measures analysis of ventilatory traits comparing the effects of sample (within the
hypercapnic trial only: normoxia, initial 2 minutes, final 4 minutes), linetype (high runner vs. control), and activity (wheel
access vs. no wheel access).
Trait (listwise deletion) n Psample
a Plinetype Pactivity Psample X
activity Plinetype X
sample Plinetype X
activity
Plinetype X
sample X
activity Pmass PVO2
V.O2 (ml min-1) 78 0.0080 0.7499 0.8350 0.0718 0.5751 0.6161 0.8795 0.0031
V.CO2 (ml min-1) 78 0.0005 0.5495 0.7369 0.0272 0.5676 0.9640 0.8028 0.0012
RER 75 <.0001 0.2992 0.4847 0.1751 0.9859 0.8821 0.8109 0.4685 log10 f (Hz) 78 <.0001 0.3300 0.1860 0.9112 0.4415 0.0588 0.4215 0.1459 <.0001 VT (ml) 78 <.0001 0.0687 0.6013 0.7017 0.5134 0.5034 0.1562 0.0225 <.0001 V.
E (ml min-1) 78 <.0001 0.0593 0.8554 0.8653 0.5259 0.8211 0.5039 0.3903 <.0001 V.
E / V.O2 78 <.0001 0.0676 0.4509 0.6979 0.2908 0.9304 0.8723 0.5986
O2 extraction (%) 74 <.0001 0.3835 0.5728 0.1575 0.4484 0.3824 0.5047 0.6729 0.0022
Values represent repeated-measures ANCOVAs (GLM procedure in SAS). Individuals were experimental units, sample was the
within-subjects factor, and selection history (HR vs. C), activity (wheel access vs. no wheel access), and lines were between-subjects
factors.
aThere were a total of 9 samples: 3 during the hypoxic trial, 3 during the hypercapnic trial, and 3 during the hypoxic hypercapnic trial
(normoxia, initial 2 minutes of gas exposure, and final 4 minutes of gas exposure).
Values are for two-tailed tests unless otherwise noted (unadjusted for multiple comparisons), and those in bold indicate statistically
significant effects [P < 0.05 (with the exception of the interaction where values P < 0.1 effects are in bold type, see text)].
“linetype” refers to High Runner (HR) vs. Control (C) mice.
“activity” refers to mice with vs. without wheels.
Log10 body mass (grand means for body mass in log units for the following traits: VO2 = 1.4581, V.CO2 = 1.4575, RER = 1.4569, f =
1.4581, V.
T = 1.4581, V.
E, = 1.4581, O2 extraction = 1.4549).
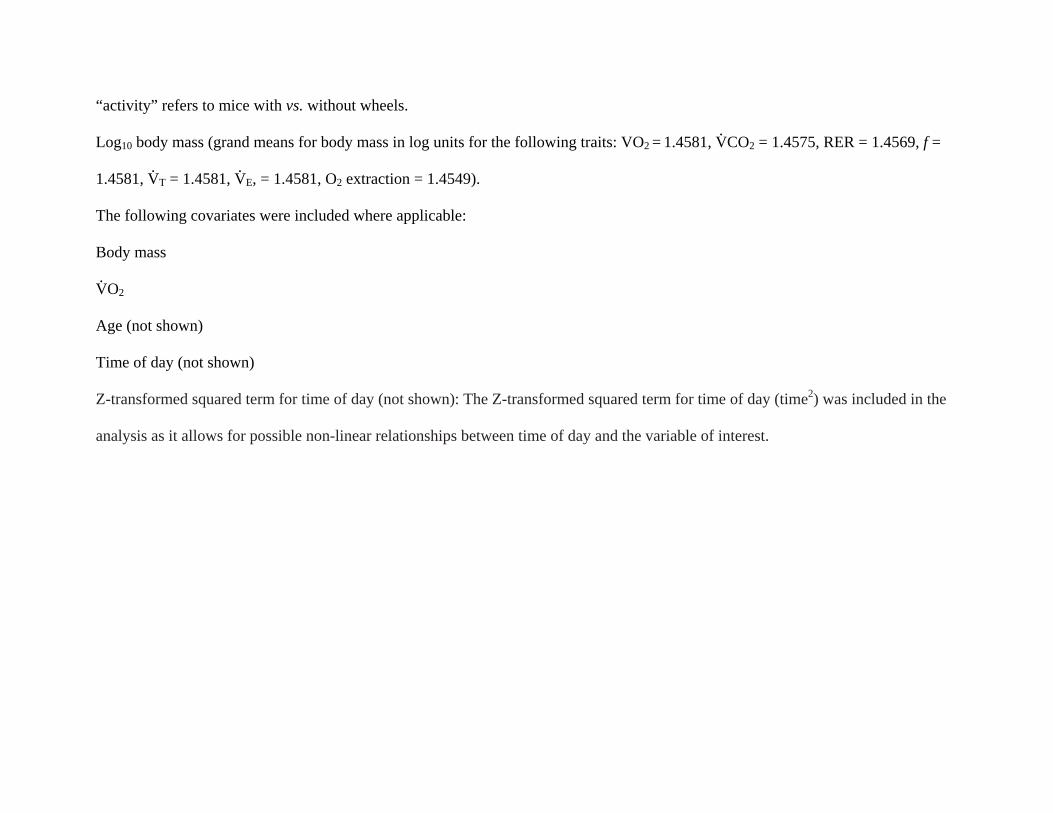
The following covariates were included where applicable:
Body mass
V.O2
Age (not shown)
Time of day (not shown)
Z-transformed squared term for time of day (not shown): The Z-transformed squared term for time of day (time2) was included in the
analysis as it allows for possible non-linear relationships between time of day and the variable of interest.
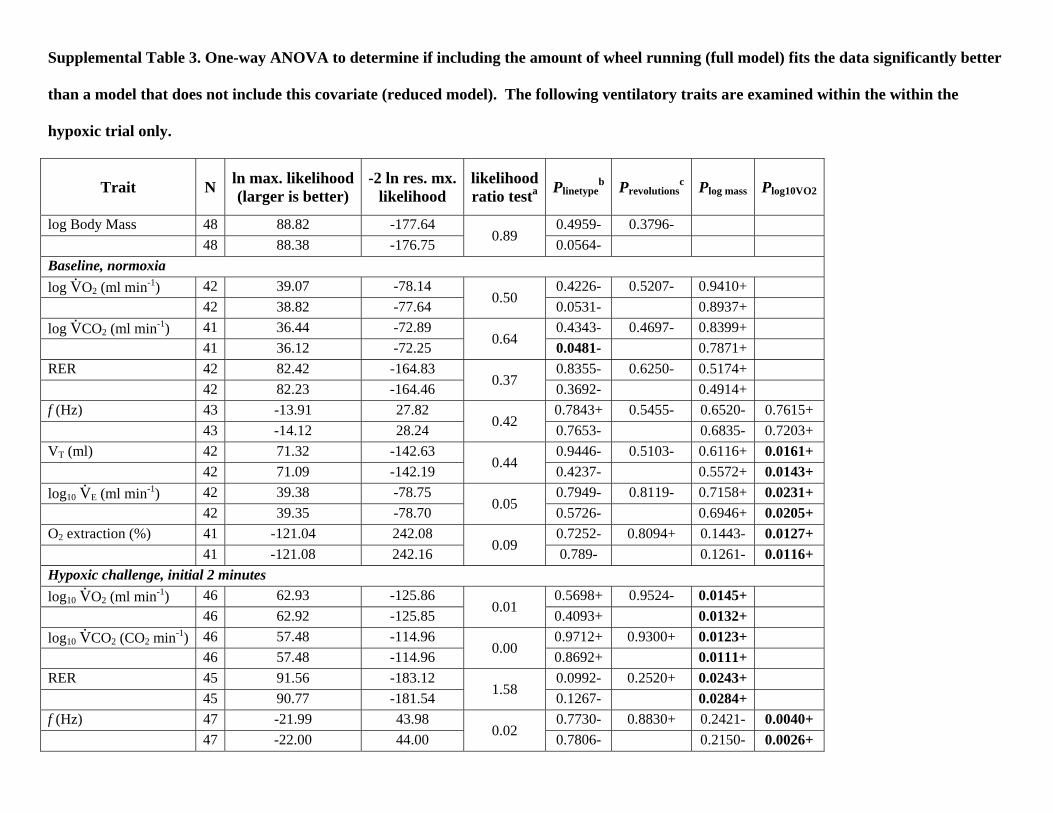
Supplemental Table 3. One-way ANOVA to determine if including the amount of wheel running (full model) fits the data significantly better
than a model that does not include this covariate (reduced model). The following ventilatory traits are examined within the within the
hypoxic trial only.
Trait N ln max. likelihood(larger is better)
-2 ln res. mx.likelihood
likelihoodratio testa Plinetype
b Prevolutionsc Plog mass Plog10VO2
log Body Mass 48 88.82 -177.64 0.4959- 0.3796- 48 88.38 -176.75 0.89 0.0564- Baseline, normoxia log V
.O2 (ml min-1) 42 39.07 -78.14 0.4226- 0.5207- 0.9410+
42 38.82 -77.64 0.50 0.0531- 0.8937+ log V
.CO2 (ml min-1) 41 36.44 -72.89 0.4343- 0.4697- 0.8399+
41 36.12 -72.25 0.64 0.0481- 0.7871+ RER 42 82.42 -164.83 0.8355- 0.6250- 0.5174+ 42 82.23 -164.46 0.37 0.3692- 0.4914+ f (Hz) 43 -13.91 27.82 0.7843+ 0.5455- 0.6520- 0.7615+ 43 -14.12 28.24 0.42 0.7653- 0.6835- 0.7203+ VT (ml) 42 71.32 -142.63 0.9446- 0.5103- 0.6116+ 0.0161+ 42 71.09 -142.19 0.44 0.4237- 0.5572+ 0.0143+ log10 V
.E (ml min-1) 42 39.38 -78.75 0.7949- 0.8119- 0.7158+ 0.0231+
42 39.35 -78.70 0.05 0.5726- 0.6946+ 0.0205+ O2 extraction (%) 41 -121.04 242.08 0.7252- 0.8094+ 0.1443- 0.0127+ 41 -121.08 242.16 0.09 0.789- 0.1261- 0.0116+ Hypoxic challenge, initial 2 minutes log10 V
.O2 (ml min-1) 46 62.93 -125.86 0.5698+ 0.9524- 0.0145+
46 62.92 -125.85 0.01 0.4093+ 0.0132+ log10 V
.CO2 (CO2 min-1) 46 57.48 -114.96 0.9712+ 0.9300+ 0.0123+
46 57.48 -114.96 0.00 0.8692+ 0.0111+ RER 45 91.56 -183.12 0.0992- 0.2520+ 0.0243+ 45 90.77 -181.54 1.58 0.1267- 0.0284+ f (Hz) 47 -21.99 43.98 0.7730- 0.8830+ 0.2421- 0.0040+ 47 -22.00 44.00 0.02 0.7806- 0.2150- 0.0026+
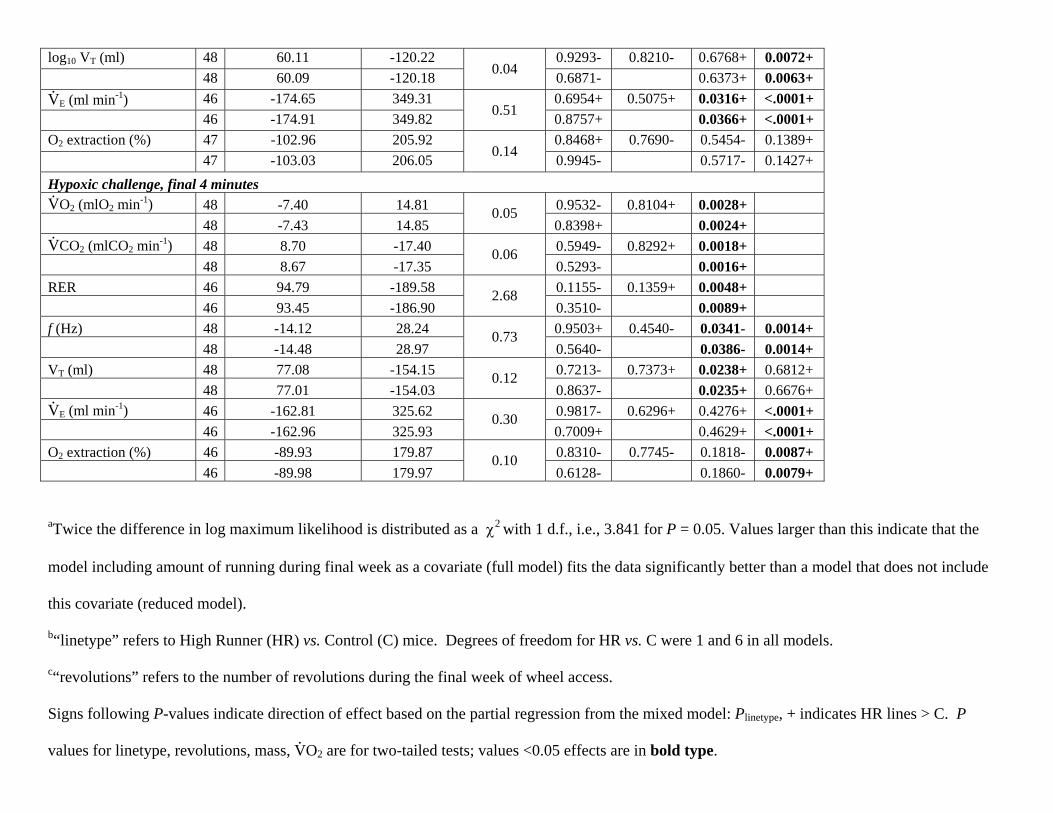
log10 VT (ml) 48 60.11 -120.22 0.9293- 0.8210- 0.6768+ 0.0072+ 48 60.09 -120.18 0.04 0.6871- 0.6373+ 0.0063+ V.
E (ml min-1) 46 -174.65 349.31 0.6954+ 0.5075+ 0.0316+ <.0001+ 46 -174.91 349.82 0.51 0.8757+ 0.0366+ <.0001+ O2 extraction (%) 47 -102.96 205.92 0.8468+ 0.7690- 0.5454- 0.1389+ 47 -103.03 206.05 0.14 0.9945- 0.5717- 0.1427+ Hypoxic challenge, final 4 minutes V.
O2 (mlO2 min-1) 48 -7.40 14.81 0.9532- 0.8104+ 0.0028+ 48 -7.43 14.85
0.05 0.8398+ 0.0024+
V.
CO2 (mlCO2 min-1) 48 8.70 -17.40 0.5949- 0.8292+ 0.0018+ 48 8.67 -17.35
0.06 0.5293- 0.0016+
RER 46 94.79 -189.58 0.1155- 0.1359+ 0.0048+ 46 93.45 -186.90
2.68 0.3510- 0.0089+
f (Hz) 48 -14.12 28.24 0.9503+ 0.4540- 0.0341- 0.0014+ 48 -14.48 28.97
0.73 0.5640- 0.0386- 0.0014+
VT (ml) 48 77.08 -154.15 0.7213- 0.7373+ 0.0238+ 0.6812+ 48 77.01 -154.03
0.12 0.8637- 0.0235+ 0.6676+
V.
E (ml min-1) 46 -162.81 325.62 0.9817- 0.6296+ 0.4276+ <.0001+ 46 -162.96 325.93
0.30 0.7009+ 0.4629+ <.0001+
O2 extraction (%) 46 -89.93 179.87 0.8310- 0.7745- 0.1818- 0.0087+ 46 -89.98 179.97
0.10 0.6128- 0.1860- 0.0079+
aTwice the difference in log maximum likelihood is distributed as a 2 with 1 d.f., i.e., 3.841 for P = 0.05. Values larger than this indicate that the
model including amount of running during final week as a covariate (full model) fits the data significantly better than a model that does not include
this covariate (reduced model).
b“linetype” refers to High Runner (HR) vs. Control (C) mice. Degrees of freedom for HR vs. C were 1 and 6 in all models.
c“revolutions” refers to the number of revolutions during the final week of wheel access.
Signs following P-values indicate direction of effect based on the partial regression from the mixed model: Plinetype, + indicates HR lines > C. P
values for linetype, revolutions, mass, V.O2 are for two-tailed tests; values <0.05 effects are in bold type.

The following covariates were included where applicable:
Log10 Body mass
V.O2
Age (not shown)
Time of day (not shown)
Z-transformed squared term for time of day (not shown): The Z-transformed squared term for time of day (time2) was included in the analysis as it
allows for possible non-linear relationships between time of day and the variable of interest.
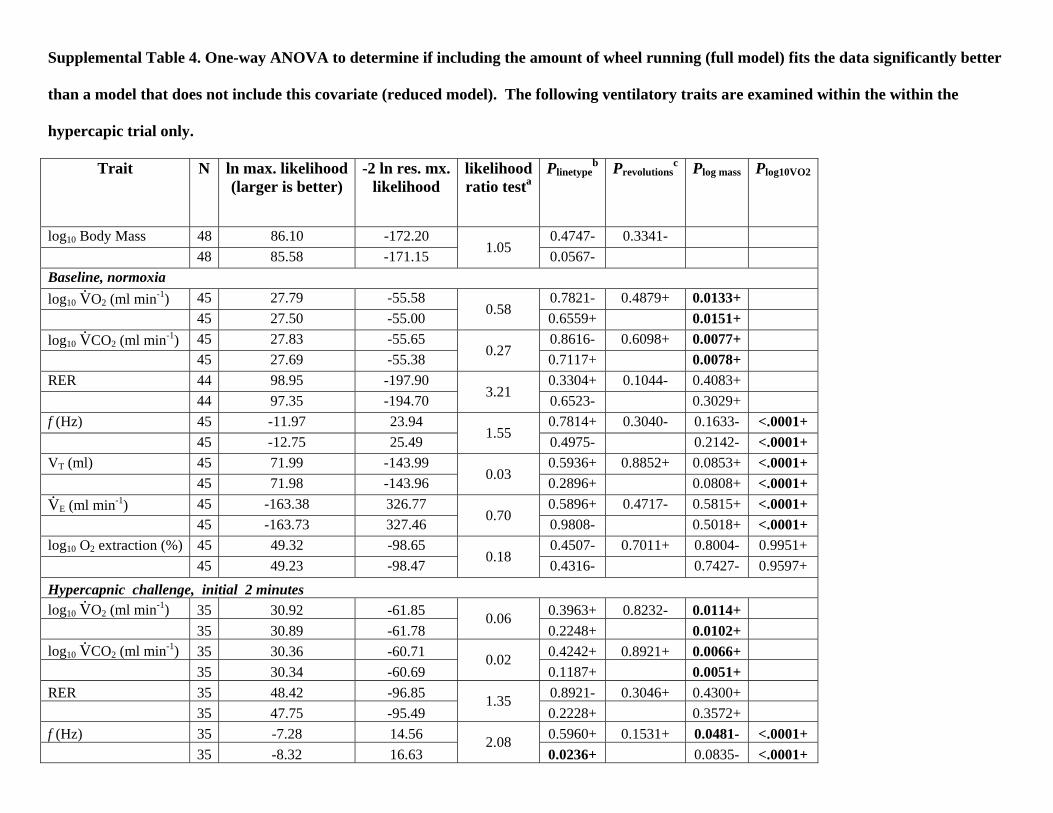
Supplemental Table 4. One-way ANOVA to determine if including the amount of wheel running (full model) fits the data significantly better
than a model that does not include this covariate (reduced model). The following ventilatory traits are examined within the within the
hypercapic trial only.
Trait N ln max. likelihood(larger is better)
-2 ln res. mx.likelihood
likelihoodratio testa
Plinetypeb Prevolutions
c Plog mass Plog10VO2
log10 Body Mass 48 86.10 -172.20 0.4747- 0.3341- 48 85.58 -171.15 1.05 0.0567- Baseline, normoxia log10 V
.O2 (ml min-1) 45 27.79 -55.58 0.7821- 0.4879+ 0.0133+
45 27.50 -55.00 0.58 0.6559+ 0.0151+ log10 V
.CO2 (ml min-1) 45 27.83 -55.65 0.8616- 0.6098+ 0.0077+
45 27.69 -55.38 0.27 0.7117+ 0.0078+ RER 44 98.95 -197.90 0.3304+ 0.1044- 0.4083+ 44 97.35 -194.70 3.21 0.6523- 0.3029+ f (Hz) 45 -11.97 23.94 0.7814+ 0.3040- 0.1633- <.0001+ 45 -12.75 25.49 1.55 0.4975- 0.2142- <.0001+ VT (ml) 45 71.99 -143.99 0.5936+ 0.8852+ 0.0853+ <.0001+ 45 71.98 -143.96 0.03 0.2896+ 0.0808+ <.0001+ V.
E (ml min-1) 45 -163.38 326.77 0.5896+ 0.4717- 0.5815+ <.0001+ 45 -163.73 327.46 0.70 0.9808- 0.5018+ <.0001+ log10 O2 extraction (%) 45 49.32 -98.65 0.4507- 0.7011+ 0.8004- 0.9951+ 45 49.23 -98.47 0.18 0.4316- 0.7427- 0.9597+ Hypercapnic challenge, initial 2 minutes log10 V
.O2 (ml min-1) 35 30.92 -61.85 0.3963+ 0.8232- 0.0114+
35 30.89 -61.78 0.06
0.2248+ 0.0102+ log10 V
.CO2 (ml min-1) 35 30.36 -60.71 0.4242+ 0.8921+ 0.0066+
35 30.34 -60.69 0.02
0.1187+ 0.0051+ RER 35 48.42 -96.85 0.8921- 0.3046+ 0.4300+ 35 47.75 -95.49
1.35 0.2228+ 0.3572+
f (Hz) 35 -7.28 14.56 0.5960+ 0.1531+ 0.0481- <.0001+ 35 -8.32 16.63
2.08 0.0236+ 0.0835- <.0001+
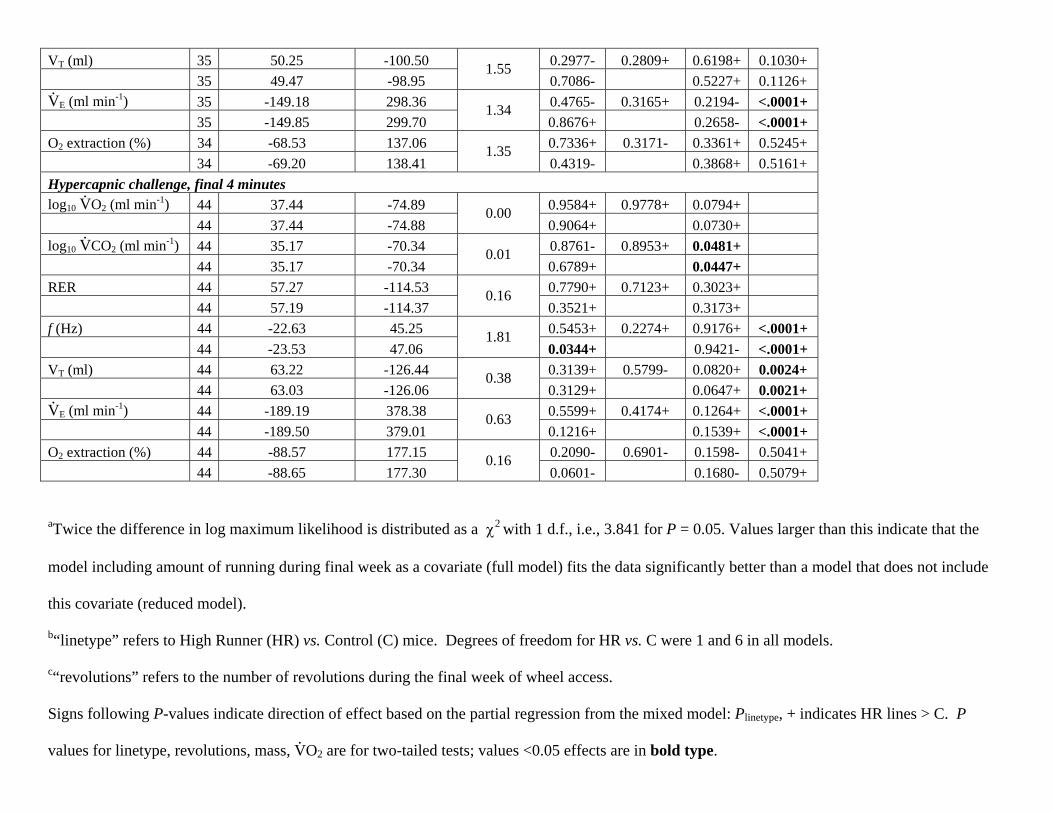
VT (ml) 35 50.25 -100.50 0.2977- 0.2809+ 0.6198+ 0.1030+ 35 49.47 -98.95
1.55 0.7086- 0.5227+ 0.1126+
V.
E (ml min-1) 35 -149.18 298.36 0.4765- 0.3165+ 0.2194- <.0001+ 35 -149.85 299.70
1.34 0.8676+ 0.2658- <.0001+
O2 extraction (%) 34 -68.53 137.06 0.7336+ 0.3171- 0.3361+ 0.5245+ 34 -69.20 138.41
1.35 0.4319- 0.3868+ 0.5161+
Hypercapnic challenge, final 4 minutes log10 V
.O2 (ml min-1) 44 37.44 -74.89 0.9584+ 0.9778+ 0.0794+
44 37.44 -74.88 0.00
0.9064+ 0.0730+ log10 V
.CO2 (ml min-1) 44 35.17 -70.34 0.8761- 0.8953+ 0.0481+
44 35.17 -70.34 0.01
0.6789+ 0.0447+ RER 44 57.27 -114.53 0.7790+ 0.7123+ 0.3023+ 44 57.19 -114.37
0.16 0.3521+ 0.3173+
f (Hz) 44 -22.63 45.25 0.5453+ 0.2274+ 0.9176+ <.0001+ 44 -23.53 47.06
1.81 0.0344+ 0.9421- <.0001+
VT (ml) 44 63.22 -126.44 0.3139+ 0.5799- 0.0820+ 0.0024+ 44 63.03 -126.06
0.38 0.3129+ 0.0647+ 0.0021+
V.
E (ml min-1) 44 -189.19 378.38 0.5599+ 0.4174+ 0.1264+ <.0001+ 44 -189.50 379.01
0.63 0.1216+ 0.1539+ <.0001+
O2 extraction (%) 44 -88.57 177.15 0.2090- 0.6901- 0.1598- 0.5041+ 44 -88.65 177.30
0.16 0.0601- 0.1680- 0.5079+
aTwice the difference in log maximum likelihood is distributed as a 2 with 1 d.f., i.e., 3.841 for P = 0.05. Values larger than this indicate that the
model including amount of running during final week as a covariate (full model) fits the data significantly better than a model that does not include
this covariate (reduced model).
b“linetype” refers to High Runner (HR) vs. Control (C) mice. Degrees of freedom for HR vs. C were 1 and 6 in all models.
c“revolutions” refers to the number of revolutions during the final week of wheel access.
Signs following P-values indicate direction of effect based on the partial regression from the mixed model: Plinetype, + indicates HR lines > C. P
values for linetype, revolutions, mass, V.O2 are for two-tailed tests; values <0.05 effects are in bold type.
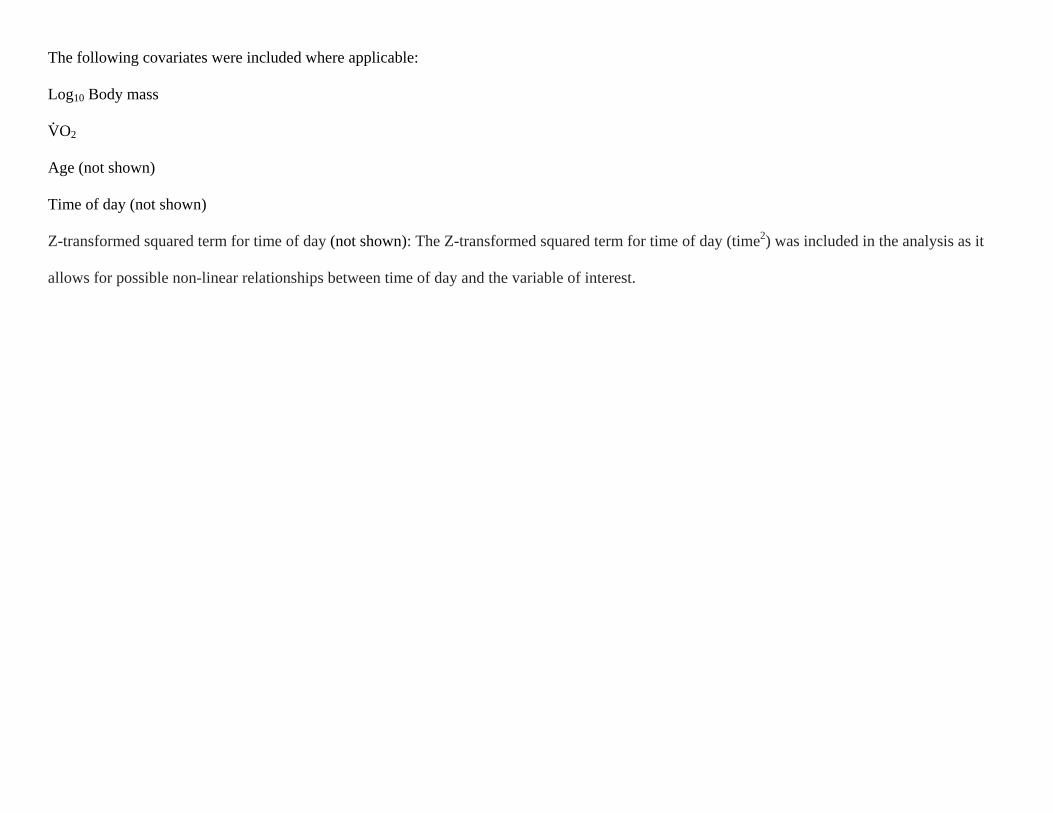
The following covariates were included where applicable:
Log10 Body mass
V.O2
Age (not shown)
Time of day (not shown)
Z-transformed squared term for time of day (not shown): The Z-transformed squared term for time of day (time2) was included in the analysis as it
allows for possible non-linear relationships between time of day and the variable of interest.