Embed Size (px)
Citation preview
EXERGETIC ANALYSIS OF AN AIRCRAFT TURBOJET ENGINEWITH AN AFTERBURNER
by
Mehdi Aliehyaei EHYAEIa*, Abdolhasan ANJIRIDEZFULIb,and Mark A. ROSENc
a Islamic Azad University, Pardis Branch, Tehran, IranbIslamic Azad University, Dezful Branch, Dezful City, Khuzestan, Iran
cFaculty of Engineering and Applied Science, University of Ontario Institute of Technology,Oshawa, Ont., Canada
Original scientific paperDOI: 10.2298/TSCI110911043E
An exergy analysis is reported of a J85-GE-21 turbojet engine and its componentsfor two altitudes: sea level and 11,000 meters. The turbojet engine with after-burning operates on the Brayton cycle and includes six main parts: diffuser, com-pressor, combustion chamber, turbine, afterburner, and nozzle. Aircraft data areutilized in the analysis with simulation data. The highest component exergy effi-ciency at sea level is observed to be for the compressor, at 96.7%, followed by thenozzle and turbine with exergy efficiencies of 93.7 and 92.3%, respectively. At bothconsidered heights, reducing of engine intake air speed leads to a reduction in theexergy efficiencies of all engine components and overall engine. The exergy effi-ciency of the turbojet engine is found to decrease by 0.45% for every 1 °C increasein inlet air temperature.
Key words: turbojet, afterburner, exergy, entropy generation, efficiency
Introduction
Engines are installed on aircraft for propulsion. Exhaust gases from aircraft enginesexit at the rear of the engine nozzle, causing the aircraft to move forward and air to pass over theaircraft wings. This air motion creates lift. Most modern aircraft use gas turbine engines to pro-duce the required thrust force. Such engines are relatively light and compact and have a highpower to weight ratios. Aircraft gas turbines operate in an open cycle based on the Brayton cy-cle. Actual jet cycles are not ideal due to thermodynamic losses. The gases in the jet cycle are ex-panded in the gas turbine to the pressure that allows generation of the power needed by the com-pressor, generator, hydraulic pump, and other work-consuming devices. Other gasturbine-based aerospace engines exist beyond the turbojet, including turbofan and turboshaftengines, but only turbojets are considered here. Production of jet aircraft began in 1945, and thetechnology has advanced significantly since then. Efforts to increase power and reduce noiseand fuel consumption have led to improvements in turbojet and turbofan engines [1]. Nearly16,800 jet aircraft were operating globally in 2007, and this number is expected to increase to35,300 by 2024 [2]. Due to decreasing world oil reserves, increasing oil prices and increasingenvironmental concerns, efforts have increased to improve system efficiency. Exergy analysis isa practical and useful tool for such activities, with many engineers and scientists suggesting thatexergy analysis is a highly effective method for evaluating and enhancing thermodynamic per-formance, and superior to energy analysis [3].
Ehyaei, M. A., et al.: Exergetic Analysis of an Aircraft Turbojet Engine ...THERMAL SCIENCE: Year 2013, Vol. 17, No. 4, pp. 1181-1194 1181
* Corresponding author; e-mail: [email protected]
Many researchers have investigated aircraft engines and propulsion systems withexergy analysis [4-12]. Rosen and Etele [13, 14] examine the importance of defining a referenceenvironment that varies with altitude and apply that work to a turbojet engine. Gaggioli andPaulus [15] propose a method to account for the exergy rate associated with thrust and lift forcesand develop aircraft exergy flow diagrams. Bejan and Siems [16] address the optimization of thecruise velocity and of the heat exchange processes on board an aircraft while Rancruel and VonSpakovsky [17] investigate engine configuration optimization methods. Hunt et al. [18, 19],and Riggins et al. [20] discuss methodologies for accounting for vehicle wake effects, andMoorhouse and Hoke [21] apply exergy methods to the analysis of the inlet performance. Morerecently, exergy analysis has been applied to an advanced hypersonic vehicle, with two mainscopes: (1) to enhance the exergy approach to the design and optimization of aerospace propul-sion systems, through the use of exergy flow diagram that provides aircraft engineers and sys-tem designers with insights into avoidable and unavoidable systemic losses, and (2) to explorethe limits and merits of fuelling options for a scramjet-powered aircraft [22]. Turgut et al. [23]perform an exergoeconomic analysis of an aircraft turbofan engine utilising kerosene as fuel.They develop several parameters (thrust cost rate, cost of exergy destruction, relative cost dif-ference, and exergoeconomic cost) and calculate the thrust cost rate to be 304.35 ($/h kN) and138.96 ($/h kN) for hot and cold thrust, respectively. Turgut et al. [24] apply exergy analysis to aGeneral Electric CF6-80 turbofan engine using sea-level data, and find the units with the great-est irreversibilities in the system to be the fan and the core engine exhaust, which exhibit exergyloss rates of 47.3 MW and 35.9 MW, respectively, and the combustion chamber, which has anexergy destruction rate of 31.5 MW. Previous studies have not examined turbojets with after-burning and have not focused on the variations of the results with altitude. Such information isneeded and addressing these needs is the focus of this paper. The main objective is to perform anexergy analysis of a J85-GE-21 turbojet engine and its components, for two altitudes: sea leveland 11,000 meters. Entropy generation and exergy efficiency relations are derived for each tur-bojet engine component and the overall system. The effects are studied of jet velocity and interair temperature, on entropy generation and exergy efficiency, with the aid of a simulation pro-gram developed for this study.
System modeling and analysis
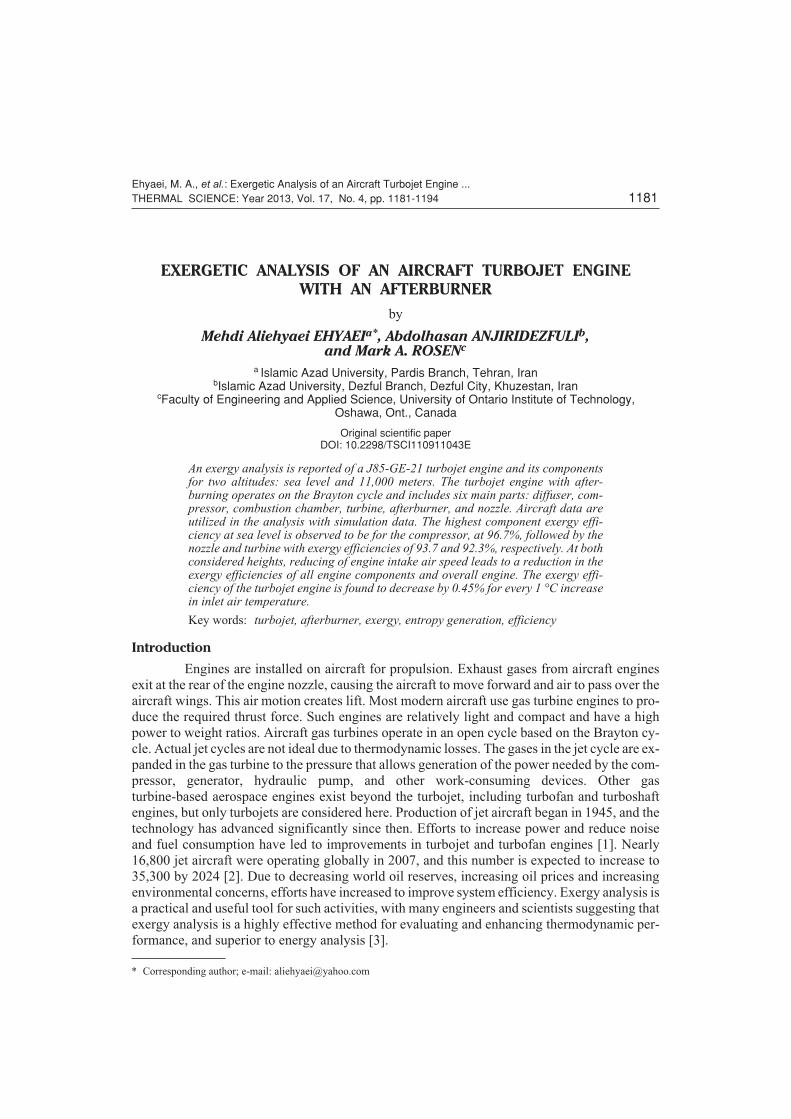
The J85-GE-21 turbojet engine is designed for F-5 fighter aircraft models F and E byGeneral Electric in the US and now is used on this aircraft. A J85-GE-21 turbojet engine isshown in fig. 1, where the main parts are: diffuser, compressor, combustion chamber, turbine,afterburner, and nozzle.
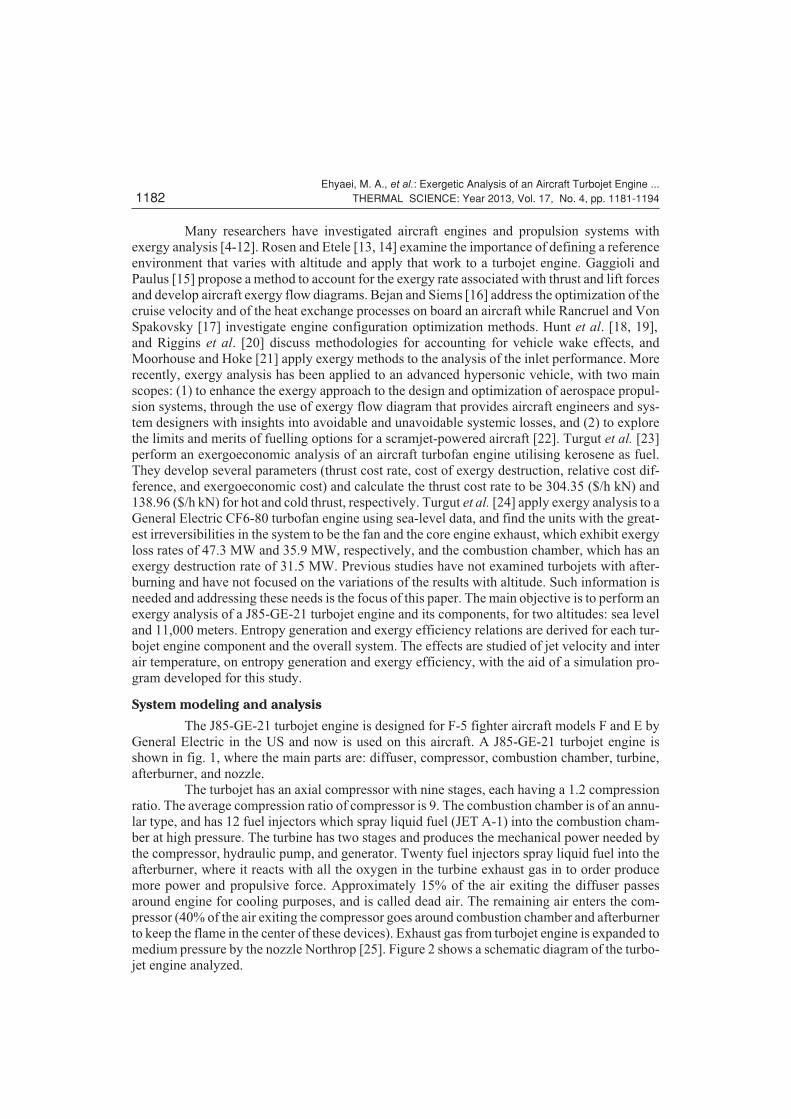
The turbojet has an axial compressor with nine stages, each having a 1.2 compressionratio. The average compression ratio of compressor is 9. The combustion chamber is of an annu-lar type, and has 12 fuel injectors which spray liquid fuel (JET A-1) into the combustion cham-ber at high pressure. The turbine has two stages and produces the mechanical power needed bythe compressor, hydraulic pump, and generator. Twenty fuel injectors spray liquid fuel into theafterburner, where it reacts with all the oxygen in the turbine exhaust gas in to order producemore power and propulsive force. Approximately 15% of the air exiting the diffuser passesaround engine for cooling purposes, and is called dead air. The remaining air enters the com-pressor (40% of the air exiting the compressor goes around combustion chamber and afterburnerto keep the flame in the center of these devices). Exhaust gas from turbojet engine is expanded tomedium pressure by the nozzle Northrop [25]. Figure 2 shows a schematic diagram of the turbo-jet engine analyzed.
Ehyaei, M. A., et al.: Exergetic Analysis of an Aircraft Turbojet Engine ...1182 THERMAL SCIENCE: Year 2013, Vol. 17, No. 4, pp. 1181-1194
The entry conditions of the diffuser (T1, P1, V1) are known, and the following equa-tions are used to obtain the outlet conditions. Note that outlet diffuser temperature is measuredby a sensor installed at the end of diffuser to determine amount of fuel entering the combustionchamber and burning by the engine. The relevant basic equations are as follows:
h hV
h u Pvh h
h h
s0
202 1
01 121 2 3� � � � �
�
�( ), ( ), ( )hD
Ehyaei, M. A., et al.: Exergetic Analysis of an Aircraft Turbojet Engine ...THERMAL SCIENCE: Year 2013, Vol. 17, No. 4, pp. 1181-1194 1183
Figure 1. Turbojet engine; used by permission of NASA (see website: www.Nasa.gov)
Figure 2. Schematic diagram of turbojet engine
where h0 [Jkg–1] is the denotes inlet diffuser specific stagnation enthalpy, h [Jkg–1] – the spe-cific enthalpy, V [ms–1] – the velocity, u [Jkg–1] – the specific internal energy, P [Pa] – thepressure, v [m3kg–1] – the specific volume, hD [Jkg–1] – the diffuser efficiency, h0s [Jkg–1] – theoutlet specific stagnation enthalpy for an isentropic process, and h1 [Jkg–1] – the inlet diffuserspecific enthalpy. With the above relations, following equations can be written for the dif-fuser:
h01 = h02, (4), V2 = 0 (5), u P vV
u P vV
1 1 112
2 2 222
2 2� � � � � (6)
where h01, and h02 [Jkg–1] are the diffuser inlet and outlet specific stagnation enthalpies, u1 andu2 [Jkg–1] – the diffuser inlet and outlet specific internal energies, P1 and P2 [Pa] – the diffuserinlet and outlet pressures, V1 [ms–1] – the aircraft velocity, V2 [ms–1] – the outlet diffuser airspeed, and v1 and v2 [m3kg–1] – the diffuser inlet and outlet specific volumes . With these equa-tions, the diffuser outlet pressure and temperature can be obtained iteratively. The outlet com-pressor pressure is obtained with the following equation:
P4 = rcP3 (7)
where P4 and P3 [Pa] are the compressor outlet and inlet pressures, and rc is the compressor pres-sure ratio. Also, the outlet compressor temperature is obtained with the following expressions:
dp = Tds + vdP (8), dhs = vdP (9), hC
h
h�
d
d
s (10)
Here, dh, [Jkg–1] ds [Jkg–1K–1], and dP [Pa] are the specific enthalpy, specific entropy and pres-sure variations in the compression process, respectively, T [K] – the average temperature in thecompression process, dhs [Jkg–1] – the specific enthalpy variation for isentropic compression,and hC – the compressor polytropic efficiency. With the ideal gas assumption and eqs. 8 through10, the following equation can be developed for the outlet temperature:
CT
T
R P
PP
C
d d�h
(11)
Here, CP [Jkg–1K–1] – the specific heat at constant pressure, which is evaluated at a mean tem-perature, and R [Jkg–1K–1] – the gas constant. With the specific heat at constant pressure as afunction of temperature and the compressor pressure ratio, the compressor outlet temperaturecan be obtained for gas mixtures by integration of above equation. The integral form of aboveequation is:
CT
T
R P
P
R P
PP
T
T
C C P
P
P
P
3
4
3
4
3
4
� � � ��d d d
h h(12)
Here, T3 and T4 [K] are inlet and outlet compressor temperature and P3 and P4 [Pa] are inlet andoutlet compressor pressure. The compressor power input WC is calculated as:
� � ( ) . �W m h h m hC a a� � �4 3 120 4 (13)
Here, �ma [kgs–1] is air mass flow rate and h3 and h4 and h12 [Jkg–1] are inlet and outlet specificenthalpies of the compressor. Kerosene is a fuel currently used in aviation. This fuel can havevariable functional applications by modification of some of its properties. Two types of kero-sene are Jet A and Jet A-1 [26, 27]. Depending on the type of ball bearings, roll bearings, seal-ing, and packing of selected engines, Jet A-1 or JP4 is normally used [25]. According to fig. 2,there are two components in which combustion occurs. Combustion relations based on reactantand product mass balances are [28]:
Ehyaei, M. A., et al.: Exergetic Analysis of an Aircraft Turbojet Engine ...1184 THERMAL SCIENCE: Year 2013, Vol. 17, No. 4, pp. 1181-1194

– combustion chamber:
0.0024C12H23 + 0.4944(0.7748N2 + 0.2059O2 + 0.0003CO2 ++ 0.019H2O) � 0.02889CO2 + 0.03694H2O + 0.05928O2 + 0.38306N2 (14)
– afterburner:
0.0073C12H23 + 1.189521(0.762236N2 +0.152502O2 + 0.034138CO2 ++ 0.151124H2O) � 0.1228CO2 + 0.26371H2O + 0.072562O2 + 0.9064N2 (15)
The energy balance for a combustion process can be written as:
� [ ( )] � [ ( )]m h h h m h h hr f p cc p f r
� �
� � � � � �� 0 0h (16)
where h�
f [Jkg–1] is the specific enthalpy of formation, h0 [Jkg–1] – the specific enthalpy at thereference condition, hcc – the combustion energy efficiency, and the subscripts r and p denote re-actants and products, respectively. The combustion temperature can be calculated with eqs. (14)to (16). The pressure in the combustion chamber can be determined as:
P Pn
n
T
T6 5
6
5
6
5
� (17)
where P5 and P6 [Pa] are the inlet and outlet pressures of the combustion chamber, T5 and T6 [K]– the inlet and outlet temperatures, and n6 and n5 are the inlet and outlet number of moles. Simi-larly, the pressure in the afterburner can be expressed as:
P Pn
n
T
T8 7
8
7
8
7
� (18)
where P7 and P8 are the inlet and outlet pressures of the afterburner, T7 and T8 are the inlet andoutlet temperatures, and n7 and n8 are the inlet and outlet number of moles. The turbine outletpressure can be expressed as:
P7 = rTP6 (19)
where P7 and P6 [Pa] are the turbine outlet and inlet pressures, and rT – the turbine pressure ratio.The turbine outlet temperature can be obtained by the equation:
CT
T
R P
P
R P
PP
T
T
P
P
P
P
6
7
6
7
6
7
� � � ��d d d
T Th h(20)
here, T6 and T7 are the inlet and outlet turbine temperatures, P6 and P7 are inlet and outlet turbinepressures, and hT – the turbine polytropic efficiency. The turbine power production �WT can beexpressed as:
� ( � � )( )W m m h hT a f� � �6 7 (21)
where �ma is the air mass flow rate [kgs–1], �mf [kgs–1] – the fuel mass flow rate, and h6 and h7
[Jkg–1] are the inlet and outlet specific enthalpies of the turbine.The nozzle outlet temperaturecan be determined using the equations:
h08 = h09 (22), V8 = 0 (23), u P vV
u P vV
8 8 882
9 9 992
2 2� � � (24)
Here, h08, and h09 [Jkg–1] are the inlet and outlet nozzle specific stagnation enthalpies, u8, and u9
[Jkg–1] – the inlet and outlet nozzle specific internal energies, P8 and P9 [Pa] – the inlet and out-let nozzle pressures, V8 [ms–1] – the inlet nozzle velocity, V9 [ms–1] – the outlet diffuser airspeed, and v8 and v9 [m3kg–1] are the nozzle inlet and outlet specific volumes.
Ehyaei, M. A., et al.: Exergetic Analysis of an Aircraft Turbojet Engine ...THERMAL SCIENCE: Year 2013, Vol. 17, No. 4, pp. 1181-1194 1185
Exergy analysis
In the absence of nuclear, magnetic, electric, and surface tension effects, exergy can bedivided into four distinct components: physical, chemical, kinetic, and potential [3, 28, 29]:
et = ekn + ept + eph + ech (25)
where et, ekn, ept, eph, and ech [Jkg–1] are the total, kinetic, potential, physical, and chemical spe-cific exergies. Specific kinetic and potential exergies can be expressed as:
eV
kn �2
2(26), ept = gh (27)
where g [ms�2] is the gravitational acceleration and h [m] � the height. Specific physical andchemical exergies can be written as:
e h h T s sph � � � �( ) ( )0 0 0 (28), e x e RT x Lnxi ch i i ii
ch � � �� , 0 (29)
where h [Jkg–1] denotes the specific enthalpy, h0 [Jkg–1] – the specific enthalpy at the referencecondition, s [Jkg–1] – the specific entropy, s0 [Jkg–1K–1] – the specific entropy at the referencecondition, T0 [K] – the reference temperature, xi – the gas mole fraction, and echi – specific chem-ical exergy. Exergy rates [W] can be determined with the equations:
� �E mekn kn� (30), � �E mept pt� (31), � �E meph ph� (32), � �E mech ch� (33)
where � , � , , �E E E Ekn pt ph chand are the kinetic, potential, physical, respectively, and chemicalexergy rates �m and is the mass flow rate.
Since the diffuser is used to increase pressure and reduce velocity and involves nopower interaction, the diffuser exergy efficiency can be expressed as:
YDiffuser ��
�
E
E
2
1
(34)
where Y denotes the exergy efficiency, � , �E E2 1and [W] are outlet and inlet diffuser exergy rates.The compressor exergy efficiency is calculated as:
YCompressor
C
�� �� � �
�
E E E
W
12 4 3 (35)
where � , � �E E E4 3 12, and [W] are the outlet and inlet compressor exergy rates. The combustionchamber exergy efficiency is expressible as:
YCombustion chamber �� �
�
� � �
E
E E E
6
13 5 10
(36)
where �E6 [W] is the outlet combustion chamber exergy rate, �E5 [W] – the air inlet combustionchamber exergy rate, �E10 [W] – the fuel exergy consumption rate in the combustion chamber,and �E13[W] – the air exergy consumption rate in the combustion chamber. The turbine exergyefficiency can be written as:
YTurbine ��
�
� �
W
E E
t
6 7
(37)
where �E7 [W] is the outlet turbine exergy rate. The afterburner exergy efficiency can be ex-pressed as:
YAfterburner �� �
�
� � �
E
E E E
8
14 11 7
(38)
Ehyaei, M. A., et al.: Exergetic Analysis of an Aircraft Turbojet Engine ...1186 THERMAL SCIENCE: Year 2013, Vol. 17, No. 4, pp. 1181-1194
where �E8 [W] is the outlet afterburner chamber exergy rate, �E11[W] – the fuel use exergy rate inthe afterburner, and �E14[W] – the air use exergy rate in the afterburner. The nozzle exergy effi-ciency is determined as:
YNozzle ��
�
E
E
9
8
(39)
where �E9 [W] is the outlet nozzle exergy rate.The overall turbojet exergy efficiency can be writ-ten as:
YE
E�
� �
�
� � �
9
1 10 11E E(40)
The entropy generation rates in the diffuser, compressor, combustion chamber, tur-bine, afterburner, and nozzle, can be expressed as:
� ( � � )ST
E Egen, diffuser
o
� �1
2 1 (41)
� [ � � � ( � )]ST
E E E Wgen, compressor
o
c� � � � �1
12 4 3 (42)
� ( � � � � )ST
E E E Egen, compressor chamber
o
� � � �1
13 10 5 6 (43)
� ( � � � )ST
E E Wgen, turbine
o
t� � �1
6 7 (44)
� ( � � � � )ST
E E E Egen, afterburner
o
� � � �1
7 14 11 8 (45)
� ( � � )ST
E Egen, nozzle
o
� �1
8 9 (46)
where To is the reference environment temperature, which is fixed here at 298.15 K.
Results and discussion
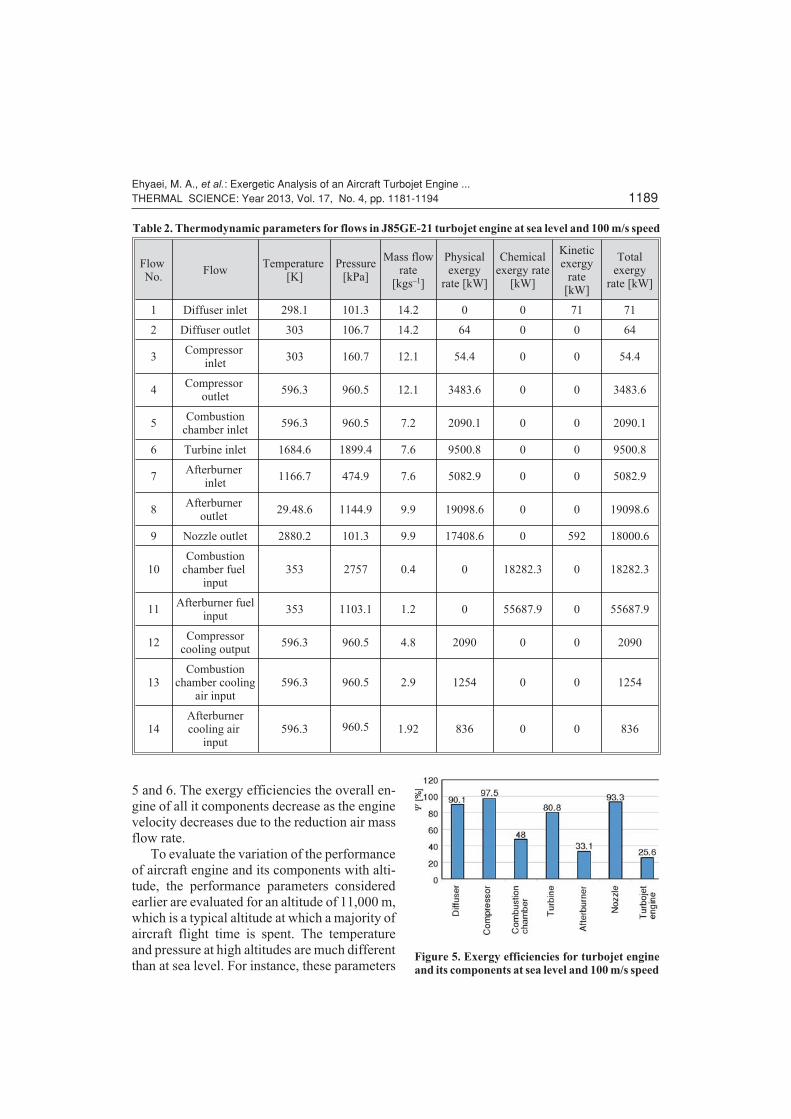
Temperatures, pressures, mass flow rates, kinetic, physical and chemical exergy ratesfor various parts of engine at sea level and 200 m/s aircraft velocity are shown in tab. 1.
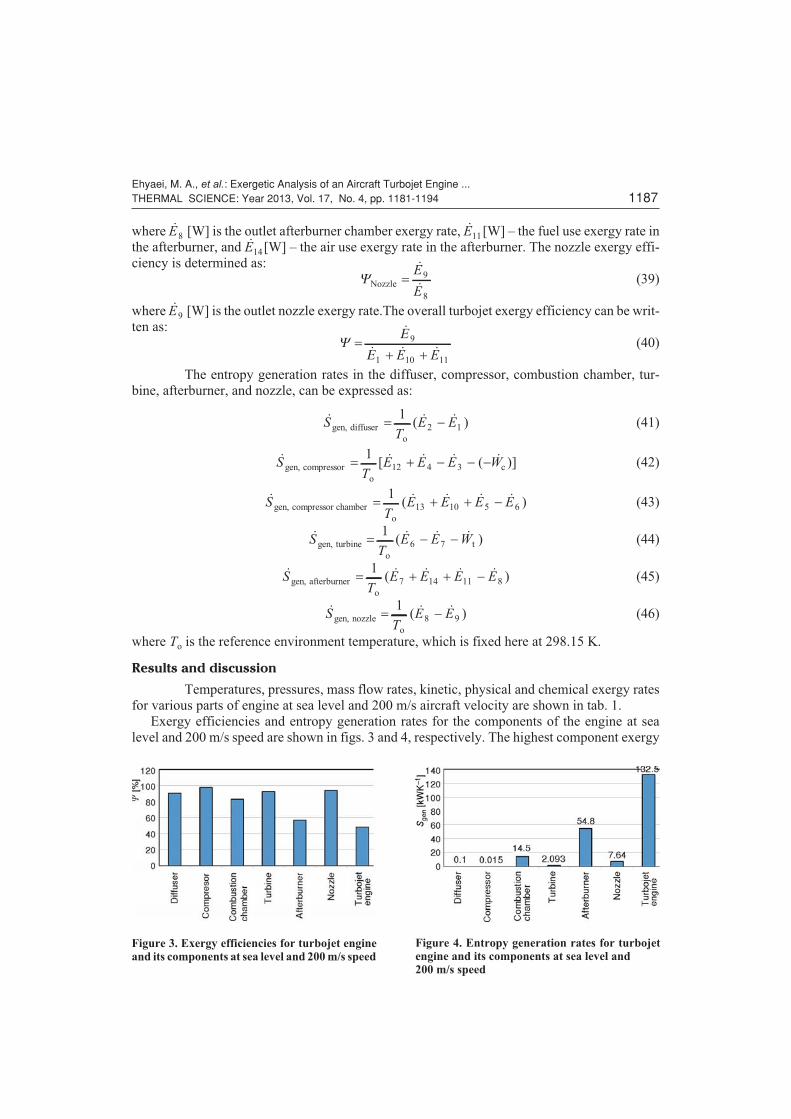
Exergy efficiencies and entropy generation rates for the components of the engine at sealevel and 200 m/s speed are shown in figs. 3 and 4, respectively. The highest component exergy
Ehyaei, M. A., et al.: Exergetic Analysis of an Aircraft Turbojet Engine ...THERMAL SCIENCE: Year 2013, Vol. 17, No. 4, pp. 1181-1194 1187
Figure 3. Exergy efficiencies for turbojet engineand its components at sea level and 200 m/s speed
Figure 4. Entropy generation rates for turbojetengine and its components at sea level and200 m/s speed
efficiency is exhibited by the compressor at 96.7%. The next highest exergy efficiencies are forthe nozzle (93.7%) and turbine (92.3%). The lowest exergy efficiencies are for the afterburner(54.8%), followed by the combustion chamber (80.4%). The low fuel efficiency of the after-burner compared to the combustion chamber results in it burning almost three times the fuel ofthe combustion chamber, in order to increase the thrust force by about one third. The entropyproduction rates also help identify the components with the highest irreversibilities. The great-est entropy production rate in the engine is observed for the afterburner, followed by the com-bustion chamber. Hence, the combustion processes in the aircraft engine are highly irreversible.The nozzle, due to the rapid changes in cross-sectional area has in the third highest entropy pro-duction rates.
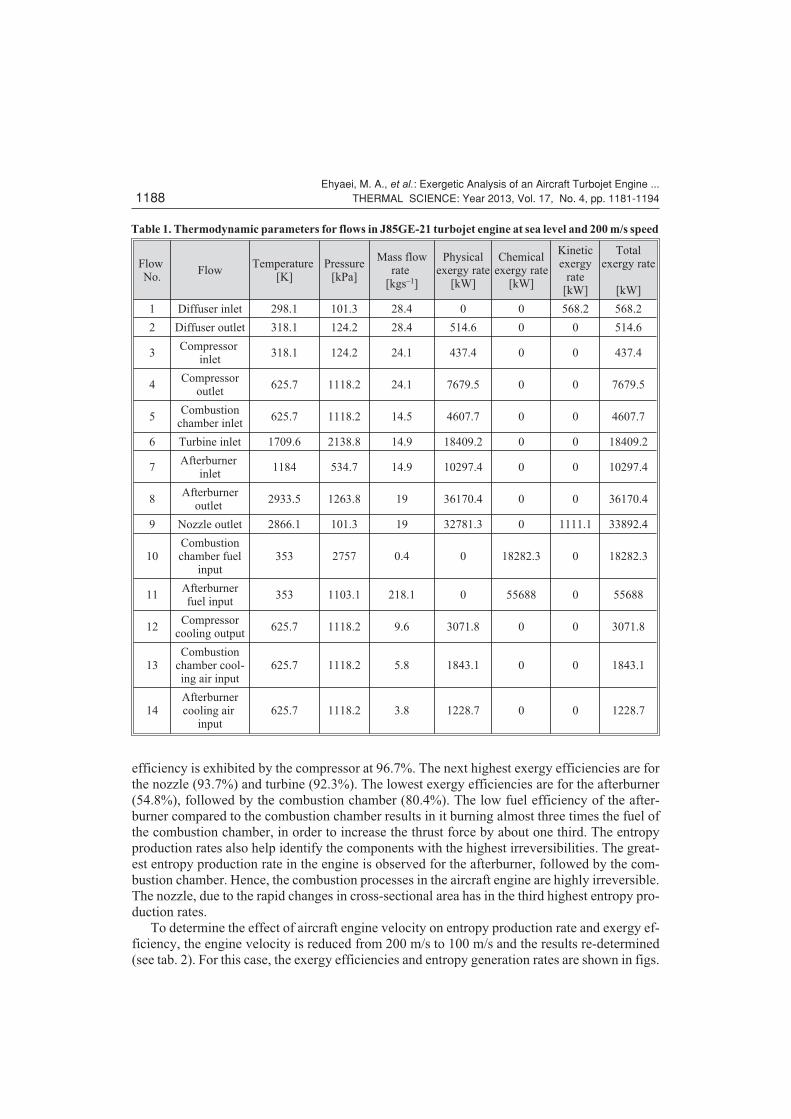
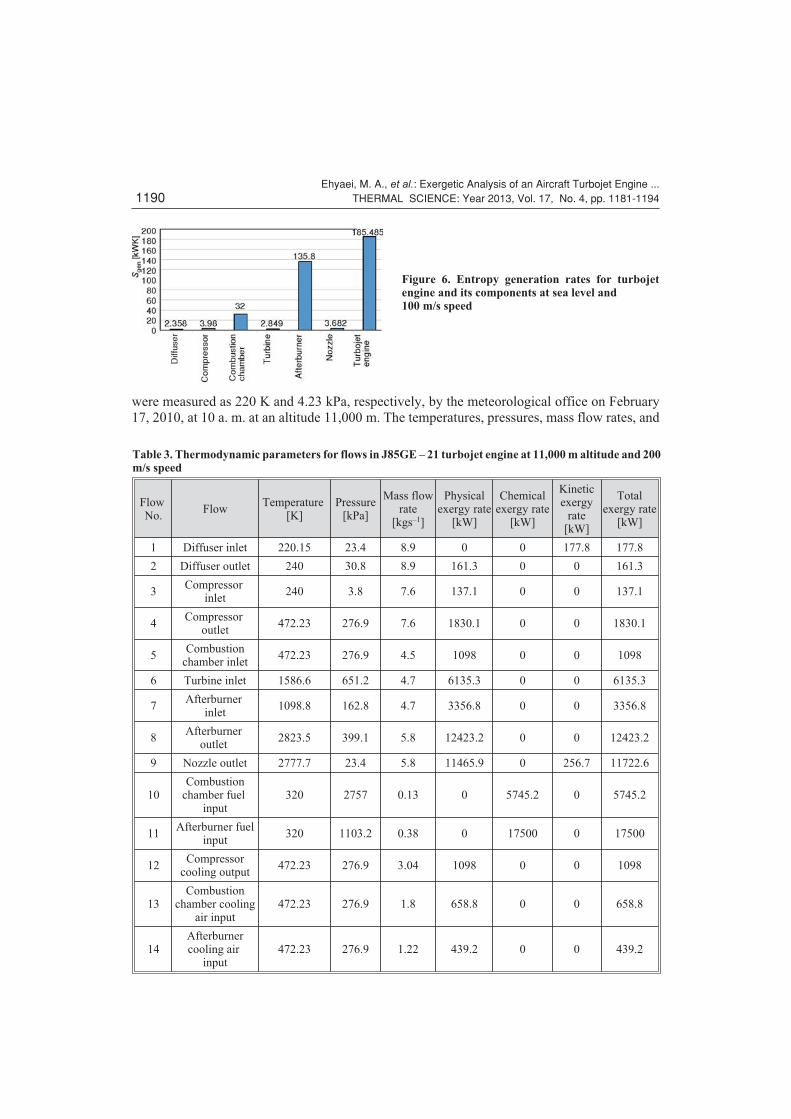
To determine the effect of aircraft engine velocity on entropy production rate and exergy ef-ficiency, the engine velocity is reduced from 200 m/s to 100 m/s and the results re-determined(see tab. 2). For this case, the exergy efficiencies and entropy generation rates are shown in figs.
Ehyaei, M. A., et al.: Exergetic Analysis of an Aircraft Turbojet Engine ...1188 THERMAL SCIENCE: Year 2013, Vol. 17, No. 4, pp. 1181-1194
Table 1. Thermodynamic parameters for flows in J85GE-21 turbojet engine at sea level and 200 m/s speed
FlowNo.
FlowTemperature
[K]Pressure
[kPa]
Mass flowrate
[kgs–1]
Physicalexergy rate
[kW]
Chemicalexergy rate
[kW]
Kineticexergy
rate[kW]
Totalexergy rate
[kW]
1 Diffuser inlet 298.1 101.3 28.4 0 0 568.2 568.2
2 Diffuser outlet 318.1 124.2 28.4 514.6 0 0 514.6
3Compressor
inlet318.1 124.2 24.1 437.4 0 0 437.4
4Compressor
outlet625.7 1118.2 24.1 7679.5 0 0 7679.5
5Combustion
chamber inlet625.7 1118.2 14.5 4607.7 0 0 4607.7
6 Turbine inlet 1709.6 2138.8 14.9 18409.2 0 0 18409.2
7Afterburner
inlet1184 534.7 14.9 10297.4 0 0 10297.4
8Afterburner
outlet2933.5 1263.8 19 36170.4 0 0 36170.4
9 Nozzle outlet 2866.1 101.3 19 32781.3 0 1111.1 33892.4
10Combustionchamber fuel
input353 2757 0.4 0 18282.3 0 18282.3
11Afterburnerfuel input
353 1103.1 218.1 0 55688 0 55688
12Compressor
cooling output625.7 1118.2 9.6 3071.8 0 0 3071.8
13Combustion
chamber cool-ing air input
625.7 1118.2 5.8 1843.1 0 0 1843.1
14Afterburnercooling air
input625.7 1118.2 3.8 1228.7 0 0 1228.7
5 and 6. The exergy efficiencies the overall en-gine of all it components decrease as the enginevelocity decreases due to the reduction air massflow rate.
To evaluate the variation of the performanceof aircraft engine and its components with alti-tude, the performance parameters consideredearlier are evaluated for an altitude of 11,000 m,which is a typical altitude at which a majority ofaircraft flight time is spent. The temperatureand pressure at high altitudes are much differentthan at sea level. For instance, these parameters
Ehyaei, M. A., et al.: Exergetic Analysis of an Aircraft Turbojet Engine ...THERMAL SCIENCE: Year 2013, Vol. 17, No. 4, pp. 1181-1194 1189
Figure 5. Exergy efficiencies for turbojet engineand its components at sea level and 100 m/s speed
Table 2. Thermodynamic parameters for flows in J85GE-21 turbojet engine at sea level and 100 m/s speed
FlowNo.
FlowTemperature
[K]Pressure
[kPa]
Mass flowrate
[kgs–1]
Physicalexergy
rate [kW]
Chemicalexergy rate
[kW]
Kineticexergy
rate[kW]
Totalexergy
rate [kW]
1 Diffuser inlet 298.1 101.3 14.2 0 0 71 71
2 Diffuser outlet 303 106.7 14.2 64 0 0 64
3Compressor
inlet303 160.7 12.1 54.4 0 0 54.4
4Compressor
outlet596.3 960.5 12.1 3483.6 0 0 3483.6
5Combustion
chamber inlet596.3 960.5 7.2 2090.1 0 0 2090.1
6 Turbine inlet 1684.6 1899.4 7.6 9500.8 0 0 9500.8
7Afterburner
inlet1166.7 474.9 7.6 5082.9 0 0 5082.9
8Afterburner
outlet29.48.6 1144.9 9.9 19098.6 0 0 19098.6
9 Nozzle outlet 2880.2 101.3 9.9 17408.6 0 592 18000.6
10Combustion
chamber fuelinput
353 2757 0.4 0 18282.3 0 18282.3
11Afterburner fuel
input353 1103.1 1.2 0 55687.9 0 55687.9
12Compressor
cooling output596.3 960.5 4.8 2090 0 0 2090
13Combustion
chamber coolingair input
596.3 960.5 2.9 1254 0 0 1254
14Afterburnercooling air
input596.3 960.5 1.92 836 0 0 836
were measured as 220 K and 4.23 kPa, respectively, by the meteorological office on February17, 2010, at 10 a. m. at an altitude 11,000 m. The temperatures, pressures, mass flow rates, and
Ehyaei, M. A., et al.: Exergetic Analysis of an Aircraft Turbojet Engine ...1190 THERMAL SCIENCE: Year 2013, Vol. 17, No. 4, pp. 1181-1194
Figure 6. Entropy generation rates for turbojetengine and its components at sea level and100 m/s speed
Table 3. Thermodynamic parameters for flows in J85GE – 21 turbojet engine at 11,000 m altitude and 200m/s speed
FlowNo.
FlowTemperature
[K]Pressure
[kPa]
Mass flowrate
[kgs–1]
Physicalexergy rate
[kW]
Chemicalexergy rate
[kW]
Kineticexergy
rate[kW]
Totalexergy rate
[kW]
1 Diffuser inlet 220.15 23.4 8.9 0 0 177.8 177.8
2 Diffuser outlet 240 30.8 8.9 161.3 0 0 161.3
3Compressor
inlet240 3.8 7.6 137.1 0 0 137.1
4Compressor
outlet472.23 276.9 7.6 1830.1 0 0 1830.1
5Combustion
chamber inlet472.23 276.9 4.5 1098 0 0 1098
6 Turbine inlet 1586.6 651.2 4.7 6135.3 0 0 6135.3
7Afterburner
inlet1098.8 162.8 4.7 3356.8 0 0 3356.8
8Afterburner
outlet2823.5 399.1 5.8 12423.2 0 0 12423.2
9 Nozzle outlet 2777.7 23.4 5.8 11465.9 0 256.7 11722.6
10Combustion
chamber fuelinput
320 2757 0.13 0 5745.2 0 5745.2
11Afterburner fuel
input320 1103.2 0.38 0 17500 0 17500
12Compressor
cooling output472.23 276.9 3.04 1098 0 0 1098
13Combustion
chamber coolingair input
472.23 276.9 1.8 658.8 0 0 658.8
14Afterburnercooling air
input472.23 276.9 1.22 439.2 0 0 439.2
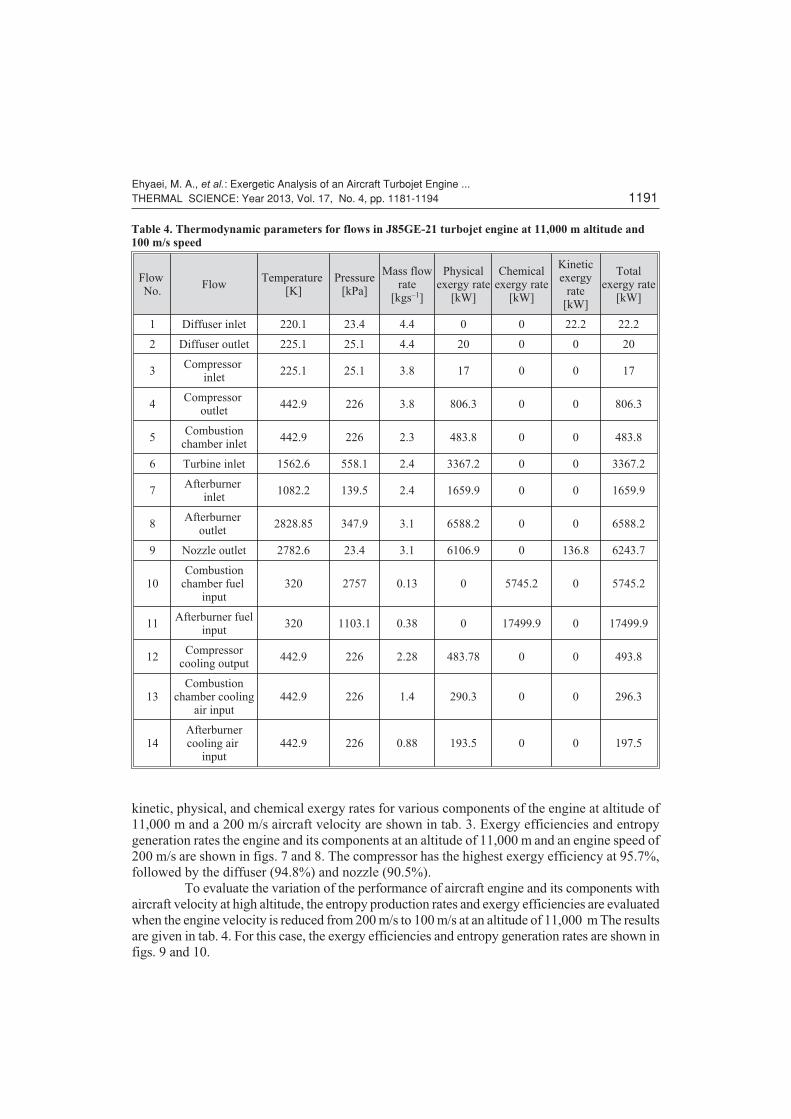
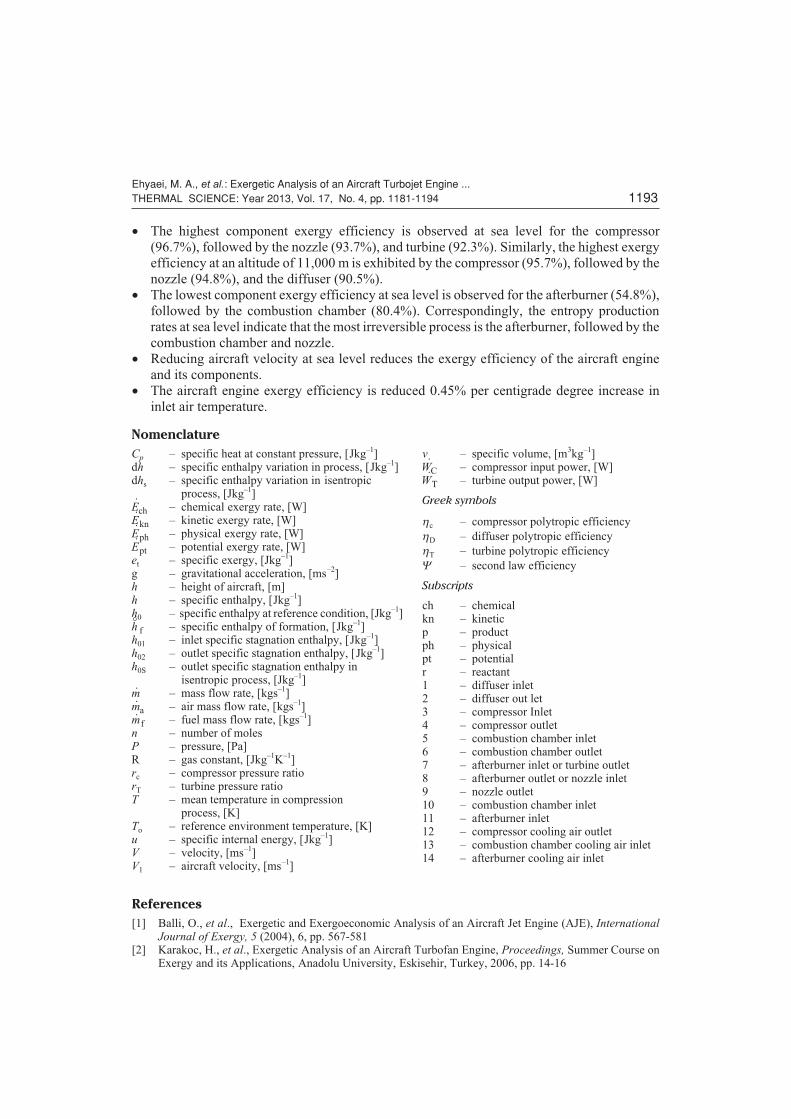
kinetic, physical, and chemical exergy rates for various components of the engine at altitude of11,000 m and a 200 m/s aircraft velocity are shown in tab. 3. Exergy efficiencies and entropygeneration rates the engine and its components at an altitude of 11,000 m and an engine speed of200 m/s are shown in figs. 7 and 8. The compressor has the highest exergy efficiency at 95.7%,followed by the diffuser (94.8%) and nozzle (90.5%).
To evaluate the variation of the performance of aircraft engine and its components withaircraft velocity at high altitude, the entropy production rates and exergy efficiencies are evaluatedwhen the engine velocity is reduced from 200 m/s to 100 m/s at an altitude of 11,000 m The resultsare given in tab. 4. For this case, the exergy efficiencies and entropy generation rates are shown infigs. 9 and 10.
Ehyaei, M. A., et al.: Exergetic Analysis of an Aircraft Turbojet Engine ...THERMAL SCIENCE: Year 2013, Vol. 17, No. 4, pp. 1181-1194 1191
Table 4. Thermodynamic parameters for flows in J85GE-21 turbojet engine at 11,000 m altitude and100 m/s speed
FlowNo.
FlowTemperature
[K]Pressure
[kPa]
Mass flowrate
[kgs–1]
Physicalexergy rate
[kW]
Chemicalexergy rate
[kW]
Kineticexergy
rate[kW]
Totalexergy rate
[kW]
1 Diffuser inlet 220.1 23.4 4.4 0 0 22.2 22.2
2 Diffuser outlet 225.1 25.1 4.4 20 0 0 20
3Compressor
inlet225.1 25.1 3.8 17 0 0 17
4Compressor
outlet442.9 226 3.8 806.3 0 0 806.3
5Combustion
chamber inlet442.9 226 2.3 483.8 0 0 483.8
6 Turbine inlet 1562.6 558.1 2.4 3367.2 0 0 3367.2
7Afterburner
inlet1082.2 139.5 2.4 1659.9 0 0 1659.9
8Afterburner
outlet2828.85 347.9 3.1 6588.2 0 0 6588.2
9 Nozzle outlet 2782.6 23.4 3.1 6106.9 0 136.8 6243.7
10Combustion
chamber fuelinput
320 2757 0.13 0 5745.2 0 5745.2
11Afterburner fuel
input320 1103.1 0.38 0 17499.9 0 17499.9
12Compressor
cooling output442.9 226 2.28 483.78 0 0 493.8
13Combustion
chamber coolingair input
442.9 226 1.4 290.3 0 0 296.3
14Afterburnercooling air
input442.9 226 0.88 193.5 0 0 197.5
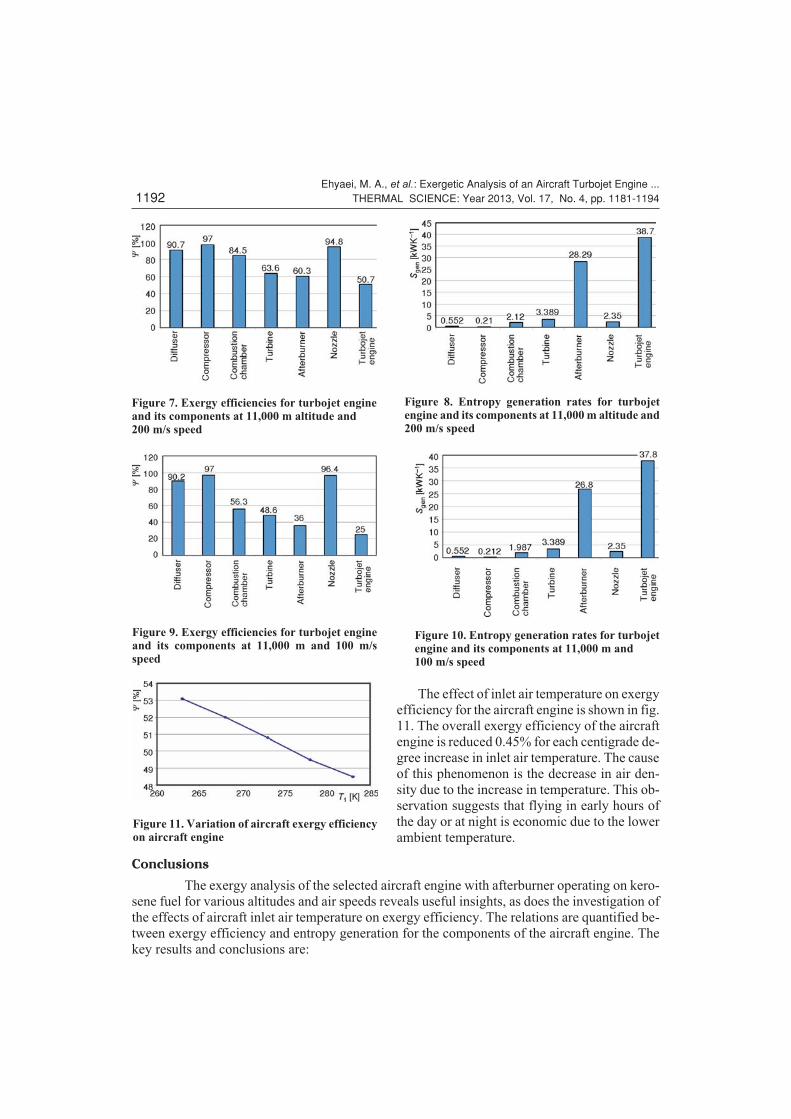
The effect of inlet air temperature on exergyefficiency for the aircraft engine is shown in fig.11. The overall exergy efficiency of the aircraftengine is reduced 0.45% for each centigrade de-gree increase in inlet air temperature. The causeof this phenomenon is the decrease in air den-sity due to the increase in temperature. This ob-servation suggests that flying in early hours ofthe day or at night is economic due to the lowerambient temperature.
Conclusions
The exergy analysis of the selected aircraft engine with afterburner operating on kero-sene fuel for various altitudes and air speeds reveals useful insights, as does the investigation ofthe effects of aircraft inlet air temperature on exergy efficiency. The relations are quantified be-tween exergy efficiency and entropy generation for the components of the aircraft engine. Thekey results and conclusions are:
Ehyaei, M. A., et al.: Exergetic Analysis of an Aircraft Turbojet Engine ...1192 THERMAL SCIENCE: Year 2013, Vol. 17, No. 4, pp. 1181-1194
Figure 10. Entropy generation rates for turbojetengine and its components at 11,000 m and100 m/s speed
Figure 11. Variation of aircraft exergy efficiencyon aircraft engine
Figure 9. Exergy efficiencies for turbojet engineand its components at 11,000 m and 100 m/sspeed
Figure 8. Entropy generation rates for turbojetengine and its components at 11,000 m altitude and200 m/s speed
Figure 7. Exergy efficiencies for turbojet engineand its components at 11,000 m altitude and200 m/s speed
� The highest component exergy efficiency is observed at sea level for the compressor(96.7%), followed by the nozzle (93.7%), and turbine (92.3%). Similarly, the highest exergyefficiency at an altitude of 11,000 m is exhibited by the compressor (95.7%), followed by thenozzle (94.8%), and the diffuser (90.5%).
� The lowest component exergy efficiency at sea level is observed for the afterburner (54.8%),followed by the combustion chamber (80.4%). Correspondingly, the entropy productionrates at sea level indicate that the most irreversible process is the afterburner, followed by thecombustion chamber and nozzle.
� Reducing aircraft velocity at sea level reduces the exergy efficiency of the aircraft engineand its components.
� The aircraft engine exergy efficiency is reduced 0.45% per centigrade degree increase ininlet air temperature.
References
[1] Balli, O., et al., Exergetic and Exergoeconomic Analysis of an Aircraft Jet Engine (AJE), InternationalJournal of Exergy, 5 (2004), 6, pp. 567-581
[2] Karakoc, H., et al., Exergetic Analysis of an Aircraft Turbofan Engine, Proceedings, Summer Course onExergy and its Applications, Anadolu University, Eskisehir, Turkey, 2006, pp. 14-16
Ehyaei, M. A., et al.: Exergetic Analysis of an Aircraft Turbojet Engine ...THERMAL SCIENCE: Year 2013, Vol. 17, No. 4, pp. 1181-1194 1193
Nomenclature
Cp – specific heat at constant pressure, [Jkg–1]dh – specific enthalpy variation in process, [Jkg–1]dhs – specific enthalpy variation in isentropic
– process, [Jkg–1]�Ech – chemical exergy rate, [W]�Ekn – kinetic exergy rate, [W]�Eph – physical exergy rate, [W]�Ept – potential exergy rate, [W]
et – specific exergy, [Jkg–1]g – gravitational acceleration, [ms–2]h – height of aircraft, [m]h – specific enthalpy, [Jkg–1]h0 – specific enthalpy at reference condition, [Jkg–1]h� f – specific enthalpy of formation, [Jkg–1]h01 – inlet specific stagnation enthalpy, [Jkg–1]h02 – outlet specific stagnation enthalpy, [Jkg–1]h0S – outlet specific stagnation enthalpy in
– isentropic process, [Jkg–1]�m – mass flow rate, [kgs–1]�ma – air mass flow rate, [kgs–1]�mf – fuel mass flow rate, [kgs–1]
n – number of molesP – pressure, [Pa]R – gas constant, [Jkg–1K–1]rc – compressor pressure ratiorT – turbine pressure ratioT – mean temperature in compression
– process, [K]To – reference environment temperature, [K]u – specific internal energy, [Jkg–1]V – velocity, [ms–1]V1 – aircraft velocity, [ms–1]
v – specific volume, [m3kg–1]�WC – compressor input power, [W]�WT – turbine output power, [W]
Greek symbols
hc – compressor polytropic efficiency
hD – diffuser polytropic efficiency
hT – turbine polytropic efficiency
Y – second law efficiency
Subscripts
ch – chemicalkn – kineticp – productph – physicalpt – potentialr – reactant1 – diffuser inlet2 – diffuser out let3 – compressor Inlet4 – compressor outlet5 – combustion chamber inlet6 – combustion chamber outlet7 – afterburner inlet or turbine outlet8 – afterburner outlet or nozzle inlet9 – nozzle outlet10 – combustion chamber inlet11 – afterburner inlet12 – compressor cooling air outlet13 – combustion chamber cooling air inlet14 – afterburner cooling air inlet
[3] Dincer, I., Rosen, M. A., Exergy: Energy, Environment, and Sustainable Development, Elsevier, Oxford,2007
[4] Riggins, D., McClinton, C., Thrust Modeling for Hypersonic Engines, AIAA paper 95-6081, 1995[5] Riggins, D. W., High-Speed Engine/Component Performance Assessment Using Exergy and
Thrust-Based Methods, report NASA-CR-198271, National Aeronautics and Space Administration,Langley Research Center, Hampton, Va., USA, 1996a
[6] Riggins, D. W., The Evaluation of Performance Losses in Multi-Dimensional Propulsive Flows, AIAA pa-per 96-0375, 1996b
[7] Riggins, D. W., Brayton Cycle Engine/Component Performance Assessment Using Energy andThrust-Based Methods, AIAA paper 96-2922, 1996
[8] Riggins, D. W., Evaluation of Performance Loss Methods for High-Speed Engines and Engine Compo-nents, Journal of Propulsion and Power, 13 (1997), 2, pp. 296-304
[9] Riggins, D., The Thermodynamic Continuum of Jet Engine Performance: The Principle of Lost Work Due toIrreversibility in Aerospace System, International Journal of Thermodynamics, 6 (2003), 3, pp. 107-120
[10] Curran, E. T., The Use of Stream Thrust Concepts for the Approximate Evaluation of Hypersonic RamjetEngine Performance, US Air Force Aero Propulsion Laboratory, Report AFAPL-TR-73-38,Wright-Patterson Air Force Base, O., USA, 1973
[11] Brilliant, H. M., Analysis of Scramjet Engines Using Exergy Methods, AIAA paper 95-2767, 1995[12] Horlock, J., Thermodynamic Availability and Propulsion, AIAA paper 99-741, 1999[13] Rosen, M. A., Etele, J., The Impact of Reference Environment Selection on the Exergy Efficiencies of
Aerospace Engines, ASME Advanced Energy System, 39 (1999), 3, pp. 583-591[14] Rosen, M. A., Etele, J., Aerospace System and Exergy Analysis: Application and Methodology Develop-
ment Needs, International Journal of Exergy, 1 (2004), 4, pp. 411-425[15] Gaggioli, R. A., Paulus, J. D., The Exergy of Lift, and Aircraft Exergy Flow Diagrams, International Jour-
nal of Thermodynamics, 6 (2003), 4, pp. 149-156[16] Bejan, A., Siems, D. L., The Need for Exergy Analysis and Thermodynamic Optimization and Aircraft
Development, International Journal of Exergy, 1 (2001), 1, pp. 14-24[17] Rancruel, D. F., Von Spakovsky, M. R., Decomposition with Thermoeconomic Isolation Applied to the
Optimal Synthesis/Design of an Advanced Fighter Aircraft System, International Journal of Thermody-namics, 6 (2003), 3, pp. 121-129
[18] Hunt, L., et al., Wake Integration for Three Dimensional Flow Field Computations, Theoretical Develop-ment, Journal of Aircraft, 36 (1999a), 2, pp. 357-365
[19] Hunt, L., et al., Wake Integration for Three Dimensional Flow Field Computations, Application' Journalof Aircraft, 36 (1999b), 2, pp. 366-373
[20] Riggins, D., et al., Methodology for the Performance Analysis of Aerospace Vehicles Using the Laws ofThermodynamics, Journal of Aircraft, 43 (2006), 4, pp. 953-963
[21] Moorhouse, D. J., Hoke, C. M., Thermal Analysis of Hypersonic Inlet Flow with Exergy-Based DesignMethods, International Journal of Applied Thermodynamics, 5 (2002), 4, pp. 161-168
[22] Amati, V., et al., Exergy Analysis of Hypersonic Propulsion Systems: Performance Comparison of TwoDifferent Scramjet Configurations at Cruise Conditions, Energy: An International Journal, 33 (2008), 2,pp. 116-129
[23] Turgut, E. T., et al., Exergoeconomic Analysis of an Aircraft Turbofan Engine, International Journal ofExergy, 6 (2009), 3, pp. 277-294
[24] Turgut, E. T., et al., Exergy Analysis of a Turbofan Aircraft Engine, International Journal of Exergy, 6(2009), 2, pp. 181-199
[25] ***, Northrop Co. Technical Order of Aircraft 1F-5E/F, Report, 1978[26] Dagaut, B., Cathonnet, P., The Ignition, Oxidation and Combustion of Kerosene: A Review of Experimen-
tal and Kinetic Modeling, Progress in Energy and Combustion Science, 32 (2006), 1, pp. 48-92[27] Sochet, I., Gillard, P., Flammability of Kerosene in Civil and Military Aviation, Journal of Loss Preven-
tion in the Process Industries, 5 (2002), 3, pp. 335-345[28] Bejan, A., Advanced Engineering Thermodynamics, John Wiley and Sons, New York, USA, 1998[29] Bejan, A., et al., Thermal Design and Optimization, John Wiley and Sons, New York, USA, 1998
Paper submitted: September 11, 2011Paper revised: April 13, 2012Paper accepted: August 24, 2012
Ehyaei, M. A., et al.: Exergetic Analysis of an Aircraft Turbojet Engine ...1194 THERMAL SCIENCE: Year 2013, Vol. 17, No. 4, pp. 1181-1194