Embed Size (px)
Citation preview

EXHIBIT 1
From: Donna TisdaleTo: CNFMSUP; [email protected]; [email protected]: SDGE MSUP-PTCDate: Thursday, November 07, 2013 4:45:05 PMAttachments: SDGE MSUP BPG comments 10-23-13.pdf
Please find the attached comments that I am submitting as the Chair of the BoulevardPlanning Group as an individual.
Thank you,
Donna TisdalePO Box 1272Boulevard, CA 91905619-766-4170
1 11-7-13: Boulevard Planning Group /Tisdale: SDG&E MSUP-PTC scoping comments
SDG&E Master Special Use Permit (#310) and Permit to Construct (A.12-10-009)
Power Line Replacement Projects—scoping comments
Date: November 7, 2013
To: CPUC via [email protected] & [email protected]; USFS via [email protected]
From: Donna Tisdale, as Chair the Boulevard Planning Group; and as an individual: PO Box 1275, Boulevard, CA 91905; 619-766-4170; [email protected]
1. Second request to extend comment deadline beyond Nov 7th : Due to the failure to include Boulevard in the Public Notice as an impacted community, and the
significant number of projects we are already burdened with, I did not include it on our October 3rd agenda for a vote.
The Nov 7th comment deadline is the same date as our monthly meeting which does not allow for time for a public group discussion and action.
According to calls made to the libraries, listed in the Public Notice and NOP as project information repositories, no project documents or map books were reported to be on hand or available to the public at any of them as indicated in the notices.
Several libraries confirmed they did have copies of the Public Notice and NOP. Librarians at the Ramona and Julian Libraries reported having copies of a different SDG&E
Transmission Line project that does not help the public comment on this project, and seemed confused between the two projects.
Not all backcountry residents, who may be impacted by this project, have computers or internet access without having to drive miles to a library.
Belated delivery of SDG&E’s Plan of Development to several libraries and scattered SDG&E offices (that are only open during business hours) are insufficient to allow adequate public review to meet the November 7th deadline.
2. Impacted community of Boulevard and others were inexplicably left out of public notices, maps, documents:
The eastern end of TL629E impacts the Boulevard Planning Area between Miller Valley and SDG&E’s Crestwood Substation located on tribal land at the Golden Acorn Casino.
Boulevard residents driving along Historic Route 80, through the section of Campo Reservation that hosts the Crestwood Substation, will also be impacted during construction and potential road closure and the increased industrial nature and appearance of local electrical infrastructure.
However, Boulevard was not named as an impacted community in the public notices1 or documents giving a false impression to our residents that there are no local impacts.
1 Public Notice: http://www.cpuc.ca.gov/environment/info/dudek/CNF/MSUP_PTC_Public%20Notice_final.pdf
2 11-7-13: Boulevard Planning Group /Tisdale: SDG&E MSUP-PTC scoping comments
Alpine and other impacted communities were also not identified which may have mislead planning groups and residents to believe their neighborhoods were not involved.
Community Planning Groups should have more time to review and consider project compliance with their Community Plans and community character.
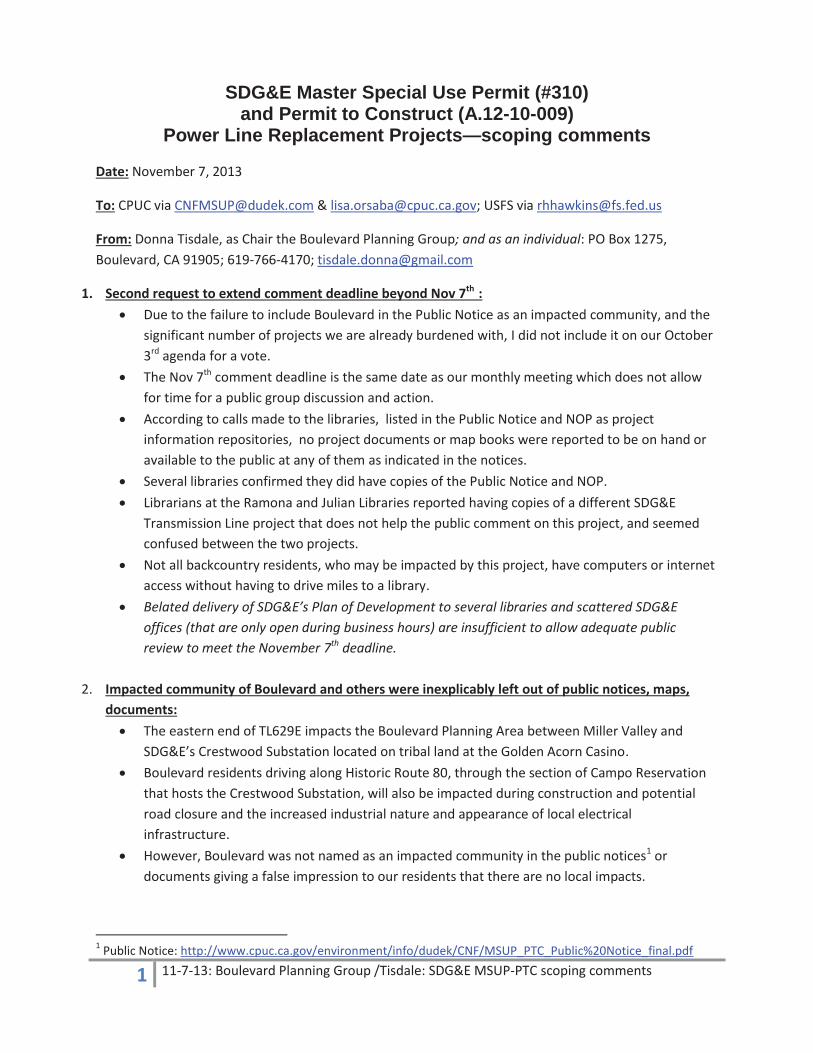
3. Are steel poles really more fire resistant and reliable than wooden poles or other poles?
The Fire Performance of Steel Utility Poles – Literature Review and Evaluation (August 2013) produced by Stephan T. Smith, PE2, states the following (emphasis added): “Because such steel poles still represent only a small fraction of all utility poles, with most installed relatively recently, and their performance in resisting damage from wildfires has little documentation, we really don’t know whether steel poles resist fire damage better than wood poles”.
Smith’s conclusion: “While the literature reviewed does not definitively indicate how well galvanized steel poles would resist wildfire conditions, it provides sufficient evidence to indicate that utilities should not assume that galvanized thin-wall steel utility poles will perform better than preserved wood poles under wildfire exposure conditions. Wildfire temperatures may heat the steel of poles to over 500oC, leading to failure by buckling during the fire due to loss of bending strength and elasticity or later due to corrosion exacerbated by damage to galvanizing. Further study of galvanized steel poles subjected to actual wildfires and laboratory testing that includes pole heating with simultaneous applied loads would help to understand and better predict performance”.
4. Will steel poles attract more lighting? Do they prevent transformer fires? Do steel poles attract more lightning strikes in our fire-prone backcountry? Do they create more dangerous conditions for workers and residents during electrical storms? December 26, 2012: news report from Waco Texas stated as many as 30 electrical fires started
around 4 AM at the top of power poles, including transformers. The cause was suspected to be dust buildup on transformers which caused them to short out due to low-lying fog3.
May 17, 2013: Similar cause was reported by PG&E as the source of 9 transformer fires at the top of power poles in San Francisco on the same night4.
5. Single to Double Circuit increase for TL629E is not needed for Reliability -- but will increase carrying capacity of the lines:
SDG&E representatives state that increasing the single circuit line to double circuit between the Cameron /Boulevard Tap at Kitchen Creek Road and Crestwood Substation is needed for reliability to prevent outages to customers—and they disingenuously downplay and deny that it will increase carrying capacity of the lines.
2 http://www.woodpoles.org/documents/SteelPoleFirePerformanceLiteratureReview_16Aug2013.pdf 3 Waco transformer fires: http://www.kwtx.com/home/headlines/Authorities-Checking-On-Series-Of-Thursday-Morning-Power-Pole-Fires-182344131.html
4 San Francisco transformer fires: http://abclocal.go.com/kgo/story?id=9116843
3 11-7-13: Boulevard Planning Group /Tisdale: SDG&E MSUP-PTC scoping comments
SDG&E managed to convince the CPUC that their $435M 138kV/230kV/500kV ECO Substation and 138kV/69kV/12kV Boulevard Substation rebuild, with 14 miles of new high voltage 138kV line between them, was needed for RELIABILITY FOR BOULEVARD, JACUMBA, AND THE CAMPO, LA POSTA AND MANZANITA TRIBAL COMMUNITIES5, by providing energy from the renewable energy projects and a new tap into the Southwest Powerlink near In-Ko-Pah.
Is SDG&E’s previous reliability claim no longer valid for ECO Substation? This is a typical Method of Operation for SDG&E – to make different claims for different
projects. On April 2, 2012, SDG&E filed an ex-parte document with the CPUC for the ECO Substation
Application 09-08-003 stating that 11 renewable energy projects, representing 1,500 MW, were in the queue to connect to the Boulevard Substation and ECO Substation.
Several more energy projects have been announced since SDG&E filed those comments and some have been withdrawn.
The following projects already exist within the Boulevard Planning Area: 50MW Kumeyaay Wind facility (25-2MW turbines) located on Campo tribal land
that connects to the Crestwood Substation Existing solar PV at the Clover Flat Elementary school Existing solar PV on the parking shades at the new $29M Boulevard Border Patrol
Station Numerous existing residential scale point-of-use solar and small wind turbines.
How much reliability and local generation does Boulevard need—really??
6. 551 MW of energy projects planned for Boulevard are still listed as active in CAISO Grid Queue as of 10-25-136:
# 32: 201 MW wind / Boulevard East Substation 138kV; online date of 2/31/15 #106A: 160 MW wind/ Boulevard East Substation 138kV;online date of 5/1/16 #653 ED: 20MW PV / Boulevard East Substation 69kV; online date of 10/31/14 #789: 80MW PV / Boulevard East Substation 69kV; online date of 12/31/14 #794: 45 MW PV/Boulevard East Substation 138kV; online date of 12/31/14 #895: 15MW PV/ Boulevard East Substation 138kV; online date of 12/31/16 #959: 30MW PV/Crestwood-Boulevard Substation 69kV; online date listed as 12/31/16 Additional projects are in the Grid Queue to connect at the new ECO Substation Another project is in line to connect at the Barrett Substation
7. Current list of known energy projects proposed along TL629 from west (Descanso) to east
(Boulevard): Viejas Blvd PV 1 2MW Descanso solar project is proposed by Ecoplexus on Merigan Ranch
property located on APN 408-070-37-00 on Viejas Boulevard. The same property has an
5 http://www.sdge.com/key-initiatives/eco-substation/eco-substation-project ; https://www.sdge.com/sites/default/files/documents/1534198779/ecosubstation_factsheet.pdf?nid=2370 6 CAISO grid queue: http://www.caiso.com/Documents/ISOGeneratorInterconnectionQueue.pdf
4 11-7-13: Boulevard Planning Group /Tisdale: SDG&E MSUP-PTC scoping comments
apparent existing easement for TL 629.7Exoplexus has made a presentation to the Descanso Community Planning Group
Buckman Springs PV1 2 MW DC solar project is proposed for 4227 Buckman Springs Road (APN 52-100-08-00) at the NW corner of the intersection of Buckman Springs Road and Historic Route 80, next door to SDG&E’s operations center. A ROW for the existing TL 629 appears to be located on the same property or in the adjacent ROW for Historic Route 80. See map below.
2 MW Buckman Springs PV 2 solar project is planned by Exoplexus at the NE corner of Historic Route 80 on APN 527-080-11-00 directly across from SDG&E’s operations center. See map below.8
SDG&E’s map 34 of 73 also shows a staging yard for the MSUP/PTC project planned on the same private land proposed for the Exoplexus Solar project
12.5 MW / 50 acre Kumeyaay Solar project proposed by Infigen on Campo tribal land, north of I-8, that will connect to the Crestwood Substation and TL629
30MW Fox Solar project proposed by Infigen on private land in Boulevard at Tierra Del Sol and Hwy 94 with stated plans to connect via existing 69kV line TL6931 that connects to the Crestwood Substation (and to TL 629?).
Golden Acorn Casino 1 MW Wind turbine proposed adjacent to the Crestwood Substation is in the public comment period for the Environmental Assessment. Nov 8th is comment deadline.
The EA claims the wind turbine will generate about 2/3rds of the energy consumed by the Golden Acorn Casino and Travel Center.
Will these projects be getting a free-pass on needed transmission upgrades disguised as fire hardening?
8. INCREASED CAPACITY WILL SUPPORT NEW ENERGY GENERATION PROJECTS AND TRANSFORMATION INFRASTRUCURE & EACH AND EVERY COMPONENT REPRESENTS NEW FIRE IGNITION SOURCES
Around 2005, SDG&E submitted a CAT EX application for ROW #: CA-660-05-25/ case # CACA-468859 “…for a 30 foot wide right-of-way grant to authorize this existing facility, involving one wood pole and 458.30 feet of 69kV electrical conductor, located on public lands within T.17S., R. 6E., Section 18 NW¼NE¼ SBM (see attached map), and to re-conductor the electrical line to allow for increased transmission capability, from 269 to 418 Amps”. “The need to re-conductor the line is a result of development of a new wind energy project being located on Bureau of Indian Affairs (BIA) managed Kumeyaay tribal lands. Construction of the wind energy project is expected to begin this summer and be completed by the end of the year. This power line, approximately 7 miles in length, extends from the Crestwood substation to the Boulevard Tap facility”. (emphasis added)
Each project will include electric generation (solar PV, CPV, wind) project will include switches, gears, transformers flammable oil, inverters, substations, gen-tie lines and more.
At build out SDG&E’s ECO Substation the maximum amount of oil required for the transformers at the ECO Substation will be approximately 569,800 gallons.
What are the cumulative numbers for these projects?
7 Descanso & Pine Valley solar map: http://www.ecoplexus.com/en/projects#utility-san-diego-gas-electric 8 http://www.cpuc.ca.gov/environment/info/dudek/CNF/POD2/CNF%20Revised%20POD%20Attachment%20B-3%20TL629%20Mapbook%20(04-19-13S).pdf 9 Undated copy of CAT EX application is available
5 11-7-13: Boulevard Planning Group /Tisdale: SDG&E MSUP-PTC scoping comments
9. SDG&E’S FIRE HARDENING WITHDRAWAL:
On June 21, 2013, SDG&E withdrew A.12-12-007 TL 6931 for their $34M TL 6931 Fire Hardening/Wind Interconnect Project, a so-called Fire Hardening project for 5 plus miles of TL 6931 and added capacity for the unapproved 160-250MW Shu’luuk Wind Gen-tie project wind – until Invenergy withdrew their gen-tie application on June 21st-- after the Campo Band voted down Invenergy’s wind turbine project.
Withdrawal of A12-12-007TL6931 has not been posted on the CPUC project website10 Map with location of TL6931 and proximity to Crestwood Substation is posted on CPUC
website11 and on SDG&E’s project website that is still up12 SDG&E has not re-filed for an amended application for fire hardening—so how critical was it? SDG&E’s own public documents show that Boulevard is the only area where both the Substation
Generation Available Capacity13 and Feeder (line) generation capacity (#444-445)14 are negative numbers.
10. Water source must be disclosed for construction and maintenance operations before public comment is closed and project is approved:
Where is the water source for this project? Is it legally and technically authorized and environmentally sustainable without off-site impacts
to existing sole source wells and natural springs that serve wildlife and habitat? Currently, SDG&E has increased their vastly under estimated 30 Million gallons (FEIS) to 50
Million gallons and now 90 million gallons for their ECO Substation project in rural East County near Jacumba15
They are buying legally, technically, and environmentally challenged groundwater sources from wells on tribal land and from tiny community water districts.
Much of the proposed project is located within the federally designated Campo-Cottonwood Creek Sole Source Aquifer (SSA)16
The water supply decisions with potentially significant and cumulative significant adverse impacts are being made by the CPUC after comment closes and projects are approved—leaving impacted residents in predominantly low-income rural areas with virtually no recourse.
11. Impacts to riparian areas (limited list due to lack of review /comment time): Staging sites shown on TL629 route map, page 38 of 73, are far too close Kitchen Creek and
related riparian corridor that leads into Lake Morena and to close to adjacent oak grove and Boulder Oaks campground.
10 http://www.cpuc.ca.gov/environment/info/dudek/Wind_Interconnect/Wind_Interconnect.htm 11 http://www.cpuc.ca.gov/environment/info/dudek/Wind_Interconnect/TL6937_WIC_ProjectLocation.pdf 12 https://www.sdge.com/sites/default/files/regulatory/Volume%201_0.pdf 13 Substation generation available capacity: https://www.sdge.com/sites/default/files/documents/877084648/Substation%20Area%20Available%20Gen%20Capacity.pdf?nid=2557 14 SDG&E feeder generation capacity: https://www.sdge.com/sites/default/files/documents/1593864627/Feeder%20Available%20Gen%20Capacity.pdf?nid=2556 15 http://www.cpuc.ca.gov/environment/info/dudek/ecosub/MM%20HYD-3%20Water%20Supply%20Plan.pdf 16 Campo-Cottonwood Creek SSA map: http://www.epa.gov/safewater/sourcewater/pubs/qrg_ssamap_campocottonwood.pdf
6 11-7-13: Boulevard Planning Group /Tisdale: SDG&E MSUP-PTC scoping comments
Fly Yards are located too close oak groves, stream beds, and other sensitive areas TL629 E impacts the La Posta Creek riparian corridor the Miller Valley Creek and pond near
Miller Valley Road south of Historic Rt 80
12. NOISE IMPACTS: According to the project maps, Helicopter Fly Yards are scattered throughout numerous
communities—some of whose names were not listed as impacted communities in Public Notice documents.
However, the fly routes are not disclosed which makes it difficult for the public to comment on a potentially significant and cumulative adverse impact with noise and vibrations from low-flying helicopters rattling houses, nerves, pets, livestock and wildlife.
During Sunrise Powerlink construction, SDG&E bragged about having up to 40 helicopters in the air at once.
Residents complained of major disruptions to their peace and quiet and quality of life. Wildlife, pets, and livestock were witnessed in distress during heavy helicopter traffic Noise, low-frequency noise and vibrations are well-documented and recognized physical and
emotional stressors for living beings. What are the other noise /low frequency noise/ vibration sources expected for this project?
Generators? Drilling rigs? Cumulative noise impacts from low-flying Border Patrol and military air traffic operations Cumulative impacts from construction of Tule Wind, Soitec Solar or other energy projects in the
Boulevard/Crestwood area/La Posta area.
13. Electric and magnetic fields: Attachment F: Electric and Magnetic Fields includes outdated and biased information that does
not reflect the more recent studies and reports or real world impacts to current local residents who believe existing SDG&E equipment and Kumeyaay Wind turbines are associated with cancer and various tumors and other health impacts in people and pets 17
14. Segmentation under CEQA: SDG&E has a track record of segmenting projects On April 27, 2012, SDG&E filed AL2350-E with the CPUC for the Ocotillo Wind switchyard—
separately from the BLM’s NEPA process for the connected action project—despite public comments and complaints
On May 25th, the CPUC notified SDG&E that AL2350-E had been suspended to allow time for staff review.
SDG&E requested a waiver to move the switchyard about 600-700 feet to avoid cultural resources that they had been warned about previously.
They segmented the reconductor of TL 629 from the Kumeyaay Wind turbine EA—that did not disclose that they would be taking Boulevard off-grid for several months, and placing us on two very noisy 1.6MW diesel generators.
17http://www.cpuc.ca.gov/environment/info/dudek/CNF/POD2/CNF%20Revised%20POD%20Attachment%20F%20Electric%20and%20Magnetic%20Fields%20(04-19-13S).pdf
7 11-7-13: Boulevard Planning Group /Tisdale: SDG&E MSUP-PTC scoping comments
SDG&E has segmented this MSUP/PTC from the Tie-Line 637 Wood-to-Steel Project (Application No. A. 13-03-003) fire hardening of the line through Ramona.
SDG&E attempted to segment the following connected and indirect action projects from their ECO Substation project that resulted in a re-circulated EIR: Tule Wind, Energia Sierra Juarez Wind and 500kV cross-border transmission line, Jordan Wind (aka Jewel Valley Wind), Campo Wind (aka Shu’luuk Wind), Manzanita Wind.
There are more examples – but not enough time to research and list them
15. Visual Impacts:
Along with the change in visual appearance during the day, reflectors located at the top of new steel poles already installed in Boulevard have generate a strange glow that is distracting as you drive along Historic Route 80
Will non-reflective wire be used? Some of the new heavier wire on transmission lines in Boulevard is much thicker, shinier, and
much more visible from close up and at greater distances that previous smaller wires. Again, cumulative impacts to the Boulevard Planning Area and other communities from multiple
projects must be considered and addressed.
15. Cost-benefit / needs analysis and alternatives:
Billions of dollars are being spent by rate-payers and tax payers to support lucrative SDG&E projects with a guaranteed rate of return for shareholders and guaranteed misery for the impacted communities that are shown little to no respect or guaranteed mitigation funding that will stay in their neighborhoods.
$1.9B for Sunrise Powerlink with unmitigable fire risk; $435 M ECO Substation with unmitigable fire risk and risk to local groundwater supplies; $469M for just two of the four Soitec Solar CPV projects proposed in Boulevard, within 100-200 feet of existing homes.
Power Purchase Agreements for renewable energy projects are being approved at Above Market Rates for 25 years or more.
Is the expense of this $418 M so-called fire hardening project justified? Are there better cheaper alternatives? Will it actually increase fire risk and change fire fighting strategies? Will funding be provided to increase fire coverage / equipment / staffing in the impacted
communities?
16. Environmental Justice issues must also be addressed: Comprehensive Economic Development Strategy (CEDS) Census tracts map shows
Boulevard/Jacumba area with per capita income 80 percent or less of the national per capita income of $27,334 (2010 inflation-adjusted dollars)18
The same map shows high unemployment and low –income in many other communities that will be impacted by this project.
18 (CEDS) map showing South and East County low-income census tracts: http://www.southcountyedc.net/images/CEDSmap_January2013_final.pdf
8 11-7-13: Boulevard Planning Group /Tisdale: SDG&E MSUP-PTC scoping comments
Many multi-million / billion dollar projects are located less than several hundred feet from existing homes and small ranches in an area where 58-65 % of school children qualify as socioeconomically disadvantaged19 and some seniors reportedly could not qualify for meals on wheels due to lack of required ability to keep food fresh and /or warm.
State law requires that Environmental Justice issues for low-income communities, especially those related to disproportionate adverse impacts must be recognized, analyzed and addressed20
May 8, 2012, the California Attorney General’s office released a report entitled “Environmental Justice at the Local and Regional Level – Legal Background” (Report)21 which interprets existing law to impose environmental justice obligations that local governments must consider when approving specific projects and planning for future development
The Report interprets the California Environmental Quality Act (CEQA) and its implementing Guidelines to require lead agencies to consider the public health burdens of a project as they relate to environmental justice for certain communities. While the Report acknowledges that there is no mention of “environmental justice” within CEQA, the Report notes that CEQA’s main purpose is to evaluate whether a project may have a significant effect on the physical environment, and asserts that “human beings are an integral part of the environment”.
# # #
19 Clover Flat School: : http://meusd-ca.schoolloop.com/file/1314534050429/1315231078251/156882106380789890.pdf 20 Environmental Justice: http://oag.ca.gov/sites/all/files/pdfs/environment/ej_fact_sheet_final_050712.pdf ; http://thomaslaw.com/attorney-general-releases-report-interpreting-ceqa-to-require-consideration-of-environmental-justice-issues-at-the-local-and-regional-levels/ 21 http://oag.ca.gov/sites/all/files/pdfs/environment/ej_fact_sheet_final_050712.pdf

EXHIBIT 2
1
Devin Brookhart
From: Donna Tisdale <[email protected]>Sent: Friday, March 07, 2014 11:42 AMTo: CNFMSUP; [email protected]; [email protected]; Jacob, Dianne; Wilson, Adam;
[email protected]; Wardlaw, Mark; Gretler, Darren MSubject: SDG&E MSUP #310 & PTC A.12-10-009 Powerline replacementAttachments: MSUP-PTC A 12-10-009 supp scoping Tisdale 3-6-14.pdf; Energy projects Countywide
12-19-13.pdf; Sunrise powerlink expansion map.pdf; SDGE Shuluuk Wind Gen Tie TL 6931.pdf
Good Morning, Please find the attached supplemental scoping comments on San Diego Gas & Eelectric's Master Special Use Permit #310 and CPUC Permit to Construction A. 12-10-009 Additional attachments include the following:
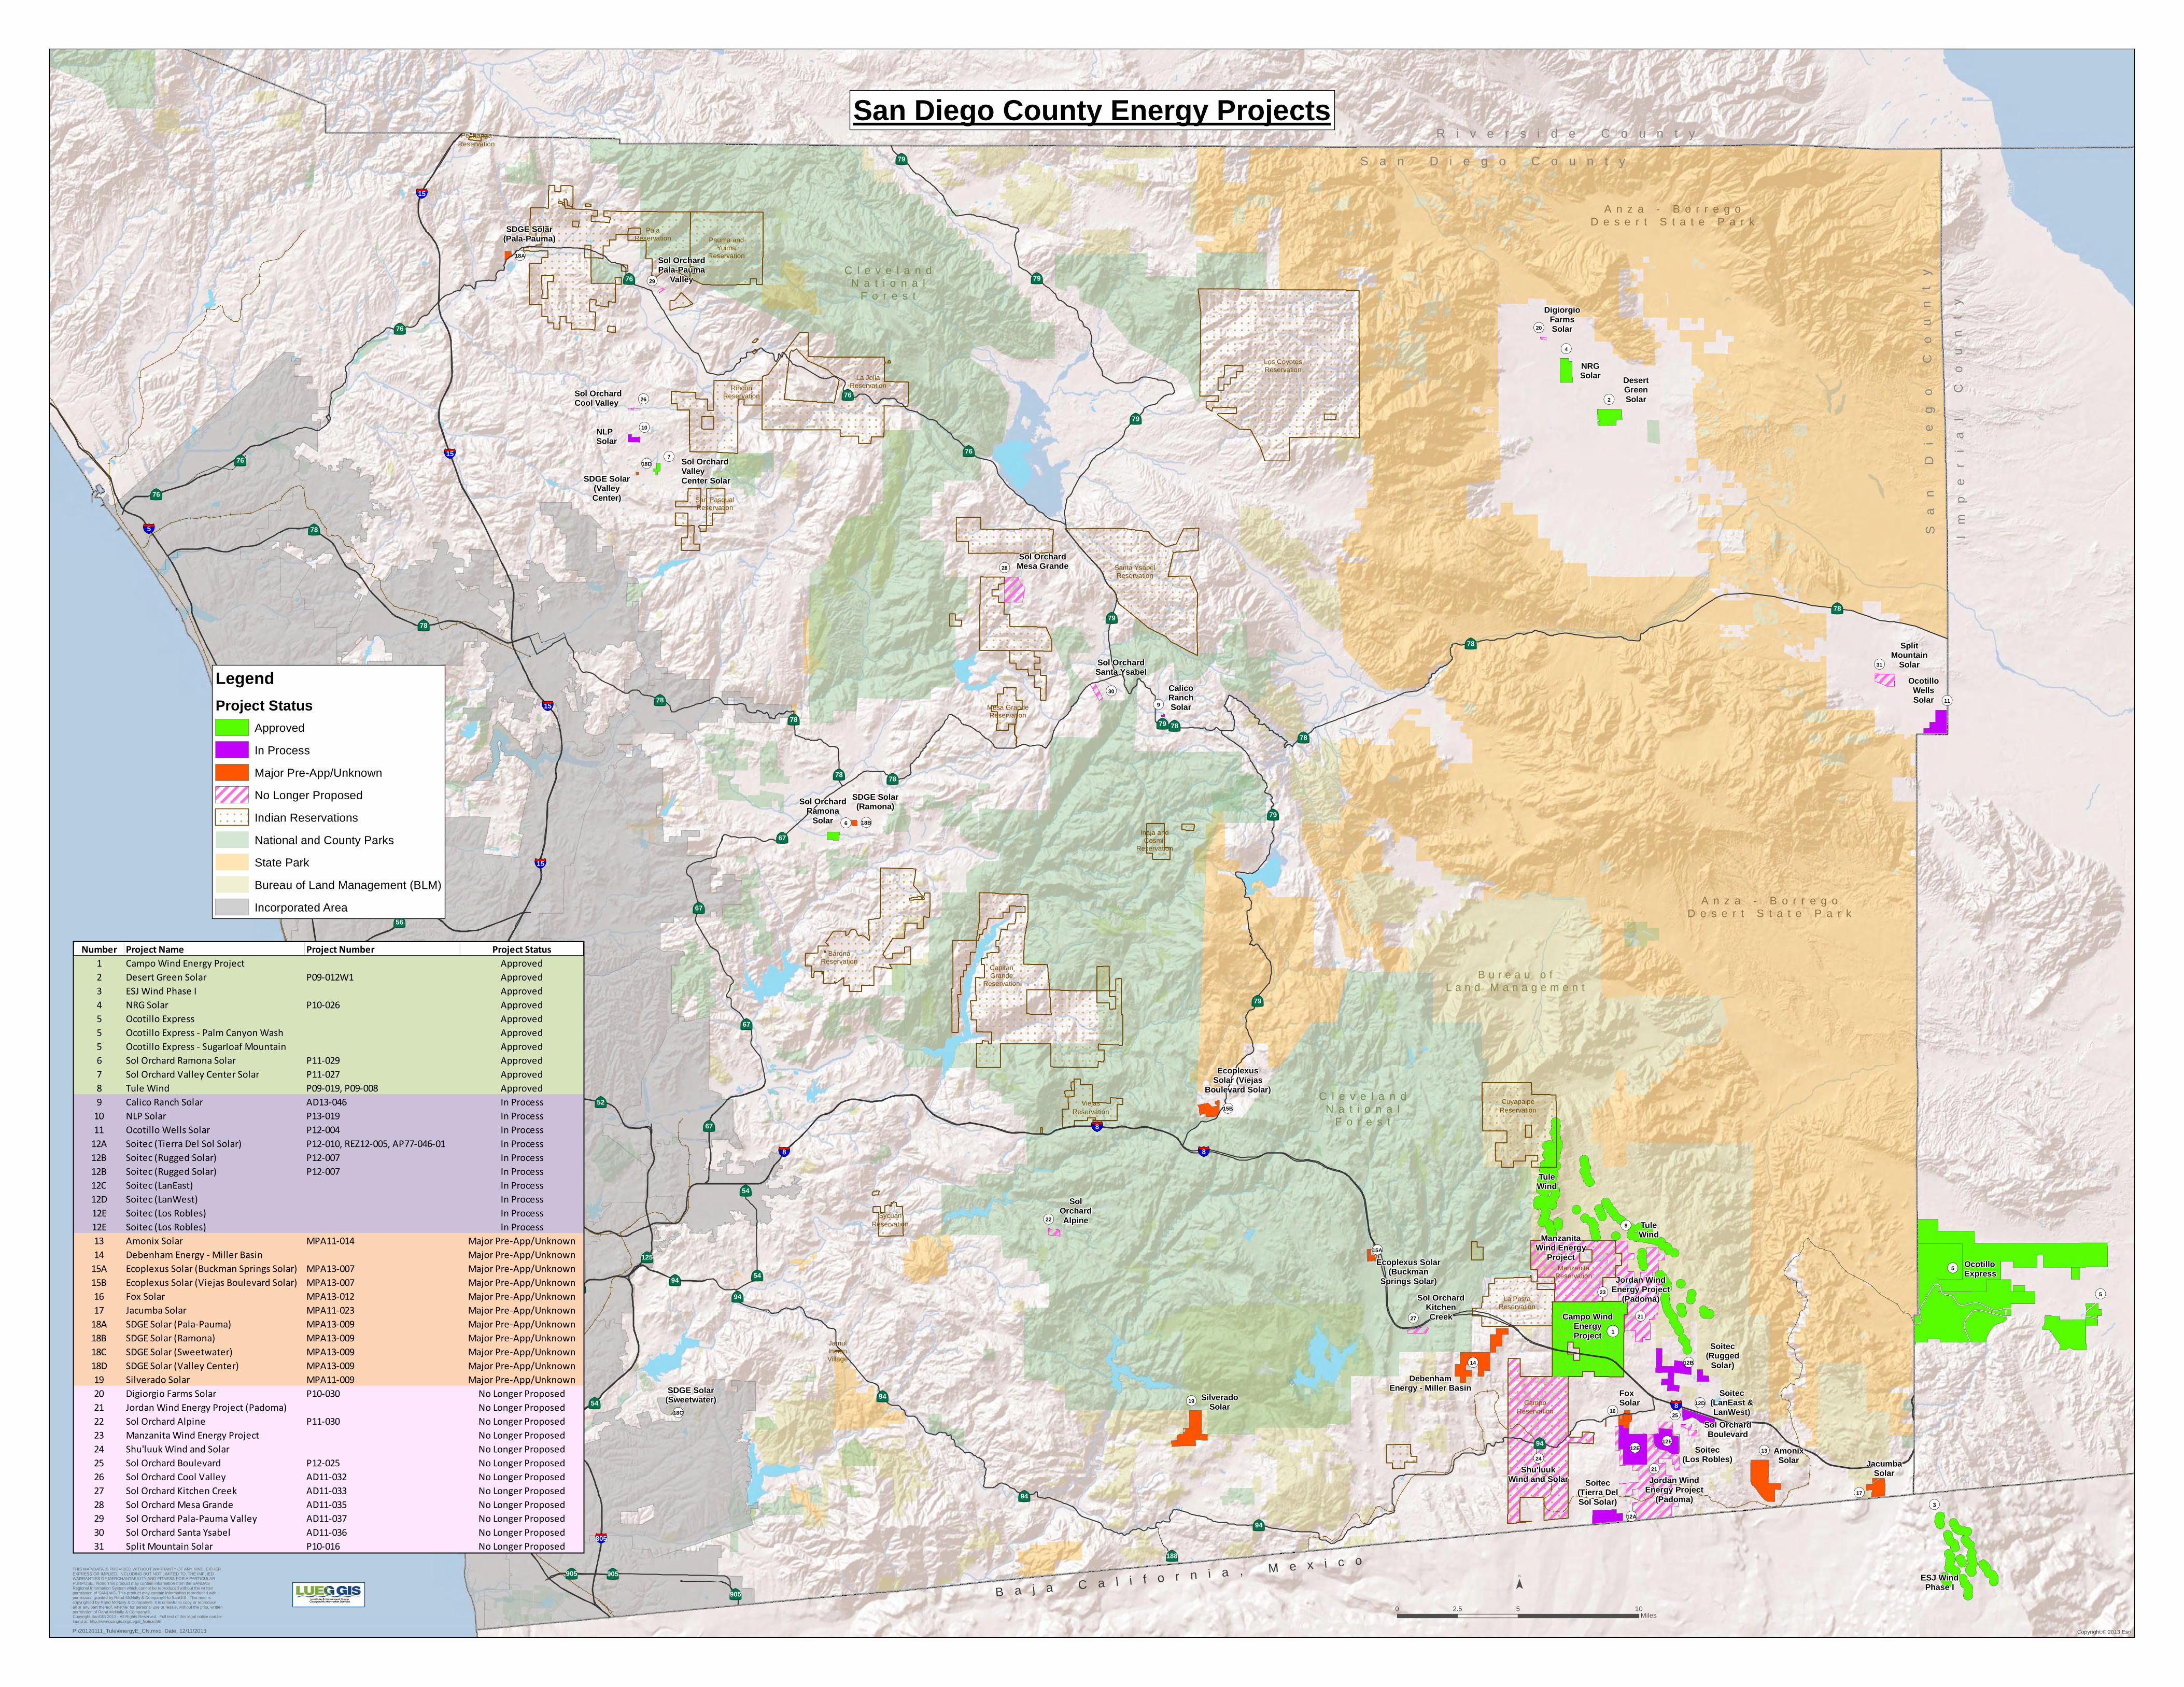
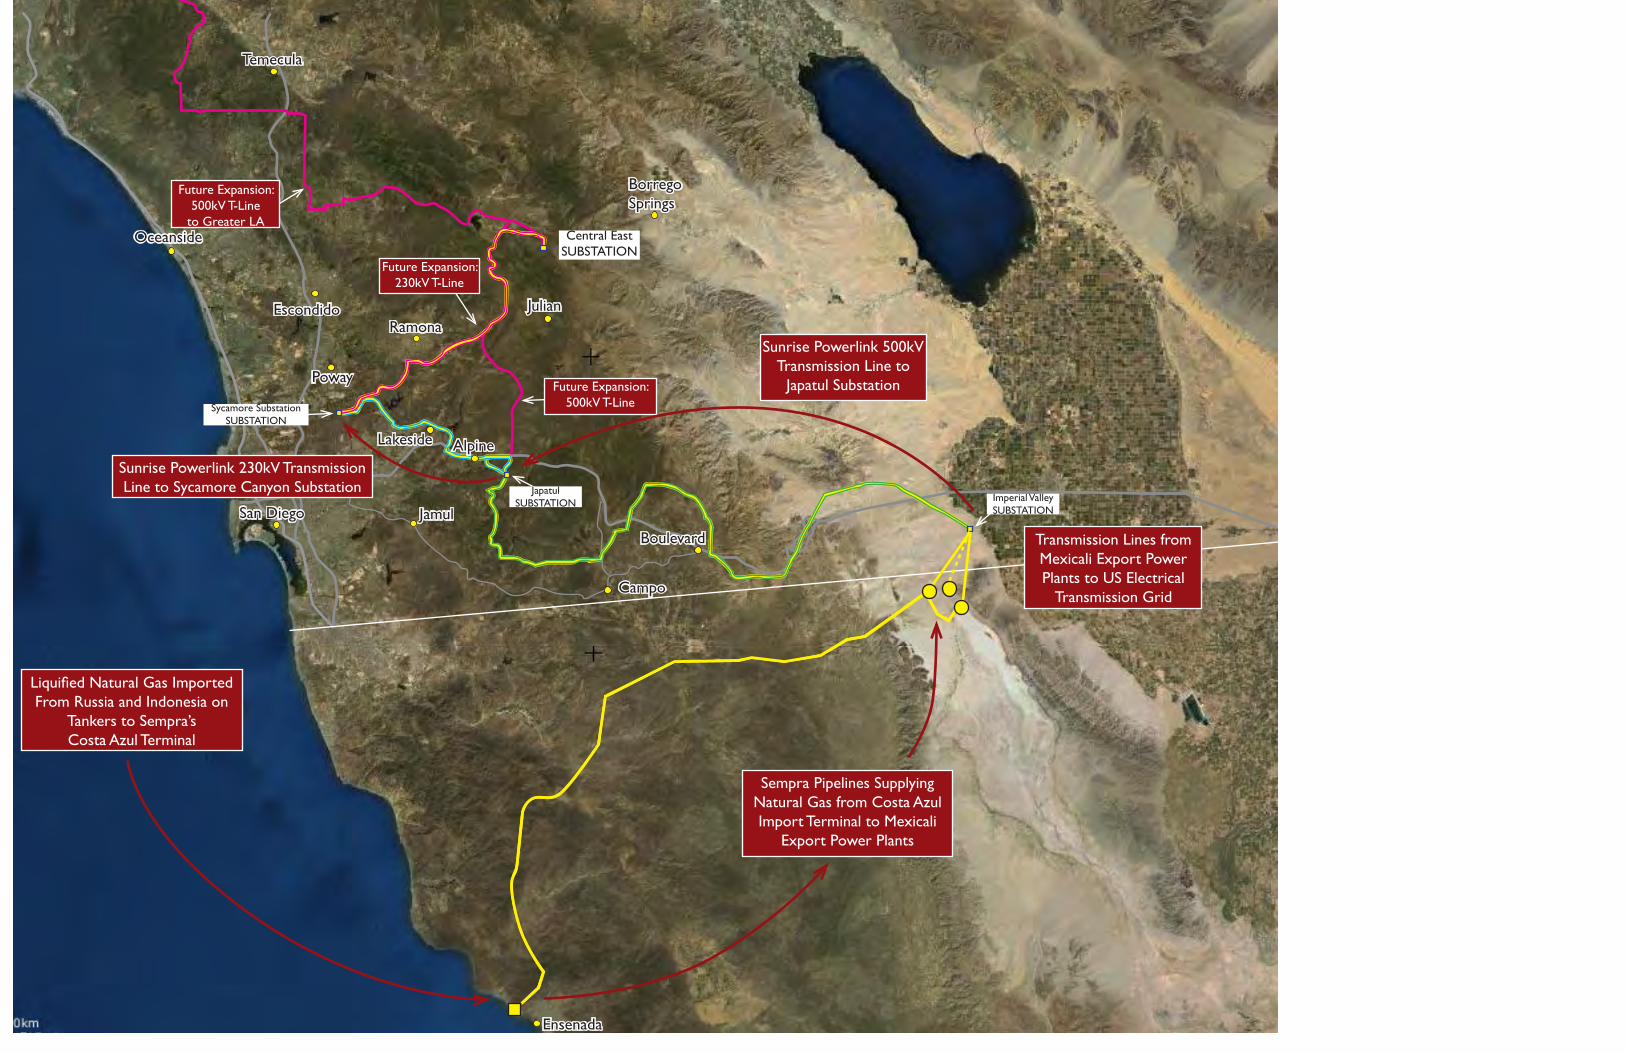
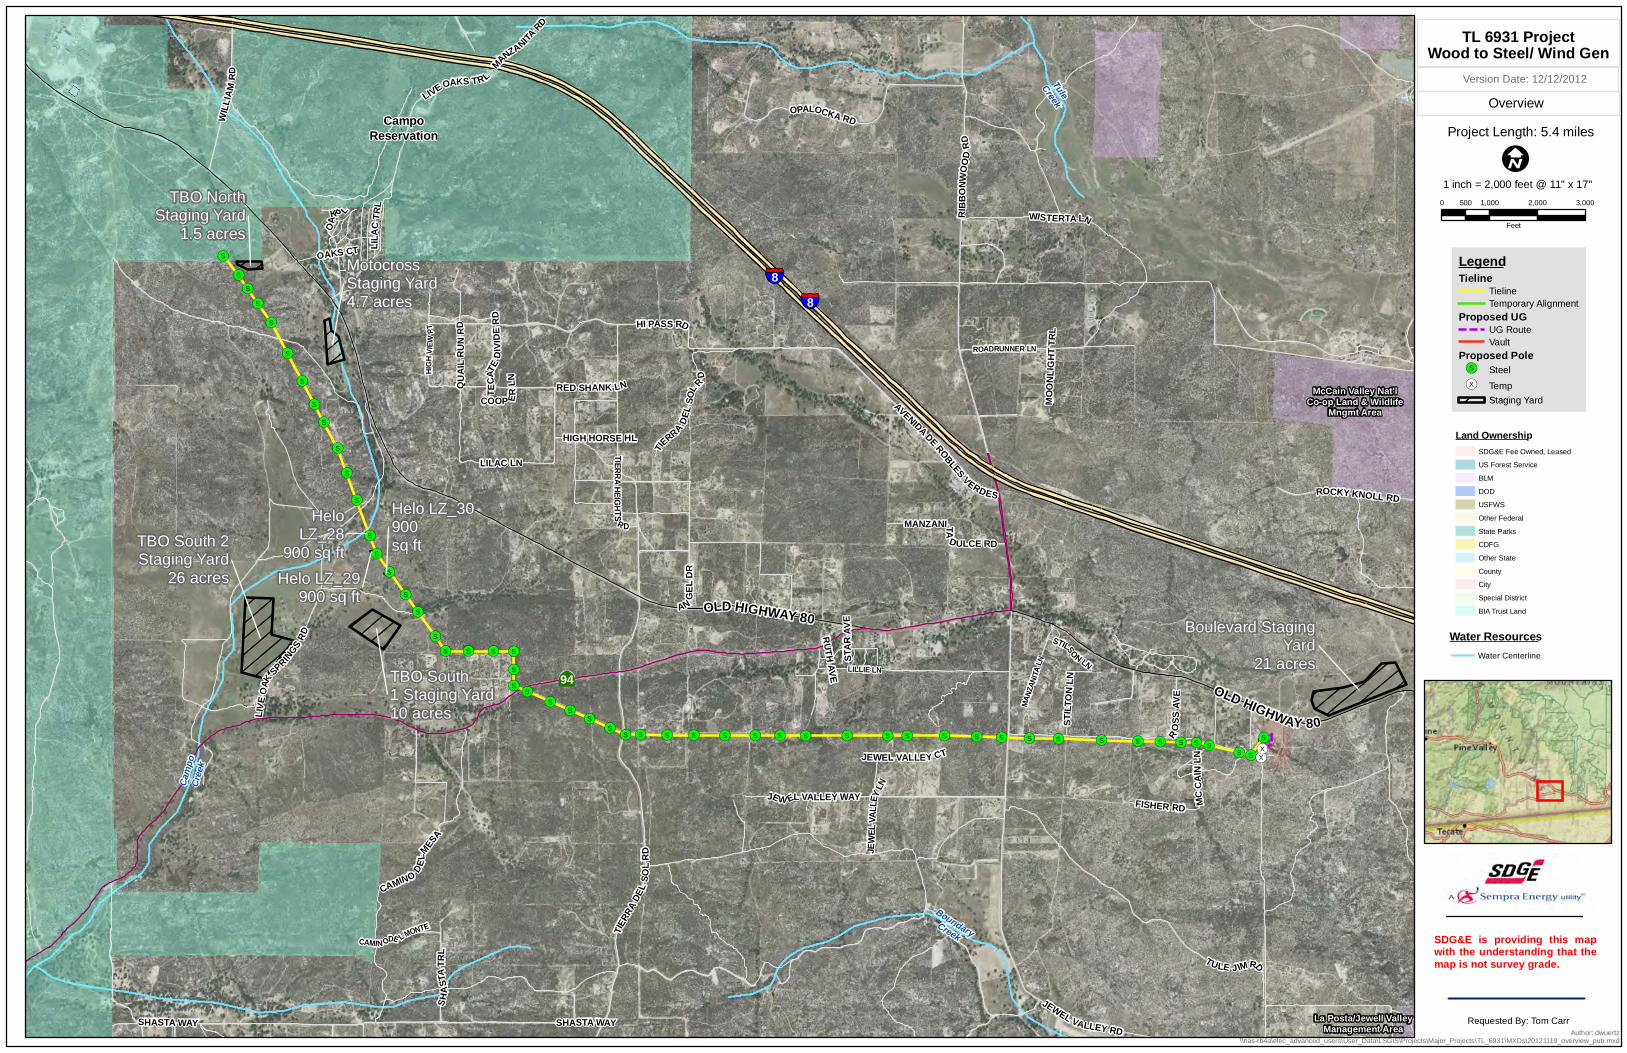
1. San Diego County's Energy Project Map 2. SDG&E's Sunrise Powerlink expansion map Figure 3. SDG&E A. 12-TL 639 fire hardening / Shu'luuk Gen-tie PEA
thank you, Donna Tisdale PO box 1275 Boulevard, CA 91905 619-766-4170
1 Tisdale- BAD MSUP /PTC supplemental scoping comments 3-6-14
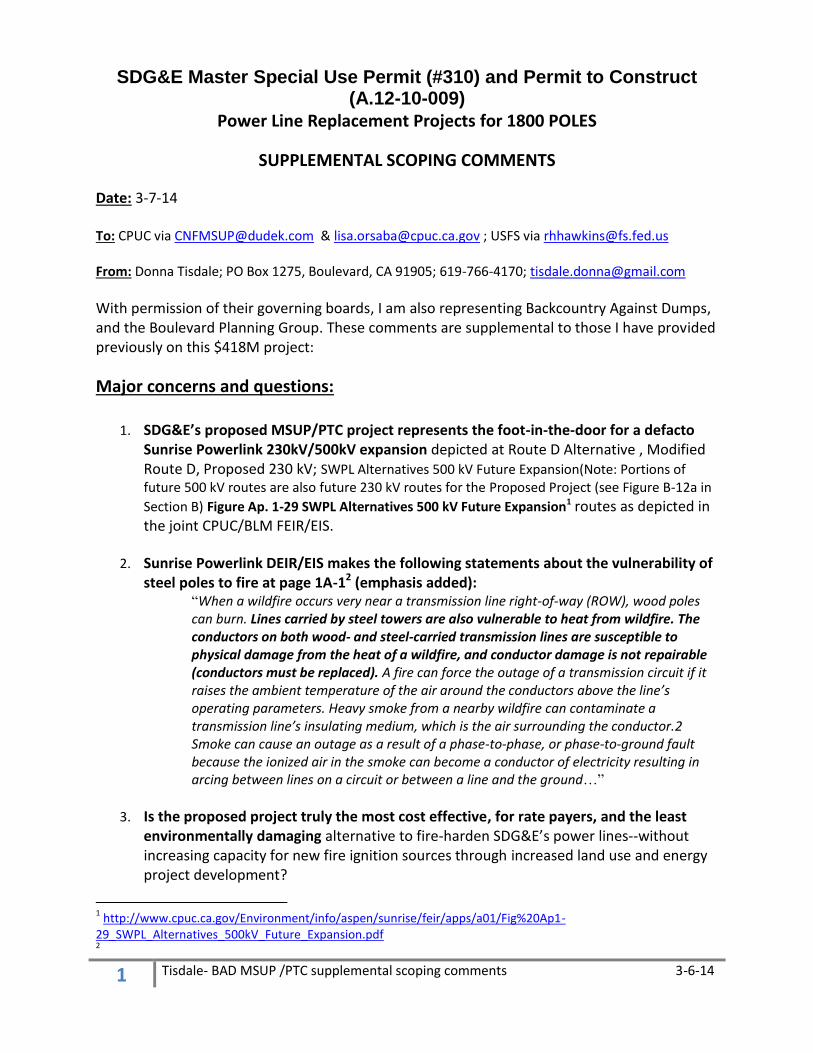
SDG&E Master Special Use Permit (#310) and Permit to Construct
(A.12-10-009) Power Line Replacement Projects for 1800 POLES
SUPPLEMENTAL SCOPING COMMENTS
Date: 3-7-14 To: CPUC via [email protected] & [email protected] ; USFS via [email protected] From: Donna Tisdale; PO Box 1275, Boulevard, CA 91905; 619-766-4170; [email protected]
With permission of their governing boards, I am also representing Backcountry Against Dumps, and the Boulevard Planning Group. These comments are supplemental to those I have provided previously on this $418M project:
Major concerns and questions:
1. SDG&E’s proposed MSUP/PTC project represents the foot-in-the-door for a defacto Sunrise Powerlink 230kV/500kV expansion depicted at Route D Alternative , Modified Route D, Proposed 230 kV; SWPL Alternatives 500 kV Future Expansion(Note: Portions of future 500 kV routes are also future 230 kV routes for the Proposed Project (see Figure B-12a in
Section B) Figure Ap. 1-29 SWPL Alternatives 500 kV Future Expansion1 routes as depicted in the joint CPUC/BLM FEIR/EIS.
2. Sunrise Powerlink DEIR/EIS makes the following statements about the vulnerability of steel poles to fire at page 1A-12 (emphasis added):
“When a wildfire occurs very near a transmission line right-of-way (ROW), wood poles can burn. Lines carried by steel towers are also vulnerable to heat from wildfire. The conductors on both wood- and steel-carried transmission lines are susceptible to physical damage from the heat of a wildfire, and conductor damage is not repairable (conductors must be replaced). A fire can force the outage of a transmission circuit if it raises the ambient temperature of the air around the conductors above the line’s operating parameters. Heavy smoke from a nearby wildfire can contaminate a transmission line’s insulating medium, which is the air surrounding the conductor.2 Smoke can cause an outage as a result of a phase-to-phase, or phase-to-ground fault because the ionized air in the smoke can become a conductor of electricity resulting in arcing between lines on a circuit or between a line and the ground…”
3. Is the proposed project truly the most cost effective, for rate payers, and the least environmentally damaging alternative to fire-harden SDG&E’s power lines--without increasing capacity for new fire ignition sources through increased land use and energy project development?
1 http://www.cpuc.ca.gov/Environment/info/aspen/sunrise/feir/apps/a01/Fig%20Ap1-
29_SWPL_Alternatives_500kV_Future_Expansion.pdf 2
2 Tisdale- BAD MSUP /PTC supplemental scoping comments 3-6-14
4. Smaller metal poles, like those used in other SDG&E wood-to-steel projects, should be a less expensive viable alternative-if SDG&E’s project is truly a like-for-like replacement
5. If the MSUP is approved, how will future expansions and increased carrying capacity be handled?
6. Will the Forest Service and impacted property owners be notified if and when SDG&E plans to upgrades linked substations and increase voltage that the lines will be carrying through ROW easements that impact their properties and resources?
7. Will any communities or properties be taken off-grid for any length of time during SDG&E’s work on these power lines—similar to when Boulevard was taken off-grid for weeks during reconductoring for the 50 MW Kumeyaay Wind project, as done without notification disclosure during the PUC review?
8. Has the reduced land use development allowed in San Diego County’s General Plan 2020 Update and revised Community Plans3 been taken into consideration
9. The CPUC’s PTC process for SDG&E’s 85 acre ECO Substation and new Boulevard Substation was vastly inadequate and the ALJ declined to review SDG&E’s clearly stated and reasonably foreseeable expansion for multiple 138, 230 and 500kV lines—up to approximately 4,800 MW. An excerpt from page 5 of SDG&E’s PEA4 is copied below”
“The substation will be designed so that it will ultimately be expanded to include the following components:
• Five 500 kV bays in a breaker-and-a-half bus configuration • Nine 230 kV bays in a breaker-and-a-half bus configuration • Nine 138 kV bays in a double-bus/double-breaker configuration • Four 500/230 kV, 1,100 megavolt ampere (MVA) transformer banks with
two single-phase operational spares • Three 230/138 kV, 224 MVA transformer banks • One or more 500 kV series capacitors • Two 230 kV, 63 MVAR shunt capacitors • Four 12 kV, 180 MVAR shunt reactor banks • One 230 kV static VAR compensator • The maximum amount of oil required for the transformers at the ECO
Substation will be approximately 569,800 gallons”
10. Again, SDG&E appears to be piece mealing a defacto expansion of their Sunrise Powlerink plans through various and separate fire hardening projects that will end with the same result—increased carrying capacity between Imperial Valley, rural East County, and the coastal areas of San Diego and Orange Counties.
11. SDG&E’s now withdrawn PTC Application 12-12-007 for their TL 639 Fire Hardening / Shu’luuk Wind gen-tie project 5were the missing link to connect the current MSUP/ PTC’s TL 629 and existing TL639 at the Crestwood Substation that connects to the expanded Boulevard
3 http://www.sdcounty.ca.gov/pds/gpupdate/docs/GP-APRs/GP-APR2013.pdf
4 SDG&E ECO Substation PEA
https://www.sdge.com/sites/default/files/documents/ECOAppPermittoConstruct.pdf?nid=2374 5
3 Tisdale- BAD MSUP /PTC supplemental scoping comments 3-6-14
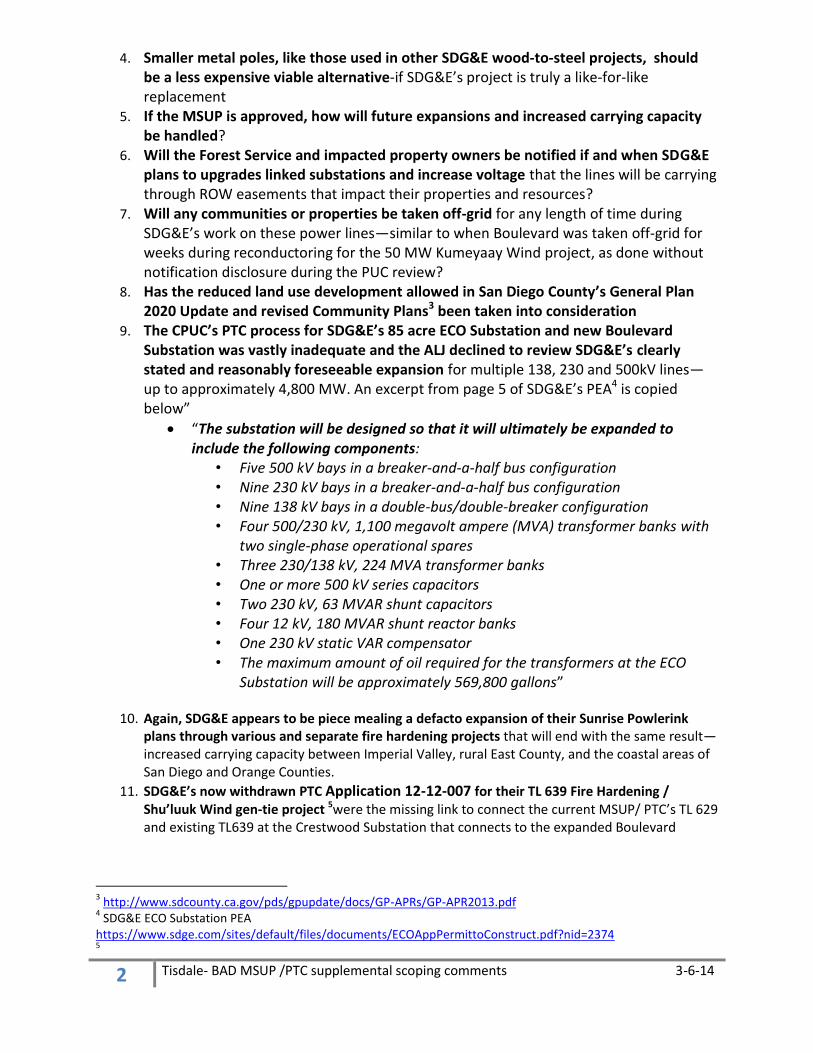
Substation that then connects to the ECO Substation and the Southwest Powerlink 6. See Figure 3-3 (pasted below) at page 59 of SDG&E’ attached A. 12-12-007 PEA, showing both TL639 and TL693 connecting to the Crestwood Substation: https://www.sdge.com/sites/default/files/documents/ECOSubstationProjectMap.pdf . SDG&E withdrew the application when the Campo Band rejected Invenergy’s lease agreement for Shu’luuk Wind in June 2013
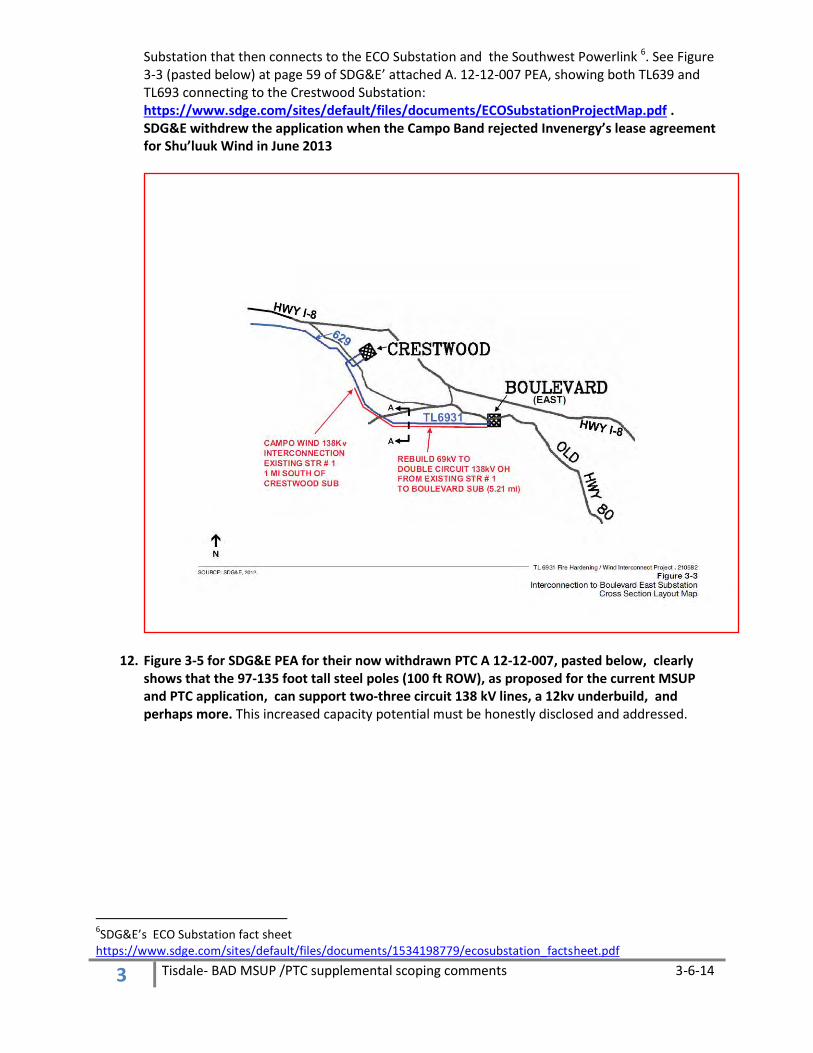
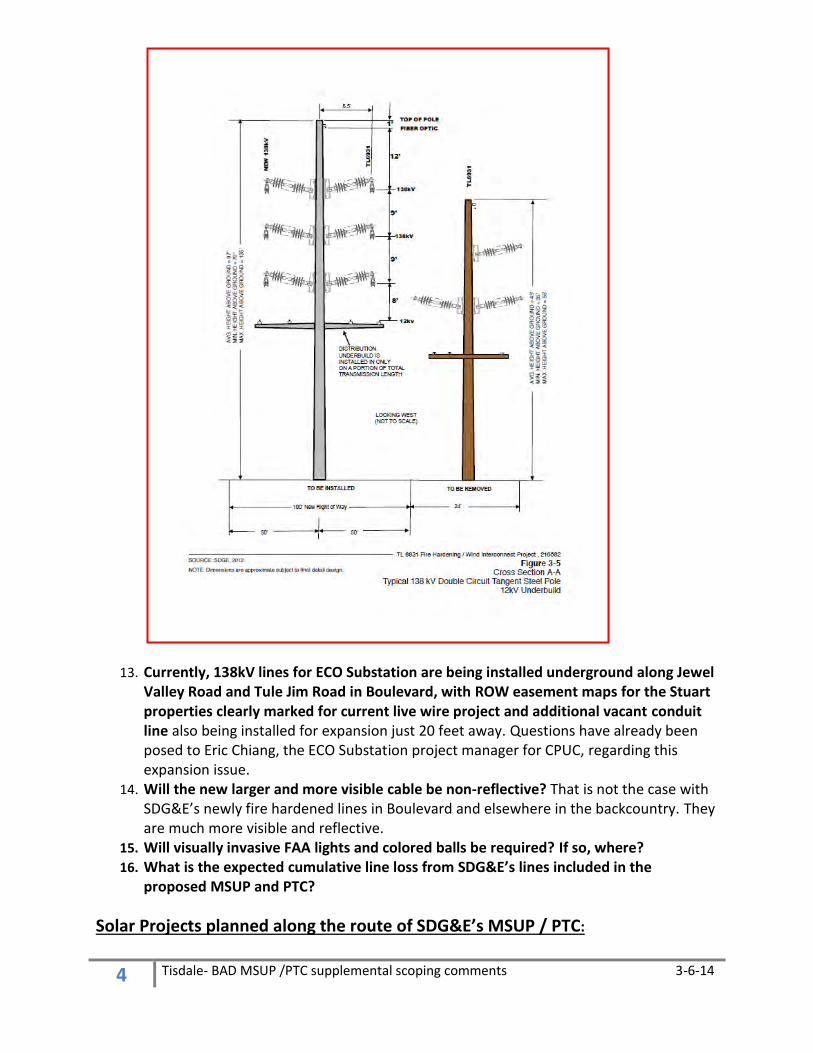
12. Figure 3-5 for SDG&E PEA for their now withdrawn PTC A 12-12-007, pasted below, clearly shows that the 97-135 foot tall steel poles (100 ft ROW), as proposed for the current MSUP and PTC application, can support two-three circuit 138 kV lines, a 12kv underbuild, and perhaps more. This increased capacity potential must be honestly disclosed and addressed.
6SDG&E’s ECO Substation fact sheet
https://www.sdge.com/sites/default/files/documents/1534198779/ecosubstation_factsheet.pdf
4 Tisdale- BAD MSUP /PTC supplemental scoping comments 3-6-14
13. Currently, 138kV lines for ECO Substation are being installed underground along Jewel Valley Road and Tule Jim Road in Boulevard, with ROW easement maps for the Stuart properties clearly marked for current live wire project and additional vacant conduit line also being installed for expansion just 20 feet away. Questions have already been posed to Eric Chiang, the ECO Substation project manager for CPUC, regarding this expansion issue.
14. Will the new larger and more visible cable be non-reflective? That is not the case with SDG&E’s newly fire hardened lines in Boulevard and elsewhere in the backcountry. They are much more visible and reflective.
15. Will visually invasive FAA lights and colored balls be required? If so, where?
16. What is the expected cumulative line loss from SDG&E’s lines included in the proposed MSUP and PTC?
Solar Projects planned along the route of SDG&E’s MSUP / PTC:
5 Tisdale- BAD MSUP /PTC supplemental scoping comments 3-6-14
1. In a February 23rd article on local solar projects7, an Ecoplexus representative was
quoted as saying they “will be using SDG&E’s existing distribution lines…” And those
lines happen to be TL629 as documented below. Ecoplexus eastern San Diego County
project maps are posted here: http://www.ecoplexus.com/en/projects
2. TL 629: Ecoplexus Solar (Buckman Springs Solar), Pine Valley MPA13-007 # 15A on San
Diego County’s Energy Project Map (attached)
3. TL629: Ecoplexus Solar (Viejas Boulevard Solar), Descanso, #15B on County map
4. TL629: Debenham Energy Miller Basin #14 on County map
5. TL 629: Infigen’s proposed 12.5 MW Kumeyaay Solar on 75 acres of Campo Reservation
at Williams Road north of I-8 and the Crestwood Substation (not on County map)
6. TL6923: 350 acres 58MW Silverado Power solar PV (MUP pre-application 3992-11-009)
project on 750 acres of land in Potrero. (#19 on San Diego County’s Energy Project map)
7. TL682: SDGE Solar (Pala-Pauma) MPA 11-023, # 18A on County map
8. TL626: Calico Ranch Solar AD 13-046, Julian, just east of TL626 and SE of Santa Ysabel
Substation, #9 on County map
9. SDG&E separated their wood-to-steel project through Santa Ysabel to Ramona, from
this project, however, both projects may directly or indirectly support increased
capacity for solar projects planned at SDG&E’s Solar (Ramona) at their Creel Substation,
# 18B on County map, Sol Orchard Ramona P11-029, #6 on County map, Sol Orchard
Valley Center Solar (#7), NPL Solar (# 10), and SDG&E Solar ( Valley Center) # 18D
10. There may be more that I missed…refer to the County map and Planning and
Development Services for more details
11. Many of these projects may need substation and line upgrades that should be
considered connected or indirect actions to this project, which may be bypassed with
this approval of this MSUP and PTC as proposed.
12. SDG&W withdrew their AL 2268-E-A8 amending their Sol Orchard Power Purchase
Agreement for 21 separate projects, “to cap at $13.5 million the costs that ratepayers
will pay for distribution and transmission upgrades (network and reliability) necessary
to ensure full deliverability of the projects.” The point is, other solar projects located
along SDG&E’s MSUP/PTC route may benefit through SDG&E’s increased carrying
capacity.
13. There are many more projects planned in Boulevard, Jacumba, Borrego, and
elsewhere that may also benefit from other SDG&E so-called fire-hardening and grid
reliability projects.
14. The current CAISO grid queue connection list9 is linked for reference as to how many
wind and solar projects are currently waiting in line for backcountry connections at the
Boulevard, ECO, Crestwood, and other substations.
7 http://www.eastcountymagazine.org/node/15008
8 http://regarchive.sdge.com/tm2/pdf/2268-E-A.pdf
9 http://www.caiso.com/Documents/ISOGeneratorInterconnectionQueue.pdf
6 Tisdale- BAD MSUP /PTC supplemental scoping comments 3-6-14
Water:
15. Construction and maintenance water sources must be quantified, confirmed, and
verified as legal and in compliance with governing rules, regulations, permits, sphere of
influence boundaries, and other documents.
16. Bulk water sales of 50 million gallons from the Campo Reservation to SDG&E’s ECO
Substation project were recently curtailed reportedly for being not properly authorized
by the General Council
17. 35 million gallons of unauthorized bulk water sales from Live Oak Springs to the ECO
Substation were curtailed last year by the CPUC for not being properly permitted or
authorized
18. The Pine Valley Mutual Water Company is approving bulk water sales to large scale
projects when their amended and restated articles of incorporation (filed 2-8-1988)
clearly state they can only deliver water to their members, or to the state, or any agency
or department thereof.
19. The Jacumba Community Services District is facing backlash over their contracts to sell
15 million gallons of precious groundwater to ECO Substation and more to other large
scale wind and solar projects. Questions regarding lack of compliance with their
governing documents, permits, and sphere of influence have been raised.
20. Dudek was recently found to be in error on their Maderas Golf Club water study10, for
the City of Poway, when their professional conclusion, that irrigation would not draw
down the water table allowed pumping to resume, reportedly resulted in the shutdown
of 4 wells within 60 days due to significant drop in water levels
21. SDG&E’s ECO Substation Water Supply was estimated at 30 million gallons in the EIR
but was increased to 50 million and then 90 million gallons, with Minor Project
Refinement # 8, due to inadequate and faulty analysis of real world impacts11.
Any errors or omissions are unintentional.
Thank you for your consideration of issues raised with these comments….
# # #
10
Dudek Madera’s Golf Club miscalculations: http://www.utsandiego.com/news/2014/jan/28/maderas-golf-water-wells/; http://www.utsandiego.com/news/2013/jul/03/maderas-poway-water-wells-council/; http://www.pomeradonews.com/2013/11/20/maderas-given-3-2-poway-council-ok-to-use-water-wells/ 11
See bottom of page 1: http://www.cpuc.ca.gov/environment/info/dudek/ECOSUB/MPR_8_Request.pdf
∙ÿ
∙ÿ
∙ÿ
∙ÿ
§̈¦
§̈¦
§̈¦
∙ÿ
§̈¦
§̈¦
§̈¦
§̈¦
∙ÿ
∙ÿ
∙ÿ
∙ÿ
∙ÿ
∙ÿ
§̈¦
∙ÿ
§̈¦
∙ÿ
§̈¦
§̈¦
∙ÿ
∙ÿ
∙ÿ
∙ÿ
§̈¦
§̈¦
∙ÿ
§̈¦
∙ÿ
§̈¦
§̈¦
§̈¦
§̈¦
§̈¦
∙ÿ
∙ÿ
§̈¦
§̈¦
§̈¦
§̈¦
∙ÿ
§̈¦
§̈¦
∙ÿ
§̈¦§̈¦
∙ÿ
∙ÿ
∙ÿ
∙ÿ
∙ÿ
∙ÿ
∙ÿ
∙ÿ
∙ÿ
∙ÿ∙ÿ∙ÿ
∙ÿ
∙ÿ
∙ÿ
∙ÿ
∙ÿ
∙ÿ
∙ÿ
∙ÿ
∙ÿ
∙ÿ
∙ÿ
∙ÿ
∙ÿ
∙ÿ
§̈¦
∙ÿ
§̈¦
∙ÿ
§̈¦
§̈¦
∙ÿ
∙ÿ
∙ÿ
Sol OrchardCool Valley
NLPSolar
SDGE Solar(ValleyCenter)
Sol OrchardValleyCenter Solar
TuleWind
Jordan WindEnergy Project
(Padoma)
Shu'luukWind and Solar
OcotilloExpressJordan Wind
Energy Project(Padoma)
Campo WindEnergyProject
ManzanitaWind Energy
Project
DebenhamEnergy - Miller Basin Fox
Solar
Soitec(Tierra DelSol Solar)
TuleWind
B a j a C a l i f o r n i a , M e x i c o
¬«1
Soitec(LanEast &LanWest)
Soitec(Los Robles)
¬«12E ¬«12E
¬«24
¬«16
¬«21
¬«21
¬«5
¬«14
Sa
n
Di
eg
o
Co
un
ty
Im
pe
ri
al
C
ou
nt
y
S a n D i e g o C o u n t y
R i v e r s i d e C o u n t y
A n z a - B o r r e g oD e s e r t S t a t e P a r k
A n z a - B o r r e g oD e s e r t S t a t e P a r k
B u r e a u o fL a n d M a n a g e m e n t
C l e v e l a n dN a t i o n a l
F o r e s t
C l e v e l a n dN a t i o n a l
F o r e s t
RinconReservation
CampoReservation
Los CoyotesReservation
ViejasReservation
BaronaReservation
CapitanGrande
Reservation
SycuanReservation
ManzanitaReservation
PechangaReservation
Mesa GrandeReservation
Santa YsabelReservation
La PostaReservation
San PasqualReservation
Pauma andYuima
Reservation
JamulIndianVillage
PalaReservation
Inaja andCosmit
Reservation
CuyapaipeReservation
La JollaReservation
76
94
76
78
5
8
52
5
15
8
805
94
79
79
78
67
79
5
67
905
5
805
94
125
94
67
15
805
163
8
52
15
15
5
5
78
78
15
805
15
15
75
8
54
5
15
163
75
75
94
54
67
282
79
79
7879 78
94
78
79
76
76
76
78
94
78
78
54
188
76
905
8
54
8
163
805
15
52
905
56
¬«12B
¬«10
¬«12D
¬«25
¬«7
¬«12A
¬«2
¬«28
¬«18D
¬«18A
¬«18B
¬«11
¬«27
¬«29
¬«13
¬«31
¬«20
¬«18C¬«19
¬«22
¬«15A
¬«15B
¬«30
¬«26
¬«5¬«23
¬«17
¬«9
¬«6
¬«4
¬«8
¬«3
Soitec(Rugged
Solar)
Sol OrchardBoulevard
DesertGreenSolar
Sol OrchardMesa Grande
SDGE Solar(Pala-Pauma)
SDGE Solar(Ramona)
OcotilloWellsSolar
Sol OrchardKitchenCreek
Sol OrchardPala-Pauma
Valley
AmonixSolar
SplitMountain
Solar
DigiorgioFarmsSolar
SDGE Solar(Sweetwater) Silverado
Solar
SolOrchardAlpine
Ecoplexus Solar(Buckman
Springs Solar)
EcoplexusSolar (Viejas
Boulevard Solar)
Sol OrchardSanta Ysabel
JacumbaSolar
CalicoRanchSolar
Sol OrchardRamona
Solar
NRGSolar
ESJ WindPhase I
Copyright:© 2013 Esri
LegendProject Status
Approved
In Process
Major Pre-App/Unknown
No Longer Proposed
" " " " " "
" " " " " "
" " " " " "
" " " " " " Indian Reservations
National and County Parks
State Park
Bureau of Land Management (BLM)
Incorporated Area
San Diego County Energy Projects
¯0 5 102.5
Miles
THIS MAP/DATA IS PROVIDED WITHOUT WARRANTY OF ANY KIND, EITHEREXPRESS OR IMPLIED, INCLUDING BUT NOT LIMITED TO, THE IMPLIEDWARRANTIES OF MERCHANTABILITY AND FITNESS FOR A PARTICULARPURPOSE. Note: This product may contain information from the SANDAGRegional Information System which cannot be reproduced without the writtenpermission of SANDAG. This product may contain information reproduced withpermission granted by Rand McNally & Company® to SanGIS. This map iscopyrighted by Rand McNally & Company®. It is unlawful to copy or reproduceall or any part thereof, whether for personal use or resale, without the prior, writtenpermission of Rand McNally & Company®.Copyright SanGIS 2013 - All Rights Reserved. Full text of this legal notice can befound at: http://www.sangis.org/Legal_Notice.htm
Number Project Name Project Number Project Status1 Campo Wind Energy Project Approved2 Desert Green Solar P09-012W1 Approved3 ESJ Wind Phase I Approved4 NRG Solar P10-026 Approved5 Ocotillo Express Approved5 Ocotillo Express - Palm Canyon Wash Approved5 Ocotillo Express - Sugarloaf Mountain Approved6 Sol Orchard Ramona Solar P11-029 Approved7 Sol Orchard Valley Center Solar P11-027 Approved8 Tule Wind P09-019, P09-008 Approved9 Calico Ranch Solar AD13-046 In Process
10 NLP Solar P13-019 In Process11 Ocotillo Wells Solar P12-004 In Process
12A Soitec (Tierra Del Sol Solar) P12-010, REZ12-005, AP77-046-01 In Process12B Soitec (Rugged Solar) P12-007 In Process12B Soitec (Rugged Solar) P12-007 In Process12C Soitec (LanEast) In Process12D Soitec (LanWest) In Process12E Soitec (Los Robles) In Process12E Soitec (Los Robles) In Process13 Amonix Solar MPA11-014 Major Pre-App/Unknown14 Debenham Energy - Miller Basin Major Pre-App/Unknown
15A Ecoplexus Solar (Buckman Springs Solar) MPA13-007 Major Pre-App/Unknown15B Ecoplexus Solar (Viejas Boulevard Solar) MPA13-007 Major Pre-App/Unknown16 Fox Solar MPA13-012 Major Pre-App/Unknown17 Jacumba Solar MPA11-023 Major Pre-App/Unknown
18A SDGE Solar (Pala-Pauma) MPA13-009 Major Pre-App/Unknown18B SDGE Solar (Ramona) MPA13-009 Major Pre-App/Unknown18C SDGE Solar (Sweetwater) MPA13-009 Major Pre-App/Unknown18D SDGE Solar (Valley Center) MPA13-009 Major Pre-App/Unknown19 Silverado Solar MPA11-009 Major Pre-App/Unknown20 Digiorgio Farms Solar P10-030 No Longer Proposed21 Jordan Wind Energy Project (Padoma) No Longer Proposed22 Sol Orchard Alpine P11-030 No Longer Proposed23 Manzanita Wind Energy Project No Longer Proposed24 Shu'luuk Wind and Solar No Longer Proposed25 Sol Orchard Boulevard P12-025 No Longer Proposed26 Sol Orchard Cool Valley AD11-032 No Longer Proposed27 Sol Orchard Kitchen Creek AD11-033 No Longer Proposed28 Sol Orchard Mesa Grande AD11-035 No Longer Proposed29 Sol Orchard Pala-Pauma Valley AD11-037 No Longer Proposed30 Sol Orchard Santa Ysabel AD11-036 No Longer Proposed31 Split Mountain Solar P10-016 No Longer Proposed
P:\20120111_Tule\energyE_CN.mxd Date: 12/11/2013
Alpine
JamulSan Diego
RamonaJulian
BorregoSprings
Oceanside
Temecula
Escondido
Poway
Campo
Boulevard Calexico
Mexicali
Ensenada
Imperial Valley SUBSTATION
JapatulSUBSTATION
Central EastSUBSTATION
Lakeside
Future Expansion:500kV T-Line
Liquified Natural Gas ImportedFrom Russia and Indonesia on
Tankers to Sempra’s Costa Azul Terminal
Sempra Pipelines Supplying Natural Gas from Costa Azul Import Terminal to Mexicali
Export Power Plants
Transmission Lines from Mexicali Export Power Plants to US Electrical
Transmission Grid
Sunrise Powerlink 500kV Transmission Line to
Japatul Substation
Sunrise Powerlink 230kV Transmission Line to Sycamore Canyon Substation
Future Expansion:500kV T-Line
to Greater LA
Sycamore SubstationSUBSTATION
Future Expansion:230kV T-Line
!(S
!(S!(S
!(S
!(S
!(S
!(S
!(S
!(S
!(S
!(S
!(S
!(S
!(S
!(S
!(S
!(S
!(S
!(S !(S !(S !(S
!(S
!(S !(S!(S
!(S!(S
!(S!(S !(S !(S !(S !(S !(S !(S !(S !(S !(S !(S !(S !(S !(S !(S !(S !(S !(S !(S !(S !(S !(S
!(S !(S!(X!(X!(S
TBO NorthStaging Yard
1.5 acres
MotocrossStaging Yard4.7 acres
TBO South1 Staging Yard10 acres
TBO South 2Staging Yard
26 acres
Boulevard StagingYard
21 acres
HeloLZ_28
900 sq ftHelo LZ_29
900 sq ft
Helo LZ_30900sq ft
§̈¦8§̈¦8
Camp
oCr
eek
TuleCreek
BoundaryCreek
CampoReservation
€94 OLD HIGHWAY 80
OLD HIGHWAY 80
La Posta/Jewell ValleyManagement Area
McCain Valley Nat'lCo-op Land & Wildlife
Mngmt Area
WILL
IAM
RD
RUTH AVE
MC CA
IN LN
TIERR
A DEL S
OL RD
HIGH HORSE HL
LIVE OAKS TRL
OA
K P L
AN GEL D
R
JEWEL VALLEY RD
LILLIE LN
TULE J IM RD
HIGH V
I EW PT
TIERRA HEIGH TS
R D
STILSON LN
MANZANITA RD
QUAI
L RUN
RD
RIBB
ONWO
OD RD
MANZ
ANITA
LNSTAR
AVE
LIVE O
AK
SPRINGS RD
SHASTA WAY
LILAC
TRL
R OSS
AVE
SHAS
TA TR
L
COOP ER LN
SHASTA WAY
MANZANITA
DULCE RD
JEWE
L VAL
LEY L
N
MOON
LI GHT
TRL
CAMIN O DE L MONTE
JEWEL VALLEY CT
ROCKY KNOLL RD
RED SHANK LN
TIERRA DE
L SOL
RD
AVENIDA DE ROBLES VERDES
STILT
ON LN
T ECA
TE DI
VIDE
RD
FISHER RD
OPALOCKA RD
ROADRUNNER LN
OAKS CT
CAMINO DEL
MESA
WISTERTA LN
JEW EL VALLEY WAY
HI PASS RD
LILAC LN
LegendTieline
TielineTemporary Alignment
Proposed UGUG RouteVault
Proposed Pole!(S Steel
!(X TempStaging Yard
TL 6931 ProjectWood to Steel/ Wind Gen
SDG&E is providing this mapwith the understanding that themap is not survey grade.
I
Requested By: Tom Carr
0 1,000 2,000 3,000500
Feet
1 inch = 2,000 feet @ 11" x 17"
Author: dwuertz\\nas-rb4a\elec_advanced_users\User_Data\LSGIS\Projects\Major_Projects\TL_6931\MXDs\20121119_overview_pub.mxd
Version Date: 12/12/2012
Overview
Water ResourcesWater Centerline
Project Length: 5.4 miles
Land OwnershipSDG&E Fee Owned, Leased
US Forest Service
BLM
DOD
USFWS
Other Federal
State Parks
CDFG
Other State
County
City
Special District
BIA Trust Land

EXHIBIT 3
1 Boulevard Planning Group MSUP DEIR/EIS comments 10-17-14
Boulevard Planning Group
PO Box 1272, Boulevard, CA 91905
DATE: October 17, 2014 (amended 10-18-14 with DRECP information @page 10)
TO: San Diego County Planning & Development Services
VIA: [email protected]; CC: to CPUC & USFS VIA: [email protected]
FROM: Donna Tisdale, Chair; 619-766-4170; [email protected]
RE: SDG&E Master Special Use Permit – DEIR/DEIS Comments
As directed by the County, these comments are addressed to San Diego County Planning & Development
Services and copied to the CPUC and US Forest Service.
SDG&E’s application for a Permit to Construct the Cleveland National Forest Power Line Replacement Projects Docket Number A.12-10-0091 is another link in their east west expansion plan, to connect renewable energy projects in Imperial County, East County, and Northern Baja California with energy hungry urban areas along the coast.
After a public discussion at our regularly scheduled meeting held on October 3rd, the Boulevard
Planning Group unanimously approved the following motion on SDG&E’s Master Special Use Permit:
Authorize the Chair to submit comments and recommend undergrounding (TL6931) between the
new Boulevard substation and Crestwood Substation; from the Crestwood Substation to
Cameron Substation (TL629); and more if possible.
The Group’s goals are to further reduce fire ignition sources, the potential for increased lightning strikes,
and impediments to fire fighting; to protect adjacent residential and riparian areas; and to improve
scenic vistas along Historic Route 80 that TL6931 generally follows east to west.
Historic Route 80 is designated scenic by the County with extensive views of adjacent chaparral covered
rolling terrain, oak studded valleys and creek beds, and distant ridgelines that will be degraded by taller
metal poles with additional and thicker lines (conductors) that appear much more visible and reflective
than the lines that are being replaced. Taller poles will place infrastructure more in the line of vision of
drivers along Historic Route 80 than existing lines, especially in the area between Tule Jim in Boulevard
and Buckman Springs Road in Campo.
Comment limitations:
Due to the County’s request for these comments by October 17th the amount of time for full
review and comment has been reduced.
Due to the reduced timeframe and other obligations these comments are limited in scope,
thoroughness, and proper editing.
1 http://www.sdge.com/regulatory-filing/3404/sdge-south-orange-county-reliability-enhancement-socre-project
2 Boulevard Planning Group MSUP DEIR/EIS comments 10-17-14
Concerns with Assigned Commissioner Peevey:
Recent allegations of wrong doing filed against Commissioner Peevey, with requests for
investigations by the Attorney General, do raise concerns.
Commissioner Peevey recently announced that he will step down at the end of his term in
December and not seek reappointment.
Assignment of a new Commissioner to this project seems appropriate, sooner rather than later.
Dudek’s poor track record with environmental review and 3rd party mitigation and monitoring with
ECO Substation, Tule Wind, Soitec Solar and /or related projects is very discouraging:
A CPUC response from staff attorney, John Reynolds, to a Public Records Act Request (reference
# 1199), dated 7-24-14, confirms the CPUC was unaware of any groundwater monitoring
conducted within one mile of groundwater wells used during construction of the ECO Substation
project, where Dudek is the 3rd party monitor.
MM HYD 3 for ECO Substation required monitoring to ensure no adverse impacts to
groundwater production rates to wells within 1-mile radius.
Major concerns and challenges have also been raised with Dudek’s groundwater investigation
for the Soitec Solar projects proposed in Boulevard.
San Diego County’s Planning & Development Services required Dudek to revise the Soitec
groundwater investigations to include many project water uses that had been excluded from the
original and exposed by Boulevard and Jacumba residents and planning groups.
Executive Summary:
No proposed project or selected alternatives maps are included in the Executive Summary—
they should be
The BIA proposed alternative should include undergrounding of lines through Campo
Reservation lands that pass by their Golden Acorn Casino project and tribal housing.
ES 4.4.2:
o This section references fire hardening 6 miles of existing 69kV TL6931 and adding a
circuit through Boulevard
o Or...modify existing TL625 by constructing a new 3-mile double circuit loop-in into the
Suncrest Substation.
o Another alternative would be to modify TL625 by undergrounding a new 3-mile double
circuit loop in to the Suncrest Substation and leave TL6931 as is.
B.2 Project Location—is misleading
Fails to include Boulevard
Fails to include Boulevard’s TL6931 that is now part of so-called Environmentally Superior
Alternative
E.3.3.2 Removal of TL626 from Service = reconstruction of TL6931 and major new impacts for
Boulevard/ Campo tribal lands & a connection with ECO Substation that could transfer much
more future energy through those predominantly low-income communities
3 Boulevard Planning Group MSUP DEIR/EIS comments 10-17-14
At first glance removal of TL 626 in the Cleveland National Forest sounds like a very good idea.
However, the late addition of the so-called Environmentally Superior alternative includes Reconstruction of TL6931 from Boulevard Substation to Crestwood Substation through residential, undisturbed, sensitive and scenic areas of Boulevard and Campo tribal lands, alongside Historic Route 80 that San Diego County has designated a scenic highway.
TL6931 was previously part of SDG&E’s A.12-12-007 for Shu’luuk Wind gen-tie/fire hardening application2 that was withdrawn with the Campo Band’s General Council denial of the Shu’luuk Wind lease agreement with Invenergy.
The public environmental review process was never completed for upgrading TL6931 through Boulevard between the Crestwood Substation and the new expanded Boulevard Substation.
TL6931 is located in a an area of Boulevard / Campo Reservation where the majority of the chaparral, riparian areas, oak groves, open grazing lands and scenic vistas have not burned in 40 years, according to the Fire History 2014 that includes 2014 fire perimeters as of 8-4-14 (with exception of the Old Fire that burned near Golden Acorn Casino)
This Boulevard/Campo section of line should be placed underground to reduce visual impacts, impacts to residents and birds, and impacts to fire fighting tactics, similar to what ALJ Yacknin required for the ECO Substation’s new 138kV line through along Historic Route 80 between ECO Substation and Carrizo Gorge Road and through Boulevard’s Jewel Valley from the border area to the Boulevard Substation rebuild.
A future expansion was built into the CPUC ECO Substation approval that allowed for the installation of two 138kV lines in the underground sections through Jacumba and Boulevard Planning Areas. Completion is expected in November 2014.
E.4.3 Environmentally Superior Alternative = defacto future high voltage connection to
SDG&E’s 85-acre ECO Substation, SDG&E’s Southwest Powerlink, SDG&E’s Sunrise Powerlink,
and SDG&E’s cross border Energia Sierra Juarez Wind project
Table E-3 shows the so-called Environmentally Superior Alternative includes removal of TL626 and replacement with electric facilities within the existing electric utility ROWs:
o Reconstruction of TL 6931 (in Boulevard) o Conversion of 13 miles of TL262 to 12kV o Note 1: “Reconstruction of TL 6931 compared to developing the TL625 loop-in along the
Sunrise Powerlink would rank similarly in terms of number of adverse impacts created vs reduced or eliminated.
o Reconstruction of TL6931 is ranked higher reportedly due to the extensive work completed for TL6931, which provides a knowledge base that reduces the risk of impacting environmental resources (Sources: SDG&E 2012 PEA)…”
o For the record, TL6931 Fire hardening included a new 138kV line within a new and wider Right of Way, although SDG&E was not successful in securing all the expanded easements for the private Gen-tie line, including the Campo Reservation where the new Shu’luuk Wind turbine project was proposed and then rejected by the tribe’s general council vote.
SDG&E’s A.12-12-007 to the CPUC for their proposed $34 million (+-10%) TL 6931 Fire
Hardening / Wind Interconnect Project Docket Number was dismissed /closed as of March 6,
20143
2 http://www.sdge.com/regulatory-filing/3968/sdge%E2%80%99s-application-permit-construct-tl-6931-fire-
hardeningwind-interconnect
4 Boulevard Planning Group MSUP DEIR/EIS comments 10-17-14
With CPUC Decision D.14-03-001, SDG&E’s A.12-12-007 was dismissed and closed upon SDG&E’s written and unopposed request, after the Campo Band voted down the lease for Invenergy’s Shu’luuk Wind turbine project.
SDG&E’s PEA for the original Fire Hardening and Shu’luuk Wind gen-tie project (A12-12-07) was for a double-circuit 138kV line with an expanded easement from 25 feet to 100 feet.
includes staging areas in environmentally sensitive areas within Boulevard Planning Area in flood plains and adjacent to riparian areas, oak groves and Historic Route 80 which is also a scenic route (see Figures 3-2; 3-2A; 3-2B and 3-2C)
The related environmental review /public review process was never completed, and no new information appears to have been provided for the current MSUP application. This is the same bait and switch process that Boulevard and other communities were subjected to with the belated introduction of the so-called Environmentally Superior Sunrise Powerlink.
If selected, this section of the line should be placed underground due to the close proximity to numerous homes, oak groves and riparian areas between Boulevard and the Cameron Substation on Buckman Springs Road (Campo Creek, Miller Valley Creek, La Posta Creek, etc)
SDG&E’s response to the data request4 (at page 9) includes the following response explaining why the fire hardening work stopped at the point where the Shu’luuk Wind project gen-tie interconnect does not continue the entire length of TL6931:
o San Diego Gas & Electric Company (SDG&E) currently has a 24 foot wide easement in perpetuity for the single circuit wood portion of TL6931 on Campo Tribal Land.
o Because the TL 6931 Fire Hardening/Wind Interconnect Project will be built in a double circuit 138kV configuration, additional easement width is needed within Campo Tribal Land to accommodate the proposed 100 foot wide easement.
o Unfortunately, SDG&E and the Campo Tribe were unable to reach agreement on the land value and terms for SDG&E to purchase additional easement across the Campo Reservation. Consequently, the tribe has elected to interconnect the Shu’luuk Wind Project with SDG&E at the eastern boundary of the Campo Reservation where TL6931 exits tribal land.
o SDG&E lists Approximately 50 impacted Boulevard properties (at page 50)5
With the late addition of the proposed Environmentally Superior Route, the CPUC and SDG&E seem to be pulling another bait and switch with Boulevard receiving the blunt end of the stick, similar to the late addition of the CPUC’s so-called Environmentally Superior Southern Route of the Sunrise Powerlink through Boulevard and other disproportionately impacted rural communities.
Here, TL6931 through Boulevard will now be upgraded to provide a missing link in SDG&E’s incremental / piecemealed expansion of another high voltage east west line that can serve to open capacity on the Southwest Powerlink (SWPL) and /or the Sunrise Powerlink.
TL6931 connects to the new expanded Boulevard Substation and SDG&E’s $435 million ECO Substation.
SDG&E’s ECO Substation map6 shows the connection to the new Boulevard Substation and also shows their Sunrise Powerlink’s end point at Sycamore substation
3 http://www.sdge.com/regulatory-filing/3968/sdge%E2%80%99s-application-permit-construct-
tl-6931-fire-hardeningwind-interconnect
4 http://www.cpuc.ca.gov/environment/info/dudek/Wind_Interconnect/TL6931%20Fire%20Hardening%20-
%20WI%20PEA%20Data%20Response%20No.%201_03-05-13_COMBINED.pdf 5 http://www.cpuc.ca.gov/environment/info/dudek/Wind_Interconnect/TL6931%20Fire%20Hardening%20-
%20WI%20PEA%20Data%20Response%20No.%201_03-05-13_COMBINED.pdf 6 https://www.sdge.com/sites/default/files/documents/ECOSubstationProjectMap.pdf
5 Boulevard Planning Group MSUP DEIR/EIS comments 10-17-14
The ECO Substation connects to SDG&E’s Southwest Powerlink (SWPL) and Sempra’s new Energia Sierra Juarez cross-border line with 1,250 MW of capacity.
According to SDG&E’s project application, their ECO Substation is built to handle expansions up to approximately 4,800 MW with multiple 500kV lines, 230kV lines and 138kV lines.
The substation is designed so that it will ultimately be expanded to include the following components7:
o Five 500 kV bays in a breaker-and-a-half bus configuration o Nine 230 kV bays in a breaker-and-a-half bus configuration o Nine 138 kV bays in a double-bus/double-breaker configuration o Four 500/230 kV, 1,100 megavolt ampere (MVA) transformer banks with two single-
phase operational spares o Three 230/138 kV, 224 MVA transformer banks o One or more 500 kV series capacitors o Two 230 kV, 63 MVAR shunt capacitors o Four 12 kV, 180 MVAR shunt reactor banks o One 230 kV static VAR compensator o The maximum amount of oil required for the transformers at the ECO Substation will be
approximately 569,800 gallons.
SDG&E’s MSUP project website includes links to all TL lines except TL69318. Why?
SDG&E’s project Fact Sheet and map9 do not include the belated addition of TL6931 through Boulevard’s occupied residential and ranch lands
SDG&E’s $135 million Sycamore to Penasquitos 230 kV Transmission Line CPCN Project Docket Number: A.14-04-011 is another link in SDG&E’s east west high voltage line expansion10.
o SDG&E’s project map for their Sycamore to Penaquitos link shows their new 230kV line and consolidation of two existing 69kV lines onto new steel poles, starting at the Sycamore Substation11.
o Figure 3.112 shows the regional location of this piece of SDG&E’s incremental expansion plan.
o The project description at page 713 states that SDG&E’s ability to operate its bulk electric transmission system reliably and efficiently has become constrained, particularly at gateway substations. During periods of high customer demand and high energy imports, as well as during periods of high renewable energy generation in the Imperial Valley, most of the energy imported into San Diego flows across the 500 kV Southwest Powerlink and Sunrise Powerlink transmission lines. This imported energy then flows into the Miguel and Sycamore Canyon Substations, respectively. Heavy energy flows into these gateway substations can result in congestion and subsequent NERC reliability criteria violations on the 230 kV, 138 kV, and 69 kV transmission and power lines downstream, requiring dispatch of less efficient generation, increasing energy cost for ratepayers and eventually requiring upgrades to these downstream facilities… In addition, significant renewable generation is expected to be developed in the Southeastern United States, which will further increase flows on the Sunrise Powerlink and into Sycamore Canyon Substation.
7 https://www.sdge.com/sites/default/files/documents/ECOAppPermittoConstruct.pdf
8 http://www.sdge.com/key-initiatives/cleveland-national-forest-maps
9https://www.sdge.com/sites/default/files/documents/1717237822/FINAL%20S1380238%20ClevelandNatForestP
owerline_FS.pdf 10
http://www.sdge.com/regulatory-filing/10646/sdge-sycamore-penasquitos-230-kv-transmission-line-cpcn-project 1111
http://www.sdge.com/key-initiatives/sycamore-penasquitos-230kv-transmission-line-project-map 12
https://www.sdge.com/sites/default/files/regulatory/3.0%20-%20Project%20Description.pdf 13
https://www.sdge.com/sites/default/files/regulatory/A.14-04-011%20SDGE-SXPQ-CPCN-Application-Vol1.pdf
6 Boulevard Planning Group MSUP DEIR/EIS comments 10-17-14
D.8 Fire & Fuels Management errors & omissions
Figure D.8-1: Boulevard and TL9631 are omitted from this fire hazard map
D.8-11: The rural communities of Boulevard, Campo, and Portero are impacted by this project, are located in wildfire corridors with continuous fuel beds, and yet they are inexplicably left out of the list of Communities at Risk
D.8-15: Under Tribal Fire Departments, the Campo Reservation Fire Department’s vehicles and equipment are listed. Where is the documentation on the number and training of related personnel / boots-on-the-ground that are generally available to operate the equipment?
Campo tribal members have confided/ alleged that their fire department staffing has been reduced and pay for some tribal members is below minimum wage.
Factual information on paid / volunteer staffing levels for all must be included.
A new Boulevard Fire station is under construction.
When completed, the White Star Fire Station will be closed and Cal Fire will reportedly move to Boulevard Fire station.
Boulevard previously had both a volunteer fire department and Cal Fire’s White Star
Boulevard is getting less protection.
Some of our project mitigation funded and community funded fire-fighting equipment has been sent to other communities by an ever changing list of those in charge at Cal Fire, Rural Fire, San Diego County Fire Authority.
D.9 Hydrology
SDG&E’s ECO Substation list of hazardous materials includes soil stabilizers
TL6931 is omitted from this section as are the related blue line streams that it crosses
The Campo-Cottonwood Creek Sole Source Aquifer designation / boundaries are not included. This is one of only two such designations in Southern California
San Diego County’s Guidelines for Determination of Significance and Groundwater Ordinance do not take Climate Change impacts into account
MM HYD2a is inadequate based on SDG&E’s vastly inadequate and underestimation of amount of water needed and the controversial and questionable groundwater use during construction of their ECO Substation project.
30 million gallons was estimated and amended to 90-100 million gallons of water
MM HYD-2b is also inadequate based on current experience with CPUC handling of water supply sources, failure to vet SDG&E’s reports and project modification figures, failure to implement mitigation measures for ECO Substation.
No local groundwater resources should be used
There is little to no oversight of local water districts or tribal wells
SDG&E should be required to import water for this project
F. Cumulative Scenario and Impacts—errors & omissions:
Errors and omissions downplay the real world impacts to the environment and wild life, fire-prone and drought stricken rural communities, and a wide variety of natural resources, which are significant, cumulatively significant, and represent disproportionate impacts in the predominantly low-income communities Boulevard and Jacumba Hot Springs.
Figure F-1 Cumulative Projects Map—errors & omissions:
Failure to include TL6931 which is now part of the so-called Environmentally Superior
Alternative
7 Boulevard Planning Group MSUP DEIR/EIS comments 10-17-14
Map ID T-3: Failure to include major details/impacts of SDG&E ECO Substation project where
Dudek is the 3rd party monitor and should be fully informed.
Failure to adequately identify and document the scale and scope of the majority of SDG&E’s
$435 million 85 acre ECO Substation (500/230/138kV),
Failure to include or identify the Boulevard Substation Rebuild site location
Failure to include the 14 miles of new 138kV line(s) connecting ECO and Boulevard
Substations—all of which is currently under noisy and visually intrusive construction for a
majority of the route between Jacumba Hot Springs and Boulevard, as depicted by two
photographs below.
Failure to include Ocotillo Wind’s existing 265 MW 12,436 acre footprint
If Figure 1 includes a few projects in Imperial County, it should be corrected to include all the
renewable and transmission projects already approved and /or proposed on BLM lands using
their list14 and map15 dated July 2014.
It should also include all energy/transmission projects approved and proposed in Imperial
County using the maps16 and project lists (as of 10-1-14) 17 posted on their Planning and
Development Services website.
Much of the energy generated by Imperial Valley renewable is or will be transmitted through
rural East County on existing, proposed, and alternative transmission proposals currently under
review by the CEC, CPUC, IID, and CAISO.
ECO Substation project construction water use was estimated at 30 million gallons and was
amended repeatedly for up to 90-100 million gallons—outside public comment period.
As of May 31, SDG&E had already exceeded the estimated 1.5 million water truck miles and
provided invalid and misleading information to the CPUC project manager as documented in the
attached letter from attorney Stephan C Volker dated 4-17-14, challenging SDG&E’s water use
and mileage numbers presented in their East County Substation, Minor Project Refinement
Request 14 (A.09-08-003).
Cumulative construction water use/ sources and related GHG emissions must be included.
Map ID-Wind 4 project marker fails to accurately portray the immense scale and scope
Iberdrola’s approved 186 MW Tule Wind project and over 12,000 acre footprint on BLM land
looming over the McCain Valley / Manzanita Reservation/ La Posta/ Thing Valley areas between
Boulevard and La Posta Road.
It fails to include the Tule Wind gen-tie route or system of overhead collector lines.
It fails to show Tule Wind’s turbine project footprint approved last December for Ewiiaapaayp
tribal lands or turbines proposed for State Land Commission School lands, or the extensive and
intrusive network of approved overhead collector and gen-tie lines.
Map ID Wind 5 - National Quarries footprint falsely appears to be larger than the Tule Wind
footprint.
14
http://www.blm.gov/pgdata/etc/medialib/blm/ca/pdf/pa/energy/solar.Par.84447.File.dat/BLM%20Solar%20Applications%20&%20Authorizations%20April%202013..pdf 15
http://www.blm.gov/pgdata/etc/medialib/blm/ca/pdf/pa/energy/application_maps.Par.30605.File.dat/CDD_Application_Map.pdf 16
http://www.icpds.com/?pid=2934 17
http://icpds.com/CMS/Media/Planning-Staff-Report-Updated-10-1-14.pdf
8 Boulevard Planning Group MSUP DEIR/EIS comments 10-17-14
Figure F-1 fails to show the proposed 5-6 mile 138kV gen-tie for Soitec Solar’s proposed 420
acre Tierra Del Sol Solar project in Tierra Del Sol area of Boulevard Planning Area, with a ROW
through the foot print of the 2012 Shockey Fire that burned over 2,500 acres, 14 homes and
resulted in one death in the Tierra Del Sol / Hi Pass neighborhood of Boulevard.
Map ID S-3 Amonix Solar has reportedly been withdrawn and should be removed
Map ID S-6 Fox Solar has reportedly been withdrawn and should be removed
Map ID S-7 for Soitec’s LanWest and LanEast should have two separate numbers for two
separate projects
Map ID S-14 Solar Energy Project MPA13-009 by SDG&E fails to include total MW or acreage
NextEra Energy’s new Jacumba Solar MUP application 14-041 is proposed for 300 acres
adjacent to SDG&E’s ECO Substation18 at the US/Mexico border east of Jacumba Hot Springs
should now be included. It replaces BP’s previous Jacumba Solar project which is identified on F-
1 as S2.
Axio Power Holdings LLC has proposed the new Cameron Solar Energy Project (MPA-14-019)
with 190 acres of PV to be installed in the beautiful and highly visible Campo Valley west of Lake
Morena Drive near the entrance to Hauser Canyon.
The Cameron Solar Energy Project plot plan shows the point of grid connection as SDG&E’s
TL692319 that is involved in this MSUP DEIR/EIS; Dudek is listed on the plot plan provided by
San Diego County to the Campo Planning Group, so they should have been aware of this
cumulative impact project.
Additional Solar projects already approved and /or constructed in the Borrego Valley should
also be included.
Figure 1-S1 Imperial Valley Solar-Solar Two, CACA 047740 should be removed; it is no longer
listed on the website of BLM’s El Centro office20.
Map ID F3 Lake Morena Community Defense (LMCD) Project: The USFS scoping notice for the
LMCD Project includes the following statement under Purpose & Need:
“Finally, aerial suppression action may be limited in surrounding areas of Campo/ Lake Morena (Hauser Canyon/Lake Morena Drive/Buckman Springs Road/La Posta Road),
due to Sunrise Powerlink. This alteration of the typical aerial suppression procedure may contribute to larger fire growth…” (emphasis added)
The same alteration of the typical aerial suppression procedure, and contribution to larger fire growth, holds true for all of SDG&E’s proposed fire hardening projects, expansions, and cumulative impact projects that induce growth of additional fire ignition sources and fire fighting impediments in designated wildfire corridors and Very High Fire Severity Zones.
For perspective on the scale, scope and visual blight, we are providing the photograph below of the current SDG&E ECO Substation project and related 138kV line through Jacumba Hot Springs and Boulevard Planning Areas.
18
http://www.sandiegocounty.gov/content/sdc/pds/ceqa_public_review/MUP-14-041.html 19
http://www.cpuc.ca.gov/environment/info/dudek/CNF/ProjectLocationMap.pdf 20
http://www.blm.gov/ca/st/en/fo/elcentro.html
9 Boulevard Planning Group MSUP DEIR/EIS comments 10-17-14
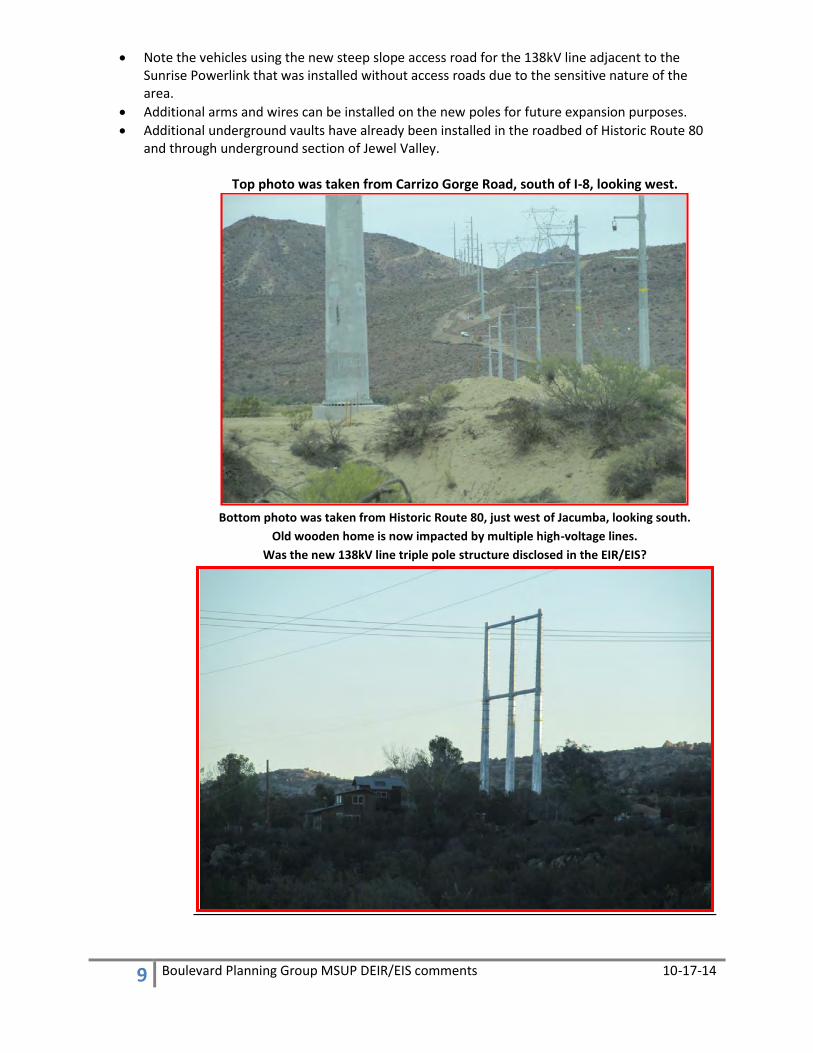
Note the vehicles using the new steep slope access road for the 138kV line adjacent to the Sunrise Powerlink that was installed without access roads due to the sensitive nature of the area.
Additional arms and wires can be installed on the new poles for future expansion purposes.
Additional underground vaults have already been installed in the roadbed of Historic Route 80 and through underground section of Jewel Valley.
Top photo was taken from Carrizo Gorge Road, south of I-8, looking west.
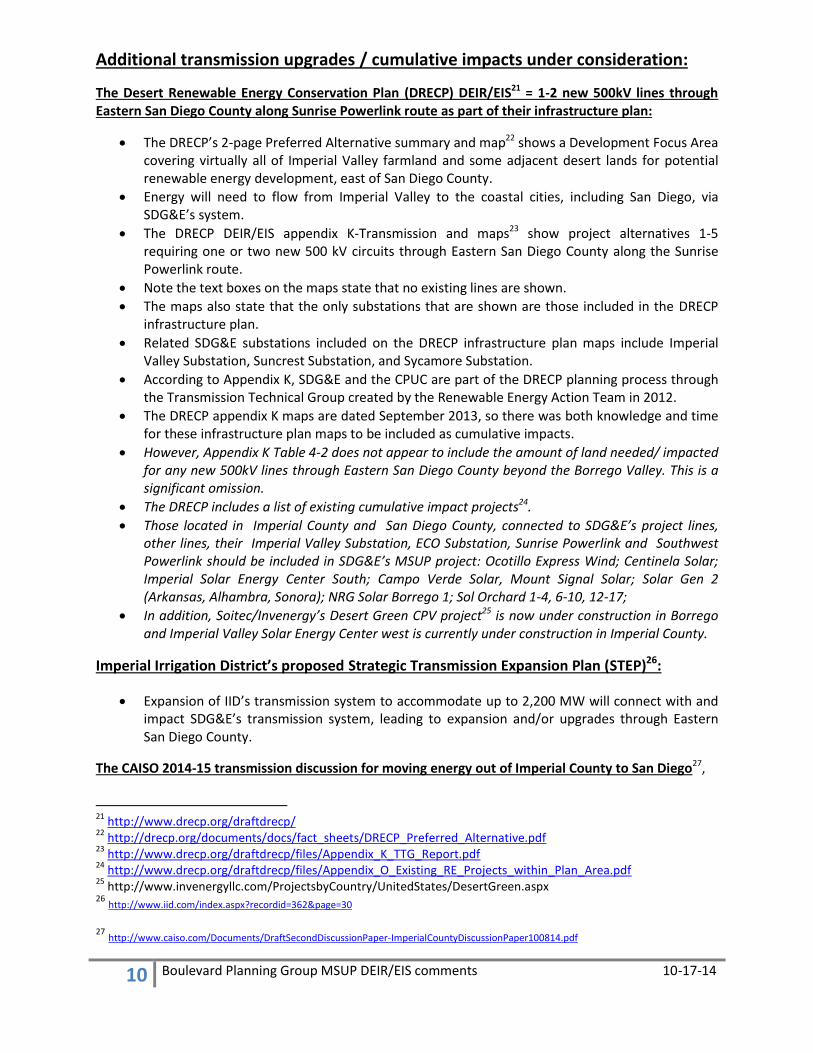
Bottom photo was taken from Historic Route 80, just west of Jacumba, looking south.
Old wooden home is now impacted by multiple high-voltage lines.
Was the new 138kV line triple pole structure disclosed in the EIR/EIS?
10 Boulevard Planning Group MSUP DEIR/EIS comments 10-17-14
Additional transmission upgrades / cumulative impacts under consideration:
The Desert Renewable Energy Conservation Plan (DRECP) DEIR/EIS21 = 1-2 new 500kV lines through Eastern San Diego County along Sunrise Powerlink route as part of their infrastructure plan:
The DRECP’s 2-page Preferred Alternative summary and map22 shows a Development Focus Area covering virtually all of Imperial Valley farmland and some adjacent desert lands for potential renewable energy development, east of San Diego County.
Energy will need to flow from Imperial Valley to the coastal cities, including San Diego, via SDG&E’s system.
The DRECP DEIR/EIS appendix K-Transmission and maps23 show project alternatives 1-5 requiring one or two new 500 kV circuits through Eastern San Diego County along the Sunrise Powerlink route.
Note the text boxes on the maps state that no existing lines are shown.
The maps also state that the only substations that are shown are those included in the DRECP infrastructure plan.
Related SDG&E substations included on the DRECP infrastructure plan maps include Imperial Valley Substation, Suncrest Substation, and Sycamore Substation.
According to Appendix K, SDG&E and the CPUC are part of the DRECP planning process through the Transmission Technical Group created by the Renewable Energy Action Team in 2012.
The DRECP appendix K maps are dated September 2013, so there was both knowledge and time for these infrastructure plan maps to be included as cumulative impacts.
However, Appendix K Table 4-2 does not appear to include the amount of land needed/ impacted for any new 500kV lines through Eastern San Diego County beyond the Borrego Valley. This is a significant omission.
The DRECP includes a list of existing cumulative impact projects24.
Those located in Imperial County and San Diego County, connected to SDG&E’s project lines, other lines, their Imperial Valley Substation, ECO Substation, Sunrise Powerlink and Southwest Powerlink should be included in SDG&E’s MSUP project: Ocotillo Express Wind; Centinela Solar; Imperial Solar Energy Center South; Campo Verde Solar, Mount Signal Solar; Solar Gen 2 (Arkansas, Alhambra, Sonora); NRG Solar Borrego 1; Sol Orchard 1-4, 6-10, 12-17;
In addition, Soitec/Invenergy’s Desert Green CPV project25 is now under construction in Borrego and Imperial Valley Solar Energy Center west is currently under construction in Imperial County.
Imperial Irrigation District’s proposed Strategic Transmission Expansion Plan (STEP)26:
Expansion of IID’s transmission system to accommodate up to 2,200 MW will connect with and impact SDG&E’s transmission system, leading to expansion and/or upgrades through Eastern San Diego County.
The CAISO 2014-15 transmission discussion for moving energy out of Imperial County to San Diego27,
21
http://www.drecp.org/draftdrecp/ 22
http://drecp.org/documents/docs/fact_sheets/DRECP_Preferred_Alternative.pdf 23
http://www.drecp.org/draftdrecp/files/Appendix_K_TTG_Report.pdf 24
http://www.drecp.org/draftdrecp/files/Appendix_O_Existing_RE_Projects_within_Plan_Area.pdf 25
http://www.invenergyllc.com/ProjectsbyCountry/UnitedStates/DesertGreen.aspx 26 http://www.iid.com/index.aspx?recordid=362&page=30
27 http://www.caiso.com/Documents/DraftSecondDiscussionPaper-ImperialCountyDiscussionPaper100814.pdf
11 Boulevard Planning Group MSUP DEIR/EIS comments 10-17-14
The October 1st discussion paper28 documents the need for new transmission projects/ upgrades or operational modifications, including footnotes 4-6 on page 4
Those projects include new lines and upgrades at Imperial Valley Substation, Sycamore-Penasquitos 230kV line
At page 8, an alternative SDG&E –Inland transmission route to Suncrest Substation/Sunrise Powerlink just east of Alpine, within the Cleveland National Forest
October 8, 2014 California Independent System Operator’s Imperial County Transmission Consultation Workshop:
Aspen Environmental’s presentation (at request of CEC) at the CAISO stakeholders meeting included a September 2014 addendum29 to the May 2014 report with transmission options for new lines/upgrades to replace San Onofre Nuclear generation:
Maps showing land use study areas and onshore substations and transmission segments at pages 32 & 33 include Alternative 2: Alberhill to Suncrest and Alternative 5: Imperial Valley to Inland to connect to SDG&E’s Suncrest Substation through Cleveland National Forest and other lands
SDG&E Area Potential Mitigation Solutions found @ page 139 of CAISO presentation dated 9-24-1430
4 Network upgrades to address sub-transmission Category C issues
Interim solutions prior to the IV PST in-service, including Coordinate with CFE and enable Otay Mesa–Tijuana 230 kV SPS as needed bypass series cap banks on NG-IV 500 kV line
By the time the IV PST project is in service, ultimate goal is to eliminate or minimize cross tripping the tie with CFE, including bypassing series cap banks on Sunrise and SWPL 500 kV lines swap BK81 position with BK80 in IV 500/230 kV substation three SPS to protect the main 500/230 kV system instant backup or new 500/230 kV bank at Miguel/ Suncrest/IV Coordination with CFE on IV PST operation procedure
Energy Efficiency, DG, Demand Response, and Energy Storage
ADDENDUM TO TRANSMISSION OPTIONS AND POTENTIAL CORRIDOR DESIGNATIONS IN SOUTHERN CALIFORNIA IN RESPONSE TO CLOSURE OF SAN ONOFRE NUCLEAR GENERATING STATION (SONGS) SEPTEMBER 2014 CEC-700-2014-002-AD:
Figure 6 @ page 37 of the Schematic Map of Onshore Substations and Segments, shows SDG&E proposed Alternative 2 for new lines connecting to Suncrest Substation off of Japatul Road within the Forest31
Birds & Power lines:
Refining Estimates of Bird Collision and Electrocution Mortality at Power Lines in the United States Scott R. Loss; Tom Will; Peter P. Mar32; Smithsonian Conservation Biology Institute –
28 http://www.caiso.com/Documents/DraftSecondDiscussionPaper-ImperialCountyDiscussionPaper100814.pdf
29 http://www.caiso.com/Documents/PresentationImperialCountyTransmissionConsultationOct8_2014.pdf
30 http://www.caiso.com/Documents/Presentation-PreliminaryReliabilityAssessmentResults-Sep24_2014.pdf
31 http://www.energy.ca.gov/2014publications/CEC-700-2014-002/CEC-700-2014-002-AD.pdf
12 Boulevard Planning Group MSUP DEIR/EIS comments 10-17-14
Migratory Bird Center, National Zoological Park, Washington, District of Columbia, United States of America; Division of; Migratory Birds – Midwest Regional Office, United States Fish and Wildlife Service, Bloomington, Minnesota, United States of America
Abstract o Collisions and electrocutions at power lines are thought to kill large numbers of birds in
the United States annually. However, existing estimates of mortality are either speculative (for electrocution) or based on extrapolation of results from one study to all U.S. power lines (for collision). Because national-scale estimates of mortality and comparisons among threats are likely to be used for prioritizing policy and management strategies and for identifying major research needs, these estimates should be based on systematic and transparent assessment of rigorously collected data. We conducted a quantitative review that incorporated data from 14 studies meeting our inclusion criteria to estimate that between 12 and 64 million birds are killed each year at U.S. power lines, with between 8 and 57 million birds killed by collision and between 0.9 and 11.6 million birds killed by electrocution. Sensitivity analyses indicate that the majority of uncertainty in our estimates arises from variation in mortality rates across studies; this variation is due in part to the small sample of rigorously conducted studies that can be used to estimate mortality. Little information is available to quantify species-specific vulnerability to mortality at power lines; the available literature over-represents particular bird groups and habitats, and most studies only sample and present data for one or a few species. Furthermore, additional research is needed to clarify whether, to what degree, and in what regions populations of different bird species are affected by power line-related mortality. Nonetheless, our data-driven analysis suggests that the amount of bird mortality at U.S. power lines is substantial and that conservation management and policy is necessary to reduce this mortality. (emphasis added)
Lighting:
Concerns are repeated here for potential of FAA required lighting or colored ball placement on new taller poles and conductors.
This would degrade dark skies and scenic vistas that would impact quality of life, property values and tourism draw that are based on a less industrial appearing rural experience.
# # #
32
http://www.plosone.org/article/fetchObject.action?uri=info%3Adoi%2F10.1371%2Fjournal.pone.0101565&representation=PDF

EXHIBIT 4
1 SDG&E MSUP DEIR/EIS comments-BAD-Tisdale 11-4-14
Backcountry Against Dumps
P.O. Box 1275, Boulevard, CA 9105
DATE: November 4, 2014
TO: CPUC & USFS VIA: [email protected] & BIA via [email protected] FROM: Donna Tisdale, President; 619-766-4170; [email protected]
RE: SDG&E Master Special Use Permit – DEIR/DEIS Comments
These comments are being submitted on behalf of our public benefit non-profit, Backcountry Against
Dumps (BAD) and me as an individual. We incorporate by reference the comments that have been
submitted currently and previously throughout this MSUP project review by the Boulevard Planning
Group, the Protect Our Communities Foundation, Backcountry Against Dumps, Law Offices of Stephan C
Volker, and Donna Tisdale.
We specifically repeat two of the Boulevard Planning Group’s most important requests:
Require SDG&E to underground TL6931 between the Boulevard Substation and Crestwood
Substation and between Crestwood Substation and Cameron Substation to reduce fire hazards
and fire fighting impediments, to reduce visual clutter and impacts to birds and bats, to improve
scenic view sheds along Tierra Del Sol, Historic Route 8o and I-8 and along Buckman Springs
Road.
Require SDG&E to use of imported / recycled water in place of using finite drought-stressed
backcountry groundwater resources that are not being recharged due to extended drought
conditions and climate change impacts.
SDG&E’s MSUP Project has changed dramatically with belated inclusion of TL6931 which should
require the re-opening of another round of public review, participation, and protest opportunity:
BAD is based in Boulevard which is now impacted by the belated addition of TL6931 and
selection as part of the Environmentally Superior Alternative.
BAD was an intervening party in the CPUC’s proceedings for SDG&E’s now withdrawn PTC A.12-
12-007 for joint fire hardening of TL6931 and the Shu’luuk Wind gen-tie upgrade of TL6931 to
138kV between SDG&E’s Crestwood and Boulevard Substations.
BAD should automatically be allowed intervening party status to the newly revised MSUP
project and belated addition of TL6931, with an opportunity to file a formal protest.
Disproportionate and cumulative impacts to predominantly low-income communities of Boulevard,
Campo, La Posta:
Numerous large-scale wind, solar, utility infrastructure and development projects exist, are
under construction, and are proposed in fairly concentrated areas between Boulevard and the
entrance to Hauser Canyon in Campo.
2 SDG&E MSUP DEIR/EIS comments-BAD-Tisdale 11-4-14
These projects are not compatible with community character, public health and safety,
protection of wildlife, riparian areas and open spaces.
The increased number and size of projects increases potential wildfire ignition sources and
access to previously less accessible areas and increased wildfire risk.
Environmental Justice issues are involved and must be addressed.
Correction to comments filed by Boulevard Planning Group on 10-17 related to Cameron Solar:
The Cameron Solar project proposed for the Campo Valley by Axio Power Holdings LLC is
proposed for 19-30 acres of a 165 acre site—not 190 acres as stated in error/typo. Cameron
Solar will connect to the grid via TL6923 that is proposed for double circuit upgrade in this MSUP
and to the Cameron Substation that is also included for an upgrade in the proposed project.
Installation of portion of new pole at SDG&E’s Crestwood Substation where MSUP work is proposed:
The photograph below (Tisdale) shows the new pole that was recently installed at the
Crestwood Substation located on Historic Route 80 (Old 80) adjacent to the Golden Acorn
Casino located on Campo tribal lands. It appears to be advance work related to this project prior
to approval. What other purpose would it serve?
We support previous request for like-for-like pole size replacement clarification submitted by The
Protect Our Communities Foundation:
“Clarification to like-for-like pole size replacement alternative: POC would also like to
clarify the description of the like-for-like pole size replacement alternative that POC
requested in its November 7, 2013 comment letter on the EIR/EIS scoping memo. The
clarification is that the like-for-like poles carry conductors of the same or similar
capacity to the conductors that are on the existing wood poles. For example, the
minimum conductor size recommended for a 69 kV line is a 3/0 ACSR conductor.4 Yet
SDG&E is proposing to use much higher capacity 636 kcmil ACSS conductors on the 69
kV lines. The like-for-like pole size replacement alternative should assume use of a 3/0
ACSR conductor or equivalent.”
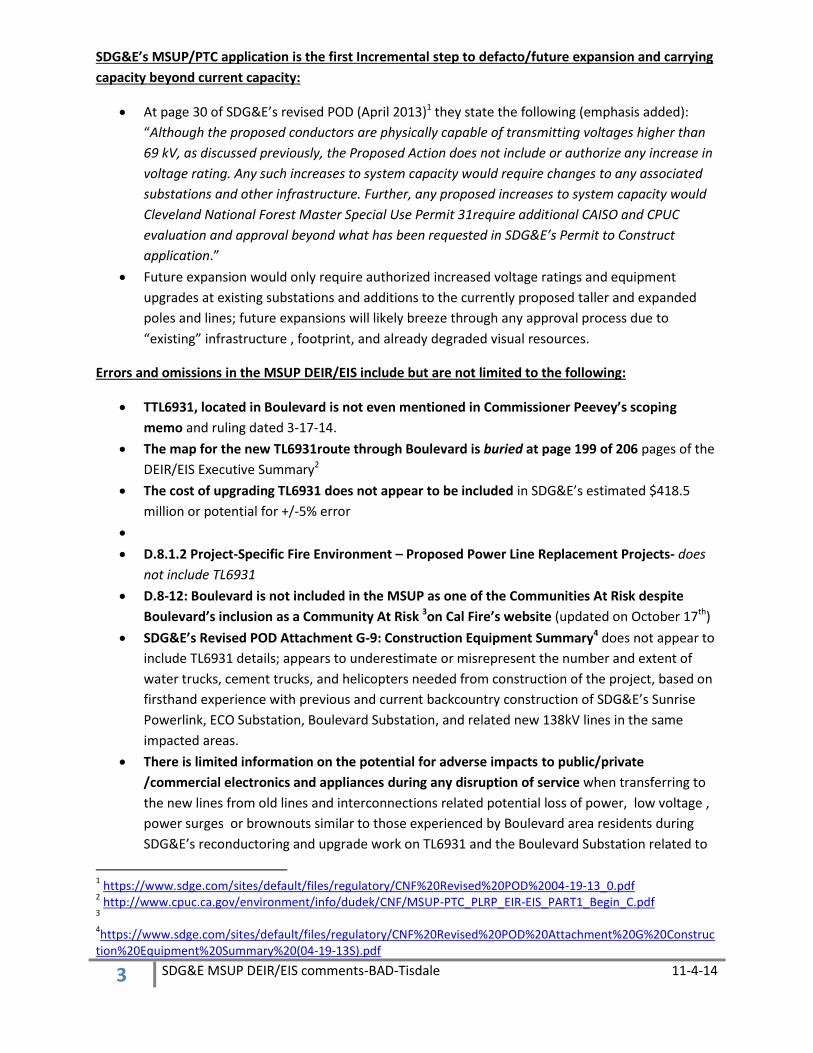
3 SDG&E MSUP DEIR/EIS comments-BAD-Tisdale 11-4-14
SDG&E’s MSUP/PTC application is the first Incremental step to defacto/future expansion and carrying
capacity beyond current capacity:
At page 30 of SDG&E’s revised POD (April 2013)1 they state the following (emphasis added):
“Although the proposed conductors are physically capable of transmitting voltages higher than
69 kV, as discussed previously, the Proposed Action does not include or authorize any increase in
voltage rating. Any such increases to system capacity would require changes to any associated
substations and other infrastructure. Further, any proposed increases to system capacity would
Cleveland National Forest Master Special Use Permit 31require additional CAISO and CPUC
evaluation and approval beyond what has been requested in SDG&E’s Permit to Construct
application.”
Future expansion would only require authorized increased voltage ratings and equipment
upgrades at existing substations and additions to the currently proposed taller and expanded
poles and lines; future expansions will likely breeze through any approval process due to
“existing” infrastructure , footprint, and already degraded visual resources.
Errors and omissions in the MSUP DEIR/EIS include but are not limited to the following:
TTL6931, located in Boulevard is not even mentioned in Commissioner Peevey’s scoping
memo and ruling dated 3-17-14.
The map for the new TL6931route through Boulevard is buried at page 199 of 206 pages of the
DEIR/EIS Executive Summary2
The cost of upgrading TL6931 does not appear to be included in SDG&E’s estimated $418.5
million or potential for +/-5% error
D.8.1.2 Project-Specific Fire Environment – Proposed Power Line Replacement Projects- does
not include TL6931
D.8-12: Boulevard is not included in the MSUP as one of the Communities At Risk despite
Boulevard’s inclusion as a Community At Risk 3on Cal Fire’s website (updated on October 17th)
SDG&E’s Revised POD Attachment G-9: Construction Equipment Summary4 does not appear to
include TL6931 details; appears to underestimate or misrepresent the number and extent of
water trucks, cement trucks, and helicopters needed from construction of the project, based on
firsthand experience with previous and current backcountry construction of SDG&E’s Sunrise
Powerlink, ECO Substation, Boulevard Substation, and related new 138kV lines in the same
impacted areas.
There is limited information on the potential for adverse impacts to public/private
/commercial electronics and appliances during any disruption of service when transferring to
the new lines from old lines and interconnections related potential loss of power, low voltage ,
power surges or brownouts similar to those experienced by Boulevard area residents during
SDG&E’s reconductoring and upgrade work on TL6931 and the Boulevard Substation related to
1 https://www.sdge.com/sites/default/files/regulatory/CNF%20Revised%20POD%2004-19-13_0.pdf
2 http://www.cpuc.ca.gov/environment/info/dudek/CNF/MSUP-PTC_PLRP_EIR-EIS_PART1_Begin_C.pdf
3
4https://www.sdge.com/sites/default/files/regulatory/CNF%20Revised%20POD%20Attachment%20G%20Construc
tion%20Equipment%20Summary%20(04-19-13S).pdf
4 SDG&E MSUP DEIR/EIS comments-BAD-Tisdale 11-4-14
connecting the Kumeyaay Wind facility to the grid in late 2005 or early 2006. Boulevard was
taken off-grid and placed on 2 emergency generators that produced fluctuating energy and
brown outs, damaging personal equipment. There was no independent monitoring –when there
should have been. Complaints were reportedly filed with unknown outcomes other than stated
frustrations with SDG&E.
Appendix B5: Parcel and mailing information for properties within 300 feet of the proposed
project does not include any Boulevard properties that are now impacted by the belated
inclusion of TL6931 in so-called Environmentally Superior Route. Where is the list of Boulevard
property owners and proof of notification?
Project Description B figures B8 through B 13 fail to disclose the potential height of new poles6
which would make it much easier for the general public to visualize the significant changes.
Revised POD attachment: Typical Drawings does not include the height of poles or width for
underground vaults–the drawings vaguely state that “height will vary” without providing actual
minimum/maximum height:
https://www.sdge.com/sites/default/files/regulatory/CNF%20Revised%20POD%20Attachment
%20E%20Typical%20Drawings%20(04-19-13S).pdf
SDG&E’s fire hardening and other direct and indirect projects include a new and/or expanded
network of wireless equipment and facilities, including communication facilities adjacent to Cal
Fire’s White Star Station located on Tierra Del Sol Road in Boulevard; the individual and
cumulative impacts on public health and safety and impacts to resident and migratory wildlife
are not adequately disclosed, addressed, analyzed or mitigated.
4.1.2 Installation of Other Facilities @ page 31 of SDG&E Revised POD dated April 2013,
includes the following statement (emphasis added) For example, installation of appurtenant
facilities—such as weather stations, fire safety and early fire detection equipment, smart-grid
system data collection equipment, or other technologies or facilities—on the replacement steel
poles within existing ROWs may be necessary or prudent to collect additional information
needed to further increase fire safety and service reliability as new technologies become
available.
Revised POD attachment F: Electric and Magnetic Fields7, fails to include the most recent
research and conclusions related to public health and safety from chronic exposure to electric
magnetic fields and wireless communications facilities:
Attachment F: Electric Magnetic Fields is outdated and bordering on negligent:
o It fails to address more recent research and findings (listed below)
o The most current reference included in Attachment F, “California Public Utilities
Commission, Opinion on Commission Policies Addressing Electromagnetic Fields
Emanating From Regulated Utility Facilities, 2006 is biased towards utilities self-serving
and unsupported claims of “uncertainty”. That 2006 document was generated by the
CPUC during President Peevey’s reign that has now come under a cloud of scandal with
growing allegations of wrongdoing and appeals to Attorney General Kamala Harris for
5 http://www.cpuc.ca.gov/environment/info/dudek/CNF/CNF_Amended%20Application.pdf
6 http://www.cpuc.ca.gov/environment/info/dudek/CNF/MSUP-PTC_PLRP_EIR-EIS_PART1_Begin_C.pdf
7https://www.sdge.com/sites/default/files/regulatory/CNF%20Revised%20POD%20Attachment%20F%20Electric%
20and%20Magnetic%20Fields%20(04-19-13S).pdf
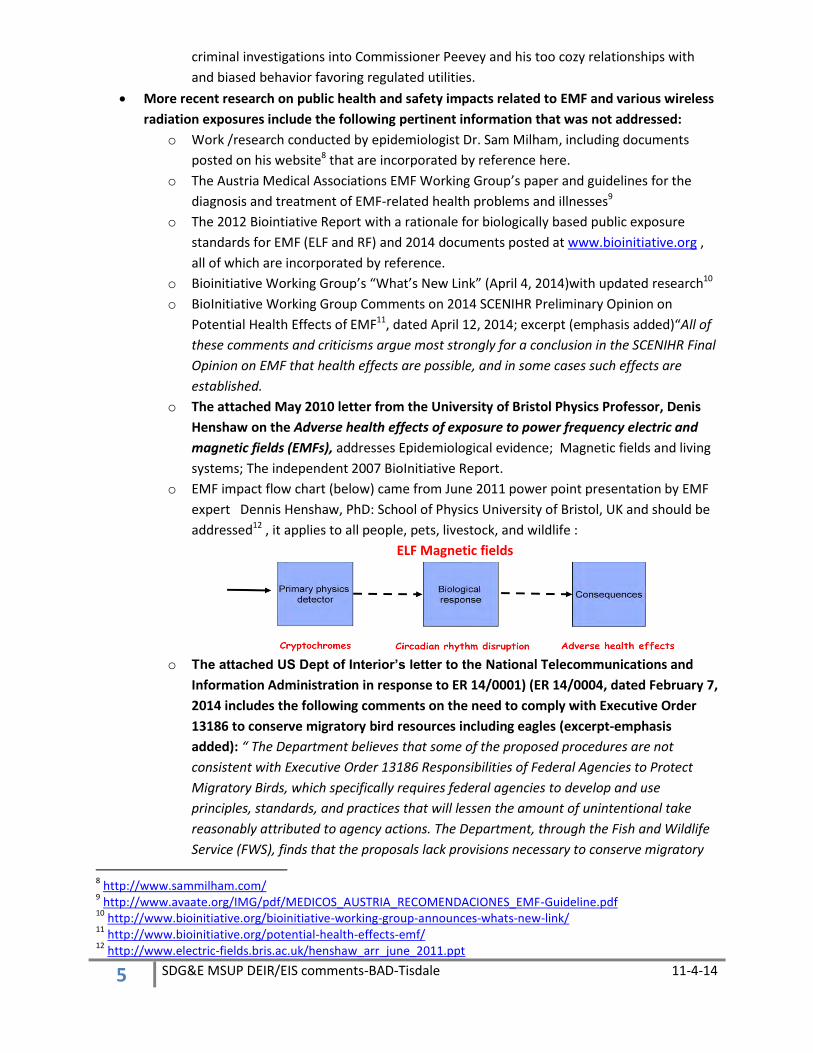
5 SDG&E MSUP DEIR/EIS comments-BAD-Tisdale 11-4-14
criminal investigations into Commissioner Peevey and his too cozy relationships with
and biased behavior favoring regulated utilities.
More recent research on public health and safety impacts related to EMF and various wireless
radiation exposures include the following pertinent information that was not addressed:
o Work /research conducted by epidemiologist Dr. Sam Milham, including documents
posted on his website8 that are incorporated by reference here.
o The Austria Medical Associations EMF Working Group’s paper and guidelines for the
diagnosis and treatment of EMF-related health problems and illnesses9
o The 2012 Biointiative Report with a rationale for biologically based public exposure
standards for EMF (ELF and RF) and 2014 documents posted at www.bioinitiative.org ,
all of which are incorporated by reference.
o Bioinitiative Working Group’s “What’s New Link” (April 4, 2014)with updated research10
o BioInitiative Working Group Comments on 2014 SCENIHR Preliminary Opinion on
Potential Health Effects of EMF11, dated April 12, 2014; excerpt (emphasis added)“All of
these comments and criticisms argue most strongly for a conclusion in the SCENIHR Final
Opinion on EMF that health effects are possible, and in some cases such effects are
established.
o The attached May 2010 letter from the University of Bristol Physics Professor, Denis
Henshaw on the Adverse health effects of exposure to power frequency electric and
magnetic fields (EMFs), addresses Epidemiological evidence; Magnetic fields and living
systems; The independent 2007 BioInitiative Report.
o EMF impact flow chart (below) came from June 2011 power point presentation by EMF
expert Dennis Henshaw, PhD: School of Physics University of Bristol, UK and should be
addressed12 , it applies to all people, pets, livestock, and wildlife :
ELF Magnetic fields
o The attached US Dept of Interior’s letter to the National Telecommunications and
Information Administration in response to ER 14/0001) (ER 14/0004, dated February 7,
2014 includes the following comments on the need to comply with Executive Order
13186 to conserve migratory bird resources including eagles (excerpt-emphasis
added): “ The Department believes that some of the proposed procedures are not
consistent with Executive Order 13186 Responsibilities of Federal Agencies to Protect
Migratory Birds, which specifically requires federal agencies to develop and use
principles, standards, and practices that will lessen the amount of unintentional take
reasonably attributed to agency actions. The Department, through the Fish and Wildlife
Service (FWS), finds that the proposals lack provisions necessary to conserve migratory
8 http://www.sammilham.com/
9 http://www.avaate.org/IMG/pdf/MEDICOS_AUSTRIA_RECOMENDACIONES_EMF-Guideline.pdf
10 http://www.bioinitiative.org/bioinitiative-working-group-announces-whats-new-link/
11 http://www.bioinitiative.org/potential-health-effects-emf/
12 http://www.electric-fields.bris.ac.uk/henshaw_arr_june_2011.ppt
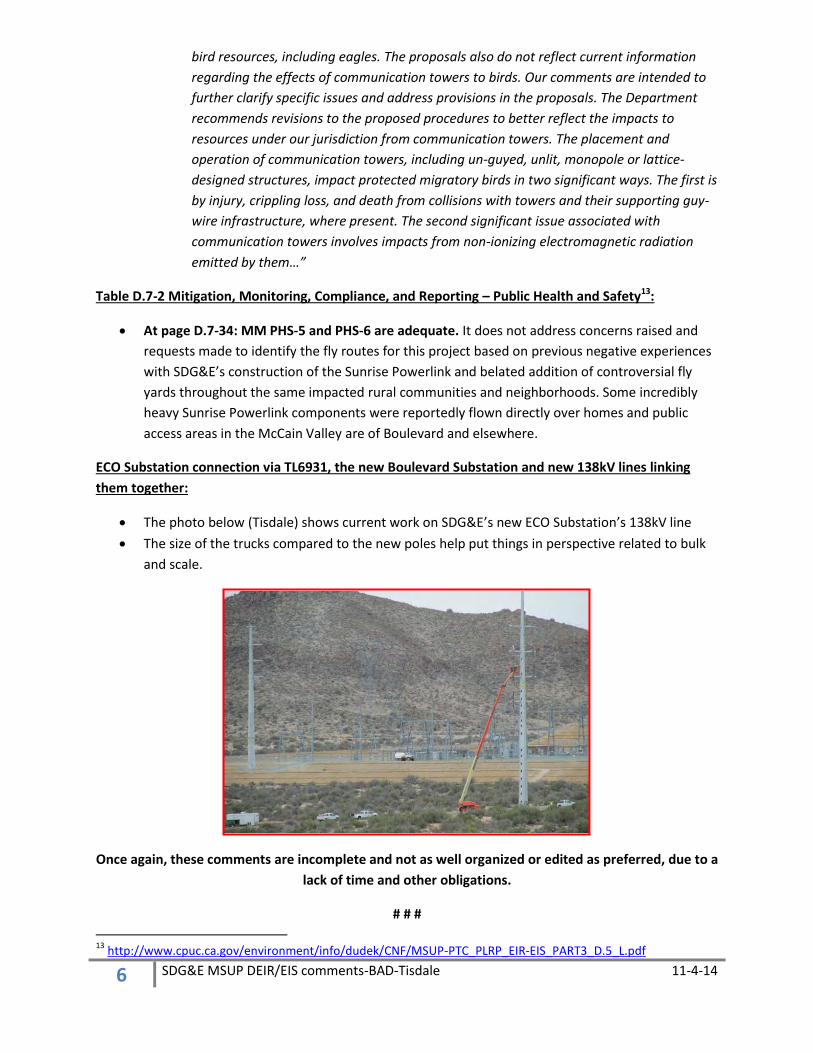
6 SDG&E MSUP DEIR/EIS comments-BAD-Tisdale 11-4-14
bird resources, including eagles. The proposals also do not reflect current information
regarding the effects of communication towers to birds. Our comments are intended to
further clarify specific issues and address provisions in the proposals. The Department
recommends revisions to the proposed procedures to better reflect the impacts to
resources under our jurisdiction from communication towers. The placement and
operation of communication towers, including un-guyed, unlit, monopole or lattice-
designed structures, impact protected migratory birds in two significant ways. The first is
by injury, crippling loss, and death from collisions with towers and their supporting guy-
wire infrastructure, where present. The second significant issue associated with
communication towers involves impacts from non-ionizing electromagnetic radiation
emitted by them…”
Table D.7-2 Mitigation, Monitoring, Compliance, and Reporting – Public Health and Safety13:
At page D.7-34: MM PHS-5 and PHS-6 are adequate. It does not address concerns raised and
requests made to identify the fly routes for this project based on previous negative experiences
with SDG&E’s construction of the Sunrise Powerlink and belated addition of controversial fly
yards throughout the same impacted rural communities and neighborhoods. Some incredibly
heavy Sunrise Powerlink components were reportedly flown directly over homes and public
access areas in the McCain Valley are of Boulevard and elsewhere.
ECO Substation connection via TL6931, the new Boulevard Substation and new 138kV lines linking
them together:
The photo below (Tisdale) shows current work on SDG&E’s new ECO Substation’s 138kV line
The size of the trucks compared to the new poles help put things in perspective related to bulk
and scale.
Once again, these comments are incomplete and not as well organized or edited as preferred, due to a
lack of time and other obligations.
# # #
13
http://www.cpuc.ca.gov/environment/info/dudek/CNF/MSUP-PTC_PLRP_EIR-EIS_PART3_D.5_L.pdf

EXHIBIT 5
Stephen T. Smith, P. E. 7080 Landmark Place
Helena, MT 59601 Phone and FAX: (406)449-6216
Email: [email protected]
Fire Performance of Steel Utility Poles – Literature Review and Evaluation
August 2013
Introduction
Preservative-treated wooden poles have become the backbone supporting the wiring of the U.S. electric and telecommunications utilities in the modern age. Wooden poles are strong, light-weight, plentiful, economic, and, with proper preservation and maintenance, offer service lives of approximately 70 years. Wood, as we all know, also burns. Wood poles may be destroyed by wildfires, sometimes in large number. Utilities’ management and regulators have been looking for means to minimize damage to the infrastructure caused by wildfires in recent years. In recent years galvanized steel poles have been considered as a substitute for wooden poles.
The common understanding is that steel does not burn, so would be a logical choice for utility poles in fire prone areas. Direct bury galvanized steel poles are often thought to be interchangeable with wood poles in standard load classes and lengths. However, at equivalent grades, steel poles are designed for lower horizontal loads than wood poles, such that it is typically necessary to use higher grade steel poles than wood poles for the same situations.1 Steel poles are also designed to be installed with approximately the lower six-feet buried in holes drilled into the ground. As such, appropriately selected steel poles may offer replacements for wood poles. Because such steel poles still represent only a small fraction of all utility poles, with most installed relatively recently, and their performance in resisting damage from wildfires has little documentation, we really don’t know whether steel poles resist fire damage better than wood poles. The purpose of this paper is to review the literature to clarify what data is available and to evaluate what that data may mean relative to fire damage resistance of galvanized steel poles.
Literature Review
Most literature evaluating steel performance in fires relates to building fires, but some relevant data can be developed. Data applicable to how galvanized steel poles are affected by wildfires can generally be divided into two broad categories; 1) wildfire conditions and likely exposures and 2) likely effects of exposure to galvanized steel poles.
1 Direct-bury galvanized steel poles are typically produced to an NESC Grade B transverse load design equivalency to wood poles, meaning that the poles are designed with a horizontal load capacity equal to 65% of the published strength of wood poles as found in the wood pole national standard, ANSI O5.1. It is important to note that most pole line construction is governed by the Grade C construction standards of the NESC and the direct-bury galvanized steel poles cannot be used as direct replacements for standard wood pole classes in these cases. In fact, since there are at least 6 different design cases in the NESC, and the structural properties of the poles are different, there can be no true “wood equivalent pole”. Use of direct-bury galvanized steel poles designed to transverse load Grade B equivalency in a line designed for wood poles under NESC Grade C would require that the span length be significantly reduced on the steel poles. Utilities should employ steel poles based on their specific strength values, not as some type of wood equivalent.
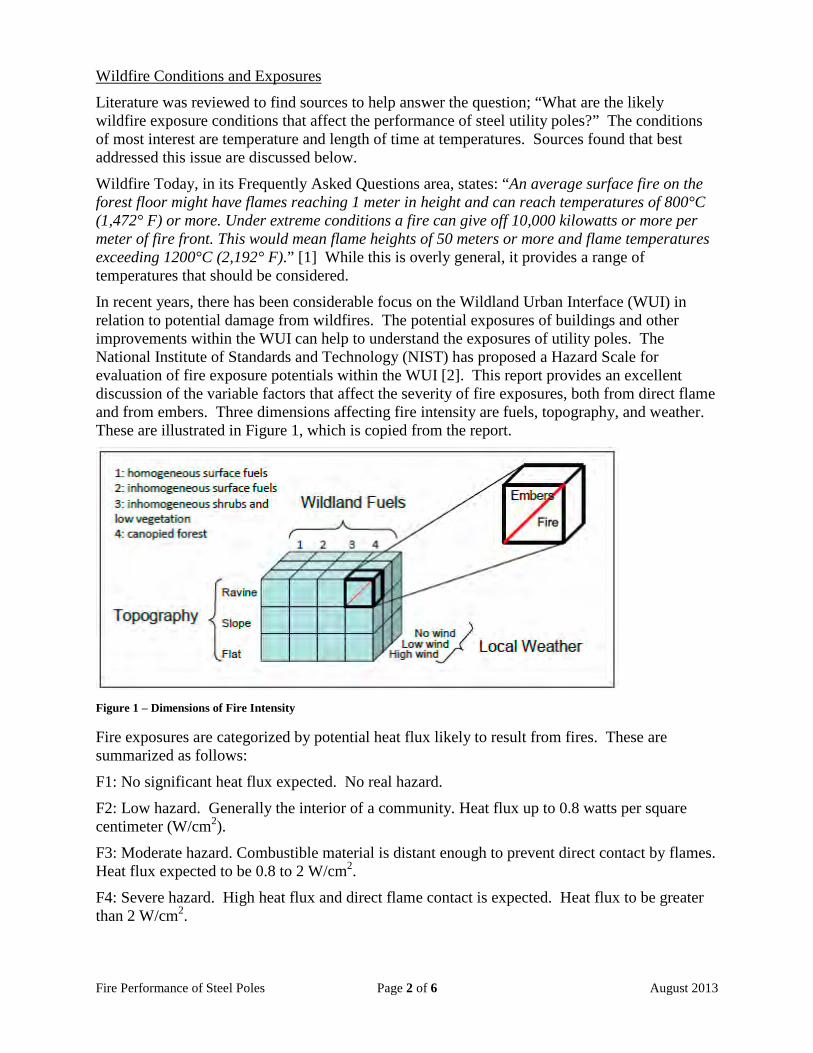
Fire Performance of Steel Poles Page 2 of 6 August 2013
Wildfire Conditions and Exposures
Literature was reviewed to find sources to help answer the question; “What are the likely wildfire exposure conditions that affect the performance of steel utility poles?” The conditions of most interest are temperature and length of time at temperatures. Sources found that best addressed this issue are discussed below.
Wildfire Today, in its Frequently Asked Questions area, states: “An average surface fire on the forest floor might have flames reaching 1 meter in height and can reach temperatures of 800°C (1,472° F) or more. Under extreme conditions a fire can give off 10,000 kilowatts or more per meter of fire front. This would mean flame heights of 50 meters or more and flame temperatures exceeding 1200°C (2,192° F).” [1] While this is overly general, it provides a range of temperatures that should be considered.
In recent years, there has been considerable focus on the Wildland Urban Interface (WUI) in relation to potential damage from wildfires. The potential exposures of buildings and other improvements within the WUI can help to understand the exposures of utility poles. The National Institute of Standards and Technology (NIST) has proposed a Hazard Scale for evaluation of fire exposure potentials within the WUI [2]. This report provides an excellent discussion of the variable factors that affect the severity of fire exposures, both from direct flame and from embers. Three dimensions affecting fire intensity are fuels, topography, and weather. These are illustrated in Figure 1, which is copied from the report.
Figure 1 – Dimensions of Fire Intensity
Fire exposures are categorized by potential heat flux likely to result from fires. These are summarized as follows:
F1: No significant heat flux expected. No real hazard.
F2: Low hazard. Generally the interior of a community. Heat flux up to 0.8 watts per square centimeter (W/cm2).
F3: Moderate hazard. Combustible material is distant enough to prevent direct contact by flames. Heat flux expected to be 0.8 to 2 W/cm2.
F4: Severe hazard. High heat flux and direct flame contact is expected. Heat flux to be greater than 2 W/cm2.
Fire Performance of Steel Poles Page 3 of 6 August 2013
This report also discusses the importance of embers in spreading fires. In the case of steel utility poles, it is likely that the same conditions that increase fire hazard would also deposite hot embers at the base of poles, increasing the duration of elevated temperature exposure.
An article on laboratory research by NIST [3] on burning individual Douglas fir trees provides perspective on the heat release, time frame, and potential exposure temperatures. Individual Douglas fir trees of various heights and moisture contents were set afire under monitored laboratory conditions. The timing of mass loss to fire, heat release rates, and temperatures of monitors at various distances and heights were monitored. Trees were completely burned within one minute and the maximum rate of mass combustion occurred within approximately 10 to 20 seconds of the start of combustion. Within the fire center, gas phase temperatures were monitored to peak at approximately 700oC. Heat flux from 5-meter tall trees measured two meters from the tree centerline was 40 to 60 kW/m2. (This equates to 4 to 6 W/cm2 and is clearly in the F4 Severe Hazard category as discussed above.) Note that this data reflects only one single tree burning alone. Clearly, multiple adjacent trees in a wildfire would produce higher temperatures and flux rates.
In a chapter addressing issues of remote sensing of fire characteristics for use in fire mapping [4], the authors discuss the temperatures at the leading edges of fires that need to be measured. They note that typical fire front temperatures are in the range of approximately 800oC and may often exceed 1000oC.
Another paper [5] discussing issues of remotely monitoring fire temperatures noted that for a wildfire in California, temperatures in the advancing fire front were often approximately 827oC and ranged as high as 1227oC. Temperatures behind the front generally ranged from 527oC to 727oC.
While the above sources, and many others not cited, are helpful in estimating the temperatures to which steel poles may be exposed, studies actually measuring the temperatures attained by steel poles could not be located. However, there is data available related to the temperatures attained by steel in buildings. Some are described below.
In a British test simulating building fires [6] that used stacks of burning wood in “rooms” to generate heat, combustion gas temperatures in the room were approximately 627oC for slow fire propagation and ranged from 724oC to 850oC for more rapid fire propagation. Discussion of results related to temperatures achieved by unprotected steel member in the compartments noted that thinner or more light-weight steel members heat more rapidly than thicker, heavier members. Thinner members tended to reach ambient (combustion gas) temperature. Free standing unprotected steel columns reached temperatures of approximately 400oC to 800oC. The exposure of steel inside a burning building is much different than that of a steel pole in a wildfire. A particular difference is that peak temperature is reached approximately 20 minutes after initiation of the fire in a building, much longer than would be expected in a wildfire that typically would burn intensely for some minutes near a pole as the fire front passes.
A booklet by the AISC [7] provides a description of the stages of fire development; incipient growth, burning, and decay. In building fires, the full cycle takes from one to six hours with in-building temperatures reaching from approximately 700oC to 1200oC.
Building codes and design guides, such as The Yellow Book [8], assume that in a fire unprotected steel would experience temperatures above which strength loss would occur, so steel members must be protected with fire resisting or temperature modulating materials such as concrete, gypsum board, or intumescent coatings.
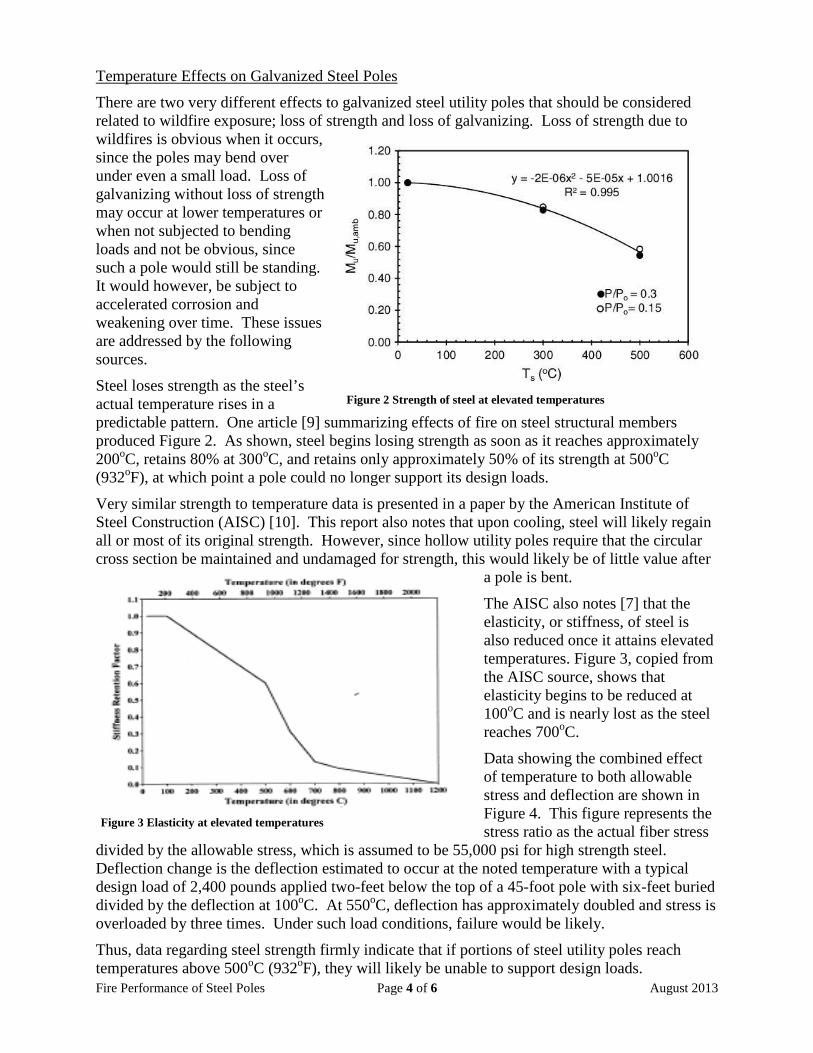
Fire Performance of Steel Poles Page 4 of 6 August 2013
Temperature Effects on Galvanized Steel Poles
There are two very different effects to galvanized steel utility poles that should be considered related to wildfire exposure; loss of strength and loss of galvanizing. Loss of strength due to wildfires is obvious when it occurs, since the poles may bend over under even a small load. Loss of galvanizing without loss of strength may occur at lower temperatures or when not subjected to bending loads and not be obvious, since such a pole would still be standing. It would however, be subject to accelerated corrosion and weakening over time. These issues are addressed by the following sources.
Steel loses strength as the steel’s actual temperature rises in a predictable pattern. One article [9] summarizing effects of fire on steel structural members produced Figure 2. As shown, steel begins losing strength as soon as it reaches approximately 200oC, retains 80% at 300oC, and retains only approximately 50% of its strength at 500oC (932oF), at which point a pole could no longer support its design loads.
Very similar strength to temperature data is presented in a paper by the American Institute of Steel Construction (AISC) [10]. This report also notes that upon cooling, steel will likely regain all or most of its original strength. However, since hollow utility poles require that the circular cross section be maintained and undamaged for strength, this would likely be of little value after
a pole is bent.
The AISC also notes [7] that the elasticity, or stiffness, of steel is also reduced once it attains elevated temperatures. Figure 3, copied from the AISC source, shows that elasticity begins to be reduced at 100oC and is nearly lost as the steel reaches 700oC.
Data showing the combined effect of temperature to both allowable stress and deflection are shown in Figure 4. This figure represents the stress ratio as the actual fiber stress
divided by the allowable stress, which is assumed to be 55,000 psi for high strength steel. Deflection change is the deflection estimated to occur at the noted temperature with a typical design load of 2,400 pounds applied two-feet below the top of a 45-foot pole with six-feet buried divided by the deflection at 100oC. At 550oC, deflection has approximately doubled and stress is overloaded by three times. Under such load conditions, failure would be likely.
Thus, data regarding steel strength firmly indicate that if portions of steel utility poles reach temperatures above 500oC (932oF), they will likely be unable to support design loads.
Figure 2 Strength of steel at elevated temperatures
Figure 3 Elasticity at elevated temperatures
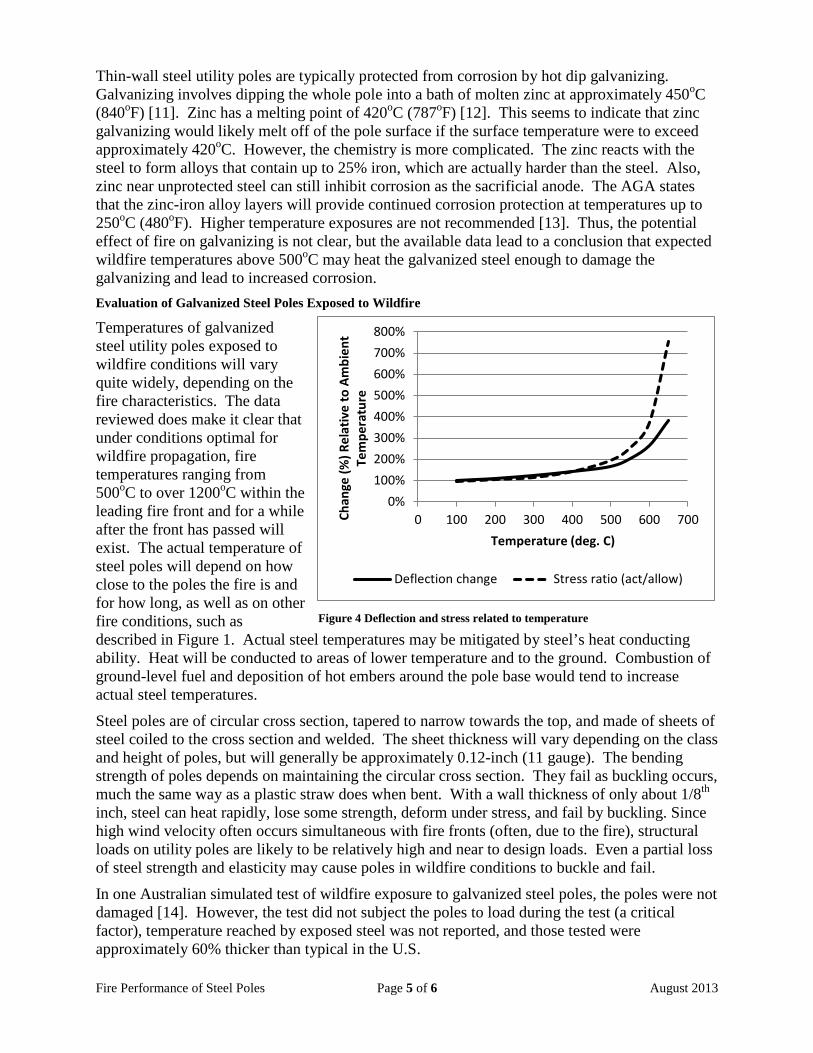
Fire Performance of Steel Poles Page 5 of 6 August 2013
Thin-wall steel utility poles are typically protected from corrosion by hot dip galvanizing. Galvanizing involves dipping the whole pole into a bath of molten zinc at approximately 450oC (840oF) [11]. Zinc has a melting point of 420oC (787oF) [12]. This seems to indicate that zinc galvanizing would likely melt off of the pole surface if the surface temperature were to exceed approximately 420oC. However, the chemistry is more complicated. The zinc reacts with the steel to form alloys that contain up to 25% iron, which are actually harder than the steel. Also, zinc near unprotected steel can still inhibit corrosion as the sacrificial anode. The AGA states that the zinc-iron alloy layers will provide continued corrosion protection at temperatures up to 250oC (480oF). Higher temperature exposures are not recommended [13]. Thus, the potential effect of fire on galvanizing is not clear, but the available data lead to a conclusion that expected wildfire temperatures above 500oC may heat the galvanized steel enough to damage the galvanizing and lead to increased corrosion. Evaluation of Galvanized Steel Poles Exposed to Wildfire
Temperatures of galvanized steel utility poles exposed to wildfire conditions will vary quite widely, depending on the fire characteristics. The data reviewed does make it clear that under conditions optimal for wildfire propagation, fire temperatures ranging from 500oC to over 1200oC within the leading fire front and for a while after the front has passed will exist. The actual temperature of steel poles will depend on how close to the poles the fire is and for how long, as well as on other fire conditions, such as described in Figure 1. Actual steel temperatures may be mitigated by steel’s heat conducting ability. Heat will be conducted to areas of lower temperature and to the ground. Combustion of ground-level fuel and deposition of hot embers around the pole base would tend to increase actual steel temperatures.
Steel poles are of circular cross section, tapered to narrow towards the top, and made of sheets of steel coiled to the cross section and welded. The sheet thickness will vary depending on the class and height of poles, but will generally be approximately 0.12-inch (11 gauge). The bending strength of poles depends on maintaining the circular cross section. They fail as buckling occurs, much the same way as a plastic straw does when bent. With a wall thickness of only about 1/8th inch, steel can heat rapidly, lose some strength, deform under stress, and fail by buckling. Since high wind velocity often occurs simultaneous with fire fronts (often, due to the fire), structural loads on utility poles are likely to be relatively high and near to design loads. Even a partial loss of steel strength and elasticity may cause poles in wildfire conditions to buckle and fail.
In one Australian simulated test of wildfire exposure to galvanized steel poles, the poles were not damaged [14]. However, the test did not subject the poles to load during the test (a critical factor), temperature reached by exposed steel was not reported, and those tested were approximately 60% thicker than typical in the U.S.
0%100%200%300%400%500%600%700%800%
0 100 200 300 400 500 600 700Chan
ge (%
) Rel
ativ
e to
Am
bien
t Te
mpe
ratu
re
Temperature (deg. C)
Deflection change Stress ratio (act/allow)
Figure 4 Deflection and stress related to temperature
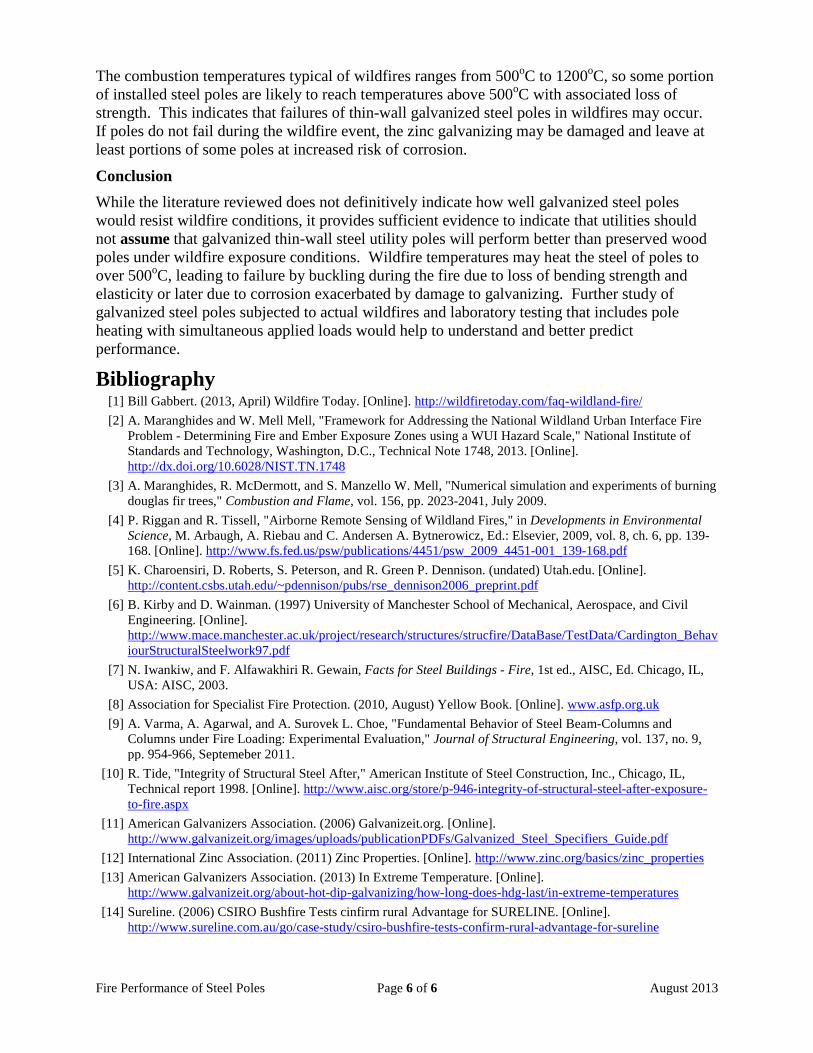
Fire Performance of Steel Poles Page 6 of 6 August 2013
The combustion temperatures typical of wildfires ranges from 500oC to 1200oC, so some portion of installed steel poles are likely to reach temperatures above 500oC with associated loss of strength. This indicates that failures of thin-wall galvanized steel poles in wildfires may occur. If poles do not fail during the wildfire event, the zinc galvanizing may be damaged and leave at least portions of some poles at increased risk of corrosion.
Conclusion
While the literature reviewed does not definitively indicate how well galvanized steel poles would resist wildfire conditions, it provides sufficient evidence to indicate that utilities should not assume that galvanized thin-wall steel utility poles will perform better than preserved wood poles under wildfire exposure conditions. Wildfire temperatures may heat the steel of poles to over 500oC, leading to failure by buckling during the fire due to loss of bending strength and elasticity or later due to corrosion exacerbated by damage to galvanizing. Further study of galvanized steel poles subjected to actual wildfires and laboratory testing that includes pole heating with simultaneous applied loads would help to understand and better predict performance.
Bibliography [1] Bill Gabbert. (2013, April) Wildfire Today. [Online]. http://wildfiretoday.com/faq-wildland-fire/ [2] A. Maranghides and W. Mell Mell, "Framework for Addressing the National Wildland Urban Interface Fire
Problem - Determining Fire and Ember Exposure Zones using a WUI Hazard Scale," National Institute of Standards and Technology, Washington, D.C., Technical Note 1748, 2013. [Online]. http://dx.doi.org/10.6028/NIST.TN.1748
[3] A. Maranghides, R. McDermott, and S. Manzello W. Mell, "Numerical simulation and experiments of burning douglas fir trees," Combustion and Flame, vol. 156, pp. 2023-2041, July 2009.
[4] P. Riggan and R. Tissell, "Airborne Remote Sensing of Wildland Fires," in Developments in Environmental Science, M. Arbaugh, A. Riebau and C. Andersen A. Bytnerowicz, Ed.: Elsevier, 2009, vol. 8, ch. 6, pp. 139-168. [Online]. http://www.fs.fed.us/psw/publications/4451/psw_2009_4451-001_139-168.pdf
[5] K. Charoensiri, D. Roberts, S. Peterson, and R. Green P. Dennison. (undated) Utah.edu. [Online]. http://content.csbs.utah.edu/~pdennison/pubs/rse_dennison2006_preprint.pdf
[6] B. Kirby and D. Wainman. (1997) University of Manchester School of Mechanical, Aerospace, and Civil Engineering. [Online]. http://www.mace.manchester.ac.uk/project/research/structures/strucfire/DataBase/TestData/Cardington_BehaviourStructuralSteelwork97.pdf
[7] N. Iwankiw, and F. Alfawakhiri R. Gewain, Facts for Steel Buildings - Fire, 1st ed., AISC, Ed. Chicago, IL, USA: AISC, 2003.
[8] Association for Specialist Fire Protection. (2010, August) Yellow Book. [Online]. www.asfp.org.uk [9] A. Varma, A. Agarwal, and A. Surovek L. Choe, "Fundamental Behavior of Steel Beam-Columns and
Columns under Fire Loading: Experimental Evaluation," Journal of Structural Engineering, vol. 137, no. 9, pp. 954-966, Septemeber 2011.
[10] R. Tide, "Integrity of Structural Steel After," American Institute of Steel Construction, Inc., Chicago, IL, Technical report 1998. [Online]. http://www.aisc.org/store/p-946-integrity-of-structural-steel-after-exposure-to-fire.aspx
[11] American Galvanizers Association. (2006) Galvanizeit.org. [Online]. http://www.galvanizeit.org/images/uploads/publicationPDFs/Galvanized_Steel_Specifiers_Guide.pdf
[12] International Zinc Association. (2011) Zinc Properties. [Online]. http://www.zinc.org/basics/zinc_properties [13] American Galvanizers Association. (2013) In Extreme Temperature. [Online].
http://www.galvanizeit.org/about-hot-dip-galvanizing/how-long-does-hdg-last/in-extreme-temperatures [14] Sureline. (2006) CSIRO Bushfire Tests cinfirm rural Advantage for SURELINE. [Online].
http://www.sureline.com.au/go/case-study/csiro-bushfire-tests-confirm-rural-advantage-for-sureline

EXHIBIT 6
Sunrise Powerlink Project ATTACHMENT 1A TO ALTERNATIVES SCREENING REPORT
EFFECT OF WILDFIRES ON TRANSMISSION LINE RELIABILITY
Draft EIR/EIS 1A-1 January 2008
Attachment 1A: Effect of Wildfires on Transmission Line Reliability Collocation of Transmission Alternatives with the Southwest Powerlink
1. Reasons for Concern About Wildfires The potential for wildfires to impact the operation of transmission facilities is a concern which must be considered when siting new transmission lines. This is particularly true for transmission lines passing through the southern portion of San Diego County due to the history of wildfires in this area. SDG&E’s existing 500 kV line, the Southwest Powerlink (SWPL), has experienced a number of outages as a result of wildfires along this transmission corridor. A second 500 kV line, collocated for the entire dis-tance between the Imperial Valley and Miguel substations, would be expected to experience a similar outage frequency. The simultaneous loss of both transmission lines could pose a significant reliability concern for SDG&E.
This study defines the varying risk of wildfire along the SWPL in order to illustrate where the fire risk exists and how it changes along the 85-mile SWPL route between the Imperial Valley Substation (Mile-post 0) and the Miguel Substation (Milepost 85). In particular, this study evaluates the two segments of the SWPL that would be used in alternatives being considered for the Sunrise Powerlink EIR/EIS:
• MP 0 to 36 (Interstate 8 Alternative; BCD Alternative; Modified Route D Alternative)
• MP 0 to 52 (Route D Alternative; West of Forest Alternative)
How do Fires Cause Transmission Outages? Transmission lines located in areas with high fire risk and high occurrence of lightning strikes creates a reliability risk. Dense smoke from wildfires can “trip”1 a circuit, causing it to go out of service, or outages can result from emergency line de-rating or shut-downs during a nearby fire in order to prevent thermal damage to the line, to prevent a smoke-caused trip, or to meet the safety needs of firefighters.
When a wildfire occurs very near a transmission line right-of-way (ROW), wood poles can burn. Lines carried by steel towers are also vulnerable to heat from wildfire. The conductors on both wood- and steel-carried transmission lines are susceptible to physical damage from the heat of a wildfire, and conductor damage is not repairable (conductors must be replaced). A fire can force the outage of a transmission circuit if it raises the ambient temperature of the air around the conductors above the line’s operating parameters. Heavy smoke from a nearby wildfire can contaminate a transmission line’s insulating medium, which is the air surrounding the conductor.2 Smoke can cause an outage as a result of a phase-to-phase, or phase-to-ground fault because the ionized air in the smoke can become a conductor of electricity resulting in arcing between lines on a circuit or between a line and the ground.
1 A “trip” of a transmission line occurs when the system’s protective equipment shuts down power flow over a
given segment of the line in an effort to mitigate potential damage to the interconnected equipment. 2 Turley, Ron. “Southwestern Colorado teamwork earns fire plan award” Closed Circuit, March 25, 2005. Western
Area Power Administration, an agency of the US Department of Energy. Accessed 2/05/07. http://www.wapa.gov/
Sunrise Powerlink Project ATTACHMENT 1A TO ALTERNATIVES SCREENING REPORT EFFECT OF WILDFIRES ON TRANSMISSION LINE RELIABILITY
January 2008 1A-2 Draft EIR/EIS
In an effort to protect the transmission facilities from this type of power surge the system’s protective equipment can shut the line down, resulting in an unplanned outage.
2. Wildland Fires and Risk Reduction Measures The vast majority of wildfires in California (98 percent) are caused by human sources. Examples of human-caused ignition sources are campfires, hot ash from cigarettes, sparks from chainsaws and other equipment, short-circuits from faulty equipment on power lines, infrequent collisions of aircraft, and arson. The three components of fire risk are ignition points, fuel buildup, and weather conditions. Although weather conditions cannot be controlled, risk reduction measures can be taken to reduce the number of ignition points, and fuel buildup near transmission lines can be controlled to reduce the risk of an ignition source resulting in fire. Non-human ignition sources include lightning and interference by large birds and other wildlife. Fuel sources include living and dead vegetation beneath and adjacent to transmission line ROWs.
2.1 Fires Caused by Transmission and Distribution Lines Fires can start at transmission lines or substations for a variety of reasons. These fires are much more likely to start along small transmission and distribution lines due to the shorter distance from conductors to the ground, and because the conductor phases are closer together.
1. Large birds and raptors can develop a preference for a particular pole or tower as a roosting place. Two problems arise from this situation. First, their droppings can build up on insulators to the point that a flash-over between conductors and the crossarm can occur. This situation can cause a line fault and glowing debris to fall to the ground. Second, during take-off or landing, large birds’ wings can touch two conductors simultaneously and create a short circuit. This situation can cause the bird to fall to the ground, sometimes in flames, and ignite dry vegetation below the conductors. Mitigation for these events includes clearing of vegetation around poles used as perch sites. Many situations may be remedied with the installation of raptor perches, providing a secure perch on poles or towers away from sensitive equipment.3
2. Small animals resting on transformers in substations or on power poles can also start fires by causing short-circuits when their bodies come into contact with both transformer bushings. Mitigation for this event would include use of a plastic wildlife protection boot over one bushing of the transformer to prevent birds and other animals from causing direct short-circuits between transformer bushings.2
3. Other conditions that may lead to potential fire problems are damaged hardware, damaged insulators, weather- or bird-damaged poles, and broken strands on conductors. Porcelain insu-lators will allow a flash over if they lose too much of the skirt to breakage. Broken crossarms, damaged poles or bent brackets and braces can allow conductors to touch the ground or come into contact with each other.2 Implementation of routine line inspection procedures is necessary to mitigate the effects of faulty equipment. Utilities and fire protection agencies are both responsible for inspection of power lines.
3 California State Fire Marshal. Power Line Fire Prevention Field Guide. Department of Forestry and Fire
Protection. March 27, 2001.

Sunrise Powerlink Project ATTACHMENT 1A TO ALTERNATIVES SCREENING REPORT
EFFECT OF WILDFIRES ON TRANSMISSION LINE RELIABILITY
Draft EIR/EIS 1A-3 January 2008
2.2 Fire Risk Reduction Practices and Measures
2.2.1 Practices and Systems to Reduce Risk
SDG&E’s Electric Standard Practice defines procedures and routine practices for personnel working on or near power lines to minimize wildfire ignition by personnel and equipment. These include cen-tralized dissemination of fire risk information, discussion of fire safety procedures at tailboard meet-ings, guidelines on smoking, the appointment of a Fire Patrol guard under high fire risk conditions, and requirements for a project specific fire plan, fire mitigation and control tools, and water supply to be carried on all SDG&E vehicles. SDG&E has on staff a permanent Fire Coordinator. The Fire Coor-dinator is the liaison to fire services, the key contact for questions about fire plans, and the coordinator of fire safety training.
The Red Flag Warning System is a joint effort between state, federal, and local fire agencies intended to pass along critical fire weather information to users and occupants of wildland areas to bring about more prudent actions in their wildland-related activities. When a Red Flag Warning is issued, SDG&E takes action in the following ways: notifications take place; tripped lines are not tested manually or remotely until the line has been patrolled or the cause of the interruption has been identified and repaired; a Fire Patrol guard is assigned to any operation that has the potential to cause a fire; no open burning is permitted; all fires are extinguished; all tree pruning and removal activities cease; all blasting is discontinued; all grinding and welding discontinues; vehicular travel is restricted to cleared roads except in case of an emergency; smoking is not permitted.
The US Forest Service implements the Project Activity Levels (PAL) system to reduce the risk of fire on National Forest land. The PAL system restricts work activities during peak fire risk hours depending on a forest’s PAL level, or level of fire risk. SDG&E follows PAL guidelines and performs daily checks of PAL levels for all work areas by calling the PAL hotline services.
2.2.2 Measures to Reduce Risk of Outage
Following are measures that could reduce the risk of transmission line outage. More detail on these types of measures is presented in EIR/EIS Section D.15 (Fire Management).
Utility Fuel Modifications
• Expand fuel clearance (+50%) in tower footprint where fire risk ranking is High or Very High
• Reduce fuel maintenance intervals within the expanded fuel clearance tower footprint (mechanical, hand, and herbicide treatments)
• Reduce fuel maintenance intervals within the established “Wire Zones” between towers where fire risk ranking is High or Very High (mechanical, hand, and herbicide treatments)
• Identify and prioritize fire risk “Fuel Reduction Border Zones” for reoccurring fuel modification treat-ments. For example one such “Border Zone” should be established where appropriate (veg, slope, fire ranking, etc.) between the existing SWPL and the proposed new 500 kV line.
• Design fuel modification prescriptions to reduce crown density and mimic early successional stages of site specific vegetation type.
• Reduce fuel loads below 10 tons/acre within “Border Zone”
Sunrise Powerlink Project ATTACHMENT 1A TO ALTERNATIVES SCREENING REPORT EFFECT OF WILDFIRES ON TRANSMISSION LINE RELIABILITY
January 2008 1A-4 Draft EIR/EIS
• Alter fuel structure by removing ladder fuels and reducing canopy to less than 20% closure.
• Establish “fuel management mosaics” within the “Border Zone” for initial implementation and reoccur-ring maintenance
• Alter species composition as needed to achieve prescription
Utility Fire Prevention and Suppression
In addition to the above, the utility could mitigate fire risk by implementing the following measures:
• Initiate or increase powerline fire patrol frequency during 25th percentile or greater fire weather periods
• Improve and maintain strategic emergency ingress/egress roads capable of safely transporting fire equipment and personnel
• Collaborate with local fire and community organizations on fire prevention education and outreach programs
• Continue to fund utility/local fire suppression departments and organizations.
2.3 Fuel Clearance Requirements The California Public Resources Code (PRC) and SDG&E’s Electric Standard Practice Policy and Guide for Encroachment set forth requirements, guidelines, and best practices for mitigation of ignition and fuel sources in transmission line ROWs.
PRC Section 4292 requires clearance of flammable fuels for a 10-foot horizontal radius from the outer circumference of power line poles and towers. Section 4293 requires clearance of all vegetation for a specific radial distance from conductors, based on the voltage carried by the conductors: four feet for 2,400-71,999 V, six feet for 72,000-109,999 V, and 10 feet for 110,000 V. In addition this section requires the removal or trimming of trees, or portions of trees, that are dead, decadent, rotten, decayed or diseased and which may fall into or onto the line and trees leaning toward the line. SDG&E’s policy for minimum clearance from ground to any transmission conductor of 500 kV is at least 40 feet when the conductor is at maximum designed sag.
The SDG&E Vegetation Management Program through the Construction Services Department has an extensive tree pruning and removal program to provide adequate line clearance. It also treats all non-exempt power poles in the specified area to maintain the 10-foot clearance required by PRC 4292. Personnel from Land Services, Facilities, and Fire Coordination work together to meet defensible space requirements, as well as other fuel hazard reduction where applicable.
SDG&E and the California Department of Forestry have agreed to follow a Memorandum of Under-standing, which aims to optimize communication and cooperation between the two parties in order to minimize fire risk and to mutually benefit the parties in funding fire mitigation efforts.
While it is generally possible to control fuel buildup by removing vegetation in utility line ROWs, vege-tation clearing to control fuel sources may encounter legal opposition or require lengthy environmental compliance measures when the taking of a listed endangered species or the modification of critical habi-tat is undertaken.
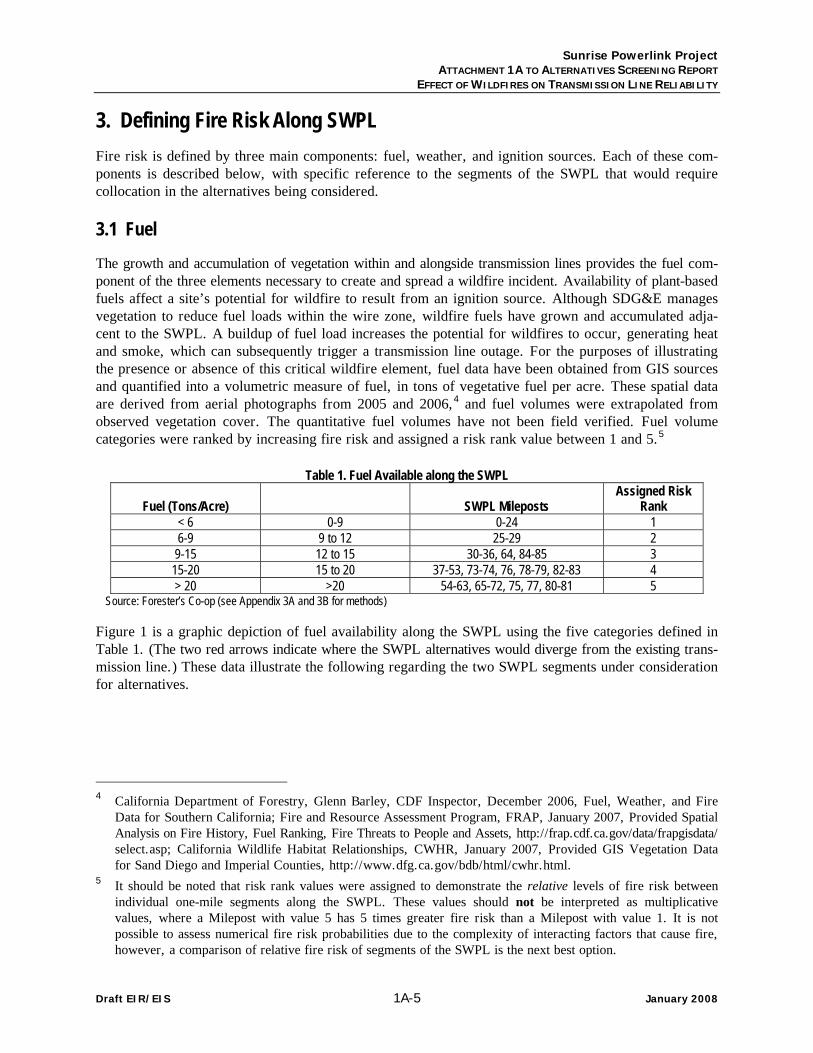
Sunrise Powerlink Project ATTACHMENT 1A TO ALTERNATIVES SCREENING REPORT
EFFECT OF WILDFIRES ON TRANSMISSION LINE RELIABILITY
Draft EIR/EIS 1A-5 January 2008
3. Defining Fire Risk Along SWPL Fire risk is defined by three main components: fuel, weather, and ignition sources. Each of these com-ponents is described below, with specific reference to the segments of the SWPL that would require collocation in the alternatives being considered.
3.1 Fuel The growth and accumulation of vegetation within and alongside transmission lines provides the fuel com-ponent of the three elements necessary to create and spread a wildfire incident. Availability of plant-based fuels affect a site’s potential for wildfire to result from an ignition source. Although SDG&E manages vegetation to reduce fuel loads within the wire zone, wildfire fuels have grown and accumulated adja-cent to the SWPL. A buildup of fuel load increases the potential for wildfires to occur, generating heat and smoke, which can subsequently trigger a transmission line outage. For the purposes of illustrating the presence or absence of this critical wildfire element, fuel data have been obtained from GIS sources and quantified into a volumetric measure of fuel, in tons of vegetative fuel per acre. These spatial data are derived from aerial photographs from 2005 and 2006,4 and fuel volumes were extrapolated from observed vegetation cover. The quantitative fuel volumes have not been field verified. Fuel volume categories were ranked by increasing fire risk and assigned a risk rank value between 1 and 5.5
Table 1. Fuel Available along the SWPL
Fuel (Tons/Acre) SWPL Mileposts Assigned Risk
Rank < 6 0-9 0-24 1 6-9 9 to 12 25-29 2 9-15 12 to 15 30-36, 64, 84-85 3 15-20 15 to 20 37-53, 73-74, 76, 78-79, 82-83 4 > 20 >20 54-63, 65-72, 75, 77, 80-81 5
Source: Forester’s Co-op (see Appendix 3A and 3B for methods)
Figure 1 is a graphic depiction of fuel availability along the SWPL using the five categories defined in Table 1. (The two red arrows indicate where the SWPL alternatives would diverge from the existing trans-mission line.) These data illustrate the following regarding the two SWPL segments under consideration for alternatives.
4 California Department of Forestry, Glenn Barley, CDF Inspector, December 2006, Fuel, Weather, and Fire
Data for Southern California; Fire and Resource Assessment Program, FRAP, January 2007, Provided Spatial Analysis on Fire History, Fuel Ranking, Fire Threats to People and Assets, http://frap.cdf.ca.gov/data/frapgisdata/select.asp; California Wildlife Habitat Relationships, CWHR, January 2007, Provided GIS Vegetation Data for Sand Diego and Imperial Counties, http://www.dfg.ca.gov/bdb/html/cwhr.html.
5 It should be noted that risk rank values were assigned to demonstrate the relative levels of fire risk between individual one-mile segments along the SWPL. These values should not be interpreted as multiplicative values, where a Milepost with value 5 has 5 times greater fire risk than a Milepost with value 1. It is not possible to assess numerical fire risk probabilities due to the complexity of interacting factors that cause fire, however, a comparison of relative fire risk of segments of the SWPL is the next best option.

Sunrise Powerlink Project ATTACHMENT 1A TO ALTERNATIVES SCREENING REPORT EFFECT OF WILDFIRES ON TRANSMISSION LINE RELIABILITY
January 2008 1A-6 Draft EIR/EIS
MP 0 to 36 (Interstate 8 Alternative; BCD Alternative; Modified Route D Alternative)
Much of this segment has very low levels of available fuel that could contribute to a fire. The first 29 miles of the SWPL corridor have the lowest fuel ranking, and Mileposts (MP) 30 through 32 fall into the second lowest ranking category.
MP 0 to 52 (Route D Alternative; West of Forest Alternative)
Between MP 37 and 53, available fuel becomes more dense, with much of the segment having 15 to 20 tons of fuel per acre.
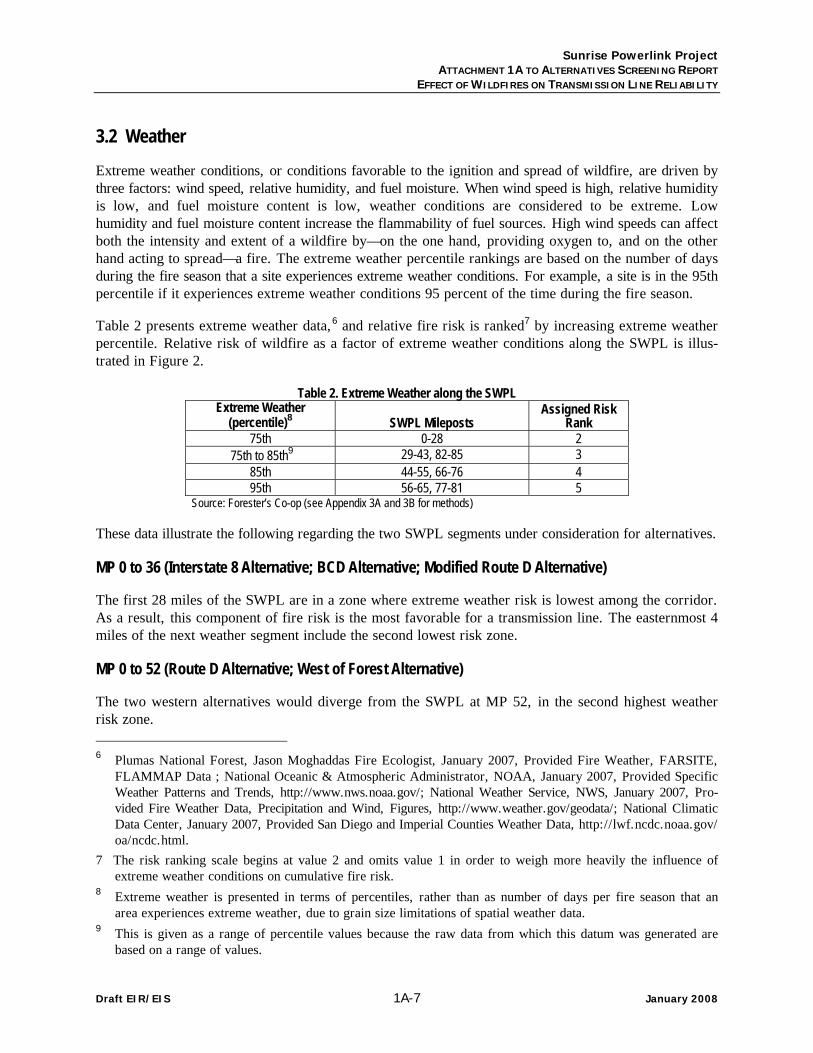
Sunrise Powerlink Project ATTACHMENT 1A TO ALTERNATIVES SCREENING REPORT
EFFECT OF WILDFIRES ON TRANSMISSION LINE RELIABILITY
Draft EIR/EIS 1A-7 January 2008
3.2 Weather Extreme weather conditions, or conditions favorable to the ignition and spread of wildfire, are driven by three factors: wind speed, relative humidity, and fuel moisture. When wind speed is high, relative humidity is low, and fuel moisture content is low, weather conditions are considered to be extreme. Low humidity and fuel moisture content increase the flammability of fuel sources. High wind speeds can affect both the intensity and extent of a wildfire by—on the one hand, providing oxygen to, and on the other hand acting to spread—a fire. The extreme weather percentile rankings are based on the number of days during the fire season that a site experiences extreme weather conditions. For example, a site is in the 95th percentile if it experiences extreme weather conditions 95 percent of the time during the fire season.
Table 2 presents extreme weather data,6 and relative fire risk is ranked7 by increasing extreme weather percentile. Relative risk of wildfire as a factor of extreme weather conditions along the SWPL is illus-trated in Figure 2.
Table 2. Extreme Weather along the SWPL Extreme Weather
(percentile)8 SWPL Mileposts Assigned Risk
Rank 75th 0-28 2
75th to 85th9 29-43, 82-85 3 85th 44-55, 66-76 4 95th 56-65, 77-81 5
Source: Forester’s Co-op (see Appendix 3A and 3B for methods)
These data illustrate the following regarding the two SWPL segments under consideration for alternatives.
MP 0 to 36 (Interstate 8 Alternative; BCD Alternative; Modified Route D Alternative)
The first 28 miles of the SWPL are in a zone where extreme weather risk is lowest among the corridor. As a result, this component of fire risk is the most favorable for a transmission line. The easternmost 4 miles of the next weather segment include the second lowest risk zone.
MP 0 to 52 (Route D Alternative; West of Forest Alternative)
The two western alternatives would diverge from the SWPL at MP 52, in the second highest weather risk zone. 6 Plumas National Forest, Jason Moghaddas Fire Ecologist, January 2007, Provided Fire Weather, FARSITE,
FLAMMAP Data ; National Oceanic & Atmospheric Administrator, NOAA, January 2007, Provided Specific Weather Patterns and Trends, http://www.nws.noaa.gov/; National Weather Service, NWS, January 2007, Pro-vided Fire Weather Data, Precipitation and Wind, Figures, http://www.weather.gov/geodata/; National Climatic Data Center, January 2007, Provided San Diego and Imperial Counties Weather Data, http://lwf.ncdc.noaa.gov/oa/ncdc.html.
7 The risk ranking scale begins at value 2 and omits value 1 in order to weigh more heavily the influence of extreme weather conditions on cumulative fire risk.
8 Extreme weather is presented in terms of percentiles, rather than as number of days per fire season that an area experiences extreme weather, due to grain size limitations of spatial weather data.
9 This is given as a range of percentile values because the raw data from which this datum was generated are based on a range of values.
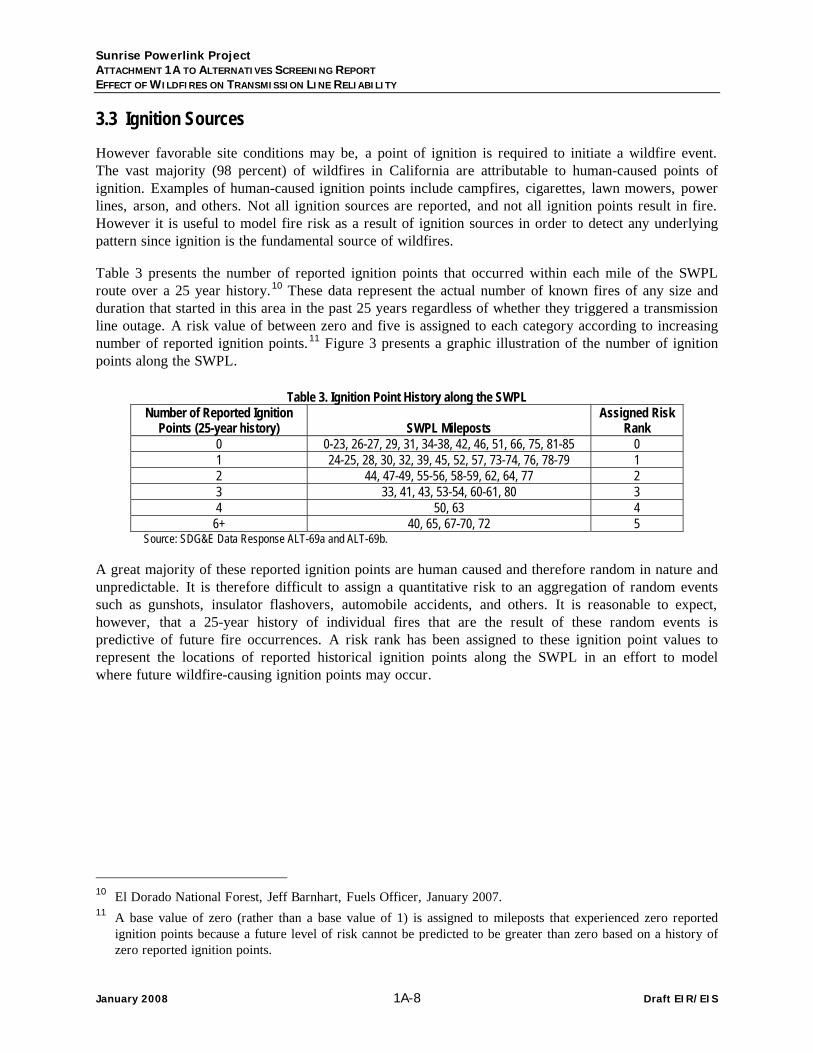
Sunrise Powerlink Project ATTACHMENT 1A TO ALTERNATIVES SCREENING REPORT EFFECT OF WILDFIRES ON TRANSMISSION LINE RELIABILITY
January 2008 1A-8 Draft EIR/EIS
3.3 Ignition Sources However favorable site conditions may be, a point of ignition is required to initiate a wildfire event. The vast majority (98 percent) of wildfires in California are attributable to human-caused points of ignition. Examples of human-caused ignition points include campfires, cigarettes, lawn mowers, power lines, arson, and others. Not all ignition sources are reported, and not all ignition points result in fire. However it is useful to model fire risk as a result of ignition sources in order to detect any underlying pattern since ignition is the fundamental source of wildfires.
Table 3 presents the number of reported ignition points that occurred within each mile of the SWPL route over a 25 year history.10 These data represent the actual number of known fires of any size and duration that started in this area in the past 25 years regardless of whether they triggered a transmission line outage. A risk value of between zero and five is assigned to each category according to increasing number of reported ignition points.11 Figure 3 presents a graphic illustration of the number of ignition points along the SWPL.
Table 3. Ignition Point History along the SWPL Number of Reported Ignition
Points (25-year history) SWPL Mileposts Assigned Risk
Rank 0 0-23, 26-27, 29, 31, 34-38, 42, 46, 51, 66, 75, 81-85 0 1 24-25, 28, 30, 32, 39, 45, 52, 57, 73-74, 76, 78-79 1 2 44, 47-49, 55-56, 58-59, 62, 64, 77 2 3 33, 41, 43, 53-54, 60-61, 80 3 4 50, 63 4
6+ 40, 65, 67-70, 72 5 Source: SDG&E Data Response ALT-69a and ALT-69b.
A great majority of these reported ignition points are human caused and therefore random in nature and unpredictable. It is therefore difficult to assign a quantitative risk to an aggregation of random events such as gunshots, insulator flashovers, automobile accidents, and others. It is reasonable to expect, however, that a 25-year history of individual fires that are the result of these random events is predictive of future fire occurrences. A risk rank has been assigned to these ignition point values to represent the locations of reported historical ignition points along the SWPL in an effort to model where future wildfire-causing ignition points may occur.
10 El Dorado National Forest, Jeff Barnhart, Fuels Officer, January 2007. 11 A base value of zero (rather than a base value of 1) is assigned to mileposts that experienced zero reported
ignition points because a future level of risk cannot be predicted to be greater than zero based on a history of zero reported ignition points.
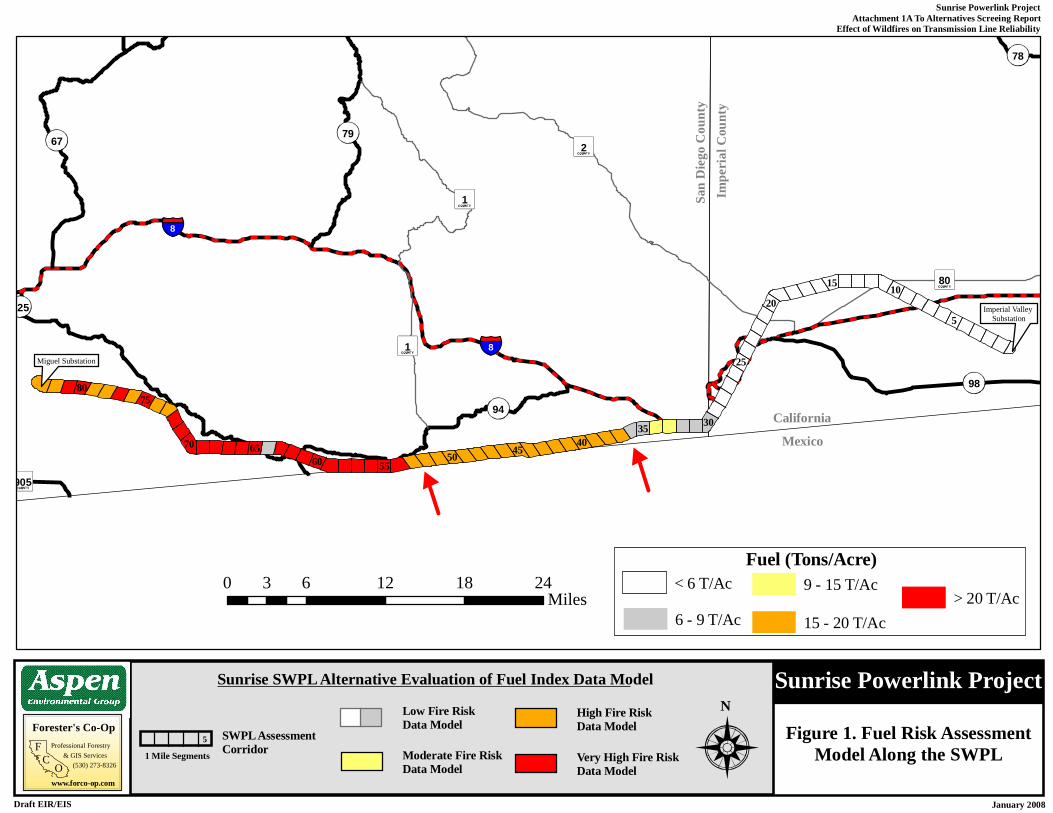
Sunrise Powerlink Project Attachment 1A To Alternatives Screeing ReportEffect of Wildfires on Transmission Line Reliability
January 2008Draft EIR/EIS
Sunrise Powerlink ProjectFigure 1. Fuel Risk Assessment
Model Along the SWPL
NForester's Co-Op
Professional ForestryFC
O& GIS Services
(530) 273-8326
www.forco-op.com
Moderate Fire Risk Data Model
Low Fire Risk Data ModelSWPL Assessment
Corridor1 Mile Segments5
High Fire Risk Data Model
Very High Fire Risk Data Model
Sunrise SWPL Alternative Evaluation of Fuel Index Data Model
0 6 12 18 243Miles
Impe
rial C
ounty
San D
iego C
ounty
MexicoCalifornia
8
8
80
1
905
2
1
98
67
125
94
78
79
5
6535
5570
30
45
1520
10
60 50
75
25
40
80
Fuel (Tons/Acre)9 - 15 T/Ac
15 - 20 T/Ac > 20 T/Ac
6 - 9 T/Ac
< 6 T/Ac
Miguel Substation
Imperial Valley Substation
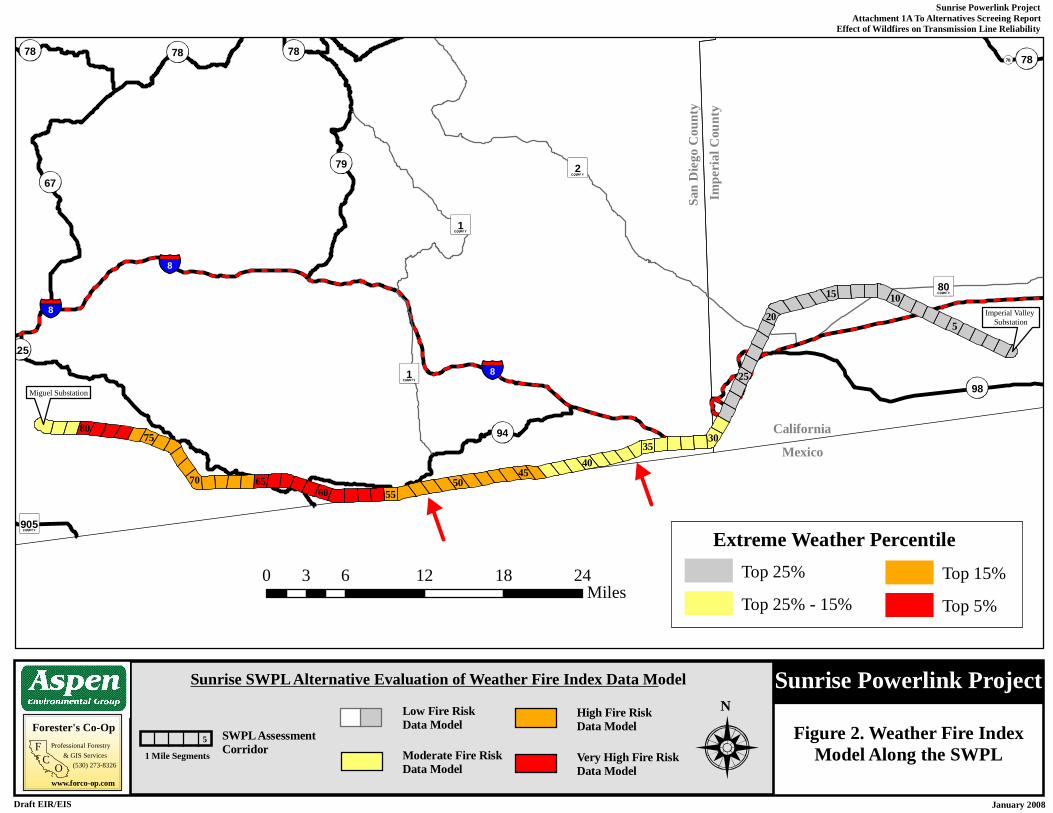
Sunrise Powerlink Project Attachment 1A To Alternatives Screeing ReportEffect of Wildfires on Transmission Line Reliability
January 2008Draft EIR/EIS
Sunrise Powerlink ProjectFigure 2. Weather Fire Index
Model Along the SWPL
NForester's Co-Op
Professional ForestryFC
O& GIS Services
(530) 273-8326
www.forco-op.com
Moderate Fire Risk Data Model
Low Fire Risk Data ModelSWPL Assessment
Corridor1 Mile Segments5
High Fire Risk Data Model
Very High Fire Risk Data Model
Sunrise SWPL Alternative Evaluation of Weather Fire Index Data Model
0 6 12 18 243Miles
Impe
rial C
ounty
San D
iego C
ounty
MexicoCalifornia
78
8
8
8
80
1
905
2
1
98
67
125
78
79
94
787878
5
6555
70
30
45
1520
10
6050
75
25
4035
80
Extreme Weather PercentileTop 25%
Top 25% - 15%
Top 15%
Top 5%
Miguel Substation
Imperial Valley Substation
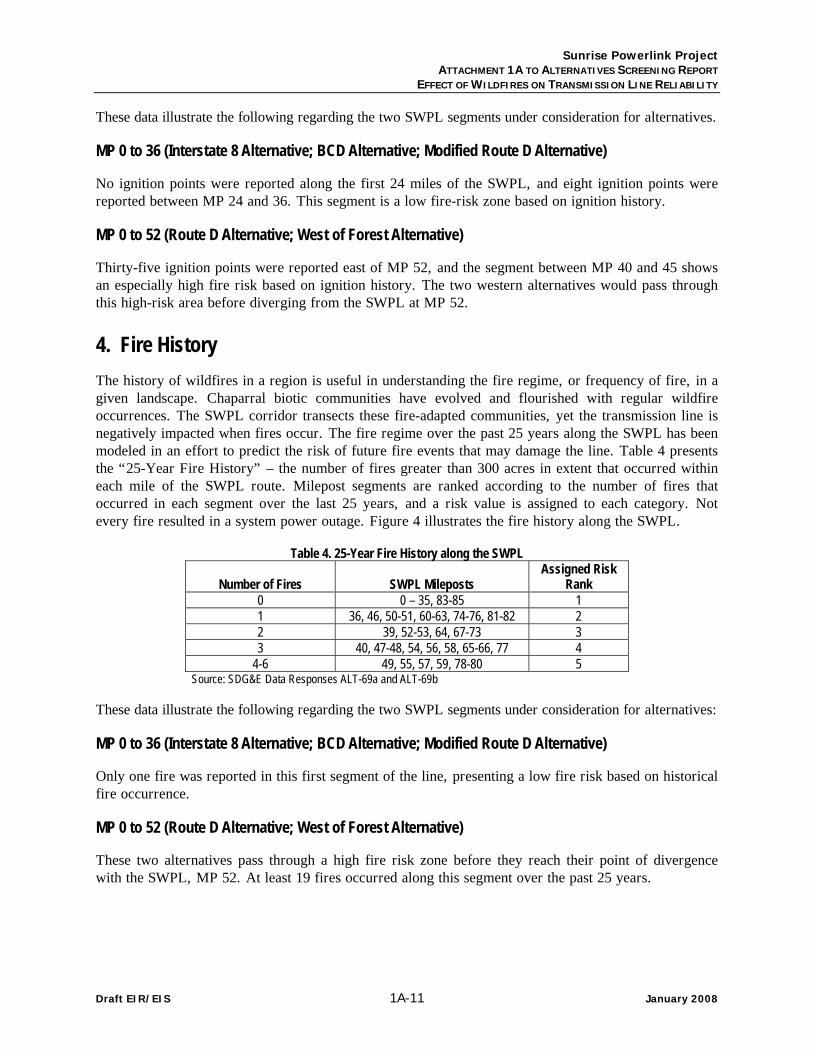
Sunrise Powerlink Project ATTACHMENT 1A TO ALTERNATIVES SCREENING REPORT
EFFECT OF WILDFIRES ON TRANSMISSION LINE RELIABILITY
Draft EIR/EIS 1A-11 January 2008
These data illustrate the following regarding the two SWPL segments under consideration for alternatives.
MP 0 to 36 (Interstate 8 Alternative; BCD Alternative; Modified Route D Alternative)
No ignition points were reported along the first 24 miles of the SWPL, and eight ignition points were reported between MP 24 and 36. This segment is a low fire-risk zone based on ignition history.
MP 0 to 52 (Route D Alternative; West of Forest Alternative)
Thirty-five ignition points were reported east of MP 52, and the segment between MP 40 and 45 shows an especially high fire risk based on ignition history. The two western alternatives would pass through this high-risk area before diverging from the SWPL at MP 52.
4. Fire History The history of wildfires in a region is useful in understanding the fire regime, or frequency of fire, in a given landscape. Chaparral biotic communities have evolved and flourished with regular wildfire occurrences. The SWPL corridor transects these fire-adapted communities, yet the transmission line is negatively impacted when fires occur. The fire regime over the past 25 years along the SWPL has been modeled in an effort to predict the risk of future fire events that may damage the line. Table 4 presents the “25-Year Fire History” – the number of fires greater than 300 acres in extent that occurred within each mile of the SWPL route. Milepost segments are ranked according to the number of fires that occurred in each segment over the last 25 years, and a risk value is assigned to each category. Not every fire resulted in a system power outage. Figure 4 illustrates the fire history along the SWPL.
Table 4. 25-Year Fire History along the SWPL
Number of Fires SWPL Mileposts Assigned Risk
Rank 0 0 – 35, 83-85 1 1 36, 46, 50-51, 60-63, 74-76, 81-82 2 2 39, 52-53, 64, 67-73 3 3 40, 47-48, 54, 56, 58, 65-66, 77 4
4-6 49, 55, 57, 59, 78-80 5 Source: SDG&E Data Responses ALT-69a and ALT-69b
These data illustrate the following regarding the two SWPL segments under consideration for alternatives:
MP 0 to 36 (Interstate 8 Alternative; BCD Alternative; Modified Route D Alternative)
Only one fire was reported in this first segment of the line, presenting a low fire risk based on historical fire occurrence.
MP 0 to 52 (Route D Alternative; West of Forest Alternative)
These two alternatives pass through a high fire risk zone before they reach their point of divergence with the SWPL, MP 52. At least 19 fires occurred along this segment over the past 25 years.
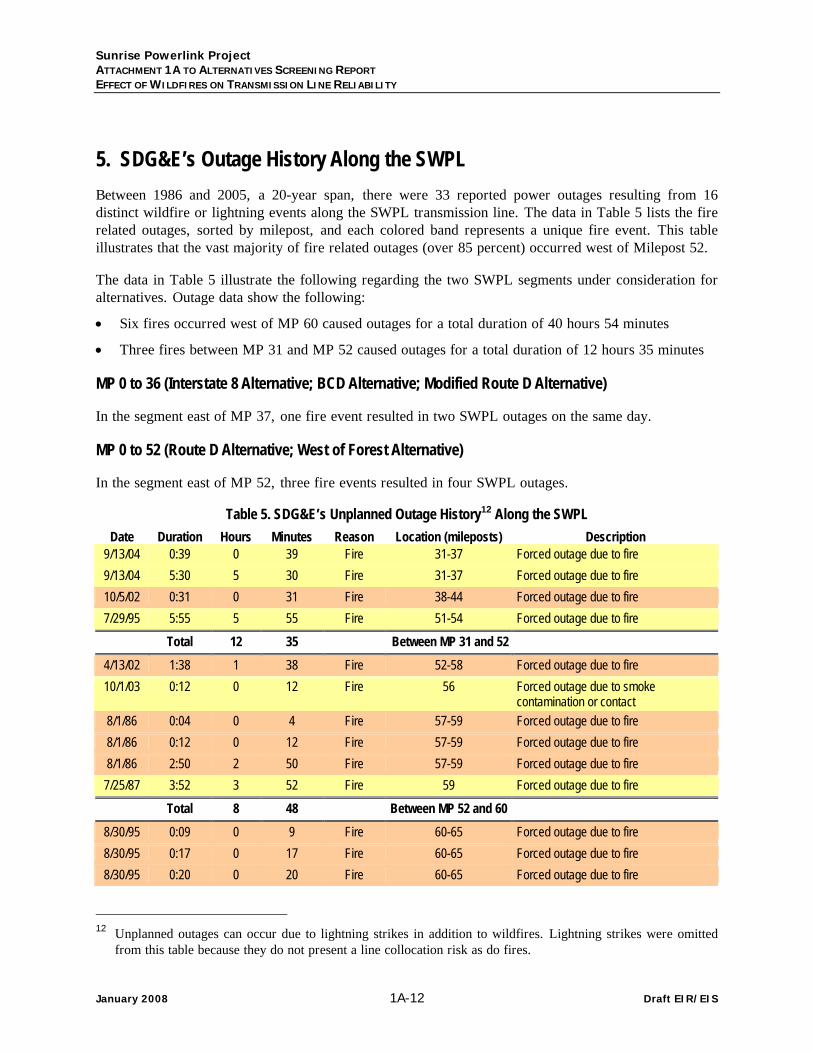
Sunrise Powerlink Project ATTACHMENT 1A TO ALTERNATIVES SCREENING REPORT EFFECT OF WILDFIRES ON TRANSMISSION LINE RELIABILITY
January 2008 1A-12 Draft EIR/EIS
5. SDG&E’s Outage History Along the SWPL Between 1986 and 2005, a 20-year span, there were 33 reported power outages resulting from 16 distinct wildfire or lightning events along the SWPL transmission line. The data in Table 5 lists the fire related outages, sorted by milepost, and each colored band represents a unique fire event. This table illustrates that the vast majority of fire related outages (over 85 percent) occurred west of Milepost 52.
The data in Table 5 illustrate the following regarding the two SWPL segments under consideration for alternatives. Outage data show the following:
• Six fires occurred west of MP 60 caused outages for a total duration of 40 hours 54 minutes
• Three fires between MP 31 and MP 52 caused outages for a total duration of 12 hours 35 minutes
MP 0 to 36 (Interstate 8 Alternative; BCD Alternative; Modified Route D Alternative)
In the segment east of MP 37, one fire event resulted in two SWPL outages on the same day.
MP 0 to 52 (Route D Alternative; West of Forest Alternative)
In the segment east of MP 52, three fire events resulted in four SWPL outages.
Table 5. SDG&E’s Unplanned Outage History12 Along the SWPL
Date Duration Hours Minutes Reason Location (mileposts) Description 9/13/04 0:39 0 39 Fire 31-37 Forced outage due to fire 9/13/04 5:30 5 30 Fire 31-37 Forced outage due to fire 10/5/02 0:31 0 31 Fire 38-44 Forced outage due to fire 7/29/95 5:55 5 55 Fire 51-54 Forced outage due to fire
Total 12 35 Between MP 31 and 52
4/13/02 1:38 1 38 Fire 52-58 Forced outage due to fire 10/1/03 0:12 0 12 Fire 56 Forced outage due to smoke
contamination or contact 8/1/86 0:04 0 4 Fire 57-59 Forced outage due to fire 8/1/86 0:12 0 12 Fire 57-59 Forced outage due to fire 8/1/86 2:50 2 50 Fire 57-59 Forced outage due to fire 7/25/87 3:52 3 52 Fire 59 Forced outage due to fire
Total 8 48 Between MP 52 and 60 8/30/95 0:09 0 9 Fire 60-65 Forced outage due to fire 8/30/95 0:17 0 17 Fire 60-65 Forced outage due to fire 8/30/95 0:20 0 20 Fire 60-65 Forced outage due to fire
12 Unplanned outages can occur due to lightning strikes in addition to wildfires. Lightning strikes were omitted
from this table because they do not present a line collocation risk as do fires.
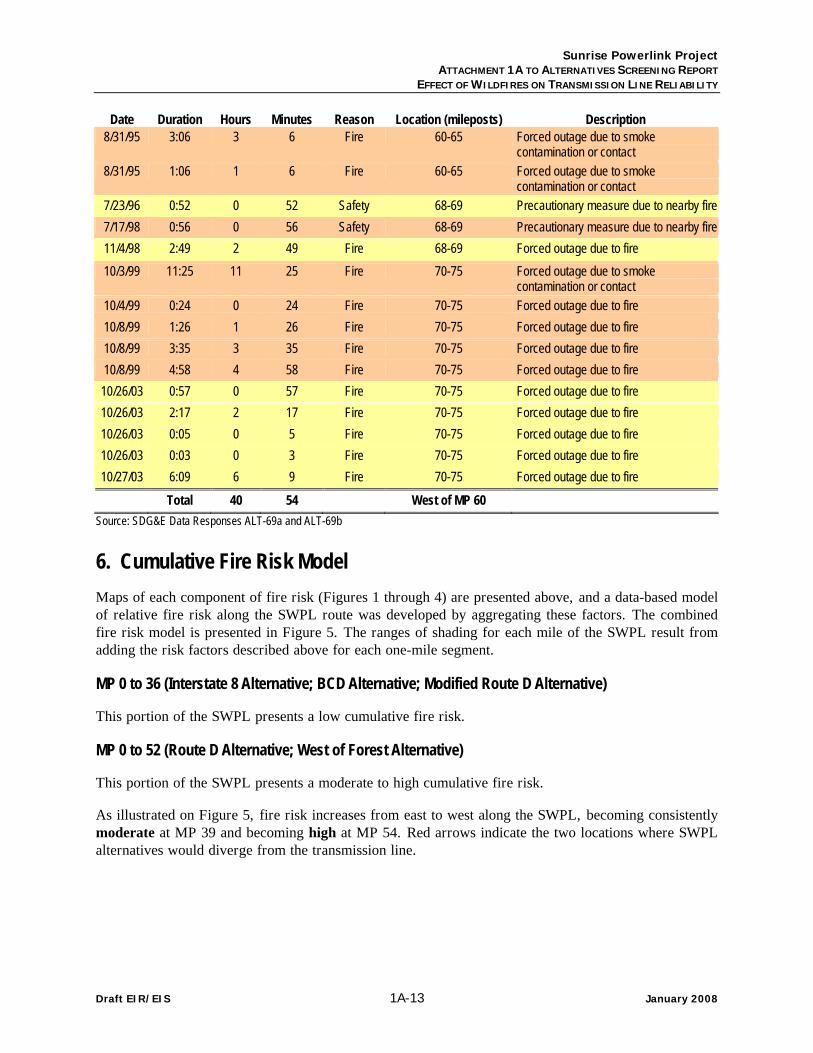
Sunrise Powerlink Project ATTACHMENT 1A TO ALTERNATIVES SCREENING REPORT
EFFECT OF WILDFIRES ON TRANSMISSION LINE RELIABILITY
Draft EIR/EIS 1A-13 January 2008
Date Duration Hours Minutes Reason Location (mileposts) Description 8/31/95 3:06 3 6 Fire 60-65 Forced outage due to smoke
contamination or contact 8/31/95 1:06 1 6 Fire 60-65 Forced outage due to smoke
contamination or contact 7/23/96 0:52 0 52 Safety 68-69 Precautionary measure due to nearby fire 7/17/98 0:56 0 56 Safety 68-69 Precautionary measure due to nearby fire 11/4/98 2:49 2 49 Fire 68-69 Forced outage due to fire 10/3/99 11:25 11 25 Fire 70-75 Forced outage due to smoke
contamination or contact 10/4/99 0:24 0 24 Fire 70-75 Forced outage due to fire 10/8/99 1:26 1 26 Fire 70-75 Forced outage due to fire 10/8/99 3:35 3 35 Fire 70-75 Forced outage due to fire 10/8/99 4:58 4 58 Fire 70-75 Forced outage due to fire 10/26/03 0:57 0 57 Fire 70-75 Forced outage due to fire 10/26/03 2:17 2 17 Fire 70-75 Forced outage due to fire 10/26/03 0:05 0 5 Fire 70-75 Forced outage due to fire 10/26/03 0:03 0 3 Fire 70-75 Forced outage due to fire 10/27/03 6:09 6 9 Fire 70-75 Forced outage due to fire
Total 40 54 West of MP 60 Source: SDG&E Data Responses ALT-69a and ALT-69b
6. Cumulative Fire Risk Model Maps of each component of fire risk (Figures 1 through 4) are presented above, and a data-based model of relative fire risk along the SWPL route was developed by aggregating these factors. The combined fire risk model is presented in Figure 5. The ranges of shading for each mile of the SWPL result from adding the risk factors described above for each one-mile segment.
MP 0 to 36 (Interstate 8 Alternative; BCD Alternative; Modified Route D Alternative)
This portion of the SWPL presents a low cumulative fire risk.
MP 0 to 52 (Route D Alternative; West of Forest Alternative)
This portion of the SWPL presents a moderate to high cumulative fire risk.
As illustrated on Figure 5, fire risk increases from east to west along the SWPL, becoming consistently moderate at MP 39 and becoming high at MP 54. Red arrows indicate the two locations where SWPL alternatives would diverge from the transmission line.

Sunrise Powerlink Project ATTACHMENT 1A TO ALTERNATIVES SCREENING REPORT EFFECT OF WILDFIRES ON TRANSMISSION LINE RELIABILITY
January 2008 1A-14 Draft EIR/EIS
This page intentionally blank.
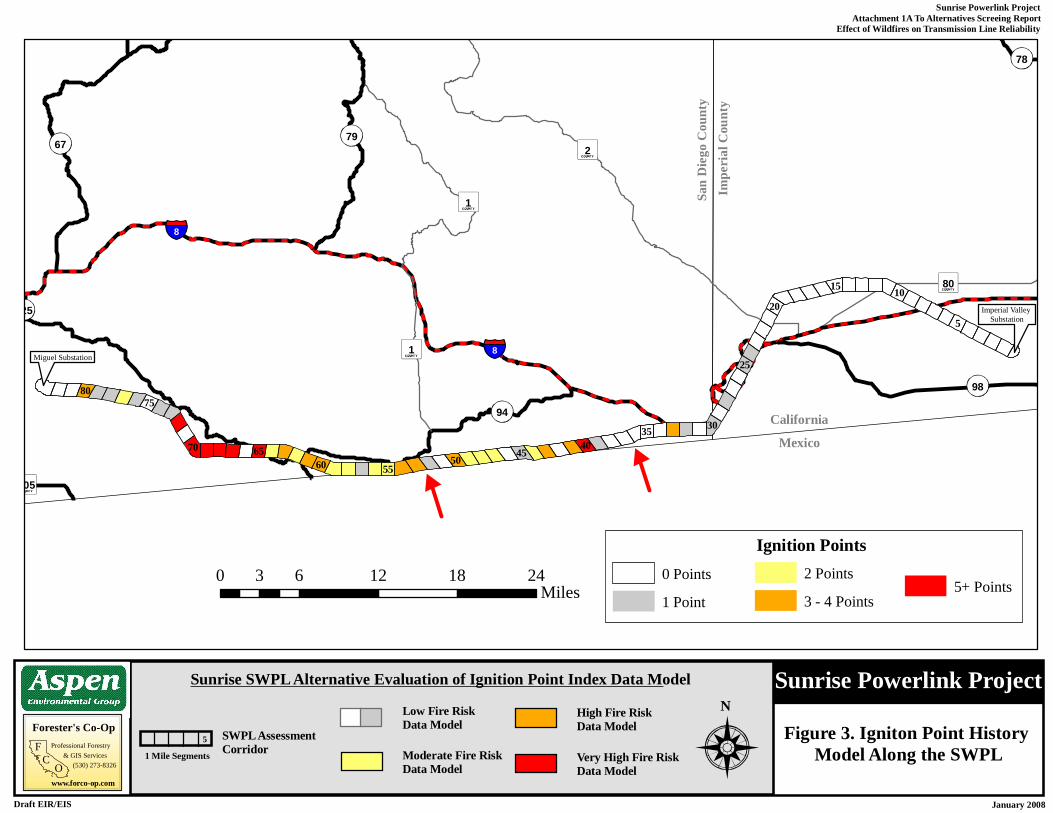
Sunrise Powerlink Project Attachment 1A To Alternatives Screeing ReportEffect of Wildfires on Transmission Line Reliability
January 2008Draft EIR/EIS
Sunrise Powerlink ProjectFigure 3. Igniton Point History
Model Along the SWPL
NForester's Co-Op
Professional ForestryFC
O& GIS Services
(530) 273-8326
www.forco-op.com
Moderate Fire Risk Data Model
Low Fire Risk Data ModelSWPL Assessment
Corridor1 Mile Segments5
High Fire Risk Data Model
Very High Fire Risk Data Model
Sunrise SWPL Alternative Evaluation of Ignition Point Index Data Model
0 6 12 18 243Miles
Impe
rial C
ounty
San D
iego C
ounty
MexicoCalifornia
8
8
80
1
905
2
1
98
67
125
94
78
79
5
6535
5570
30
45
1520
10
60 50
75
25
40
80
Ignition Points0 Points
1 Point
2 Points
3 - 4 Points5+ Points
Miguel Substation
Imperial Valley Substation
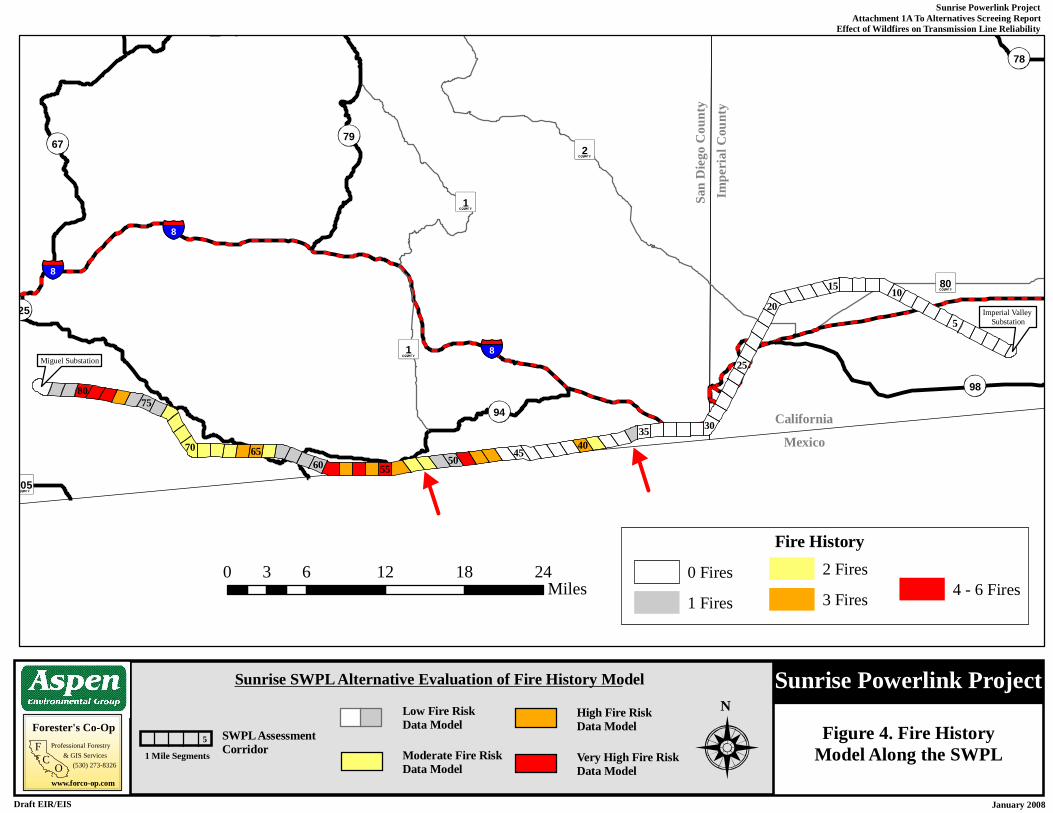
Sunrise Powerlink Project Attachment 1A To Alternatives Screeing ReportEffect of Wildfires on Transmission Line Reliability
January 2008Draft EIR/EIS
Sunrise Powerlink ProjectFigure 4. Fire History
Model Along the SWPL
NForester's Co-Op
Professional ForestryFC
O& GIS Services
(530) 273-8326
www.forco-op.com
Moderate Fire Risk Data Model
Low Fire Risk Data ModelSWPL Assessment
Corridor1 Mile Segments5
High Fire Risk Data Model
Very High Fire Risk Data Model
Sunrise SWPL Alternative Evaluation of Fire History Model
0 6 12 18 243Miles
Impe
rial C
ounty
San D
iego C
ounty
MexicoCalifornia
8
8
8
80
1
905
1
2
98
67
125
94
78
79
5
6535
5570
30
45
1520
10
60 50
75
25
40
80
Fire History
1 Fires
2 Fires
3 Fires 4 - 6 Fires0 Fires
Miguel Substation
Imperial Valley Substation
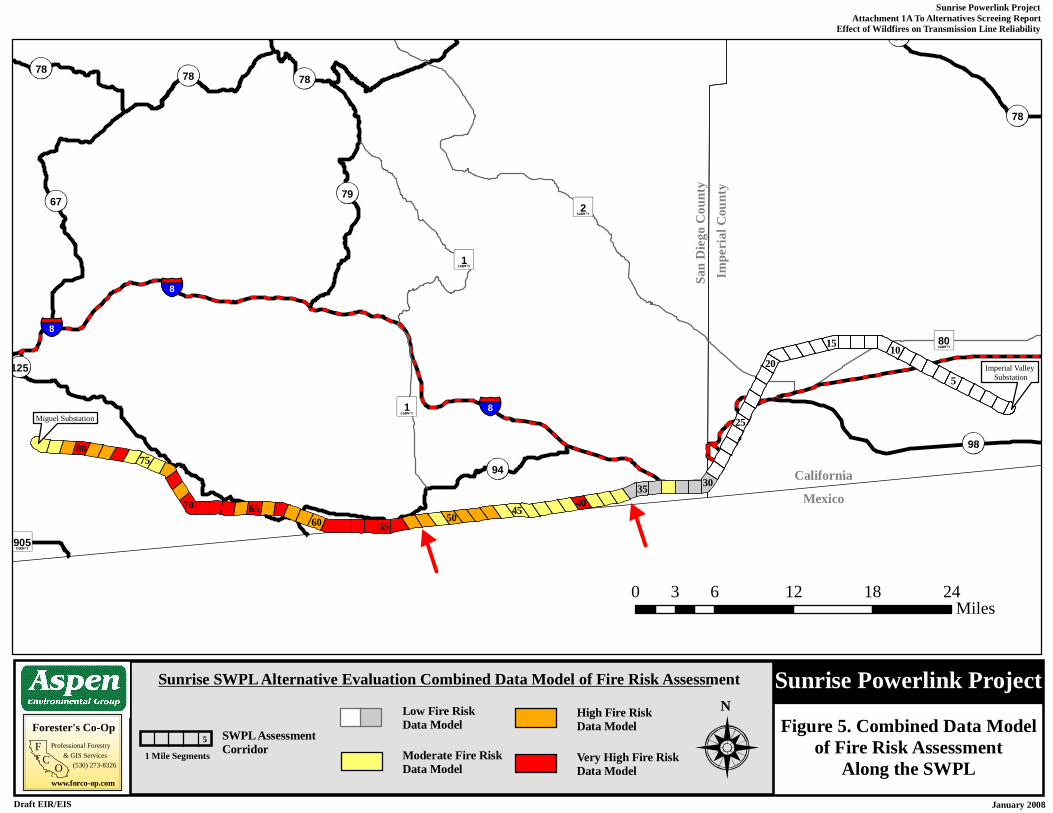
Sunrise Powerlink Project Attachment 1A To Alternatives Screeing ReportEffect of Wildfires on Transmission Line Reliability
January 2008Draft EIR/EIS
Sunrise Powerlink ProjectFigure 5. Combined Data Model
of Fire Risk Assessment Along the SWPL
NForester's Co-Op
Professional ForestryFC
O& GIS Services
(530) 273-8326
www.forco-op.com
Moderate Fire Risk Data Model
Low Fire Risk Data ModelSWPL Assessment
Corridor1 Mile Segments5
High Fire Risk Data Model
Very High Fire Risk Data Model
Sunrise SWPL Alternative Evaluation Combined Data Model of Fire Risk Assessment
8
8
8
80
1
905
1
2
98
67
78
125
78
94
79
78
86
78
5
6535
5570
30
45
1520
10
60 50
75
25
40
80
0 6 12 18 243Miles
Impe
rial C
ounty
San D
iego C
ounty
MexicoCalifornia
Miguel Substation
Imperial Valley Substation

Sunrise Powerlink Project ATTACHMENT 1A TO ALTERNATIVES SCREENING REPORT EFFECT OF WILDFIRES ON TRANSMISSION LINE RELIABILITY
January 2008 1A-18 Draft EIR/EIS
This page intentionally blank.
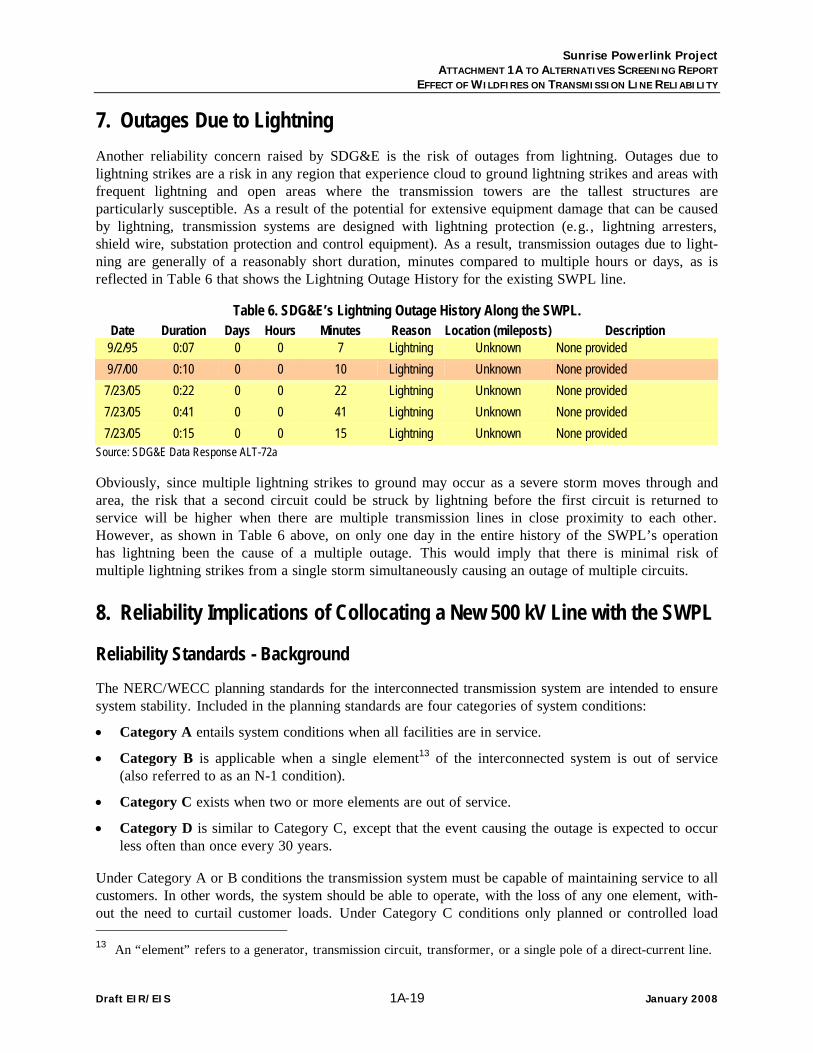
Sunrise Powerlink Project ATTACHMENT 1A TO ALTERNATIVES SCREENING REPORT
EFFECT OF WILDFIRES ON TRANSMISSION LINE RELIABILITY
Draft EIR/EIS 1A-19 January 2008
7. Outages Due to Lightning Another reliability concern raised by SDG&E is the risk of outages from lightning. Outages due to lightning strikes are a risk in any region that experience cloud to ground lightning strikes and areas with frequent lightning and open areas where the transmission towers are the tallest structures are particularly susceptible. As a result of the potential for extensive equipment damage that can be caused by lightning, transmission systems are designed with lightning protection (e.g., lightning arresters, shield wire, substation protection and control equipment). As a result, transmission outages due to light-ning are generally of a reasonably short duration, minutes compared to multiple hours or days, as is reflected in Table 6 that shows the Lightning Outage History for the existing SWPL line.
Table 6. SDG&E’s Lightning Outage History Along the SWPL. Date Duration Days Hours Minutes Reason Location (mileposts) Description
9/2/95 0:07 0 0 7 Lightning Unknown None provided 9/7/00 0:10 0 0 10 Lightning Unknown None provided 7/23/05 0:22 0 0 22 Lightning Unknown None provided 7/23/05 0:41 0 0 41 Lightning Unknown None provided 7/23/05 0:15 0 0 15 Lightning Unknown None provided
Source: SDG&E Data Response ALT-72a
Obviously, since multiple lightning strikes to ground may occur as a severe storm moves through and area, the risk that a second circuit could be struck by lightning before the first circuit is returned to service will be higher when there are multiple transmission lines in close proximity to each other. However, as shown in Table 6 above, on only one day in the entire history of the SWPL’s operation has lightning been the cause of a multiple outage. This would imply that there is minimal risk of multiple lightning strikes from a single storm simultaneously causing an outage of multiple circuits.
8. Reliability Implications of Collocating a New 500 kV Line with the SWPL
Reliability Standards - Background The NERC/WECC planning standards for the interconnected transmission system are intended to ensure system stability. Included in the planning standards are four categories of system conditions:
• Category A entails system conditions when all facilities are in service.
• Category B is applicable when a single element13 of the interconnected system is out of service (also referred to as an N-1 condition).
• Category C exists when two or more elements are out of service.
• Category D is similar to Category C, except that the event causing the outage is expected to occur less often than once every 30 years.
Under Category A or B conditions the transmission system must be capable of maintaining service to all customers. In other words, the system should be able to operate, with the loss of any one element, with-out the need to curtail customer loads. Under Category C conditions only planned or controlled load 13 An “element” refers to a generator, transmission circuit, transformer, or a single pole of a direct-current line.
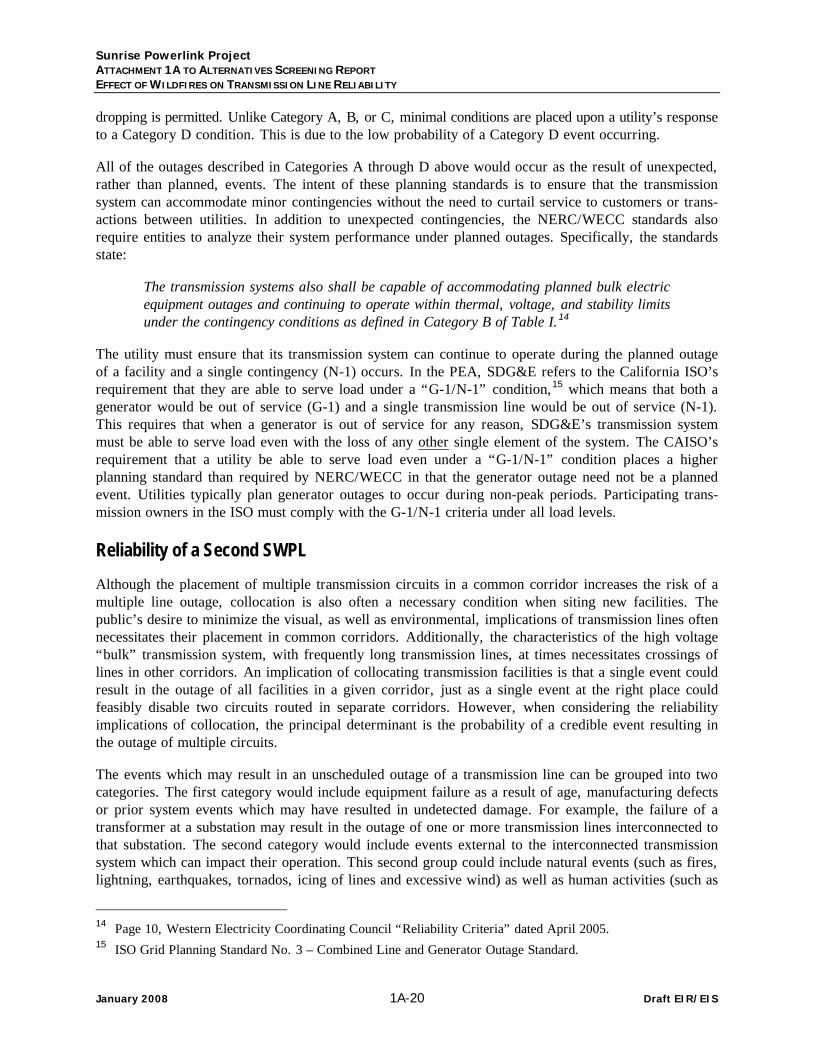
Sunrise Powerlink Project ATTACHMENT 1A TO ALTERNATIVES SCREENING REPORT EFFECT OF WILDFIRES ON TRANSMISSION LINE RELIABILITY
January 2008 1A-20 Draft EIR/EIS
dropping is permitted. Unlike Category A, B, or C, minimal conditions are placed upon a utility’s response to a Category D condition. This is due to the low probability of a Category D event occurring.
All of the outages described in Categories A through D above would occur as the result of unexpected, rather than planned, events. The intent of these planning standards is to ensure that the transmission system can accommodate minor contingencies without the need to curtail service to customers or trans-actions between utilities. In addition to unexpected contingencies, the NERC/WECC standards also require entities to analyze their system performance under planned outages. Specifically, the standards state:
The transmission systems also shall be capable of accommodating planned bulk electric equipment outages and continuing to operate within thermal, voltage, and stability limits under the contingency conditions as defined in Category B of Table I.14
The utility must ensure that its transmission system can continue to operate during the planned outage of a facility and a single contingency (N-1) occurs. In the PEA, SDG&E refers to the California ISO’s requirement that they are able to serve load under a “G-1/N-1” condition,15 which means that both a generator would be out of service (G-1) and a single transmission line would be out of service (N-1). This requires that when a generator is out of service for any reason, SDG&E’s transmission system must be able to serve load even with the loss of any other single element of the system. The CAISO’s requirement that a utility be able to serve load even under a “G-1/N-1” condition places a higher planning standard than required by NERC/WECC in that the generator outage need not be a planned event. Utilities typically plan generator outages to occur during non-peak periods. Participating trans-mission owners in the ISO must comply with the G-1/N-1 criteria under all load levels.
Reliability of a Second SWPL Although the placement of multiple transmission circuits in a common corridor increases the risk of a multiple line outage, collocation is also often a necessary condition when siting new facilities. The public’s desire to minimize the visual, as well as environmental, implications of transmission lines often necessitates their placement in common corridors. Additionally, the characteristics of the high voltage “bulk” transmission system, with frequently long transmission lines, at times necessitates crossings of lines in other corridors. An implication of collocating transmission facilities is that a single event could result in the outage of all facilities in a given corridor, just as a single event at the right place could feasibly disable two circuits routed in separate corridors. However, when considering the reliability implications of collocation, the principal determinant is the probability of a credible event resulting in the outage of multiple circuits.
The events which may result in an unscheduled outage of a transmission line can be grouped into two categories. The first category would include equipment failure as a result of age, manufacturing defects or prior system events which may have resulted in undetected damage. For example, the failure of a transformer at a substation may result in the outage of one or more transmission lines interconnected to that substation. The second category would include events external to the interconnected transmission system which can impact their operation. This second group could include natural events (such as fires, lightning, earthquakes, tornados, icing of lines and excessive wind) as well as human activities (such as
14 Page 10, Western Electricity Coordinating Council “Reliability Criteria” dated April 2005. 15 ISO Grid Planning Standard No. 3 – Combined Line and Generator Outage Standard.
Sunrise Powerlink Project ATTACHMENT 1A TO ALTERNATIVES SCREENING REPORT
EFFECT OF WILDFIRES ON TRANSMISSION LINE RELIABILITY
Draft EIR/EIS 1A-21 January 2008
planes, cars or vandalism). The risks of outages, as a result of events included in the first category, are independent of whether a line is collocated with another facility. In July of 2004 a fire at the Westwing substation, in Phoenix, Arizona, caused an outage of multiple transmission lines. Included in this outage were the collocated Palo Verde-Westwing 500 kV lines. The relevance of this example is that the transmission lines experienced a simultaneous outage as a result of their interconnection to a common substation, not because they shared a common corridor. It is the events included in the second category which pose an increased risk of outage due to the existence of multiple facilities in a common corridor.
Regionally, there are certain events with a higher risk of a multiple circuit outage. One of the risks for other areas of California, outages or damage due to icing of the lines, is less of a risk in San Diego County due to its southern location. The opposite, conditions resulting from heat, can be a more significant risk in this region. Transmission conductors sag between towers and the sag will increase with heat generated from a combination of current flow and ambient air temperature, a condition frequently experienced in hot summer months. Another reliability concern can result when tower structures are spaced too close together. It is possible for events such as high wind to cause the conductors of one circuit to touch those of the adjacent circuit on a separate tower. Likewise, it is possible when tower structures parallel each other too closely that the collapsing of a single tower (e.g. vandalism, major vehicle accident) can result in that tower falling into and disabling the other parallel tower line.
Human activity can also result in multiple circuit outages. Events such as an airplane flying into the corridor could also pose a risk of a multiple circuit outage as it could cut through the conductors of adjacent circuits or catch on a conductor carrying it across to the adjacent circuit. The placement of multiple circuits in close proximity could increase the potential for a vandal to simultaneously damage more than one circuit, but this could also be coordinated regardless of whether the circuits share a com-mon corridor. Most of these events are “planned for” in the design of the transmission lines. Transmis-sion circuits are designed to take into account the sag of the conductor under various transmission circuit loading and ambient temperature conditions. Spacing between circuits, which exceeds the height of the transmission towers, can limit the risk of one tower falling into another. In vehicle accident prone areas, blockades can be erected to protect tower structures. Locking tower bolts and selected insulator material, for example, can be used to reduce vandalism damage while maintenance procedures, such as tree trimming, can be strictly adhered to, and devices can be installed on transmission lines to make them more visible to aircraft in high risk areas (such as road and river crossings).
When placing multiple circuits in a common corridor proper planning can mitigate most of the credible contingencies which could cause a multiple line outage. When credible contingencies cannot be miti-gated California ISO, WECC and NERC planning standards require an evaluation of the probability that the event will occur. (The implications of this probability analysis are discussed later in this section.) One common response to a credible contingency is the establishment of what is called a Special Protection System or Scheme (SPS).
An SPS establishes a specific response to a specific system contingency. Its intent is to maintain the stability and integrity of the interconnected transmission system when the specific system event occurs. Utilities typically rely on an SPS as an interim measure until upgrades/additions/modifications can be completed or when regulations or economics dictate that additional system upgrades would not be prudent. The establishment and use of an SPS is also an explicitly accepted procedure under the Cali-
Sunrise Powerlink Project ATTACHMENT 1A TO ALTERNATIVES SCREENING REPORT EFFECT OF WILDFIRES ON TRANSMISSION LINE RELIABILITY
January 2008 1A-22 Draft EIR/EIS
fornia ISO’s Planning Standards.16 Although the ISO’s planning standards reference generator inter-connections,17 their application applies equally to transmission line outages. If the outage occurs on a transmission line used to import generation into a load pocket it is common for the SPS to include specified amounts of load dropping. Although undesirable, planned load dropping can minimize the implications of a transmission line outage. Under certain circumstances the use of an SPS, which includes load dropping, may be a more publicly acceptable response by a utility when compared to the implications of siting all transmission facilities in separate corridors.
When considering San Diego County, the risk of dual outages in a common corridor is likely highest due to earthquake (i.e., if the corridor transcends a fault zone), damage from high wind, fire and light-ning. In many cases impact of the events can be mitigated through prudent engineering and spacing. Towers are typically designed to withstand the level of high winds historically experienced in a given region. Structures in fault zones can also be designed to withstand earthquakes of varying magnitude. Adequate spacing (in excess of the tower height) can minimize the potential for one circuit to affect the operation of an adjacent circuit.
SDG&E has expressed significant concerns regarding the potential collocation of a second transmission line with the existing Southwest Powerlink (SWPL). Of primary concern to SDG&E is the potential for a wildfire to cause an outage of all facilities in the SWPL corridor. Specifically, in Section 3.3.1.2 of the Sunrise PEA it states:
Normally, the probability of a double line outage would be quite small so the frequency with which load drop would be needed would likewise be small. However, the SWPL line transverses forest lands that are highly susceptible to wild fires. Based on recent history, the majority of outages on the SWPL line have been due to fires and these fires typically occur during the summer and autumn season.
In other documents related to the Sunrise CPCN process, SDG&E has also expressed concerns related to the potential for a double line outage as a result of lightning.
With regards to collocation of the Sunrise project with a portion of the existing Southwest Powerlink, the question is; Under which contingency condition would an outage of both transmission circuits be classified?18 As described in the previous sections, southern San Diego County is an area in which wildfires are the most likely cause of a transmission line outage. The frequency of fire would determine the relevant reliability criterion for a second SWPL, defined as follows:
• If a fire that resulted in an outage of the collocated circuits could be expected to occur with a frequency of greater than once in every three years then the outage would be classified as an “N-1” and fall within the Category B criteria. This would mean that the utility’s transmission system must continue to operate without the need to drop any load.
• If the event were expected to occur at a frequency between one in three to one in thirty years then it would be classified as an “N-2” and fall within the Category C classification. Under Category C a
16 California ISO Planning Standards dated February 7, 2002. 17 Section III – ISO Grid Planning Guides for New Generator Special Protection Systems. 18 At the CPUC Technical Workshop held in San Diego on February 2, 2007, an ISO Lead Regional Transmis-
sion Engineer acknowledged that the outage of two transmission elements located in a common corridor would be deemed an “N-2.” This means the outage of both lines would not be subject to the ISO’s G-1/N-1 requirements.
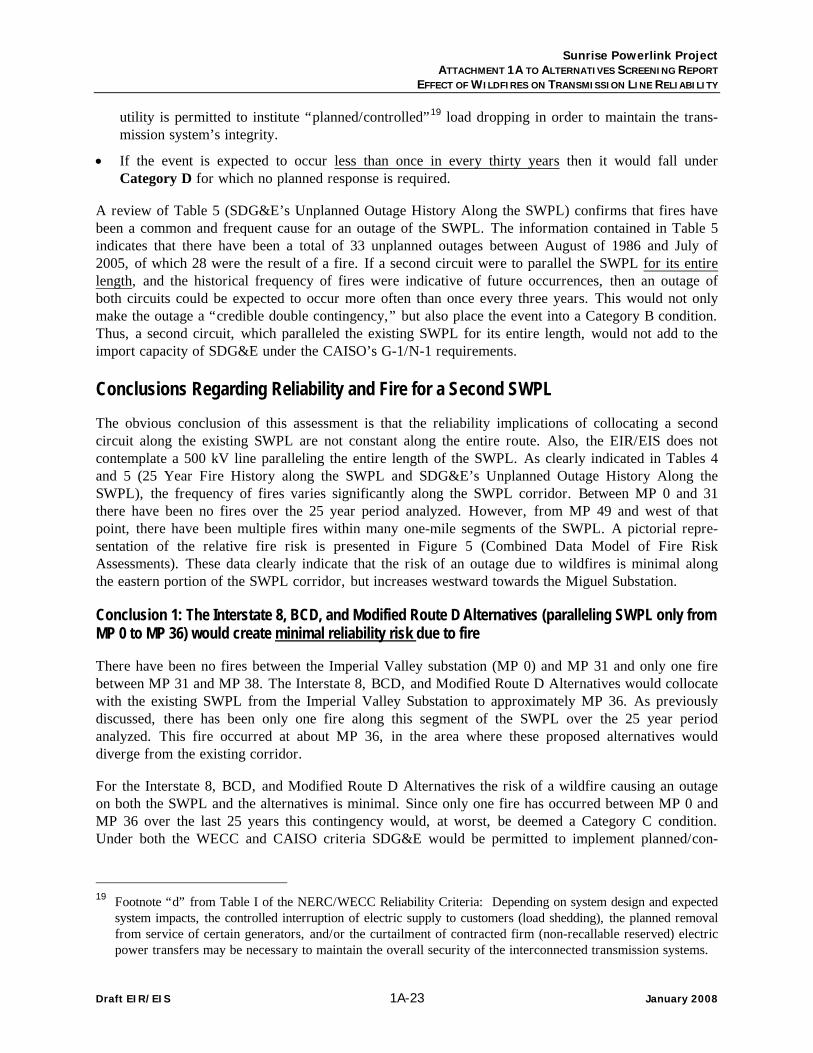
Sunrise Powerlink Project ATTACHMENT 1A TO ALTERNATIVES SCREENING REPORT
EFFECT OF WILDFIRES ON TRANSMISSION LINE RELIABILITY
Draft EIR/EIS 1A-23 January 2008
utility is permitted to institute “planned/controlled”19 load dropping in order to maintain the trans-mission system’s integrity.
• If the event is expected to occur less than once in every thirty years then it would fall under Category D for which no planned response is required.
A review of Table 5 (SDG&E’s Unplanned Outage History Along the SWPL) confirms that fires have been a common and frequent cause for an outage of the SWPL. The information contained in Table 5 indicates that there have been a total of 33 unplanned outages between August of 1986 and July of 2005, of which 28 were the result of a fire. If a second circuit were to parallel the SWPL for its entire length, and the historical frequency of fires were indicative of future occurrences, then an outage of both circuits could be expected to occur more often than once every three years. This would not only make the outage a “credible double contingency,” but also place the event into a Category B condition. Thus, a second circuit, which paralleled the existing SWPL for its entire length, would not add to the import capacity of SDG&E under the CAISO’s G-1/N-1 requirements.
Conclusions Regarding Reliability and Fire for a Second SWPL The obvious conclusion of this assessment is that the reliability implications of collocating a second circuit along the existing SWPL are not constant along the entire route. Also, the EIR/EIS does not contemplate a 500 kV line paralleling the entire length of the SWPL. As clearly indicated in Tables 4 and 5 (25 Year Fire History along the SWPL and SDG&E’s Unplanned Outage History Along the SWPL), the frequency of fires varies significantly along the SWPL corridor. Between MP 0 and 31 there have been no fires over the 25 year period analyzed. However, from MP 49 and west of that point, there have been multiple fires within many one-mile segments of the SWPL. A pictorial repre-sentation of the relative fire risk is presented in Figure 5 (Combined Data Model of Fire Risk Assessments). These data clearly indicate that the risk of an outage due to wildfires is minimal along the eastern portion of the SWPL corridor, but increases westward towards the Miguel Substation.
Conclusion 1: The Interstate 8, BCD, and Modified Route D Alternatives (paralleling SWPL only from MP 0 to MP 36) would create minimal reliability risk due to fire
There have been no fires between the Imperial Valley substation (MP 0) and MP 31 and only one fire between MP 31 and MP 38. The Interstate 8, BCD, and Modified Route D Alternatives would collocate with the existing SWPL from the Imperial Valley Substation to approximately MP 36. As previously discussed, there has been only one fire along this segment of the SWPL over the 25 year period analyzed. This fire occurred at about MP 36, in the area where these proposed alternatives would diverge from the existing corridor.
For the Interstate 8, BCD, and Modified Route D Alternatives the risk of a wildfire causing an outage on both the SWPL and the alternatives is minimal. Since only one fire has occurred between MP 0 and MP 36 over the last 25 years this contingency would, at worst, be deemed a Category C condition. Under both the WECC and CAISO criteria SDG&E would be permitted to implement planned/con-
19 Footnote “d” from Table I of the NERC/WECC Reliability Criteria: Depending on system design and expected
system impacts, the controlled interruption of electric supply to customers (load shedding), the planned removal from service of certain generators, and/or the curtailment of contracted firm (non-recallable reserved) electric power transfers may be necessary to maintain the overall security of the interconnected transmission systems.

Sunrise Powerlink Project ATTACHMENT 1A TO ALTERNATIVES SCREENING REPORT EFFECT OF WILDFIRES ON TRANSMISSION LINE RELIABILITY
January 2008 1A-24 Draft EIR/EIS
trolled load dropping as an appropriate response to this event.20 It could also be argued, by extrapola-tion of the 25 year historical data, that an outage of both the SWPL and Interstate 8, BCD, or Modified Route D Alternatives, caused by a wildfire, could be considered a Category D condition under which no contingency plans would be required.
Therefore, the Interstate 8, BCD, and Modified Route D Alternatives diverging from the SWPL at MP 36 would, at most, pose a minimal reliability risk.
Conclusion 2: The Route D and West of Forest Alternatives (south of Interstate 10) requiring collocation with SWPL for 52 miles would pose a reliability risk due to fire
The other SWPL Alternatives are the Route D and West of Forest Alternatives. These two alternatives would collocate with the SWPL through MP 52. It is clear from the fire risk assessment illustrated on Figure 5 that the risk implications of the additional 16 miles (MP 36 to 52) are significant. Within that segment, two sections (MP 40 and 47-50) have been assigned the second highest risk rank while a majority of the remaining sections pose a moderate fire risk.
For the Route D and West of Forest Alternatives the historical data and fire modeling would imply a reliability concern due to the past frequency of fires and the factors making fires more likely, especially between MPs 39 and 52.
20 ISO Grid Planning Standard No. 4b – New Transmission versus Involuntary Load Interruption Standard.


![[4170]-281unipune.ac.in/university_files/pdf/old_papers/April2012/...importance of Timing and Scheduling of Operations. [4170]-281 1 P.T.O. Seat No. [4170]-281/2 Q.4) Explain the situations](https://img.pdfslide.net/doc/110x75/5af4a3db7f8b9a92718dcf84/4170-of-timing-and-scheduling-of-operations-4170-281-1-pto-seat-no-4170-2812.jpg)