Embed Size (px)
Citation preview

Exhumation of the central Wasatch Mountains, Utah:
2. Thermokinematic model of exhumation, erosion,
and thermochronometer interpretation
Todd A. Ehlers,1,2 Sean D. Willett,3 Phillip A. Armstrong,4 and Davis S. Chapman1
Received 17 December 2001; revised 13 December 2002; accepted 13 December 2002; published 29 March 2003.
[1] The Wasatch fault is a �370 km long normal fault in Utah that marks the boundarybetween the stable Colorado Plateau to the east and the extending Basin and Range tothe west. Understanding the thermokinematic evolution of this fault can provide insightsinto intracontinental extensional tectonics and deformation processes in other rift zones(e.g., East Africa Rift, Transantarctic Mountains). We explore the thermokinematics offootwall exhumation and erosion in the Cottonwood Intrusive Belt of the central WasatchMountains. Emphasis is placed on using low-temperature thermochronometers to quantify(1) the spatial and temporal variability of exhumation and erosion rates, (2) the geometry offootwall tilt, (3) the fault dip angle, and (4) the magnitude and duration of exhumation.These processes are investigated using two-dimensional (2-D) thermal-kinematicmodels coupled with cooling-rate-dependent kinetic models which predict exhumed apatitefission track (AFT) and (U-Th)/He ages. The range of model parameters consideredincludes footwall exhumation and erosion rates at the fault between 0.2 and 2.0 mm yr�1,footwall tilt hinge positions between 15 and 40 km distance from the fault, a single planarnormal fault with dip angles of 45� and 60�, and exhumation magnitudes of up to 15 km atthe fault. Simulations include the formation of a low thermal conductivity sedimentarybasin and erosion of heat-producing layers. Erosion maintains a constant topographicprofile. The kinematic and exhumation history of the Wasatch Mountains isinvestigated by comparing model predicted thermochronometer ages to observed AFT,ZFT, and (U-Th)/He ages. Predicted and observed ages are compared using a reducedchi-square analysis to determine a best fit kinematic model for the Wasatch Mountains. Thepreferred model includes exhumation occurring on either a 45� or 60� dipping fault, afootwall hinge located a minimum of 20–25 km from the fault, and a step decrease(deceleration) in the footwall exhumation rate at the fault from 1.2 to 0.8 mm yr�1 ataround 5 Ma. The model also suggests an exhumation duration of �12 Myr ± 2Myr). INDEX TERMS: 1035 Geochemistry: Geochronology; 8010 Structural Geology: Fractures and
faults; 8015 Structural Geology: Local crustal structure; 8109 Tectonophysics: Continental tectonics—
extensional (0905); 8130 Tectonophysics: Heat generation and transport; KEYWORDS: exhumation, erosion,
normal faults, numerical modeling, heat flow, thermochronometers
Citation: Ehlers, T. A., S. D. Willett, P. A. Armstrong, and D. S. Chapman, Exhumation of the central Wasatch Mountains, Utah:
2. Thermokinematic model of exhumation, erosion, and thermochronometer interpretation, J. Geophys. Res., 108(B3), 2173,
doi:10.1029/2001JB001723, 2003.
1. Introduction
[2] Exhumation is an important geologic process respon-sible for the exposure of rocks and structures at the Earth’s
surface. In extensional tectonic regimes (e.g., Basin andRange province, East African Rift, or TransantarcticMountains) most exhumation occurs in the footwalls ofnormal-fault bounded ranges. Several fundamental scien-tific questions apply to all tectonically active normal-faultbounded ranges, as follows: How fast is footwall exhu-mation? Are there spatial and temporal variations in theexhumation rate? How long has exhumation been active?We address these questions for the central Wasatch Moun-tains, Utah, but our modeling approach is applicable toother normal fault bounded ranges around the world. Inthis study we construct two-dimensional (2-D) thermoki-nematic numerical models of a normal-fault bounded rangeto explore the influence of spatially and temporally vari-
JOURNAL OF GEOPHYSICAL RESEARCH, VOL. 108, NO. B3, 2173, doi:10.1029/2001JB001723, 2003
1Department of Geology and Geophysics, University of Utah, Salt LakeCity, Utah, USA.
2Now at Department of Geological Sciences, University of Michigan,Ann Arbor, Michigan, USA.
3Department of Earth and Space Sciences, University of Washington,Seattle, Washington, USA.
4Department of Geological Sciences, California State University,Fullerton, Fullerton, California, USA.
Copyright 2003 by the American Geophysical Union.0148-0227/03/2001JB001723$09.00
ETG 12 - 1
able exhumation rates, fault dip angles, and the duration ofexhumation inferred from apatite and zircon fission track(AFT, ZFT) and apatite (U-Th)/He ages.[3] The companion paper by Armstrong et al. [2003]
presents the thermochronometer data used in this study,calculates thermal histories from track length modeling, andpresents a structural synthesis for the Cenozoic evolution ofthe Cottonwood Intrusive Belt area of the Wasatch footwallblock. Armstrong et al. [2003] interpret the spatial andelevation variations of thermochronometer ages to representa two-stage tilt and exhumation history in which the locusof tilting and exhumation migrated westward. The first stageof tilt and exhumation occurred in Oligocene to middleMiocene time and primarily affected the middle and easternparts of the range. The second stage began �10–12 Ma andaffected the western 20 km of the range. In this paper, weaddress the thermokinematic evolution of only the secondstage of tilt and exhumation.[4] Other studies have investigated the thermokinematic
effects of exhumation on thermochronometer cooling histor-ies. Stuwe et al. [1994] and Stuwe and Hintermuller [2000]developed analytic expressions for the position of the AFTand apatite (U-Th)/He closure isotherms in the presence oferoding topography. Mancktelow and Grasemann [1997]investigated the effect of transient heat advection and top-ography on vertically exhumed thermochronometer samples.Ehlers et al. [2001] used a 2- D transient thermokinematicmodel of a normal-fault bounded range to compare differ-ences in thermochronometer exhumation rates calculatedfrom 2-D and conventional 1-D thermal models. Severalstudies have used 2-D thermal models of normal faults to
document the effects of erosion and sedimentation rates onthe thermal histories of hanging wall and footwall rocks[Grasemann and Mancktelow, 1993; ter Voorde and Bertotti,1994; Bertotti and ter Voorde, 1994]. Two-dimensionalthermal models, geobarometers and thermochronometers,were used by van Wees et al. [1992] to differentiate betweenpure, simple, and combined pure and simple shear modes ofextension in the Beltic Zone, Spain.[5] Previous studies have demonstrated that several fun-
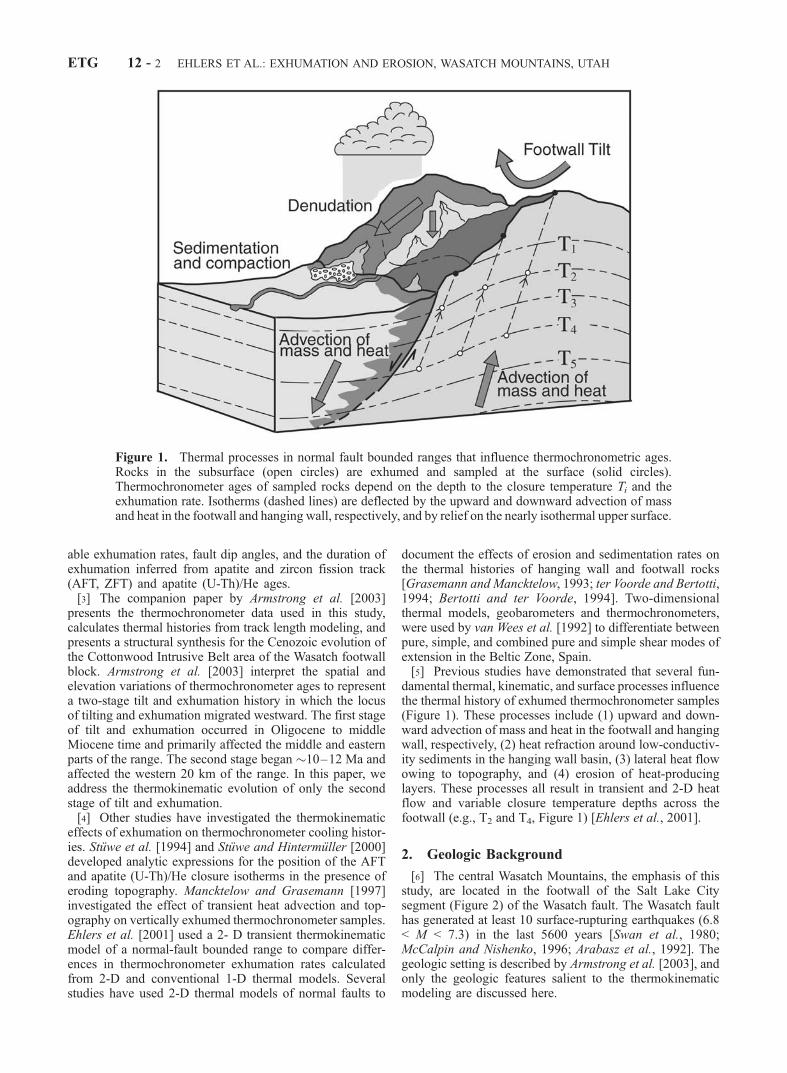
damental thermal, kinematic, and surface processes influencethe thermal history of exhumed thermochronometer samples(Figure 1). These processes include (1) upward and down-ward advection of mass and heat in the footwall and hangingwall, respectively, (2) heat refraction around low-conductiv-ity sediments in the hanging wall basin, (3) lateral heat flowowing to topography, and (4) erosion of heat-producinglayers. These processes all result in transient and 2-D heatflow and variable closure temperature depths across thefootwall (e.g., T2 and T4, Figure 1) [Ehlers et al., 2001].
2. Geologic Background
[6] The central Wasatch Mountains, the emphasis of thisstudy, are located in the footwall of the Salt Lake Citysegment (Figure 2) of the Wasatch fault. The Wasatch faulthas generated at least 10 surface-rupturing earthquakes (6.8< M < 7.3) in the last 5600 years [Swan et al., 1980;McCalpin and Nishenko, 1996; Arabasz et al., 1992]. Thegeologic setting is described by Armstrong et al. [2003], andonly the geologic features salient to the thermokinematicmodeling are discussed here.
Figure 1. Thermal processes in normal fault bounded ranges that influence thermochronometric ages.Rocks in the subsurface (open circles) are exhumed and sampled at the surface (solid circles).Thermochronometer ages of sampled rocks depend on the depth to the closure temperature Ti and theexhumation rate. Isotherms (dashed lines) are deflected by the upward and downward advection of massand heat in the footwall and hanging wall, respectively, and by relief on the nearly isothermal upper surface.
ETG 12 - 2 EHLERS ET AL.: EXHUMATION AND EROSION, WASATCH MOUNTAINS, UTAH

[7] Oligocene age granitoid plutons were intruded intoolder sedimentary strata and are the source of all but onesample dated of Armstrong et al. [2003]. The one othersample came from the Proterozoic Little Willow Formation.Unconsolidated sediments on the hanging wall are esti-mated to be �1.5 km thick based on inversion of gravitydata assuming a simple two layer density structure [Zoback,1983; Radkins, 1990]. The thickness of consolidated hang-ing wall sedimentary rocks is not well determined. Topo-graphic relief between the valley floor and range crest is �2km. Topographic relief between transverse canyons andridges is �1.0–1.5 km.[8] Numerous studies address, with conflicting results,
the magnitude and rate of exhumation of the centralWasatch Mountains (Table 1). Parry and Bruhn [1987]summarized previous estimates of the exhumation whichrange from 1.5 km based on topographic relief [Eardley,1939] to 12 km based on eroded stratigraphic section [King,1878]. Some of these studies are discrepant because they
Figure 2. Central Wasatch Mountains with sample locations for zircon and apatite fission track, and (U-Th)/He ages considered in this study. Data are reported by Armstrong et al. [2003]. Multiplethermochronometer analyses were conducted on the same rock samples for most locations.
Table 1. Previous Estimates of Exhumation Magnitude and Rate
ExhumationMagnitude, km Method Study
12 stratigraphic King [1878]>11 geochemical Parry and Bruhn [1987]3.0–4.6 stratigraphic Crittenden [1964]3.0–4.0 topography, basin fill Gilbert [1928], Hintze [1971],
and Zoback [1983]1.5–3.0 geomorphic Davis [1903], Marsell [1932],
and Eardley [1933, 1939
VerticalExhumationRate, mm/yr Method Study
0.7–0.8a fault-trenching Schwartz andCoppersmith [1984]
0.3–0.5a paleoseismology Machette et al. [1991]0.7 K-Ar, fluid inclusions Parry and Bruhn [1987]0.2–0.8 apatite fission track Evans et al. [1985]
and Kowallis et al. [1990]�0.05a shallow seismic Crone and Harding [1987]
aAssumes the exhumation rate is one-half the net tectonic verticaldisplacement.
EHLERS ET AL.: EXHUMATION AND EROSION, WASATCH MOUNTAINS, UTAH ETG 12 - 3
report surface uplift rather than exhumation. Uncertaintyalso exists in estimates of the exhumation rate. Rates offootwall vertical exhumation span several orders of magni-tude and range between 0.05 mm yr�1 based on shallowseismic imaging of offset Holocene strata [Crone andHarding, 1987] and 0.8 mm yr�1 from K-Ar and AFTthermochronometry [Evans et al., 1985; Kowallis et al.,1990]. Some of the discrepancy in previous exhumation rateestimates (Table 1) may result from differences in thetimescale the methods are sensitive to. For example, pale-oseismology studies using offset markers in fault trenches orshallow seismic studies deduce rates over the timescale ofindividual earthquake ruptures (103 years), whereas thermo-chronometer studies are sensitive to processes on signifi-cantly longer timescales (106–107 years). A primaryobjective of this study is to refine estimates of exhumationrates on million year timescales by integrating new thermo-chronometer data with a thermokinematic model of footwallexhumation.
3. Thermochronometer Data
[9] Zircon and apatite fission track and apatite (U-Th)/Heages have closure temperatures of �240�C, 120�C, and70�C, respectively, thus providing constraints on exhuma-tion histories over this temperature range [Naeser, 1979;Naeser et al., 1989; Parrish, 1983; Yamada et al., 1995;Farley, 2000; Gleadow and Brown, 2000]. Kinetic modelsfor thermal annealing of apatite fission tracks are welldeveloped [Naser and Faul, 1969; Wagner and Reimer,1972; Laslett et al., 1987; Green et al., 1986; Carlson,1990; Crowley et al., 1991], with variations in annealingbehavior arising from compositional variations and crystal-lographic anisotropy [Green et al., 1985; Donelick et al.,1999; Carlson et al., 1999; Ketcham et al., 1999]. Heliumproduced in apatite by the spontaneous decay of 238U, 235U,and 232Th is lost by volume diffusion, thus serving as thebasis for (U-Th)/He dating [Zeitler et al., 1987; Farley etal., 1996; Wolf et al., 1996, 1998; Farley, 2000]. Belowtemperatures of �300�C, the diffusivity of apatite isdescribed by a linear, temperature-dependent Arrheniusrelationship.[10] Armstrong et al. [2003] report new AFT, ZFT, and
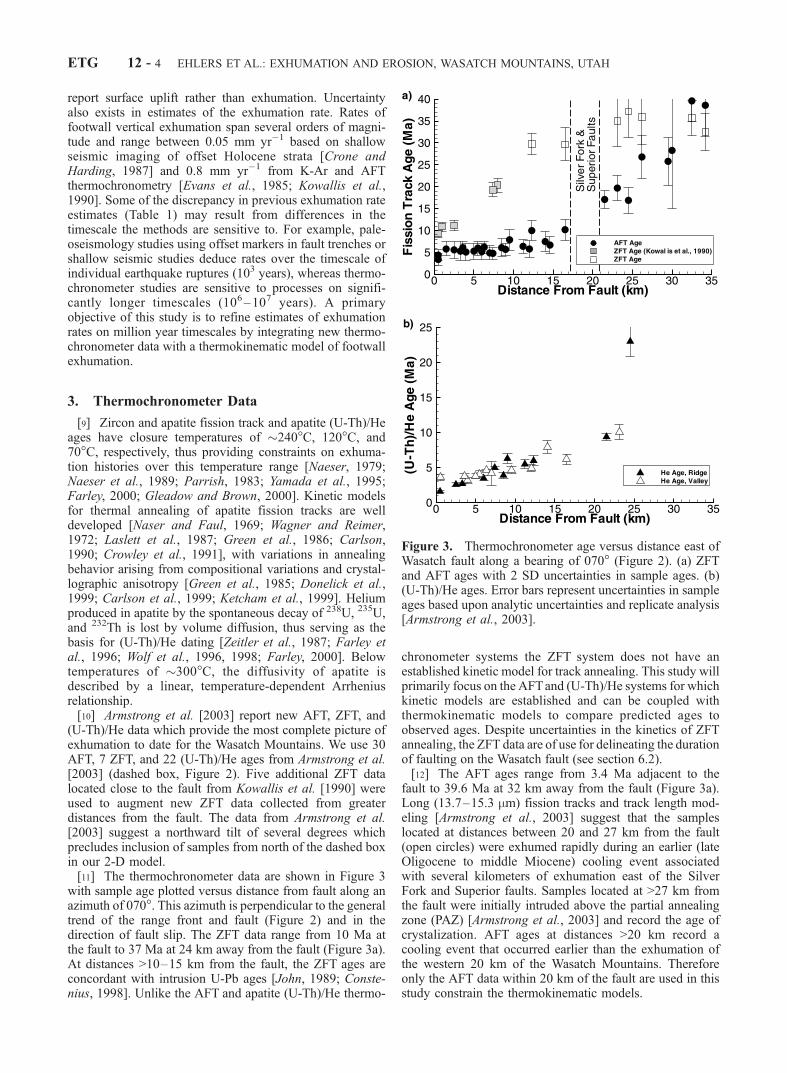
(U-Th)/He data which provide the most complete picture ofexhumation to date for the Wasatch Mountains. We use 30AFT, 7 ZFT, and 22 (U-Th)/He ages from Armstrong et al.[2003] (dashed box, Figure 2). Five additional ZFT datalocated close to the fault from Kowallis et al. [1990] wereused to augment new ZFT data collected from greaterdistances from the fault. The data from Armstrong et al.[2003] suggest a northward tilt of several degrees whichprecludes inclusion of samples from north of the dashed boxin our 2-D model.[11] The thermochronometer data are shown in Figure 3
with sample age plotted versus distance from fault along anazimuth of 070�. This azimuth is perpendicular to the generaltrend of the range front and fault (Figure 2) and in thedirection of fault slip. The ZFT data range from 10 Ma atthe fault to 37 Ma at 24 km away from the fault (Figure 3a).At distances >10–15 km from the fault, the ZFT ages areconcordant with intrusion U-Pb ages [John, 1989; Conste-nius, 1998]. Unlike the AFT and apatite (U-Th)/He thermo-
chronometer systems the ZFT system does not have anestablished kinetic model for track annealing. This study willprimarily focus on the AFTand (U-Th)/He systems for whichkinetic models are established and can be coupled withthermokinematic models to compare predicted ages toobserved ages. Despite uncertainties in the kinetics of ZFTannealing, the ZFT data are of use for delineating the durationof faulting on the Wasatch fault (see section 6.2).[12] The AFT ages range from 3.4 Ma adjacent to the
fault to 39.6 Ma at 32 km away from the fault (Figure 3a).Long (13.7–15.3 mm) fission tracks and track length mod-eling [Armstrong et al., 2003] suggest that the sampleslocated at distances between 20 and 27 km from the fault(open circles) were exhumed rapidly during an earlier (lateOligocene to middle Miocene) cooling event associatedwith several kilometers of exhumation east of the SilverFork and Superior faults. Samples located at >27 km fromthe fault were initially intruded above the partial annealingzone (PAZ) [Armstrong et al., 2003] and record the age ofcrystalization. AFT ages at distances >20 km record acooling event that occurred earlier than the exhumation ofthe western 20 km of the Wasatch Mountains. Thereforeonly the AFT data within 20 km of the fault are used in thisstudy constrain the thermokinematic models.
Figure 3. Thermochronometer age versus distance east ofWasatch fault along a bearing of 070� (Figure 2). (a) ZFTand AFT ages with 2 SD uncertainties in sample ages. (b)(U-Th)/He ages. Error bars represent uncertainties in sampleages based upon analytic uncertainties and replicate analysis[Armstrong et al., 2003].
ETG 12 - 4 EHLERS ET AL.: EXHUMATION AND EROSION, WASATCH MOUNTAINS, UTAH
[13] (U-Th)/He ages are �1.6 Ma adjacent to the Wasatchfault and increase nearly monotonically to 10.1 Ma at 23 kmdistance from the fault (Figure 3b). The increase of (U-Th)/He, AFT, and ZFT ages with distance from the fault isinterpreted to result from footwall tilt such that samplesadjacent to the fault were exhumed from greater depths andfaster than samples at greater distances from the fault. The(U-Th)/He ages of samples collected at similar distancesfrom the fault at ridge versus valley elevations (Figure 3b)typically differ by �1 Myr. This variation may be due toelevation differences at a common distance from theWasatch fault. These elevation-age relationships are inves-tigated for a north-south elevation transect between LittleCottonwood Canyon and Lone Peak (Figure 5b of Arm-strong et al. [2003]). The slope of a best fit line in this age-elevation plot is 1.2 mm yr�1. This change in age withelevation was used to correct (U-Th)/He ages to a commonsample elevation [Armstrong et al., 2003, Figure 5c]. Theelevation correction changes (U-Th)/He ages by <1 Myr, anamount typically within the uncertainties of ages. After thiscorrection the (U-Th)/He ages still vary as a function ofhorizontal distance from the fault, with elevation-relatedchanges being small at any distance from the fault. Thissmall north-south topographic relief effect on (U-Th)/Heages is probably related to the isotherms sensing the top-ography which in turn leads to relatively high elevation-agegradients locally (see section 6.1)[also see Ehlers et al.,2001; Braun, 2002]. However, in this study we emphasizethe longer wavelength variations in sample ages related tomovement of the Wasatch fault. Future work will inves-tigate shorter wavelength variations in sample ages relatedto canyon and ridge topography.
4. The Model
[14] The simplest assumption for thermochronometerinterpretation is that samples are exhumed vertically towarda horizontal surface through a 1-D steady state thermal field.A more realistic assumption in tectonically active regionsis that exhumation trajectories have both vertical andhorizontal components and that the thermal field is tran-sient and multidimensional [e.g., Ehlers et al., 2001; Battet al., 2001; Batt and Brandon, 2001]. The 2-D nature ofthe thermal field surrounding the Wasatch normal fault isdiscussed in detail by Ehlers and Chapman [1999] andEhlers et al. [2001]. There are three components to ourmodel: (1) a thermal model that predicts temperatures as afunction of space, time, and the kinematic velocity field,(2) a kinematic model describing particle motions, and (3)a thermochronometer kinetic model that calculates pre-dicted ages of exhumed rocks. The thermal, kinematic, andkinetic models used in this paper are described in detail insections 4.1–4.3.
4.1. Thermal Model
[15] The background thermal field of the crust is con-trolled primarily by heat flow into the base of the crustand thermophysical properties of the crust (conductivity,heat production, heat capacity). For the central WasatchMountains we assume that 2-D transient heat transferoccurs by conduction and advection of rock in responseto footwall erosion and hanging wall sedimentation. These
thermal processes are described by the advection-diffusionequation:
r KrTð Þrc
� �nrT � @T
@t¼ � A
rc; ð1Þ
where �n is the material velocity, T is temperature, and t istime. K, r, c, and A are the thermal conductivity, density,specific heat, and radiogenic heat production per unitvolume, respectively.[16] Equation (1) is solved in an Eulerian (spatial) refer-
ence frame using the finite difference scheme described byEhlers and Chapman [1999]. A representative topographicprofile perpendicular to the range front (Figure 2) is used forthe top boundary of the model. The topographic profileremains constant throughout simulations by assuming atopographic steady state such that the erosion rate is equalin magnitude to the tectonic rock uplift rate. Our steady statetopography assumption is supported by landform evolutionmodeling studies of normal fault bounded ranges in theBasin and Range that suggest topographic steady state isreached within �2 Myr of the onset of faulting [Densmoreet al., 1998; Allen and Densmore, 2000]. We demonstratelater (section 6.2) that the Wasatch fault has been active forsignificantly longer (12 ± 2 Myr) than this 2 Myr period ofinferred transient topography. Therefore the effects of tran-sient topography on AFT and (U-Th)/He cooling ages mostlikely ended long before closure of AFT and (U-Th)/Hesamples from the Wasatch (Figure 3), and the assumption ofsteady state topography should not influence our interpre-tation of the data.[17] Pleistocene glaciation of the Wasatch Mountains is
the only other erosional process that may have significantlymodified the topography and affected cooling ages. How-ever, glaciation will most likely not influence our interpre-tation of (U-Th)/He cooling ages because (1) the magnitudeof glacial over deepening in Little Cottonwood Canyon,where the samples came from, does not appear to besignificant compared to neighboring canyons which areunglaciated and have similar relief between canyons andridges (e.g., Mill Creek Canyon), and (2) if for unforeseenreasons glaciation did influence cooling ages, our imple-mentation of an average topographic profile (Figure 5)across the Wasatch will minimize the effect of changes inlocal relief induced by glaciation.[18] Changes in material properties in the thermal model
are accounted for by tracking material points in a Lagrangain(material) reference frame. This formulation allows forerosion of heat producing material and formation of a low-thermal conductivity sedimentary basin. Thus the contribu-tion of heat production to surface heat flow decreases withtime as the exhumation duration increases. Model parame-ters and material properties used in this study are summar-ized in Table 2. We assume heat production roughly obeys anexponential decrease with depth which is consistent withBasin and Range heat production models [Lachenbruch andSass, 1977]. Our assumed heat production profile wasvalidated with 20 representative samples analyzed from thecentral Wasatch Mountains (Appendix A). Published ther-mal conductivity measurements near the Wasatch Mountainssuggest an average value of 3.3�± 1.0) W m�1 K�1 at 25�C[Deming, 1988; Bodell, 1981; Moran, 1991; Powell, 1997]
EHLERS ET AL.: EXHUMATION AND EROSION, WASATCH MOUNTAINS, UTAH ETG 12 - 5
(see also Appendix A). We assume in our model a slightlylower representative crustal thermal conductivity of 3.0 Wm�1 K�1 because thermal conductivity decreases 0.1–0.5 Wm�1 K�1 with increased temperature and depth in the crust[Buntebarth, 1991; Clauser and Huenges, 1995]. A thermalconductivity of 2.2 W m�1 K�1 is assumed for the sedi-mentary basin.[19] The boundary conditions in the model include a
constant basal heat flux of 60 mW m�2 and no-flux boun-dary conditions on the sides (Figure 4a). The upper boundaryhas a constant surface temperature in the valley and anelevation-dependent temperature in the range. The sum ofour assumed basal and radiogenic heat flow provide aninitial surface heat flow of 90 mW m�2. This surface heatflow is consistent with present-day measurements near theWasatch Mountains [Sass et al., 1994; Ehlers and Chapman,1999] and paleothermal gradient estimates from exhumedfluid inclusions in the central Wasatch Mountains [Parry andBruhn, 1987]. Initial temperatures are specified as theconductive steady state solution for the specified boundaryconditions.
4.2. Kinematic Model
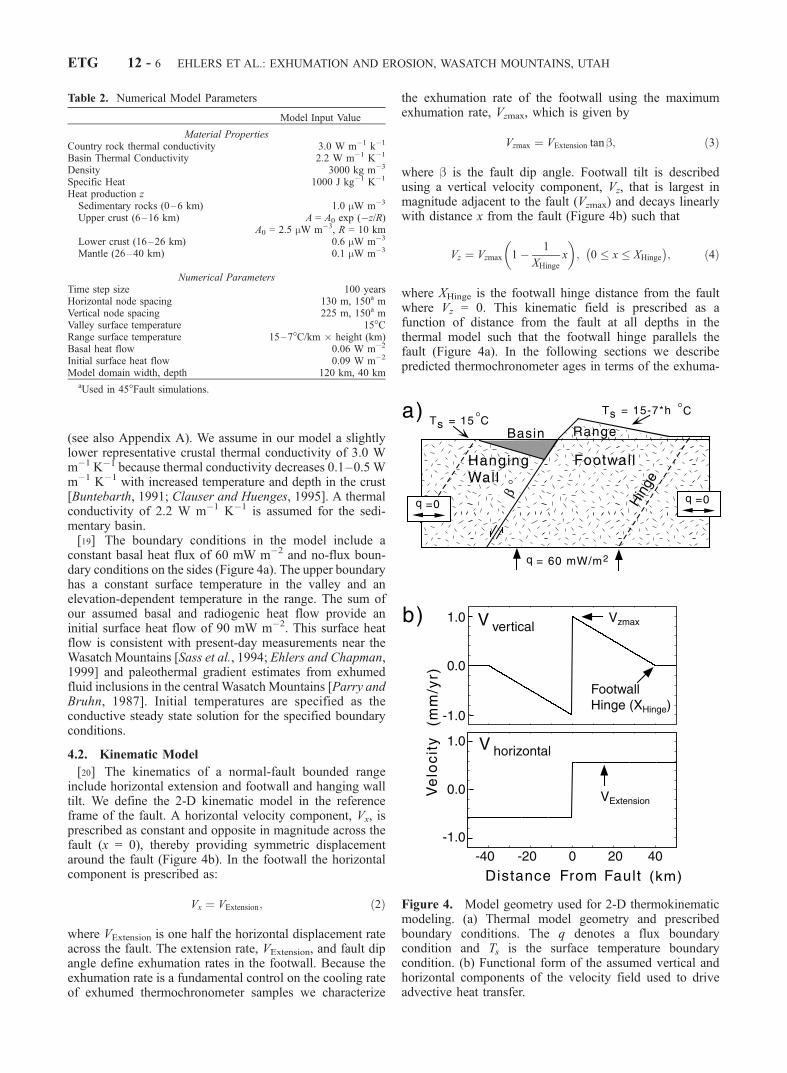
[20] The kinematics of a normal-fault bounded rangeinclude horizontal extension and footwall and hanging walltilt. We define the 2-D kinematic model in the referenceframe of the fault. A horizontal velocity component, Vx, isprescribed as constant and opposite in magnitude across thefault (x = 0), thereby providing symmetric displacementaround the fault (Figure 4b). In the footwall the horizontalcomponent is prescribed as:
Vx ¼ VExtension; ð2Þ
where VExtension is one half the horizontal displacement rateacross the fault. The extension rate, VExtension, and fault dipangle define exhumation rates in the footwall. Because theexhumation rate is a fundamental control on the cooling rateof exhumed thermochronometer samples we characterize
the exhumation rate of the footwall using the maximumexhumation rate, Vzmax, which is given by
Vzmax ¼ VExtension tan b; ð3Þ
where b is the fault dip angle. Footwall tilt is describedusing a vertical velocity component, Vz, that is largest inmagnitude adjacent to the fault (Vzmax) and decays linearlywith distance x from the fault (Figure 4b) such that
Vz ¼ Vzmax 1� 1
XHinge
x
� �; 0 � x � XHinge
� �; ð4Þ
where XHinge is the footwall hinge distance from the faultwhere Vz = 0. This kinematic field is prescribed as afunction of distance from the fault at all depths in thethermal model such that the footwall hinge parallels thefault (Figure 4a). In the following sections we describepredicted thermochronometer ages in terms of the exhuma-
Table 2. Numerical Model Parameters
Model Input Value
Material PropertiesCountry rock thermal conductivity 3.0 W m�1 k�1
Basin Thermal Conductivity 2.2 W m�1 K�1
Density 3000 kg m�3
Specific Heat 1000 J kg�1 K�1
Heat production zSedimentary rocks (0–6 km) 1.0 mW m�3
Upper crust (6–16 km) A = A0 exp (�z/R)A0 = 2.5 mW m�3, R = 10 km
Lower crust (16–26 km) 0.6 mW m�3
Mantle (26–40 km) 0.1 mW m�3
Numerical ParametersTime step size 100 yearsHorizontal node spacing 130 m, 150a mVertical node spacing 225 m, 150a mValley surface temperature 15�CRange surface temperature 15–7�C/km � height (km)Basal heat flow 0.06 W m�2
Initial surface heat flow 0.09 W m�2
Model domain width, depth 120 km, 40 kmaUsed in 45�Fault simulations.
Figure 4. Model geometry used for 2-D thermokinematicmodeling. (a) Thermal model geometry and prescribedboundary conditions. The q denotes a flux boundarycondition and Ts is the surface temperature boundarycondition. (b) Functional form of the assumed vertical andhorizontal components of the velocity field used to driveadvective heat transfer.
ETG 12 - 6 EHLERS ET AL.: EXHUMATION AND EROSION, WASATCH MOUNTAINS, UTAH
tion rate at the fault, Vzmax. However, note that exhumationrates vary across the footwall (equation (4)).[21] Three parameters define our footwall kinematic field
(Figure 4b and equations (2), (3), and (4)): (1) the footwallexhumation rate at the fault (Vzmax); (2) the distance of thefootwall hinge from the fault (XHinge); and (3) the fault dipangle, b. We investigated footwall exhumation rates at thefault of 0.2–2.0 mm yr�1, footwall hinge positions between15 km and 40 km from the fault, and fault dip angles of 45�and 60�. This description of the kinematic field focuses on thefootwall where we have thermochronometer samples. Wealso prescribe the hanging wall kinematic field in a similarmanner (Figure 4b) for the thermal model calculation.[22] Our assumed kinematic model imposes extensional
strain on the hanging wall and footwall. The effect of thisstrain on rock exhumation pathways is discussed in section5.1. The assumed kinematic model and associated strain isjustified by field observations from the Wasatch Mountains(Big Cottonwood Formation) where numerous small faultsand joints with �1–10 m normal sense offset are locatedbetween the fault and 10+ km distance from the fault in thefootwall (unpublished results from Ehlers and Chan[1999]). Furthermore, extensional strain has been observedin the hanging wall of the Wasatch Fault. For example, theWest Valley Fault is an active antithetic fault in the SaltLake Valley and accommodates extension of the hangingwall [Hecker, 1993; Keaton et al., 1993]. Thus the exten-sional deformation imposed by our kinematic model on thehanging wall and footwall is consistent with observeddistributed strain in the central Wasatch Mountains and SaltLake Valley. As discussed below, the assumed kinematicmodel has the additional advantage of easily trackingexhumation trajectories in two dimensions.[23] Equations (2) and (4) are simple enough to derive
analytic expressions for particle positions in the footwallduring the exhumation process. Particle positions can betracked forward in time from an initial position (X0, Z0) to anew position (X1, Z1) after a specified time (�t):
X1 ¼ Vx�t þ X0 ð5Þ
Z1 ¼ Zo �Zt1to
Vzxð Þdt: ð6Þ
Vz retains the integral form because Vz is a function of x.Because Vx is constant, this can be written as
Z1 ¼ Zo �Zx1xo
Vz
Vx
dx; ð7Þ
which can be solved analytically by substitution ofequations (2) and (4). Equations (5) and (7) are used toincrementally track the position and temperature of particlesat each time step as they are exhumed toward the surface.The temperature history of particles exhumed to the surfaceis then used to predict (U-Th)/He and AFT ages usingthermochronometer kinetic models.
4.3. Thermochronometer Kinetic Models
[24] Apatite fission track and (U-Th)/He ages can bepredicted from thermal histories using kinetic models for
track annealing and helium diffusion, respectively. Kineticmodels of apatite fission track annealing have been docu-mented in numerous studies [Naser and Faul, 1969;Wagnerand Reimer, 1972; Laslett et al., 1987; Green et al., 1986;Carlson, 1990; Crowley et al., 1991; Ketcham et al., 1999].The apatite samples considered in this study are fluorapatite[Armstrong et al., 2003] so we assume a fluorapatiteannealing model based on the data of Green et al. [1986],fit by Laslett et al. [1987], and implemented by Willett[1992, 1997].[25] Recent advances have been made in quantifying the
kinetics of helium diffusion in apatite [Zeitler et al., 1987;Farley et al., 1996; Wolf et al., 1996, 1998; Farley, 2000].We use these kinetic parameters to calculate predicted(U-Th)/He ages assuming diffusion of helium in a sphericalgrain. Spherical diffusion can be described by [Carslaw andJaeger, 1959; Wolf et al., 1996, 1998]
@H
@t� D
a2@2H
@r2þ 2
r @H@r
� �¼ 8l 238
238 U þ 7l 235235 U þ 6l 232
232 Th;
ð8Þ
where H represents the 4He concentration in a domain withradius a as a function of time (t), and radial position (r)normalized by the diffusion domain size. The three righthand terms in equation (8) account for 4He produced byradiogenic decay of 238U, 235U, and 232Th with associateddecay rate constants l. The temperature-dependent diffu-sivity, D, is calculated as
D ¼ D0 exp �Ea=RT tð Þ½ �; ð9Þ
where D0 and Ea are the empirically derived diffusivity atinfinite temperature and activation energy, respectively[Farley, 2000], R is the gas constant, and T(t) is temperature.[26] Equations (8) and (9) were solved numerically using a
spherical finite element model to generate predicted (U-Th)/He ages. The model was validated using analytic solutionsfor isothermal ingrowth diffusion [Carslaw and Jaeger,1959; Ozisik, 1989] and compared to the California Instituteof Technology helium diffusion algorithm (K. Farley and M.House, personal communication, 2000). We assumedDurango fluorapatite kinetic parameters of Ea = 33 kcalmol�1, and D0 = 50 � 108 mm2 s�1 [Farley, 2000]. Theaverage grain diameter of the Wasatch samples is 85 mm[Armstrong et al., 2003] which we assume to be representa-tive of all samples. Initial 238U and 232Th concentrations of 20ppm were used. Thermochronometer samples were given aninitial intrusion age of 35.5 Ma based on the average plutonages of the Little Cottonwood and Alta Stocks.
5. Results
5.1. Two-Dimensional Thermokinematic Field andPredicted Ages
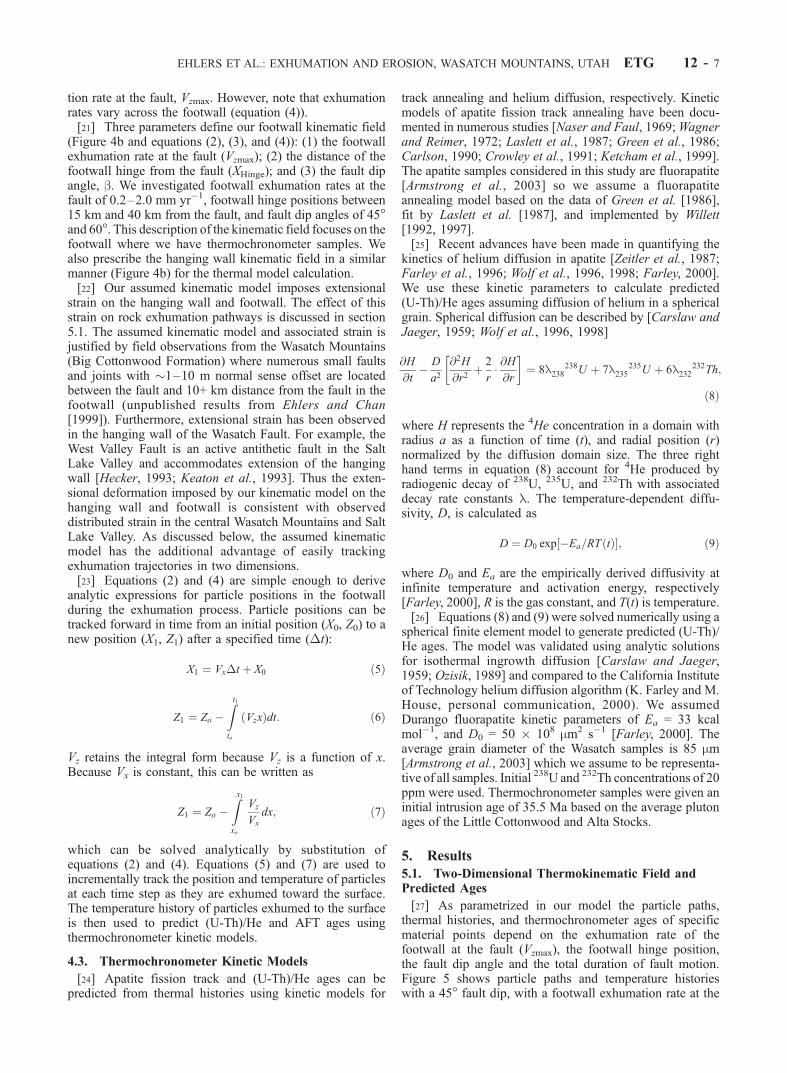
[27] As parametrized in our model the particle paths,thermal histories, and thermochronometer ages of specificmaterial points depend on the exhumation rate of thefootwall at the fault (Vzmax), the footwall hinge position,the fault dip angle and the total duration of fault motion.Figure 5 shows particle paths and temperature historieswith a 45� fault dip, with a footwall exhumation rate at the
EHLERS ET AL.: EXHUMATION AND EROSION, WASATCH MOUNTAINS, UTAH ETG 12 - 7
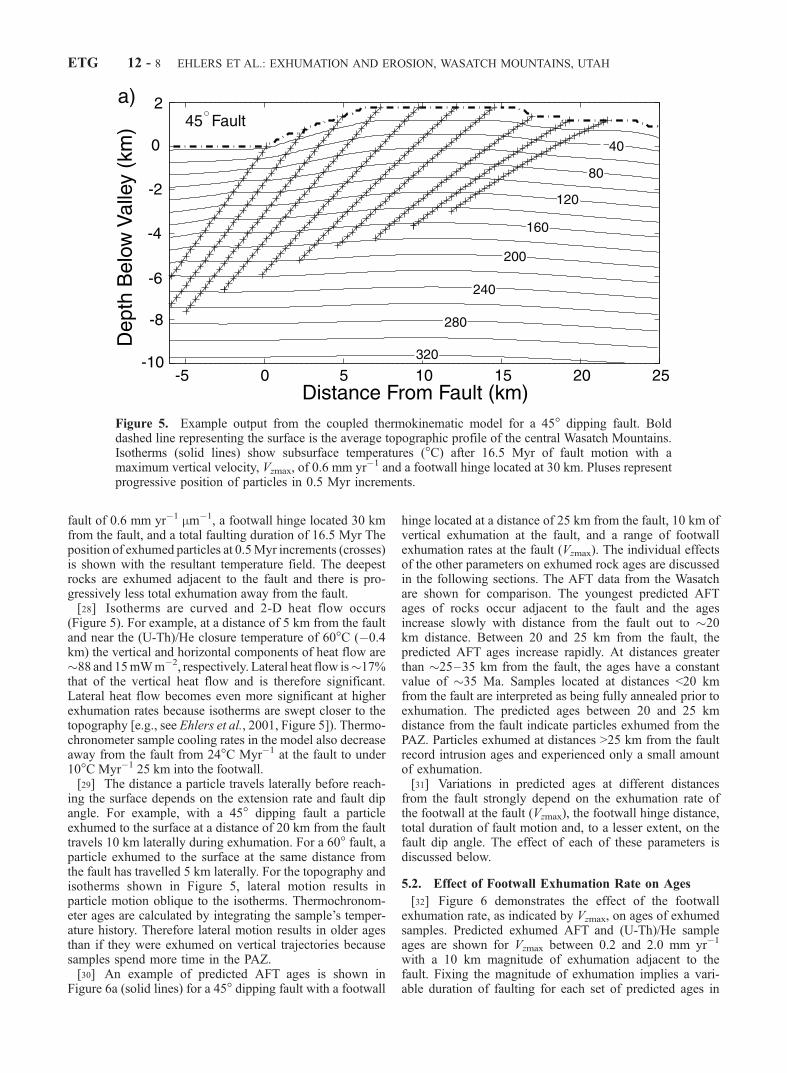
fault of 0.6 mm yr�1 mm�1, a footwall hinge located 30 kmfrom the fault, and a total faulting duration of 16.5 Myr Theposition of exhumed particles at 0.5Myr increments (crosses)is shown with the resultant temperature field. The deepestrocks are exhumed adjacent to the fault and there is pro-gressively less total exhumation away from the fault.[28] Isotherms are curved and 2-D heat flow occurs
(Figure 5). For example, at a distance of 5 km from the faultand near the (U-Th)/He closure temperature of 60�C (�0.4km) the vertical and horizontal components of heat flow are�88 and 15mWm�2, respectively. Lateral heat flow is�17%that of the vertical heat flow and is therefore significant.Lateral heat flow becomes even more significant at higherexhumation rates because isotherms are swept closer to thetopography [e.g., see Ehlers et al., 2001, Figure 5]). Thermo-chronometer sample cooling rates in the model also decreaseaway from the fault from 24�C Myr�1 at the fault to under10�C Myr�1 25 km into the footwall.[29] The distance a particle travels laterally before reach-
ing the surface depends on the extension rate and fault dipangle. For example, with a 45� dipping fault a particleexhumed to the surface at a distance of 20 km from the faulttravels 10 km laterally during exhumation. For a 60� fault, aparticle exhumed to the surface at the same distance fromthe fault has travelled 5 km laterally. For the topography andisotherms shown in Figure 5, lateral motion results inparticle motion oblique to the isotherms. Thermochronom-eter ages are calculated by integrating the sample’s temper-ature history. Therefore lateral motion results in older agesthan if they were exhumed on vertical trajectories becausesamples spend more time in the PAZ.[30] An example of predicted AFT ages is shown in
Figure 6a (solid lines) for a 45� dipping fault with a footwall
hinge located at a distance of 25 km from the fault, 10 km ofvertical exhumation at the fault, and a range of footwallexhumation rates at the fault (Vzmax). The individual effectsof the other parameters on exhumed rock ages are discussedin the following sections. The AFT data from the Wasatchare shown for comparison. The youngest predicted AFTages of rocks occur adjacent to the fault and the agesincrease slowly with distance from the fault out to �20km distance. Between 20 and 25 km from the fault, thepredicted AFT ages increase rapidly. At distances greaterthan �25–35 km from the fault, the ages have a constantvalue of �35 Ma. Samples located at distances <20 kmfrom the fault are interpreted as being fully annealed prior toexhumation. The predicted ages between 20 and 25 kmdistance from the fault indicate particles exhumed from thePAZ. Particles exhumed at distances >25 km from the faultrecord intrusion ages and experienced only a small amountof exhumation.[31] Variations in predicted ages at different distances
from the fault strongly depend on the exhumation rate ofthe footwall at the fault (Vzmax), the footwall hinge distance,total duration of fault motion and, to a lesser extent, on thefault dip angle. The effect of each of these parameters isdiscussed below.
5.2. Effect of Footwall Exhumation Rate on Ages
[32] Figure 6 demonstrates the effect of the footwallexhumation rate, as indicated by Vzmax, on ages of exhumedsamples. Predicted exhumed AFT and (U-Th)/He sampleages are shown for Vzmax between 0.2 and 2.0 mm yr�1
with a 10 km magnitude of exhumation adjacent to thefault. Fixing the magnitude of exhumation implies a vari-able duration of faulting for each set of predicted ages in
Figure 5. Example output from the coupled thermokinematic model for a 45� dipping fault. Bolddashed line representing the surface is the average topographic profile of the central Wasatch Mountains.Isotherms (solid lines) show subsurface temperatures (�C) after 16.5 Myr of fault motion with amaximum vertical velocity, Vzmax, of 0.6 mm yr�1 and a footwall hinge located at 30 km. Pluses representprogressive position of particles in 0.5 Myr increments.
ETG 12 - 8 EHLERS ET AL.: EXHUMATION AND EROSION, WASATCH MOUNTAINS, UTAH
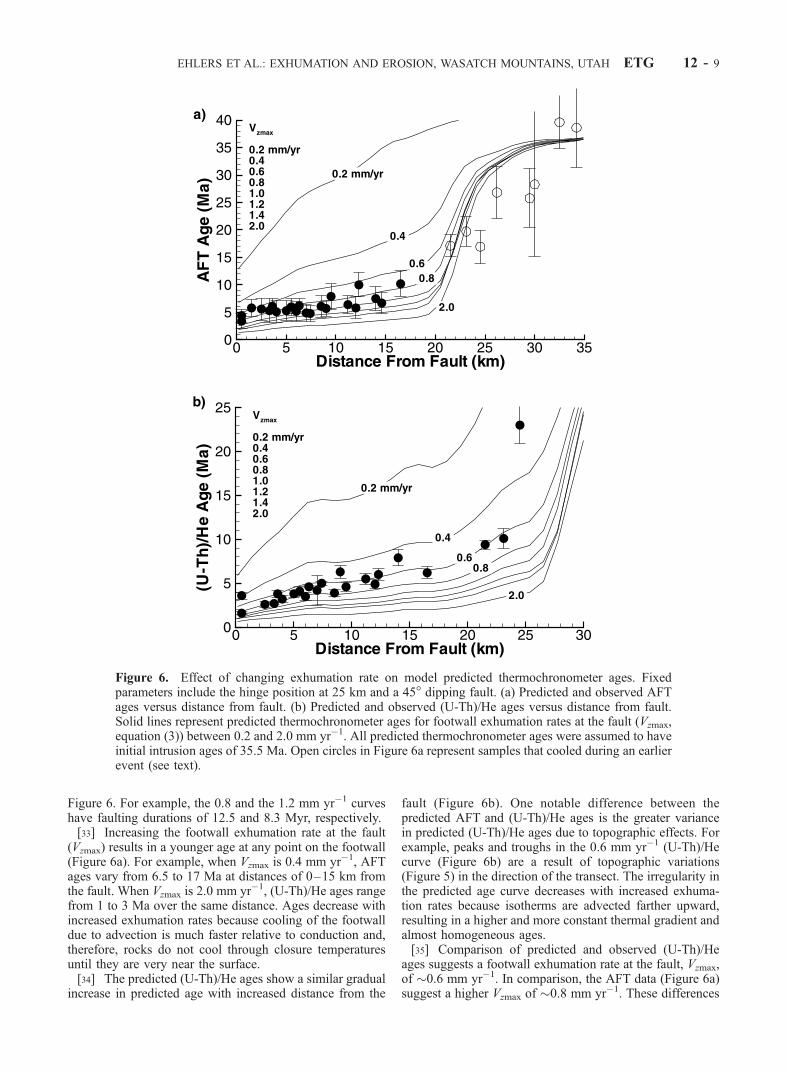
Figure 6. For example, the 0.8 and the 1.2 mm yr�1 curveshave faulting durations of 12.5 and 8.3 Myr, respectively.[33] Increasing the footwall exhumation rate at the fault
(Vzmax) results in a younger age at any point on the footwall(Figure 6a). For example, when Vzmax is 0.4 mm yr�1, AFTages vary from 6.5 to 17 Ma at distances of 0–15 km fromthe fault. When Vzmax is 2.0 mm yr�1, (U-Th)/He ages rangefrom 1 to 3 Ma over the same distance. Ages decrease withincreased exhumation rates because cooling of the footwalldue to advection is much faster relative to conduction and,therefore, rocks do not cool through closure temperaturesuntil they are very near the surface.[34] The predicted (U-Th)/He ages show a similar gradual
increase in predicted age with increased distance from the
fault (Figure 6b). One notable difference between thepredicted AFT and (U-Th)/He ages is the greater variancein predicted (U-Th)/He ages due to topographic effects. Forexample, peaks and troughs in the 0.6 mm yr�1 (U-Th)/Hecurve (Figure 6b) are a result of topographic variations(Figure 5) in the direction of the transect. The irregularity inthe predicted age curve decreases with increased exhuma-tion rates because isotherms are advected farther upward,resulting in a higher and more constant thermal gradient andalmost homogeneous ages.[35] Comparison of predicted and observed (U-Th)/He
ages suggests a footwall exhumation rate at the fault, Vzmax,of �0.6 mm yr�1. In comparison, the AFT data (Figure 6a)suggest a higher Vzmax of �0.8 mm yr�1. These differences
Figure 6. Effect of changing exhumation rate on model predicted thermochronometer ages. Fixedparameters include the hinge position at 25 km and a 45� dipping fault. (a) Predicted and observed AFTages versus distance from fault. (b) Predicted and observed (U-Th)/He ages versus distance from fault.Solid lines represent predicted thermochronometer ages for footwall exhumation rates at the fault (Vzmax,equation (3)) between 0.2 and 2.0 mm yr�1. All predicted thermochronometer ages were assumed to haveinitial intrusion ages of 35.5 Ma. Open circles in Figure 6a represent samples that cooled during an earlierevent (see text).
EHLERS ET AL.: EXHUMATION AND EROSION, WASATCH MOUNTAINS, UTAH ETG 12 - 9

in Vzmax could be interpreted to suggest a 0.2 mm yr�1
deceleration in the exhumation rate from �5 Ma to present.We quantitatively explore this inference in more detail later.
5.3. Effect of Footwall Hinge Position on Ages
[36] Figure 7 shows the effect of the footwall hingeposition on thermochronometer ages for models with a 45�dipping fault and a footwall exhumation rate at the fault(Vzmax) of 0.8 mm yr�1. Results are shown following 10 kmof exhumation at the fault. Increasing the hinge distancefrom the fault results in rocks with young ages exhumed atgreater distances from the fault. For example, a 15 km hingeposition results in 4–9 Ma ages within 10 km of the fault(Figure 7a). Between 10 and 17 km from the fault samplesfrom the partial annealing zone are exhumed and at distances
greater than �17 km only intrusion ages are present. Incontrast, when the hinge is located 40 km from the fault, 4–10 Ma sample ages are present within 30 km of the fault.Ages <10 Ma are present at greater distances from the faultfor the 40 km hinge position because the vertical velocitycomponent is larger at any given location in the footwall fora 40 km hinge position than for a 15 km hinge (XHinge,equation (4)).[37] The models predict that ages between 10 and 30 km
from the fault are sensitive to the position of the hinge. Thefootwall hinge position could be constrained from samplescollected at this distance. Unfortunately, AFT ages collectedfrom the Wasatch Mountains at >18 km from the fault (opencircles, Figure 7a) have ages associated with an earliercooling event in the middle to eastern part of the range
Figure 7. Effect of footwall hinge position on predicted thermochronometer ages. Fixed parametersinclude a footwall exhumation rate at the fault (Vzmax, equation (3)) of 0.8 mm yr�1 and a 45� dippingfault. (a) Predicted (solid lines) and observed AFT ages versus distance from fault. (b) Predicted (solidlines) and observed (U-Th)/He ages. Hinge positions from 15 to 40 km are shown. All samples wereassumed to have initial intrusion ages of 35.5 Ma Open circles in Figure 7a represent samples that cooledduring an earlier exhumation event (see text).
ETG 12 - 10 EHLERS ET AL.: EXHUMATION AND EROSION, WASATCH MOUNTAINS, UTAH

[Armstrong et al., 2003] and therefore provide only amaximum bound on the hinge distance which we infer tobe �25 km from the fault. However, (U-Th)/He ages atdistances between �16.5 and 23.5 km from the faultsuggest a footwall hinge location of �20–25 km from thefault (Figure 7b). This result depends on the simulatedexhumation rate of the footwall at the fault (Vzmax) and thusis non unique, a point discussed below.
5.4. Effect of Duration of Fault Motion on Ages
[38] Thermochronometer ages also constrain the durationof extension and faulting. The temporal and spatial evolu-tion of exhumed sample ages for samples from a 35 Mapluton and faulting duration of 6–19 Myr are shown inFigure 8. Other parameters are fixed at 45� for the fault dip,a footwall hinge position of 25 km from the fault, and Vzmax
of 0.8 mm yr�1. Increasing the duration of faulting results inyoung ages at greater distances from the fault. For example,if the duration of faulting is 6 Myr, the region of young agesis confined to within �4 km of fault (Figure 8a). In contrast,if the duration of faulting is 12 Myr, the zone of young agesextends 16 km further into the footwall to a distance of �20km from the fault. Samples with young ages are present atprogressively greater distances from the fault as the exhu-mation duration increases because rocks at greater distancesare eventually exhumed from below the partial retentionzone (PRZ) and will not record their parent (intrusion) age.[39] Samples with young (U-Th)/He ages also occur at
progressively greater distances from the fault with increasedduration of faulting (Figure 8b). However, the spatialpattern of ages is different from the AFT age pattern. Forexample, if the duration of faulting is 6 Myr, rocks with
Figure 8. Effect of faulting onset age on predicted thermochronometer ages. Fixed parameters include a45� dipping fault; a footwall exhumation rate at the fault of 0.8 mm yr�1 (equation (3)); and a 25 kmfootwall hinge position. Solid lines represent predicted (a) AFT and (b) (U-Th)/He ages for onset ages of6–19 Ma. All samples were assumed to have initial intrusion ages of 35.5 Ma Open circles in Figure 8arepresent samples that cooled during an earlier event (see text).
EHLERS ET AL.: EXHUMATION AND EROSION, WASATCH MOUNTAINS, UTAH ETG 12 - 11
young ages (3–5 Ma) are exposed to distances of 18 kmfrom the fault. If the duration of faulting is increased to 14Myr, rocks with young ages are exposed to 26 km from thefault (Figure 8b). The 16 km distance over which rocks withyoung AFT ages are exposed for faulting durations between6 and 19 Myr is not present in exhumed (U-Th)/He agesbecause the helium closure temperature is closer to thesurface than for AFT data and the total time between closureand exposure is less.[40] Comparison between predicted and observed AFT
ages in Figure 8a suggests a faulting duration for theWasatch fault between 10 and 14 Myr. Samples located at>20 km are interpreted to have cooled in an earlier eventand therefore provide only a maximum estimate of thecooling duration. The (U-Th)/He data (Figure 8b) suggestan onset of faulting time of 8 Ma, but the lack of samples at>23 km means that this is also only a minimum estimate.The onset time of faulting is discussed in more detail later.
6. Discussion
6.1. Kinematic Model for the CentralWasatch Mountains
[41] The previous sections demonstrate how thermochron-ometer ages depend on the patterns and rates of footwalluplift as parameterized in the model by fault dip, footwallhinge position, maximum exhumation rate (Vzmax), and theduration of faulting. The possibility exists that multiplecombinations of these parameters can predict the observedages equally well. Therefore combinations of parameterswere investigated over a range of hinge positions from 15to 40 km, Vzmax between 0.2 and 2.0 mm yr�1, and fault dipangles of 45� and 60�. We assume an onset time of faultmotion consistent with 10 km of vertical exhumation at thefault. The 10 km magnitude of exhumation is consistent withthe fluid inclusion results of Parry and Bruhn [1987].Predicted andmeasured ages were compared using the squareroot of a reduced chi-square measure of fit
c2 ¼
ffiffiffiffiffiffiffiffiffiffiffiffiffiffiffiffiffiffiffiffiffiffiffiffiffiffiffiffiffiffiffiffiffiffiffiffiffiffiffiffiffiffiffiPNi¼1
Agepi � AgeoiUi
� �2
N �M
vuuut; ð10Þ
where Agepi and Ageoi are the predicted and observed AFTor (U-Th)/He ages for the ith point, respectively, Ui is theone standard deviation uncertainty in the ith age; N is thenumber of samples; and M is the number of modelparameters (i.e., 4). Equation (10) provides an unbiasedestimator of the root mean square error and a quantifiedmeasure of fit. Independent c2 values were calculated forAFT and (U-Th)/He ages.[42] The c2 values are shown over the region of parameter
space where they vary the most. We plot the values forvariations in the footwall hinge position and maximumexhumation rate for each fault dip angle (Figure 9). The c2
measures are shown individually for the AFT and (U-Th)/Hethermochronometer systems in addition to the combined c2
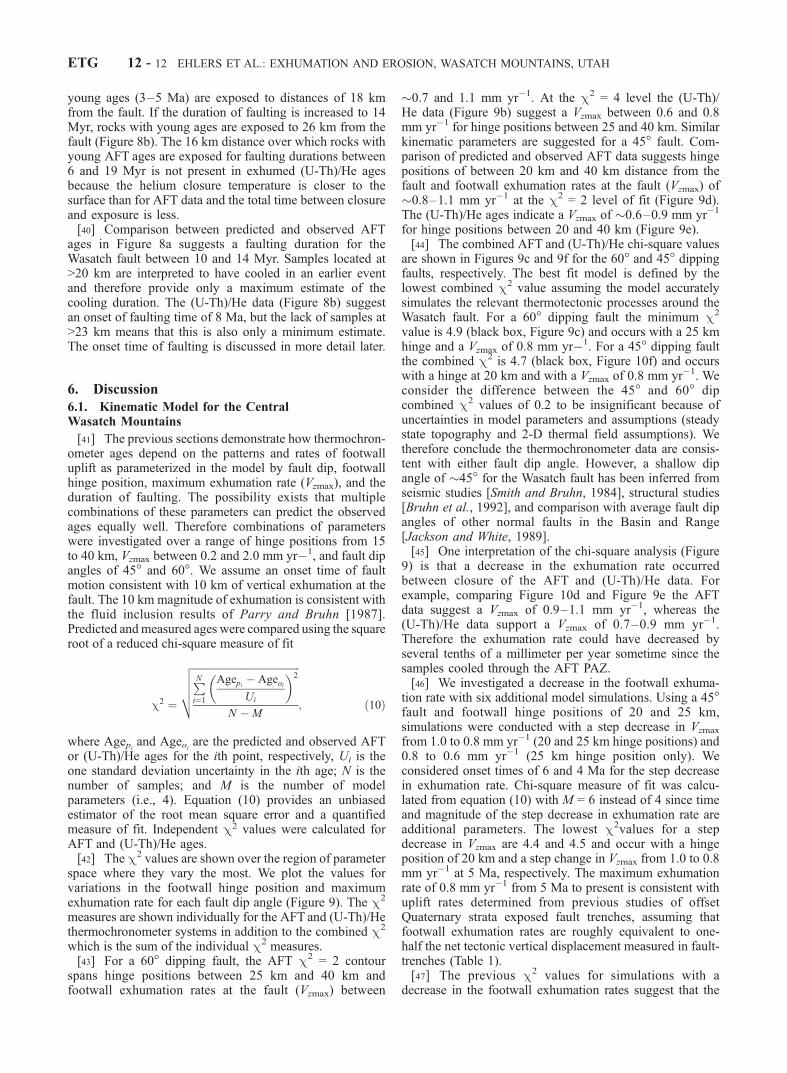
which is the sum of the individual c2 measures.[43] For a 60� dipping fault, the AFT c2 = 2 contour
spans hinge positions between 25 km and 40 km andfootwall exhumation rates at the fault (Vzmax) between
�0.7 and 1.1 mm yr�1. At the c2 = 4 level the (U-Th)/He data (Figure 9b) suggest a Vzmax between 0.6 and 0.8mm yr�1 for hinge positions between 25 and 40 km. Similarkinematic parameters are suggested for a 45� fault. Com-parison of predicted and observed AFT data suggests hingepositions of between 20 km and 40 km distance from thefault and footwall exhumation rates at the fault (Vzmax) of�0.8–1.1 mm yr�1 at the c2 = 2 level of fit (Figure 9d).The (U-Th)/He ages indicate a Vzmax of �0.6–0.9 mm yr�1
for hinge positions between 20 and 40 km (Figure 9e).[44] The combined AFT and (U-Th)/He chi-square values
are shown in Figures 9c and 9f for the 60� and 45� dippingfaults, respectively. The best fit model is defined by thelowest combined c2 value assuming the model accuratelysimulates the relevant thermotectonic processes around theWasatch fault. For a 60� dipping fault the minimum c2
value is 4.9 (black box, Figure 9c) and occurs with a 25 kmhinge and a Vzmax of 0.8 mm yr�1. For a 45� dipping faultthe combined c2 is 4.7 (black box, Figure 10f) and occurswith a hinge at 20 km and with a Vzmax of 0.8 mm yr�1. Weconsider the difference between the 45� and 60� dipcombined c2 values of 0.2 to be insignificant because ofuncertainties in model parameters and assumptions (steadystate topography and 2-D thermal field assumptions). Wetherefore conclude the thermochronometer data are consis-tent with either fault dip angle. However, a shallow dipangle of �45� for the Wasatch fault has been inferred fromseismic studies [Smith and Bruhn, 1984], structural studies[Bruhn et al., 1992], and comparison with average fault dipangles of other normal faults in the Basin and Range[Jackson and White, 1989].[45] One interpretation of the chi-square analysis (Figure
9) is that a decrease in the exhumation rate occurredbetween closure of the AFT and (U-Th)/He data. Forexample, comparing Figure 10d and Figure 9e the AFTdata suggest a Vzmax of 0.9–1.1 mm yr�1, whereas the(U-Th)/He data support a Vzmax of 0.7–0.9 mm yr�1.Therefore the exhumation rate could have decreased byseveral tenths of a millimeter per year sometime since thesamples cooled through the AFT PAZ.[46] We investigated a decrease in the footwall exhuma-
tion rate with six additional model simulations. Using a 45�fault and footwall hinge positions of 20 and 25 km,simulations were conducted with a step decrease in Vzmax
from 1.0 to 0.8 mm yr�1 (20 and 25 km hinge positions) and0.8 to 0.6 mm yr�1 (25 km hinge position only). Weconsidered onset times of 6 and 4 Ma for the step decreasein exhumation rate. Chi-square measure of fit was calcu-lated from equation (10) with M = 6 instead of 4 since timeand magnitude of the step decrease in exhumation rate areadditional parameters. The lowest c2values for a stepdecrease in Vzmax are 4.4 and 4.5 and occur with a hingeposition of 20 km and a step change in Vzmax from 1.0 to 0.8mm yr�1 at 5 Ma, respectively. The maximum exhumationrate of 0.8 mm yr�1 from 5 Ma to present is consistent withuplift rates determined from previous studies of offsetQuaternary strata exposed fault trenches, assuming thatfootwall exhumation rates are roughly equivalent to one-half the net tectonic vertical displacement measured in fault-trenches (Table 1).[47] The previous c2 values for simulations with a
decrease in the footwall exhumation rates suggest that the
ETG 12 - 12 EHLERS ET AL.: EXHUMATION AND EROSION, WASATCH MOUNTAINS, UTAH
AFT sample ages were exhumed at an average rate (E0) of�1.0 mm yr�1 for the last (t0) �10 Myr and the (U-Th)/Heages were exhumed at an average rate (E1) of �0.8 mm yr�1
for the last (t1) �5 Ma. Therefore the exhumation rate forthe time period between 10 and 5 Ma must have been higherthan 1.0 mm yr�1. The exhumation rate (E2) for the timeperiod between 10 and 5 Ma is given by
E2 ¼ E0t0ð Þ � E1t1ð Þ½ � t0 � t1ð Þ�1: ð11Þ
Applying the previous values for E0, E1, t0, and t1 inequation (11) suggests an exhumation rate of 1.2 mm yr�1
between �10 and 5 Ma. Therefore the thermochronometerdata suggest the exhumation rate has decreased by a factorof 1.5 (from 1.2 to 0.8 mm yr�1) at �5 Ma.[49] The model-derived maximum exhumation rate of
0.8 mm yr�1 at the fault suggests and average exhumationrate of 0.7 mm yr�1 between 0 and 5 km distance from thefault (assuming tilt on a hinge located 20 km from thefault). This exhumation rate is almost a factor of 2 lessthan that implied by the local north-south elevation-agechange from ridge top to canyon bottom in Figure 5b ofArmstrong et al. [2003]. This discrepency may indicate aridge to canyon topographic effect on subsurface isothermsand/or that the landscape is not in steady state over the
timescale of �4 Myr (the mean sample age) [e.g., seeBraun, 2002].
6.2. Onset of Faulting and Maximum Temperatures ofExposed Rocks
[50] We infer that the Wasatch fault has been active for10–12 Myr with a maximum exhumation rate between 0.8and 1.0 mm yr�1 based on the distribution of ages in thefootwall (section 5.4 and 6.1). This fault onset time is alsoconstrained by considering the maximum temperature expe-rienced by exhumed rocks. We now use the distribution ofZFT, AFT, (U-Th)/He ages across the footwall to delineatethe exhumation duration of the Wasatch fault footwall.Despite uncertainties in the kinetics of ZFT annealing thetemperature range encompassing the ZFT PAZ is inferred tobe between �230–330�C [Yamada et al., 1995]. As dis-cussed below, this temperature range of the ZFT PAZ allowsus to use the distribution of ZFT ages from the Wasatchmountains to interpret the duration of exhumation.[51] Figure 10 shows predicted maximum temperatures of
rocks exposed at the surface as a function of distance fromthe fault with different ages of initiation of fault motion. Aswith previous models, footwall tilt implies that rocksexhumed adjacent to the fault experienced higher maximumtemperatures than rocks exhumed at greater distances fromthe fault (Figure 10a). For an onset time of faulting less than
Figure 9. Chi-square measure of fit between predicted and observed thermochronometer ages for themodel solution space. (a) AFT, (b) (U-Th)/He, (c) summed AFT and (U-Th)/He misfit for a model with a60� dipping fault. (d) AFT, (e) (U-Th)/He, (f ) summed AFT and (U-Th)/He misfit for a model with a 45�dipping fault. Black boxes in Figures 9c and 9f represent the best fit models.
EHLERS ET AL.: EXHUMATION AND EROSION, WASATCH MOUNTAINS, UTAH ETG 12 - 13

�8 Myr a rock exhumed adjacent to the fault wouldoriginate from above the ZFT PAZ and would thus have aZFT age equivalent to the intrusion age (35 Ma). However,if faulting persisted for longer than 8 Myr, a sample fromthe footwall adjacent to the fault would originate fromwithin the ZFT PAZ and would therefore have a ZFT ageyounger than the intrusion age. This pattern holds for theother thermochronometer systems as well.[52] Wasatch Mountain samples that we interpret as
having been exhumed from below, within, and above thePAZ or PRZ are shown in Figure 10b. The horizontal bars
indicate distance from the fault that we predict ages toreflect exhumation from different depths. For onset offaulting at 10 Ma, ZFT ages of rocks exposed at <3 kmfrom the fault experienced maximum temperatures between220 and 250�C. ZFT ages of rocks exposed between 3 and 9km distance experienced maximum temperatures between150 and 220�C. ZFT ages of rocks exposed at >9 kmdistance experienced maximum temperatures <150�C. Forthe same onset of faulting time, AFT ages in rocks exposedat <17 km distance experienced maximum temperatures>110�C. No AFT ages associated with this episode of
Figure 10. Predicted maximum temperature experienced by a surface rock as a function of distancefrom the fault and time since initiation of fault motion. Model includes fixed parameters of a 45� dippingfault, 25 km footwall hinge, and footwall exhumation rate at the fault of 0.8 mm yr�1 (Vzmax, equation(3)). (a) Maximum exhumed temperatures (solid lines) across the footwall for faulting onset timesbetween 6 and 19 Ma. Horizontal shaded boxes represent the approximate temperature range of the PRZ.(b) Thermochronometer ages versus distance from fault. Horizontal black, gray, and white bars representthe observed lateral extent of samples exhumed from depths below, within, and above the PRZ,respectively.
ETG 12 - 14 EHLERS ET AL.: EXHUMATION AND EROSION, WASATCH MOUNTAINS, UTAH
cooling are observed at distances >17 km. (U-Th)/He agesof rocks present at distances <23 km from the faultexperienced temperatures >70�C. No (U-Th)/He ages areavailable at distances >23 km from the fault where predictedmaximum temperatures are <80�C.[53] Armstrong et al. [2003] interpret the ZFT ages within
3 km of the fault as originating in, or below, the ZFT PAZ.If the ZFT ages within 3 km of the fault originated fromwithin the ZFT PAZ then these sample had maximumtemperatures somewhere between 230 and 330�C. Rockswith ZFT ages with this range of maximum temperatureswould only be exposed if the onset of faulting was between9 and 14 Ma. The AFT samples exposed within 17 km ofthe fault have ages <11 Ma and are interpreted as exhumedfrom depths below the AFT PAZ. The 10 Ma AFT age ofthe sample at 17 km from the fault implies a minimumfaulting onset age of 10 Ma On the basis of the inferredmaximum temperatures of the ZFT and AFT data weinterpret a faulting onset age of 12 ± 2 Ma.[54] This 12 Ma onset age of faulting is sensitive to the
assumption of steady state topography and the use ofthe present-day topography of the Wasatch Mountains asthe initial condition in the thermokinematic model. A morerealistic assumption would be that the present-day topog-raphy of the Wasatch Mountains evolved over the firstcouple million years of faulting [Densmore et al., 1998;
Allen and Densmore, 2000], in which case exhumation anderosion rates would be less over this time period. If thiswere the case and the topography developed over the firstseveral million years than our assumed initial condition ofsteady state topography could result in the predicted onsettime of faulting to be under estimated by �1–2.5 Myr.[55] Nevertheless, assuming an onset age of 12 Ma and a
maximum exhumation rate (Vzmax) of 0.8 mm yr�1, we inferan exhumation magnitude of 9.6 km �± 1.6 km) at the fault.This exhumation magnitude and predicted maximum tem-peratures of 250–330�C for samples exhumed adjacent tothe fault (Figure 10a) are consistent with maximum temper-atures and pressures measured in fluid inclusion samplesfrom the Wasatch fault [Parry et al., 1988].
7. Conclusions
[56] Many exhumation studies in normal fault boundedranges commonly use the slope of a best fit line in a plot ofthermochronometer sample age versus elevation to delineatethe apparent exhumation rate. Although this approach isuseful for determining an approximate exhumation rate it isseldom able to quantify other important kinematic param-eters such as spatial and temporal variations in the trueexhumation rate, fault dip angle, footwall tilt, or exhumationduration. The previous kinematic parameters are of interest
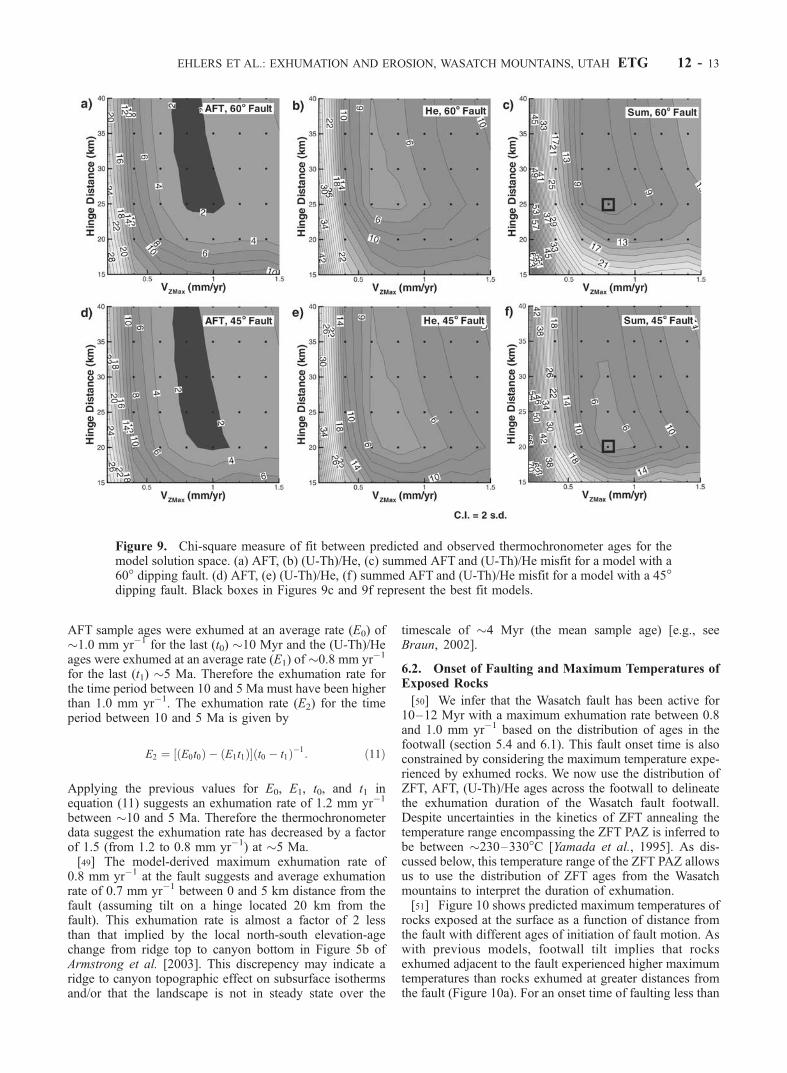
Table A1. Heat Production Measurements
Formation Lithology Sample Density, g/cm�3 Potassium, wt% Uranium, ppm Thorium, ppmHeat Production,
mWm�3
Farmington Canyon metamorphic A 2.7 3.0 2.7 23.9 2.8B 3.0 0.8 1.1 2.5 0.6C 2.7 3.4 2.3 25.9 2.7D 2.9 1.2 1.0 5.8 0.8E 2.7 1.0 1.7 14.1 1.5
Little Willow metamorphic A 2.6 0.2 0.2 0.6 0.1B 2.7 1.0 1.2 6.9 0.9C 2.8 3.3 1.8 7.5 1.3D 3.0 0.5 0.3 2.0 0.3E 2.9 0.6 0.4 1.6 0.3
Little Cottonwood monzonitet A 2.7 2.9 3.9 10.8 2.0B 2.6 3.5 2.7 10.8 1.7
Alta Stoc monzonite A 2.7 2.5 4.0 12.0 2.1B 2.7 2.4 3.3 10.4 1.8
Ankareh shale A 2.7 4.1 1.4 8.1 1.3Big Cottonwood argillite A 2.8 1.9 4.2 15.3 2.4
B 2.7 2.0 2.7 11.1 1.7Ophir shale A 2.8 6.0 3.5 16.5 2.8Mancos shale A 2.4 1.6 2.9 8.1 1.3Kelvin sandstone A 2.4 0.3 0.7 1.6 0.3
Table A2. Thermal Conductivity Measurements
Formation Lithology N
Whole RockConductivity,W m�1 K�1
1 SD,W m�1 K�1 Porosity, %
MatrixConductivity,W m�1 K�1
1 SD,W m�1 K�1
Little Cottonwood monzonite 4 2.8 0.14 1.3 2.8 0.14Ophir Shale shale 4 3.1 1.28 0.6 3.1 1.30Twin Creek limestone 5 2.6 0.13 0.8 2.7 0.17Farmington Canyon metamorphic 6 3.2 0.64 0.9 3.2 0.63Gaurdison limestone 4 3.5 0.38 0.4 3.6 0.39Nugget sandstone 3 6.2 0.26 1.9 6.5 0.51Kelvin sandstone 5 4.7 0.38 14.0 6.5 0.47Big Cottonwood quartzite 3 6.7 0.81 1.2 6.9 0.84Ankareh sandstone 3 4.6 0.58 3.9 5.0 0.33Little Willow metamorphic 5 3.7 2.30 0.9 3.8 2.39
EHLERS ET AL.: EXHUMATION AND EROSION, WASATCH MOUNTAINS, UTAH ETG 12 - 15
when trying to understand the structural and geodynamicevolution of rift environments around the world. Theapproach presented in this study differs from that of manyother thermochronometer studies in that we integrate ther-mochronometer data and numerical models to quantify thekinematic evolution of a normal fault bounded range.[57] We coupled 2-D thermal, kinematic, and thermo-
chronometer kinetic models to describe the distribution ofexhumed ZFT, AFT, and (U-Th)/He sample ages in theCottonwood Intrusive Belt in the central Wasatch Moun-tains. The modeling approach employed in this study isapplicable to studies of normal fault bounded ranges inother rift environments. Our consideration of 2-D particletrajectories and thermal histories of exhumed thermochron-ometer samples lead to the following conclusions:1. AFT and (U-Th)/He ages can be explained by models
with a constant rate of exhumation or by models with adecrease in the exhumation rate. The best fit, constant-exhumation model has a rate of 0.8 mm yr�1 at the fault andan age of onset of 12 Ma. A slightly better fit is found for amodel with the maximum exhumation rate of 1.2 mm yr�1
for the time period between �10 and 5 Ma. For the last 5Myr, there appears to be a factor of 1.5 decrease in themaximum exhumation rate to 0.8 mm yr�1.2. The distribution of ZFT, AFT, and (U-Th)/He ages of
rocks exposed across the footwall suggests a faulting onsettime of 12 ± 2 Myr This onset time and a constantmaximum exhumation rate 0.8 mm yr�1 predict 9 ± 1.6 kmof exhumation at the fault. This magnitude of exhumation isconsistent with previous studies of the maximum pressuresand temperatures inferred from fluid inclusions in rocksnear the Wasatch fault.3. Tilt of the Wasatch Mountains occurs around a
structural hinge such that exhumation rates are highestadjacent to the fault and decrease toward the hinge [e.g.,Armstrong et al., 2003]. Model results suggest the WasatchMountains to have a footwall hinge located at a minimum of20–25 km from the footwall.
Appendix A: Thermophysical PropertyMeasurements
[58] Radiogenic heat production was measured in 20samples from nine formations in the Wasatch Mountains(Table A1). Heat production measurements were made byD. Pribnow at the thermophysical properties laboratory,Hannover, Germany, using a Canberra multichannel ana-lyzer, series 35, model 3201, with a 300 � 300 NaI detector.Heat production was derived from the content of U, Th, andK. The quantities of these elements were derived from thegamma ray spectrum measured on 2 kg samples crushed to<1 cm diameter.[59] Thermal conductivity measurements were conducted
on 42 samples from 10 formations in the central WasatchMountains. These samples augmented 800 thermal conduc-tivity measurements previously made on lithologies locatedin northcentral Utah and present near the central WasatchMountains [Deming, 1988; Bodell and Chapman, 1982;Moran, 1991; Powell, 1997]. Conductivity measurements(Table A2)] were made at room temperature on samples >10cm in diameter using a TK-04 line source at the Universityof Utah. Two orthogonal measurements were made on each
sample to determine if samples were anisotropic. Aniso-tropy was not detected in any of the samples.
[60] Acknowledgments. This research was funded by a University ofUtah Graduate Research Fellowship (to Ehlers) and NSF grant EAR-9805073 (To Armstrong and Chapman). Daniel Pribnow (Shell Interna-tional) is acknowledged for measurement of radiogenic heat production andspecific heat. This manuscript benefited from reviews by Geoff Batt,associate editor Jean Braun, and an anonymous reviewer.
ReferencesAllen, P. A., and A. L. Densmore, Sediment flux from an uplifting faultblock, Basin Res., 12, 367–380, 2000.
Arabasz, W. J., J. C. Pechmann, and E. D. Brown, Observational seismol-ogy and the evaluation of earthquake hazards and risk in the WasatchFront area, Utah, in Assessment of Regional Earthquake Hazards andRisk Along the Wasatch Front, Utah, edited by P. L. Gori and W. W.Hays, U.S. Geol. Surv. Prof. Pap., 1500-A-J, D1–D36, 1992.
Armstrong, P. A., T. A. Ehlers, D. S. Chapman, K. A. Farley, and P. J. J.Kamp, Exhumation of the central Wasatch Mountains, Utah: 1. Patternsand timing deduced from low-temperature thermochronology data,J. Geophys. Res., 108, doi:10.1029/2001JB001708, in press, 2003.
Batt, G. E., and M. T. Brandon, Lateral thinking: 2-D interpretations ofthermochronology in convergent orogenic settings, Tectonophysics, 349,185–201, 2001.
Batt, G. E., M. T. Brandon, K. A. Farley, and M. Roden-Tice, Tectonicsynthesis of the Olympic Mountains segment of the Cascadia wedge,using two-dimensional thermal and kinematic modeling of thermochro-nological ages, J. Geophys. Res., 106, 26,731–26,746, 2001.
Bertotti, G., and M. ter Voorde, Thermal effects of normal faulting duringrifted basin formation, 2, The Lugano-Val Grande normal fault and the roleof pre-existing thermal anomalies, Tectonophysics, 240, 145–157, 1994.
Bodell, J. M., Heat flow in the north-central Colorado Plateau, M.S. thesis,134 pp., Dep. of Geol. and Geophys., Univ. of Utah, Salt Lake City, 1981.
Bodell, J. M., and D. S. Chapman, Heat flow in the north-central ColoradoPlateau, J. Geophys. Res., 87, 2869–2884, 1982.
Braun, J., Quantifying the effect of recent relief changes on age-elevationrelations, Earth Planet. Sci. Lett., 200, 331–343, 2002.
Bruhn, R. L., P. R. Gibler, W. Houghton, andW. T. Parry, Structure of the SaltLake segment, Wasatch normal fault zone: Implications for rupture propa-gation during normal faulting, in Assessment of Regional Earthquake Ha-zards and Risk Along the Wasatch Front, Utah, edited by P. L. Gori andW. W. Hays, U.S. Geol. Surv. Prof. Pap., 1500-A-J, H1–H25, 1992.
Buntebarth, G., Thermal properties of KTB Oberpfalz—VB core samples atelevated temperature and pressure, Sci. Drill., 2, 73–80, 1991.
Carlson, W. D., Mechanisms and kinetics of apatite fission-track annealing,Am. Mineral., 75, 1120–1139, 1990.
Carlson, W. D., R. A. Donelick, and R. A. Ketcham, Variability of apatitefission-track annealing kinetics, I, Experimental results, Am. Mineral., 84,1213–1223, 1999.
Carslaw, H. S., and J. C. Jaeger, Conduction of Heat in Solids, Oxford Univ.Press, New York, 1959.
Clauser, C., and E. Huenges, Thermal conductivity of rocks and minerals,in Rock Physics and Phase Relations: A Handbook of Physical Con-stants, AGU Ref. Shelf, vol. 3, edited by T. J. Ahrens, pp. 105–126,AGU, Washington, D. C., 1995.
Constenius, K. N., Extensional tectonics of the Cordilleran foreland foldand thrust belt and the Jurassic-Cretaceous Great Valley forearc basin,Ph.D. thesis, Univ. of Ariz., Tuscon, 1998.
Crittenden, M. D., Jr., General geology of Salt Lake County, Sec. 1., bul-letin, Utah Geol. and Mineral. Surv., Salt Lake City, Utah, 1964.
Crone, A., and S. T. Harding, Near-surface faulting associated with Holo-cene fault scarps, Wasatch fault zone, Utah; a preliminary report, inProceedings of Conference XXVI; A Workshop on Evaluation of Regionaland Urban Earthquake Hazards and Risk in Utah, edited by W. W. Hayand P. L. Gori, U.S. Geol. Surv. Open File Rep., 87–585, 23–56, 1987.
Crowley, K. D., M. Cameron, and R. L. Schaefer, Experimental studies ofannealing of etched fission tracks in flourapatite, Geochim. Cosmochim.Acta, 55, 1449–1465, 1991.
Davis, W. M., The mountain ranges of the Great Basin, Harvard Univ. Mus.Comparative Zoology Bull., 42, 127–175, 1903.
Deming, D., Geothermics of the thrust belt in north-central Utah, Ph.D.thesis, 197 pp., Univ. of Utah, Salt Lake, 1988.
Densmore, A. L., M. A. Ellis, and R. S. Anderson, Landsliding and theevolution of normal-fault bounded mountains, J. Geophys. Res., 103,15,203–15,219, 1998.
Donelick, R. A., R. A. Ketcham, and W. D. Carlson, Variability of apatitefission track annealing kinetics, II, Crystallographic orientation effects,Am. Mineral., 84, 1224–1234, 1999.
ETG 12 - 16 EHLERS ET AL.: EXHUMATION AND EROSION, WASATCH MOUNTAINS, UTAH
Eardley, A. J., Strong relief before block faulting in the vicinity of theWasatch Mountains, Utah, J. Geol., 41, 243–267, 1933.
Eardley, A. J., Structure of the Wasatch-Great Basin region, Geol. Soc. Am.Bull., 50, 1277–1310, 1939.
Ehlers, T. A., and M. A. Chan, Tidal sedimentology and estuarine deposi-tion of the proterozoic Big Cotton Wood Formation, Utah, J. Sediment.Res., 69, 1169–1180, 1999.
Ehlers, T. A., and D. S. Chapman, Normal fault thermal regimes: Conduc-tive and hydrothermal heat transfer surrounding the Wasatch fault, Utah,Tectonophysics, 312, 217–234, 1999.
Ehlers, T. A., P. A. Armstrong, and D. S. Chapman, Normal fault thermalregimes and interpretation low- temperature thermochronometer data,Phys. Earth Planet. Inter., 126, 179–194, 2001.
Evans, S. H., W. T. Parry, and R. L. Bruhn, Thermal, mechanical andchemical history of Wasatch fault cataclasite and phyllonite, TraverseMountains area, Salt Lake City, Utah: Age and uplift rates from K/Arand fission track measurements, U.S. Geol. Surv. Open File Rep., 86–31,410–415, 1985.
Farley, K. A., Helium diffusion from apatite: General behavior as illustratedby Durango flourapatite, J. Geophys. Res., 105, 2903–2914, 2000.
Farley, K. A., R. A. Wolf, and L. T. Silver, The effects of long alpha-stopping distances on (U-Th)/He ages, Geochim. Cosmochim. Acta, 60,4223–4229, 1996.
Gilbert, G. K., Studies of basin-range structure, U.S. Geol. Surv. Prof. Pap.,153, 89 pp., 1928.
Gleadow, A. J. W., and R. W. Brown, Fission-track thermochronology andthe long-term denudational response to tectonics, in Geomorphology andGlobal Tectonics, edited by M. A. Summerfield, pp. 57–73, John Wiley,New York, 2000.
Grasemann, B., and N. S. Mancktelow, Two dimensional thermal modellingof normal faulting: The Simplon Fault Zone, central Alps, Switzerland,Tectonophysics, 225, 155–165, 1993.
Green, P. F., I. R. Duddy, A. J. W. Gleadow, P. R. Tingate, and G. M.Laslett, Fisson track annealing in apatite track length measurements andthe form of the Arrhenius plot, Nucl. Tracks, 10, 323–328, 1985.
Green, P. F., I. R. Duddly, A. J. W. Gleadow, P. R. Tingate, and G. M.Laslett, Thermal annealing of fission tracks in apatite, 1, A qualitativedescription, Chem. Geol., 59, 237–253, 1986.
Hecker, S., Quaternary tectonics of Utah with emphasis on earthquakehazard characterization, Utah Geol. Surv. Bull., 127, 157 pp., 1993.
Hintze, L. F., Wasatch fault zone east of Provo, Utah, in Environmentalgeology of the Wasatch front, edited by L. S. Hipert, Utah Geol. Assoc.Publ., 1, F1–F10, 1971.
Jackson, J. A., and N. J. White, Normal faulting in the upper continentalcrust; observations from regions of active extension, J. Struct. Geol., 11,15–36, 1989.
John, D. A., Geologic setting, depths of emplacement, and regional distri-bution of fluid inclusions in intrusions of the central Wasatch Mountains,Utah, Econ. Geol., 84, 386–409, 1989.
Keaton, J. R., D. R. Currey, and S. S. Olig, Paleoseismicity and earthquakehazards evaluation of the West Valley fault zone, Salt Lake City urbanarea, Utah, contract report 93-8, 55 pp., Utah Geol. Surv., Salt Lake City,1993.
Ketcham, R. A., D. A. Donelick, and W. D. Carlson, Variability of apatitefission-track annealing kinetics, III, Extrapolation to geological timescales, Am. Mineral., 84, 1235–1255, 1999.
King, C., Systematic Geology: Report of the Geological Exploration of the40th Parallel, vol. 1, 803 pp., U.S. Govt. Print. Off., Washington, D.C.,1878.
Kowallis, B. J., J. Ferguson, and G. J. Jorgensen, Uplift along the Salt Lakesegment of theWasatch fault from apatite and zircon fission track dating inthe Little Cottonwood Stock, Nucl. Tracks Radiat. Meas., 17, 325–329,1990.
Lachenbruch, A., and J. H. Sass, Heat flow in the United States and thethermal regime of the crust, in The Earth’s Crust: Its Nature and PhysicalProperties, Geophys. Monogr. Ser., vol. 20, edited by J. G. Heacock et al.,pp. 626–675, AGU, Washington D.C., 1977.
Laslett, G. M., P. F. Green, I. R. Duddy, and A. J. W. Gleadow, Thermalannealing of fission tracks in apatite, 2, A quantitative analysis, Chem.Geol., 65, 1–13, 1987.
Machette, M. N., S. F. Personius, and A. R. Nelson, Paleoseismology of theWasatch fault zone: A summary of recent investigations, interpretations,and conclusions, in Assessment of Regional Earthquake Hazards andRisk Along the Wasatch Front, Utah, edited by P. L. Gori and W. W.Hays, U.S. Geol. Surv. Prof. Pap. 1500 A-J, A1–A71, 1991.
Mancktelow, N. S., and B. Grasemann, Time-dependent effects of heatadvection and topography on cooling histories during erosion, Tectono-physics, 270, 167–195, 1997.
Marsell, R. E., Geology of the Jordan Narrows region, Traverse Mountains,UT, M.S. thesis, 88 pp., Univ. of Utah, Salt Lake City, 1932.
McCalpin, J. P., and S. P. Nishenko, Holocene paleoseismicity, temporalclustering, and probabilities of future large (M > 7) earthquakes on theWasatch fault zone, Utah, J. Geophys. Res., 101, 6233–6253, 1996.
Moran, K. J., Shallow thermal regime at the Jordanelle dam site, CentralRocky Mountains, Utah, Master’s thesis, 141 pp., Univ. of Utah, SaltLake City, 1991.
Naeser, C. W., Thermal history of sedimentary basins by fission trackdating of sub-surface rocks, in Aspects of Diagenesis, edited by P. A.Scholle and P. R. Schulger, Spec. Publ. Soc. Econ Paleont. Mineral., 26,109–112, 1979.
Naeser, C. W., and H. Faul, Fission track annealing in apatite and sphere,J. Geophys. Res., 74, 705–710, 1969.
Naeser, N. D., C. W. Naeser, and T. H. McCulloh, The application offission-track dating to depositional and thermal history of rocks in sedi-mentary basins, in Thermal History of Sedimentary Basins - Methods andCase Histories, edited by N. D. Naeser and T. H. McCulloh, pp. 157–180, Springer- Verlag, New York, 1989.
Ozisik, M. N., Boundary Value Problems of Heat Conduction, Dover,Mineola, N. Y., 1989.
Parrish, R. R., Cenozoic thermal evolution and tectonics of the coast moun-tains of British Columbia 1. Fission track dating apparent uplift rates, andpatterns of uplift, Tectonics, 2, 601–631, 1983.
Parry, W. T., and R. L. Bruhn, Fluid inclusion evidence for minimum 11 kmvertical offset on the Wasatch fault, Utah, Geology, 15, 67–70, 1987.
Parry, W. T., P. Wilson, and R. L. Bruhn, Pore fluid chemistry and chemicalreactions on the Wasatch normal fault, Utah, Geochim. Cosmochim. Acta,52, 2053–2063, 1988.
Powell, W. G., Thermal state Colorado Plateau-Basin and Range transition,Ph.D. thesis, 232 pp., Univ. of Utah, Salt Lake City, 1997.
Radkins, H., Inversion of bedrock topography in Salt Lake Valley fromgravity data, Master of science thesis, 59 pp., Univ. of Utah, Salt LakeCity, 1990.
Sass, J. H., A. H. Lachenbruch, and P. Morgan, Thermal regime of thesouthern Basin and Range province, 1, Heat flow data from Arizonaand Mohave desert of California and Nevada, J. Geophys. Res., 99,22,093–22,119, 1994.
Schwartz, D. P., and K. J. Coppersmith, Fault behavior and characteristicearthquakes; examples from the Wasatch and San Andreas fault zones,J.Geophys. Res., 89, 5681–5698, 1984.
Smith, R. B., and R. L. Bruhn, Intraplate extensional tectonics of the easternBasin-Range: Inferences on structural style from seismic reflection data,regional tectonics, and thermal-mechanical models of brittle-ductile de-formation, J. Geophys. Res., 89, 5733–5762, 1984.
Stuwe, K. L., and M. Hintermuller, Topography and isotherms revisited:The influence of laterally migrating drainage divides, Earth Planet. Sci.Lett., 184, 287–303, 2000.
Stuwe, K., L. White, and R. Brown, The influence of eroding topographyon steady-state isotherms. Applications to fission track analysis, EarthPlanet. Sci. Lett., 124, 63–74, 1994.
Swan, F. H., III, D. P. Schwartz, and L. S. Cluff, Recurrence of moderate tolarge magnitude earthquakes produced by surface faulting on the Wasatchfault zone, Utah, Bull. Seismol. Soc. Am., 70, 1431–1462, 1980.
ter Voorde, M., and G. Bertotti, Thermal effects of normal faulting duringrifted basin formation, 1, A finite difference model, Tectonophysics, 240,133–144, 1994.
van Wees, J. D., K. deJong, and S. Cloetingh, Two-dimensional P-T-tmodelling and the dynamics of extension and inversion in the BelticZone (SE Spain), Tectonophysics, 203, 305–324, 1992.
Wagner, G. A., and G. M. Reimer, Fission track tectonics; the tectonicinterpretation of fission track apatite ages, Earth Planet. Sci. Lett., 14,263–268, 1972.
Willett, S. D., Modelling thermal annealing of fission tracks in apatite, inMineralogical Association of America Short Course on Low TemperatureThermochronology: Techniques and Applications, edited by M. Zentilli,pp. 43–72, Mineral. Assoc. of Am., Washington, D. C., 1992.
Willett, S. D., Inverse modeling of annealing of fission tracks in apatite, 1,A controlled random search method, Am. J. Sci., 297, 939–969, 1997.
Wolf, R. A., K. A. Farley, and L. T. Silver, Helium diffusion and low-temperature thermochronometry of apatite, Geochim. Cosmochim. Acta,60, 4231–4240, 1996.
Wolf, R. A., K. A. Farley, and D. M. Kass, Modeling of the temperaturesensitivity of the apatite (U-Th)/He thermochronometer, Chem. Geol.,148, 105–114, 1998.
Yamada,R., T. Tagami, S.Nishimura, andH. Ito,Annealing kinetics of fissiontracks in zircon:An experimental study,Chem.Geol., 122, 249–258, 1995.
Zeitler, P. K., A. L. Herczig, I. McDougall, and M. Honda, U-Th-He datingof apatite: A potential thermochronometer, Geochim. Cosmochim, Acta,51, 2865–2868, 1987.
Zoback, M. L., Structure and Cenozoic tectonism along the Wasatch faultzone, Utah, in Tectonics and Stratigraphy of the Eastern Great Basin,
EHLERS ET AL.: EXHUMATION AND EROSION, WASATCH MOUNTAINS, UTAH ETG 12 - 17

edited by D. M. Miller, V. R. Todd, and K. A. Howard, Mem. Geol. Soc.Am., 157, 3–37, 1983.
�����������������������D. S. Chapman, Department of Geology and Geophysics, University of
Utah, 135 S., 1460 E., Salt Lake City, UT 84112, USA. ([email protected])
S. D. Willett, Department of Earth and Space Sciences, University ofWashington, Box 351310, Seattle, WA 98195, USA.P. A. Armstrong, Department of Geological Sciences, California State
University, Fullerton, P.O. Box 6850, Fullerton, CA 92834, USA.([email protected])T. A. Ehlers, Department of Geological Sciences, University of Michigan,
2534 C.C. Little Building, 425 East University, Ann Arbor, MI 48109-1063,USA. ([email protected])
ETG 12 - 18 EHLERS ET AL.: EXHUMATION AND EROSION, WASATCH MOUNTAINS, UTAH