Embed Size (px)
Citation preview

`
M aclay Bridge Planning Study
Prepared for: Montana Department of Transportation Helena, Montana
Prepared by: Robert Peccia & Associates Helena, Montana November 1, 2012
EXISTING AND PROJECTED CONDITIONS
FINAL

Maclay Bridge Planning Study
Existing and Projected Conditions November 1, 2012 i
TABLE OF CONTENTS
TABLE OF CONTENTS ................................................................................................................ I
ABBREVIATIONS / ACRONYMS ............................................................................................... IV
1.0 INTRODUCTION .................................................................................................................... 1 1.1. Previous Planning and Maintenance Efforts ...................................................................................... 1 1.2. Maclay Bridge Project Nomination ..................................................................................................... 2 1.3. Analysis Area ..................................................................................................................................... 2 1.4. History of Westside Bypass ............................................................................................................... 3 1.5. Committed and Planned Improvements ............................................................................................. 3
2.0 DEMOGRAPHICS .................................................................................................................. 5 2.1. Population Characteristics ................................................................................................................. 5 2.2. Employment and Income Characteristics .......................................................................................... 6
3.0 LOCAL PLANNING ................................................................................................................ 7 3.1. Transportation Planning ..................................................................................................................... 7
3.1.1. 2008 Missoula Long Range Transportation Plan ......................................................................................... 8 3.1.2. 2012 Missoula Long Range Transportation Plan ......................................................................................... 9
3.2. Non-Motorized Transportation Planning ............................................................................................ 9 3.2.1. Missoula 2011 Active Transportation Plan (MATP) ..................................................................................... 9
3.3. Transit Planning ................................................................................................................................. 9 3.3.1. Missoula Transit Development Plan ............................................................................................................ 9
3.4. Parks and Recreation Planning.......................................................................................................... 9 3.4.1. 2012 Missoula County Parks and Trails Master Plan .................................................................................. 9 3.4.2. Missoula Urban Area Open Space Plan 2006 Update ............................................................................... 10 3.4.3. 2004 Master Parks and Recreation Plan for the Greater Missoula Area ................................................... 10
3.5. Land Use Planning ........................................................................................................................... 10 3.5.1. Missoula County Growth Policy ................................................................................................................. 10 3.5.2. Missoula Urban Comprehensive Plan: 1998 Update ................................................................................. 11 3.5.3. Missoula Urban Fringe Development Area (UFDA) Project ....................................................................... 11 3.5.4. Target Range Neighborhood Plan ............................................................................................................. 12
3.6. Lolo National Forest Plan ................................................................................................................. 13
4.0 ROADWAY, BRIDGE AND PHYSICAL CHARACTERISTICS ............................................ 13 4.1. Existing Roadway Users .................................................................................................................. 13 4.2. Existing Traffic Data ......................................................................................................................... 13 4.3. Future Traffic Projections ................................................................................................................. 14
4.3.1. Historic Traffic Growth Rates ..................................................................................................................... 15 4.3.2. Future Traffic Modeling .............................................................................................................................. 15
4.4. Crash Analysis ................................................................................................................................. 18 4.4.1. Identifiable Crash Trends and Areas of Concern ....................................................................................... 19
4.5. Existing Travel Times ....................................................................................................................... 22 4.6. Design Standards ............................................................................................................................. 23 4.7. Roadway Geometrics ....................................................................................................................... 24
4.7.1. Horizontal Alignment.................................................................................................................................. 25 4.7.2. Vertical Alignment ...................................................................................................................................... 25 4.7.3. Roadside Clear Zone ................................................................................................................................. 25
4.8. Bridge Considerations ...................................................................................................................... 26

Maclay Bridge Planning Study
Existing and Projected Conditions November 1, 2012 ii
4.8.1. Sufficiency Rating ...................................................................................................................................... 28 4.8.2. Bridge Health Index ................................................................................................................................... 29 4.8.3. Fracture Critical Status .............................................................................................................................. 30
4.9. Parking Considerations .................................................................................................................... 30 4.10. Roadway Surfacing ........................................................................................................................ 32 4.11. Access Points ................................................................................................................................. 33 4.12. Right-of-Way .................................................................................................................................. 33 4.13. Hydraulics ....................................................................................................................................... 33
4.13.1. Floodplain Considerations ....................................................................................................................... 34 4.13.2. Preliminary Hydrology.............................................................................................................................. 34 4.13.3. Channel Characteristics ........................................................................................................................... 35
4.14. Transit Service ............................................................................................................................... 35 4.15. Utilities ............................................................................................................................................ 35
5.0 ENVIRONMENTAL SETTING .............................................................................................. 35 5.1. Geographic Setting .......................................................................................................................... 36
5.1.1. Land Ownership and Land Management ................................................................................................... 36 5.1.2. Land Use ................................................................................................................................................... 36
5.2. Physical Resources .......................................................................................................................... 36 5.2.1. Geologic Resources .................................................................................................................................. 36 5.2.2. Soils and Prime Farmland ......................................................................................................................... 36 5.2.3. Water Resources ....................................................................................................................................... 36 5.2.4. Wetlands .................................................................................................................................................... 37 5.2.5. Floodplains (EO 11988) and Floodways .................................................................................................... 37 5.2.6. Hazardous Material ................................................................................................................................... 38 5.2.7. Air Quality .................................................................................................................................................. 38 5.2.8. Noise ......................................................................................................................................................... 38
5.3. Visual Resources ............................................................................................................................. 39 5.4. Biological Resources ........................................................................................................................ 39
5.4.1. Wildlife and Fish ........................................................................................................................................ 39 5.4.2. Threatened and Endangered Wildlife Species ........................................................................................... 40 5.4.3. Montana Animal Species of Concern ........................................................................................................ 41 5.4.4. Vegetation ................................................................................................................................................. 42
5.5. Cultural and Archaeological Resources ........................................................................................... 43 5.5.1. 4(f) Resources ........................................................................................................................................... 44 5.5.2. 6(f) Resources ........................................................................................................................................... 45
6.0 CONCLUSION ...................................................................................................................... 46 6.1. Transportation System ..................................................................................................................... 46 6.2. Environmental Considerations Within Environmental Scan Boundary ............................................ 47 6.3. Other Considerations ....................................................................................................................... 49
APPENDIX A: FIELD REVIEW PHOTO LOG
APPENDIX B: MACLAY BRIDGE INSPECTION REPORT
APPENDIX C: MISSOULA COUNTY PARKING RESOLUTIONS
APPENDIX D: HOURLY TRAFFIC VOLUMES – RIVER PINES ROAD
Maclay Bridge Planning Study
Existing and Projected Conditions November 1, 2012 iii
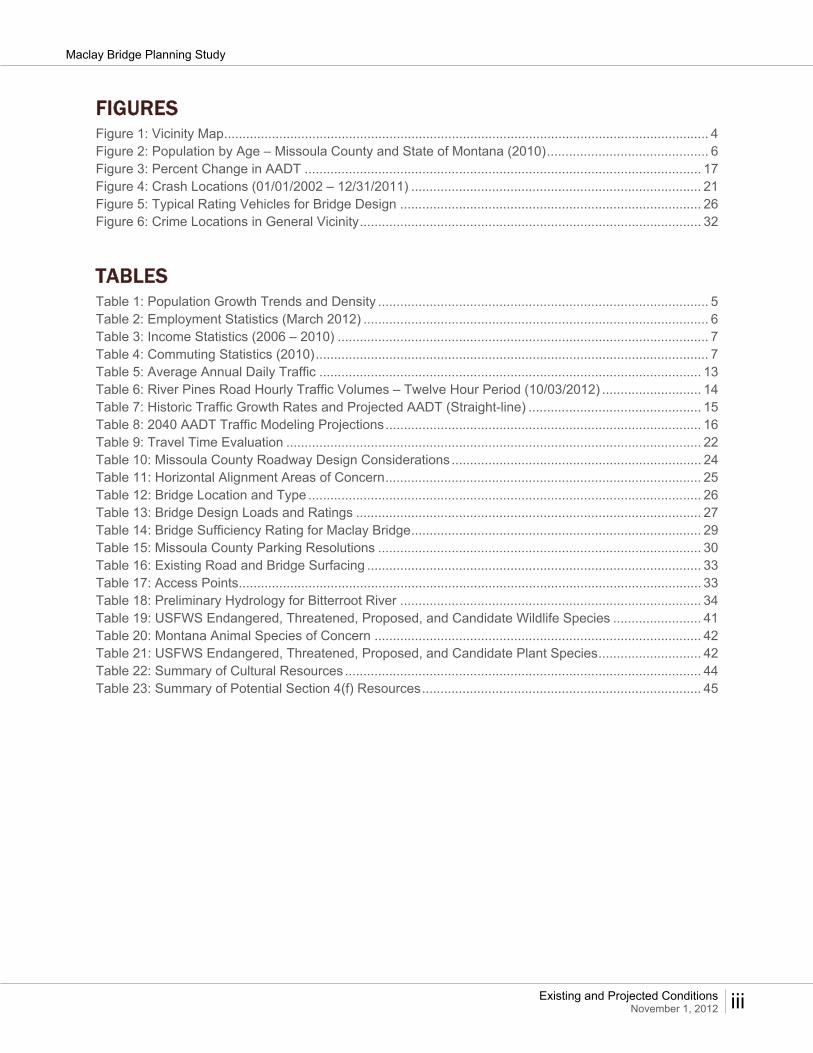
FIGURES Figure 1: Vicinity Map .................................................................................................................................... 4 Figure 2: Population by Age – Missoula County and State of Montana (2010) ............................................ 6 Figure 3: Percent Change in AADT ............................................................................................................ 17 Figure 4: Crash Locations (01/01/2002 – 12/31/2011) ............................................................................... 21 Figure 5: Typical Rating Vehicles for Bridge Design .................................................................................. 26 Figure 6: Crime Locations in General Vicinity ............................................................................................. 32
TABLES Table 1: Population Growth Trends and Density .......................................................................................... 5 Table 2: Employment Statistics (March 2012) .............................................................................................. 6 Table 3: Income Statistics (2006 – 2010) ..................................................................................................... 7 Table 4: Commuting Statistics (2010) ........................................................................................................... 7 Table 5: Average Annual Daily Traffic ........................................................................................................ 13 Table 6: River Pines Road Hourly Traffic Volumes – Twelve Hour Period (10/03/2012) ........................... 14 Table 7: Historic Traffic Growth Rates and Projected AADT (Straight-line) ............................................... 15 Table 8: 2040 AADT Traffic Modeling Projections ...................................................................................... 16 Table 9: Travel Time Evaluation ................................................................................................................. 22 Table 10: Missoula County Roadway Design Considerations .................................................................... 24 Table 11: Horizontal Alignment Areas of Concern ...................................................................................... 25 Table 12: Bridge Location and Type ........................................................................................................... 26 Table 13: Bridge Design Loads and Ratings .............................................................................................. 27 Table 14: Bridge Sufficiency Rating for Maclay Bridge ............................................................................... 29 Table 15: Missoula County Parking Resolutions ........................................................................................ 30 Table 16: Existing Road and Bridge Surfacing ........................................................................................... 33 Table 17: Access Points .............................................................................................................................. 33 Table 18: Preliminary Hydrology for Bitterroot River .................................................................................. 34 Table 19: USFWS Endangered, Threatened, Proposed, and Candidate Wildlife Species ........................ 41 Table 20: Montana Animal Species of Concern ......................................................................................... 42 Table 21: USFWS Endangered, Threatened, Proposed, and Candidate Plant Species ............................ 42 Table 22: Summary of Cultural Resources ................................................................................................. 44 Table 23: Summary of Potential Section 4(f) Resources ............................................................................ 45

Maclay Bridge Planning Study
Existing and Projected Conditions November 1, 2012 iv
ABBREVIATIONS / ACRONYMS
AASHTO American Association of State Highway Transportation Officials
ADT Average Daily Traffic
AADT Average Annual Daily Traffic
AAGR Average Annual Growth Rate
APE Area of Potential Effect
CFR Code of Federal Regulations
cfs Cubic Feet per Second
CLOMR Conditional Letter of Map Revision
CRABS Cultural Resources Annotated Bibliography Search
CRIS Cultural Resources Information System
DHV Design Hourly Vehicle
DNRC Department of Natural Resources and Conservation
DOI Department of Interior
EA Environmental Assessment
ESA Endangered Species Act
FAS Fishing Access Site
FEMA Federal Emergency Management Agency
FHWA Federal Highway Administration
FIRM Flood Insurance Rate Maps
FIS Flood Insurance Study
FONSI Finding of No Significant Impact
FPPA Farmland Protection Policy Act
GIS Geographic Information System
LOMR Letter of Map Revision
LRTP Long Range Transportation Plan
LUST Leaking Underground Storage Tank
LWCF Land and Water Conservation Funds
MAAQS Montana Ambient Air Quality Standards
MATP Missoula Active Transportation Plan
MDEQ Montana Department of Environmental Quality
MDT Montana Department of Transportation
MEPA Montana Environmental Policy Act
MFWP Montana Department of Fish, Wildlife, and Parks

Maclay Bridge Planning Study
Existing and Projected Conditions November 1, 2012 v
MNHP Montana Natural Heritage Program
mph Miles per Hour
MPO Metropolitan Planning Organization
MSAT Mobile Source Air Toxics
mton Metric Ton
MUTD Missoula Urban Transportation District
NAAQS National Ambient Air Quality Standards
NEPA National Environmental Policy Act
NPL National Priority List
NPS National Park Service
NRCS Natural Resource Conservation Service
NRHP National Register of Historic Places
NRIS Natural Resource Information System
OPG Office of Planning and Grants
PM Particulate Matter
RDM Road Design Manual
TDM Travel Demand Model
TDP Transit Development Plan
TIP Transportation Improvement Program
TMDL Total Maximum Daily Load
TPCC Transportation Policy Coordinating Committee
USACOE U.S. Army Corps of Engineers
UFDA Urban Fringe Development Area
UPN Uniform Project Number
UPWP Unified Planning Work Program
URSA Urban Service Area
USACOE U.S. Army Corps of Engineers
USEPA U.S. Environmental Protection Agency
USFS U.S. Forest Service
USFWS U.S. Fish and Wildlife Service
USGS U.S. Geological Service
UST Underground Storage Tank
vpd Vehicles per Day
Section 4(f) Section 4(f) of the 1966 Department of Transportation Act
Section 6(f) Section 6(f) of the National Land and Water Conservation Funds Act

Maclay Bridge Planning Study
Existing and Projected Conditions November 1, 2012 1
EXISTING AND PROJECTED CONDITIONS
1.0 INTRODUCTION The North Avenue Bridge, known locally and referred to hereafter as the Maclay Bridge, is a single-lane structure located west of the City of Missoula. The Maclay Bridge crosses the Bitterroot River approximately 2.75 miles west of Reserve Street. North Avenue connects to the existing bridge as the eastern approach, and River Pines Road serves as its western approach.
The intent of the Existing and Projected Conditions report is to identify existing and projected conditions associated with the Maclay Bridge and surrounding area and to highlight relevant environmental factors with the potential to influence the development of improvement options. This report is a high-level planning analysis aimed at identifying constraints and opportunities related to the potential rehabilitation, reconstruction or replacement of the Maclay Bridge.
1.1. PREVIOUS PLANNING AND MAINTENANCE EFFORTS In 1994, an Environmental Assessment (EA) for the Maclay Bridge Site Selection Study1 was completed defining the purpose and need for a project at the Maclay Bridge, identifying potential alternatives, and assessing impacts of the various alternatives identified to address the project’s purpose and need. Sixteen (16) alternatives were initially considered in the EA including:
Bridge rehabilitation or bridge replacement (one-lane structure) at the current location; Numerous alternatives that would provide a new two-lane bridge elsewhere; and A “No Build” alternative.
Through a screening process, four alternatives were advanced for further consideration and a “Preferred Alternative” was identified. The Preferred Alternative was described in the EA as follows:
“A new two-lane (one lane for each direction of traffic) bridge constructed over the Bitterroot River which connects River Pines Road on the west side to South Avenue West on the east side. The Preferred Alternative includes increasing the number of lanes on the bridge from one lane (existing) to two lanes (proposed). The bridge cross section includes adequate shoulders for bicycle travel and a separated pedestrian walkway.”
A Finding of No Significant Impact (FONSI) on the 1994 EA was never issued by the Federal Highway Administration (FHWA) and the Preferred Alternative from the EA was not advanced due to lack of funding. Even though the 1994 EA was completed and approved for circulation, a decision document (i.e. FONSI) was not issued, rendering the NEPA process incomplete. FHWA views a signed FONSI as the NEPA decision document for a project evaluated and advanced with an EA. Missoula County had intended to use special project demonstration funds from Congress to implement the project but was unsuccessful in obtaining the funding. The Maclay Bridge replacement project was inactive until the County nominated it to receive funding from MDT’s off-system bridge program in 2002. Minor maintenance activities have been performed on the bridge at various times since the completion of the 1994 EA. These have included the following:
1 Maclay Bridge Site Selection Study Environmental Assessment, Carter & Burgess Inc., April 1994

Maclay Bridge Planning Study
Existing and Projected Conditions November 1, 2012 2
The west bridge abutment was armored with material in anticipation of high water conditions during Spring run-off (April, 1997);
The existing timber deck was replaced with corrugated steel decking and an asphalt overlay. In addition, bearings were replaced and/or added, and steel curbing was placed to prevent vehicular damage to pedestrian rail and truss elements (2003);
The expansion joints at the west abutment were modified, as the expansion joint installed with the 2003 deck replacement were found to be inadequate and in need of mitigation (2004); and
The expansion joint between the main truss and the pony truss was modified, as the expansion joint installed with the 2003 deck replacement were found to be inadequate and in need of mitigation (2005).
Many of the underlying issues previously identified as deficiencies (and reasons for proposing transportation improvements) in the 1994 EA and subsequent safety inspections remain. This, coupled with the community’s ongoing interest in the Maclay Bridge and possible changes in traffic patterns resulting from potential improvements, served as the reason for initiating the Maclay Bridge Planning Study.
1.2. MACLAY BRIDGE PROJECT NOMINATION Missoula County has nominated the Maclay Bridge for replacement under the Montana Department of Transportation Off-System Bridge Program (formerly known as the Highway Bridge Replacement and Rehabilitation Program). Funds for the program are derived from the Federal gas tax, which is outside Federal general revenue sources and doesn’t impact or add to the Federal deficit. Funds are Federally apportioned to Montana under the provisions of the current highway bill, MAP-21. MAP-21 requires a minimum percentage of the funding be used for off-system bridges. In general, projects are funded with 86.58% Federal and the State is responsible for the remaining 13.42%. The State share is funded through the Highway State Special Revenue Account. Because the Maclay Bridge is an “off-system” facility, it falls under the category of the “Off-System Bridge Program”.
MDT conducts a condition inspection of off-system bridges on a two-year cycle. The condition inspection provides information used to calculate the Sufficiency Rating (SR). The SR formula is the industry standard method of evaluating bridge data to obtain a numeric value indicating the sufficiency of the bridge to remain in service. The sufficiency rating is expressed by a value ranging from 0 to 100 with 100 being an entirely sufficient bridge and 0 being an entirely deficient bridge.
The condition inspection information is also used to classify the bridges as either “Not Deficient”, Structurally Deficient” or “Functionally Obsolete” (further explained in Section 4.8.1).
Procedures for selecting bridges for inclusion into this program are based on a ranking system that weighs various elements of a structure condition, usage alternate routes, and considers local priorities. Safety and economic impacts are considerations in the selection process.
MDT periodically asks each county for Off-System bridge nominations. In 2006, the Maclay Bridge was Missoula County’s number one priority.
1.3. ANALYSIS AREA Existing and projected conditions were analyzed in the greater area west of Reserve Street which is most likely to be affected by a potential upgrade, reconstruction or replacement of the Maclay Bridge. For the purposes of the Environmental Scan, an “Environmental Scan Boundary” was established to encompass

Maclay Bridge Planning Study
Existing and Projected Conditions November 1, 2012 3
an expanded area around the Maclay Bridge to include the areas potentially affected by the alternative options considered in the 1994 EA.
A vicinity map showing the location of the Maclay Bridge, the Environmental Scan Boundary, and the surrounding area is shown as Figure 1.
1.4. HISTORY OF WESTSIDE BYPASS Several studies and resultant documents have been prepared over the last five decades relative to a potential bypass route west of Missoula. This route, commonly referred to as the Westside Bypass, has been the subject of much interest and debate. The studies and discussions concluded that the Westside Bypass is not feasible due to a variety of factors. In terms of this specific planning study, the Westside Bypass concept is not a consideration nor is it a factor in this study’s development. Planning exercises and their brief highlights are listed below:
1965 MISSOULA AREA TRANSPORTATION PLAN This planning document included the first presentation of a Westside Bypass. The general route identified included a route proceeding south from the Wye area across the Harper’s Bridge site, and then follow Big Flat and Blue Mountain Roads to US Highway 93 southwest of Missoula.
1980 RESERVE STREET PLAN The Reserve Street Plan concluded that a Westside Bypass would not serve local traffic very well, and would add additional miles of travel and generate impacts on the rural character of Grass Valley and Big Flat. Accordingly, the Westside Bypass was dismissed as a feasible route, and efforts were placed on expansion of Reserve Street.
2007 FEASIBILITY WORKSHOP A feasibility workshop was held in 2007 at the request of the community and came out of the MPO. A consultant was hired to examine a Westside Bypass and it was concluded not to be feasible due to the presence of 4(f) and 6(f) properties.
1.5. COMMITTED AND PLANNED IMPROVEMENTS There are currently three committed and planned improvements designated within the general vicinity of the Maclay Bridge. They are in varying stages of development, and are summarized as follows:
River Pines Road HSIP 32(80) - MDT has a planned safety improvement project at the intersection of River Pines Road and Riverside Drive on the western side of the Maclay Bridge. The project is intended to address an existing crash trend identified by MDT Safety Engineering and includes the installation of an overhead light at the intersection, a single arrow board, and the replacement of the “Dead End” and street name sign.
Blue Mountain Road STPHS 32(47) - MDT is developing this safety improvement project that involves the reconstruction and re-alignment, with a larger radius, of a curve on Blue Mountain Road located 0.3 miles south of the intersection of Blue Mountain Road, O’Brien Creek Road, and River Pines Road. The project will involve environmental documentation, right-of-way acquisition, utility relocation, and potential geotechnical considerations to mitigate the crash trends relative to the horizontal alignment.

Maclay Bridge Planning Study
Existing and Projected Conditions November 1, 2012 4
Figure 1: Vicinity Map
Maclay Bridge Planning Study
Existing and Projected Conditions November 1, 2012 5
Clements Road and 3rd Street UPP 8199(99) – MDT is developing this pavement preservation project to extend the service life of Clements Road. Clements Road will be milled and given an asphalt overlay, between South Avenue and Seventh Street. The remainder of Clements Road will be chip sealed. Replacement of the pavement markings and signing will also be included.
2.0 DEMOGRAPHICS This section provides an overview of social, economic, and land use characteristics for the area. Historic and recent trends in area demographics help define existing conditions and aid forecasting techniques as there is a direct correlation between motor vehicle travel and socio-economic indicators.
Demographic and socio-economic information was reviewed to help understand recent trends in population, age distribution, employment, economic status, and commuting for area residents. Note that socio-economic data sources often lag considerably behind the actual years of interest. This analysis presents the most recent data and statistics available and describes recent and potential changes in the area.
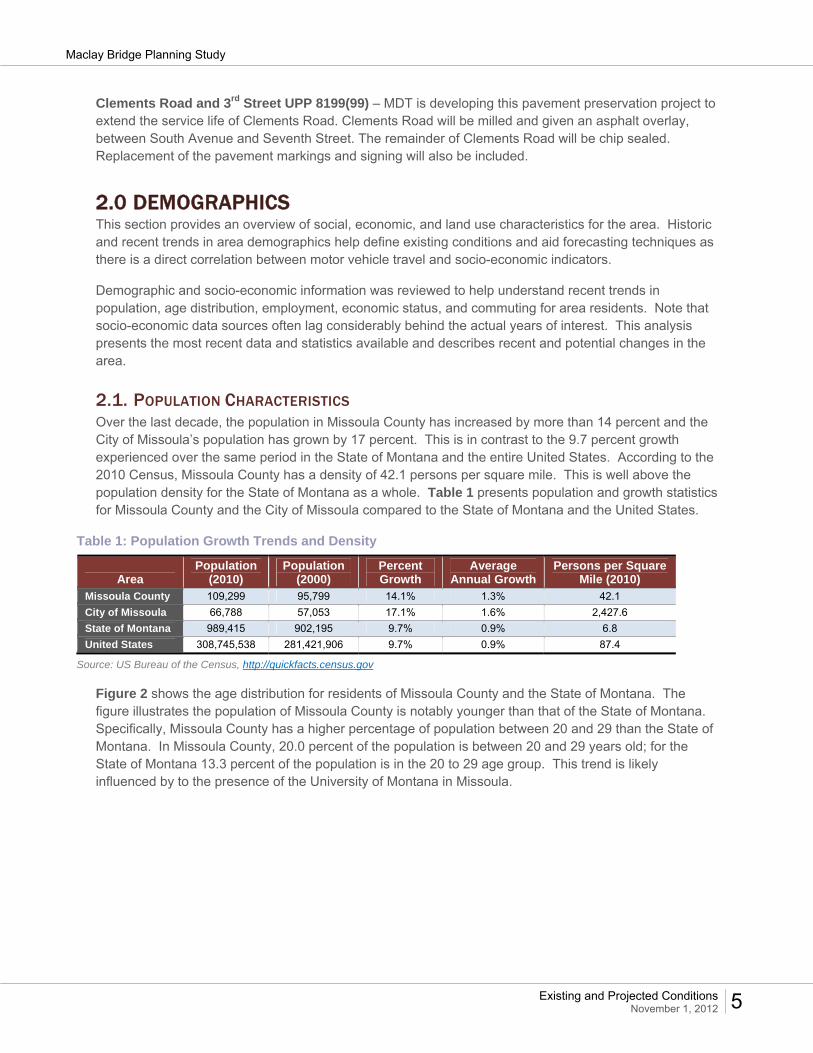
2.1. POPULATION CHARACTERISTICS Over the last decade, the population in Missoula County has increased by more than 14 percent and the City of Missoula’s population has grown by 17 percent. This is in contrast to the 9.7 percent growth experienced over the same period in the State of Montana and the entire United States. According to the 2010 Census, Missoula County has a density of 42.1 persons per square mile. This is well above the population density for the State of Montana as a whole. Table 1 presents population and growth statistics for Missoula County and the City of Missoula compared to the State of Montana and the United States.
Table 1: Population Growth Trends and Density
Area Population
(2010) Population
(2000) Percent Growth
Average Annual Growth
Persons per Square Mile (2010)
Missoula County 109,299 95,799 14.1% 1.3% 42.1
City of Missoula 66,788 57,053 17.1% 1.6% 2,427.6
State of Montana 989,415 902,195 9.7% 0.9% 6.8
United States 308,745,538 281,421,906 9.7% 0.9% 87.4
Source: US Bureau of the Census, http://quickfacts.census.gov
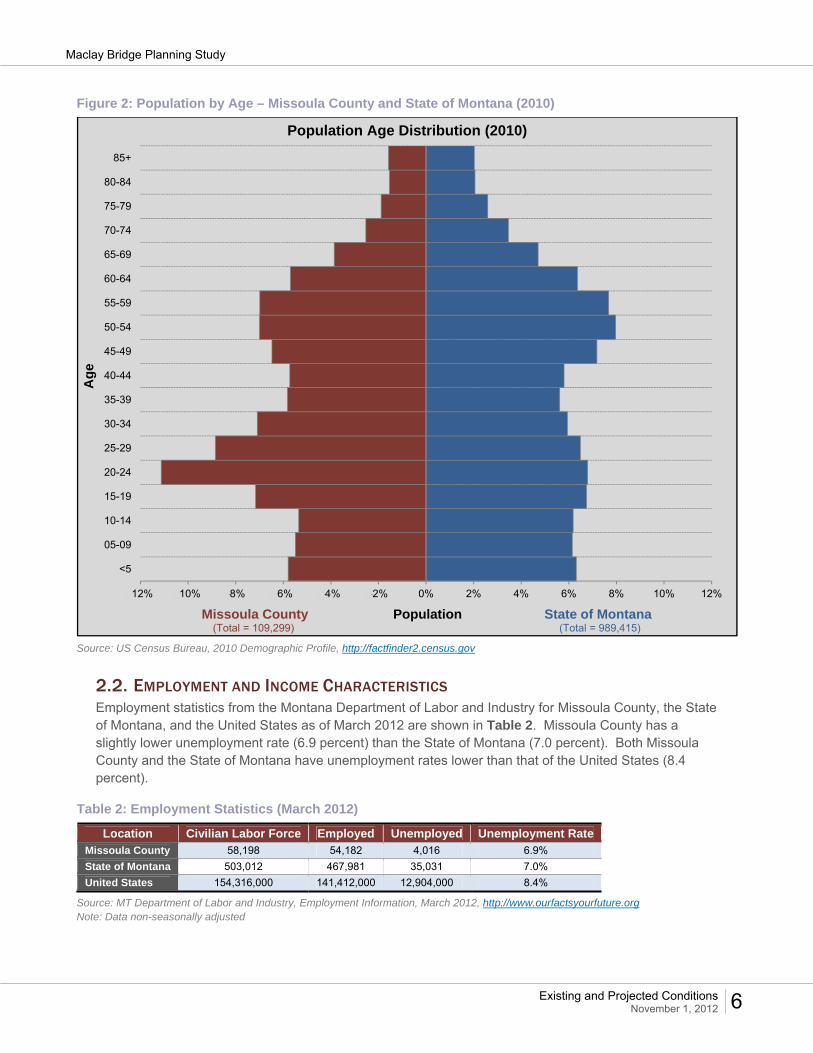
Figure 2 shows the age distribution for residents of Missoula County and the State of Montana. The figure illustrates the population of Missoula County is notably younger than that of the State of Montana. Specifically, Missoula County has a higher percentage of population between 20 and 29 than the State of Montana. In Missoula County, 20.0 percent of the population is between 20 and 29 years old; for the State of Montana 13.3 percent of the population is in the 20 to 29 age group. This trend is likely influenced by to the presence of the University of Montana in Missoula.
Maclay Bridge Planning Study
Existing and Projected Conditions November 1, 2012 6
Figure 2: Population by Age – Missoula County and State of Montana (2010)
Source: US Census Bureau, 2010 Demographic Profile, http://factfinder2.census.gov
2.2. EMPLOYMENT AND INCOME CHARACTERISTICS Employment statistics from the Montana Department of Labor and Industry for Missoula County, the State of Montana, and the United States as of March 2012 are shown in Table 2. Missoula County has a slightly lower unemployment rate (6.9 percent) than the State of Montana (7.0 percent). Both Missoula County and the State of Montana have unemployment rates lower than that of the United States (8.4 percent).
Table 2: Employment Statistics (March 2012)
Location Civilian Labor Force Employed Unemployed Unemployment Rate Missoula County 58,198 54,182 4,016 6.9%
State of Montana 503,012 467,981 35,031 7.0%
United States 154,316,000 141,412,000 12,904,000 8.4%
Source: MT Department of Labor and Industry, Employment Information, March 2012, http://www.ourfactsyourfuture.org Note: Data non-seasonally adjusted
-12% -10% -8% -6% -4% -2% 0% 2% 4% 6% 8% 10% 12%
<5
05-09
10-14
15-19
20-24
25-29
30-34
35-39
40-44
45-49
50-54
55-59
60-64
65-69
70-74
75-79
80-84
85+
Missoula County Population State of Montana(Total = 109,299) (Total = 989,415)
Ag
e
Population Age Distribution (2010)

Maclay Bridge Planning Study
Existing and Projected Conditions November 1, 2012 7
According to the 2006 – 2010 American Community Survey five-year estimates, median household income levels for Missoula County and City of Missoula residents were below those for the State of Montana and the United States. Per capita income levels for Missoula County were higher than the State of Montana and lower than the United States. Missoula County and the City of Missoula have a higher percentage of persons living below poverty than the State of Montana and United States. The income statistics data is summarized in Table 3.
Table 3: Income Statistics (2006 – 2010)
Area Median Household
Income Per Capita
Income Persons Below
Poverty Level (%) Missoula County $42,887 $24,343 17.30%
City of Missoula $36,547 $22,543 22.10%
State of Montana $43,872 $23,836 14.50%
United States $51,914 $27,334 13.80%
Source: US Bureau of the Census, American Community Survey 2006-2010, http://factfinder2.census.gov
Table 4 presents 2010 commuting statistics from the American Community Survey. According to the data, Missoula County residents are more likely to walk or commute to work by other means than are residents of the State of Montana or nation. Mean travel time to work is lower for Missoula County residents than for residents of the State of Montana and United States as a whole.
Table 4: Commuting Statistics (2010)
Subject Missoula County City of Missoula State of Montana United States
Workers 16 years and over 56,103 35,430 459,904 136,941,010
Car, truck, or van -- drove alone 41,152 73.4% 24,157 68.2% 347,835 75.6% 104,857,517 76.6%
Car, truck, or van -- carpooled 4,795 8.5% 3,284 9.3% 44,652 9.7% 13,266,356 9.7%
Public transportation (excluding taxicab) 1,168 2.1% 1,090 3.1% 3,856 0.8% 6,768,661 4.9%
Walked 3,181 5.7% 2,579 7.3% 23,813 5.2% 3,797,048 2.8%
Other means 2,423 4.3% 2,094 5.9% 9,636 2.1% 2,327,228 1.7%
Worked at home 3,384 6.0% 2,226 6.3% 30,112 6.5% 5,924,200 4.3%
Mean travel time to work (minutes) 18.0 16.3 18.6 25.3
Source: US Census Bureau, 2010 American Community Survey, http://factfinder2.census.gov
3.0 LOCAL PLANNING Missoula County and the City of Missoula have a cooperative agreement in place to conduct planning based on the shared environmental, economic, aesthetic, and social values of city and county residents. The agreement created a City-County Office of Planning and Grants (OPG) which is responsible for land use permitting, long range planning, transportation planning, historic preservation, housing, and a variety of other programs.
3.1. TRANSPORTATION PLANNING When Missoula’s urbanized area population exceeded 50,000, a Metropolitan Planning Organization (MPO) was created and designated to oversee the regional transportation planning and federal transportation funding within the area. The Missoula Transportation Policy Coordinating Committee (TPCC) is the policy making body for the MPO. The Transportation Division of the OPG performs transportation planning functions for the MPO.

Maclay Bridge Planning Study
Existing and Projected Conditions November 1, 2012 8
The MPO is responsible for transportation planning and programming through the following federally required activities:
Unified Planning Work Program (UPWP); Transportation Improvement Program (TIP); and Long Range Transportation Plan (LRTP).
The UPWP is a document prepared each year by the MPO describing transportation planning activities to be conducted during the Federal fiscal year. The Missoula TIP, also updated annually, contains a five-year program of transportation projects and programs to be carried out within the Missoula MPO planning area. The TIP lists projects according to amount and source of funds to be spent for each project within the planning boundary. The Missoula Federal Fiscal Year 2011-2015 TIP includes a project named “Bitterroot River W of MSL” on the list of Bridge Replacement and Bridge Rehab projects within the MPO planning area; however, the project does not have an assigned estimated cost or program schedule.
The LRTP is a planning document intended to establish a vision of transportation investments and how future spending should be allocated over the long term within the planning area. Missoula's MPO updates the LRTP every four years, based on a 20+-year projection of transportation conditions and needs in the MPO planning area. The current version of the LRTP is discussed below.
3.1.1. 2008 Missoula Long Range Transportation Plan The 2008 Missoula Long Range Transportation Plan, adopted in November 2008, contains a list of projects and programs representing all modes of surface transportation through 2035. The LRTP is “fiscally constrained” meaning the total estimated cost of the planned improvements cannot exceed anticipated levels of Federal, state and local funding for the planning period. The LRTP also contains “illustrative projects” that are unfunded but have been included by state or local partners for future consideration if and when funding becomes available.
The 2008 Missoula Long Range Transportation Plan reflects the results of an extensive community visioning process (known as “Envision Missoula”) designed to link transportation and land use planning within the urban area. The process identified several future growth scenarios for an area population of 200,000 with different associated patterns of regional development and supporting transportation infrastructure to the year 2035. The preferred growth scenario—designated as the “Focus Inward Scenario”—reflects a community vision to manage travel demand by bringing together activities into one highly concentrated downtown area linked by a multi-modal corridor from Lolo to downtown Missoula. The scenario was based on the assumption that the number of households in the urban area will increase by 37% between 2007 and 2035 and that the majority of new trips in the Missoula area would occur in pockets of growth either downtown, or in other existing areas of Missoula.2
The 2008 LRTP analyzes the performance of the existing transportation system and identifies a package of improvements intended to meet Missoula’s existing and projected transportation needs. Projects included in the plan are categorized into Committed (those with obligated funds), Recommended (funded) and Illustrative (unfunded potential future projects). The LRTP identifies the North Avenue Bridge Replacement (Maclay Bridge) as a “Recommended Roadway Capacity Project” (LRTP, page 4-13) to be funded by State/Federal Off-System Bridge Funds.
2 Missoula 2008 Long Range Transportation Plan, December 18, 2008, page 3-4 & Envision Missoula Planning Summit Report, September 2008, page 37.

Maclay Bridge Planning Study
Existing and Projected Conditions November 1, 2012 9
3.1.2. 2012 Missoula Long Range Transportation Plan An updated LRTP should be finalized by the end of 2012. LSA Associates—in partnership with Cambridge Systematics and Crandall Arambula—was retained by the MPO to help update the 2008 LRTP.
3.2. NON-MOTORIZED TRANSPORTATION PLANNING
3.2.1. Missoula 2011 Active Transportation Plan (MATP)
The 2011 Missoula Active Transportation Plan (MATP) replaces the 2001 Non‐Motorized Transportation Plan and was adopted by the Missoula City Council and the Missoula County Commissioners in June 2011. The MATP presents a long-term vision for the bicycle and pedestrian components of the community’s multi‐modal transportation system. The document recommends new policies and designs and provides a list of proposed projects from which the MPO can draw from for bicycle and pedestrian infrastructure in the MPO planning area.
The MATP acknowledges use of the Maclay Bridge crossing by pedestrians and bicyclists and notes existing multi-use trails along North Avenue, South Avenue, Humble Road (between North and South Avenues) Clements and Spurgin Roads, and South 7th Street West. The document identifies a desirable future trail corridor for pedestrians and bicyclists across the Bitterroot River along South Avenue.
3.3. TRANSIT PLANNING
3.3.1. Missoula Transit Development Plan The Missoula Urban Transportation District (MUTD), established in 1976, operates the Mountain Line bus system. A Transit Development Plan (TDP)—a strategic guide for public transportation in the MUTD—is prepared and annually updated by Mountain Line. The TDP describes existing facilities and transit projects needed over a five-year planning horizon and relevant projects and activities are incorporated into the Missoula TIP. Mountain Line also operates para-transit service, a Senior Van, and provides transportation for special events.
The Mountain Line operates twelve fixed routes within the Missoula area. Mountain Line’s Route 9 includes portions of South Avenue, Clements Road, and South 7th Avenue in the Study Area. Public transit service to and from downtown Missoula is available from 7:00 am to 7:30 pm Monday through Friday and from 10:00 am to 6:00 pm on Saturdays. A designated bus stop exists at the Target Range School near the intersection of South Avenue and Clements Road.
The TDP for Fiscal Years 2010-2014 does not identify any specific projects in the Study Area. The document does note the potential for service improvements in the Lower Miller Creek and Lolo areas.
3.4. PARKS AND RECREATION PLANNING
3.4.1. 2012 Missoula County Parks and Trails Master Plan The Missoula County Parks and Trails Master Plan guides the administration and management of park and recreational lands in Missoula County. The County recently completed an update to the 1997 County Parks and Conservation Land Plan. The updated plan was adopted by the Missoula County Park Board in early 2012.

Maclay Bridge Planning Study
Existing and Projected Conditions November 1, 2012 10
The Master Plan includes a trails component and reflects broad community support for development of natural surface hiking and bicycle trails, paved commuter trails, river access sites, and preservation of natural areas and wildlife habitats.
3.4.2. Missoula Urban Area Open Space Plan 2006 Update This plan was first adopted by the City and County of Missoula in 1995 and was updated in 2006. The plan envisions a trail system "to provide recreational opportunities and help further facilitate non‐motorized transportation as a viable option for more people in and around the City." The priorities listed include extending and filling in gaps for existing trails and extending commuter/recreational trails in various portions of the Missoula Valley.
The document identifies the presence of important conservation and recreational lands in the Target Range area including the Bitterroot and Clark Fork Rivers, the Kelly Island Fishing Access Site, and the Blue Mountain Recreation Area.
3.4.3. 2004 Master Parks and Recreation Plan for the Greater Missoula Area The Master Parks and Recreation Plan for the Greater Missoula Area, adopted in May 2004, was intended to provide a long-term vision for land use as it relates to parks, trails, open spaces, conservation lands, urban forest, and recreation facilities in the Missoula Urban Area. The area covered by the plan included the City of Missoula and an area approximately 3 miles beyond the City limits. The plan establishes the desired Level of Service for parkland acreage, sets forth standards for developed parks, and adopts numerous goals, policies, and action items to increase the quantity and quality of parks.
The plan acknowledged the public parklands, recreation sites, and conservation lands in the general area but did not make specific recommendations that would be relevant to the planning study. The plan also supported recommendations made in other planning documents of the time regarding non-motorized transportation in the urban area.
3.5. LAND USE PLANNING Land use planning within the area is guided by several plans including the Target Range Neighborhood Plan, the Missoula Urban Area Comprehensive Plan: 1998 Update, and the Missoula County Growth Policy, 2005 Update (amended in March 2010). Areas outside the designated Target Range Neighborhood Plan boundary are governed by the Comprehensive Plan and the Growth Policy. These documents are discussed in the following sections.
3.5.1. Missoula County Growth Policy A growth policy is an official public document adopted and used by Montana local governments as a general guide for decisions about the community’s physical development. The document is not regulatory; it serves as an official statement of public policy to guide growth and manage change for the betterment of the community. It establishes the legal and philosophical foundation upon which future plans and regulations will be based. State law requires growth policies contain several notable elements including:
Community goals and objectives; Information about existing conditions and trends; A description of the policies, regulations, and other tools to be implemented in order to
achieve the identified goals and objectives; and A strategy for development, maintenance, and replacement of public infrastructure.

Maclay Bridge Planning Study
Existing and Projected Conditions November 1, 2012 11
Missoula County first adopted its Growth Policy in 2002 and an update to the document was subsequently made in 2005. Most recently, the Missoula County Growth Policy was amended by the Board of County Commissioners in March 2010. A prevalent theme of the most recent update was identifying actions and strategies to address the effects of rapid community growth and development. The Growth Policy notes that “a primary objective of managing growth is to ensure the availability and affordability of infrastructure such as sewer, water, transportation, public safety, health and social services, public lands, parks, and other open spaces, cultural resources, and education. Adequate infrastructure is essential to a healthy, natural, economic, and social environment in Missoula County.”
Long-range transportation planning is recognized as one of many important implementation tools for helping to meet the goals and objectives outlined in the Growth Policy.
3.5.2. Missoula Urban Comprehensive Plan: 1998 Update The Missoula Urban Comprehensive Plan: 1998 Update, is a policy document that provides the Missoula County and the City of Missoula and other agencies and districts with a coordinated guide for managing long-term growth and development. The urban area as defined by the Plan includes the Missoula Valley and the Lolo area. The plan recommends the development of planning policies, programs and regulatory tools in response to a “Growth Management Themes Document” for the urban area adopted in 1994 and revised in 1996. The growth management themes, developed by a Growth Management Task Force formed in 1994, are intended to help guide and manage growth in the Missoula urban area and address a range of identified urban growth issues.
Land uses identified in the Missoula Urban Comprehensive Plan: 1998 Update for the Maclay Bridge and Target Range area are residential (2 dwelling units per acre) and parks and open space along the Bitterroot and Clark Fork river corridors.
3.5.3. Missoula Urban Fringe Development Area (UFDA) Project The Missoula OPG Urban Initiatives Division undertook its Urban Fringe Development Area (UFDA) Project during 2007 to provide City and County governments with a regional context for making decisions about residential growth on the edges of the City of Missoula. Growth trends suggest that the Missoula Urban Service Area (URSA) could see as many as 15,000 new residential units by 2030. The Missoula Urban Service Area is the same in geographic extent as the Missoula City Waste Water Service Boundary and includes lands in the City of Missoula and unincorporated Missoula County land. The Target Range Neighborhood lies within the URSA.
The goal of the project was to identify how an estimated 15,000 new residential units can be accommodated within the URSA and develop implementation strategies for addressing growth in accordance with adopted policies applicable to the areas. Four growth scenarios were prepared by OPG to describe the number and locations of anticipated new dwelling units, including already entitled lots. Each scenario presented varying growth plans in fourteen “neighborhoods” within the URSA.
OPG staff ultimately recommended the “Focus Inward Scenario” in response to the Growth Policy goals, public comments and agency input, existing zoning, constrained lands, changing market/demographics, entitled lots, and probable infrastructure investments. In November 2008, the UFDA was adopted as an amendment to the 2005 Missoula County Growth Policy. The amendment includes a map showing the preferred residential development allocation within the URSA. The UFDA study forecasted 400 new residential units in the Target Range neighborhood over the next 20-30 years. OPG provides an annual update of the supporting data in the Urban Fringe Development Area (UFDA) Growth Policy Amendment. The most recent update, distributed in May 2012, provides information about community growth during calendar year 2011 and indicates the following:

Maclay Bridge Planning Study
Existing and Projected Conditions November 1, 2012 12
For the second consecutive year the number of new residential construction building permits increased within the Urban Services Area (URSA). Only 8 of the 538 new residential building permits were for new dwelling units in Target Range/Orchard Homes subarea within the URSA. Overall, the number of new residential construction building permits inside the URSA during 2011 increased by 1.4%. OPG indicates this is within the expected 1 to 2% Annual Adjusted Growth Rate, based on 50 years of census data.
Subdivision activity within the URSA remained slow. There were no major subdivisions approved in the Target Range/Orchard Homes subarea within the URSA during 2011.3
3.5.4. Target Range Neighborhood Plan Growth Policies may include neighborhood plans as long as the plans are consistent with the Growth Policy. A neighborhood plan is a plan for a geographic area within the boundaries of the jurisdictional area that addresses one or more of the elements of the growth policy in more detail. The Missoula Growth Policy includes the following types of plans – regional, neighborhood, vicinity, and issue plans. These smaller scale plans are developed to be consistent with broader county-wide objectives, but are specific enough to address issues unique to individual neighborhoods.
Residents of the Target Range neighborhood initiated the process of creating a neighborhood plan in late 2008. This citizen-based planning effort, facilitated by the Missoula OPG, resulted in the development of the Target Range Neighborhood Plan which was adopted by Missoula County in June 2010. The Target Range Neighborhood Plan is intended to:
Identify and document the neighborhood’s values, interests and goals; Make recommendations to achieve identified goals and help guide future development; Determine the ability of the area to accommodate future growth; Identify, preserve and protect the resources most valued by the neighborhood; and Establish goals and priorities that will shape the future of the area.
The Residential Development Allocation Map developed through the UFDA project allocates an additional 1000 new dwellings in the combined Target Range and Orchard Homes neighborhoods by the year 2030, with approximately 400 dwellings in the Target Range neighborhood. Using the Institute of Transportation Engineers (ITE) trip generation rate of 9.57 trips per dwelling unit, the addition of 400 dwelling units alone could result in 3,828 additional vehicle trips per day in the Target Range area. The Target Range Neighborhood Plan recommends a residential development density of 1 dwelling unit per acre over most of the neighborhood but identifies a density of 2 dwelling units per acre for the area that lies between Clements Road and the Bitterroot River and between Mount and South Avenues.
The neighborhood plan includes a section devoted to transportation infrastructure and emphasizes that efforts should be taken to mitigate growth in motorized traffic while enhancing the traditional lifestyle and safety of citizens living within the Target Range area. The plan advocates the implementation of transportation alternatives that offset potential negative impacts associated with future development, including expansion of the walking and biking paths to reduce the number of miles traveled to improve air quality. Recommendations and strategies are offered on topics such as speed limits and speed zones, development of bike paths and trails, traffic calming, public transit, and intersection improvements.
The plan also includes the Maclay Bridge. The document emphasizes the importance of continued County maintenance of the structure to help preserve access for local and Missoula Valley residents
3 UFDA Yearbook 2011, released by Missoula OPG on May 16, 2012

Maclay Bridge Planning Study
Existing and Projected Conditions November 1, 2012 13
seeking recreational opportunities on nearby lands. The Target Range Neighborhood Plan does not identify the need for a new bridge.
3.6. LOLO NATIONAL FOREST PLAN Lolo National Forest lands exist south and west of the Bitterroot River. These lands are administered by the U.S. Forest Service (USFS) Missoula Ranger District according to the management direction established in the 1986 Lolo National Forest Plan. The current Forest Plan indicates the lands are managed for concentrated public use and dispersed recreation opportunities.
The Forest Plan is being revised to reflect new scientific information and natural and social changes that have occurred since its publication. Preliminary USFS documents for the Forest Plan revision show the forest lands in the area may be designated as “Management Area 6.1— High Use Recreation Complexes or Use Areas.” Mapping indicates these forest lands are part of the Blue Mountain Recreation Area located southwest of Missoula.
4.0 ROADWAY, BRIDGE AND PHYSICAL CHARACTERISTICS
4.1. EXISTING ROADWAY USERS Primary users of the Maclay Bridge consist of local residents from the Target Range and Orchard Homes neighborhoods (east of the Bitterroot River), land owners west of the Bitterroot River, and city and county residents accessing recreational uses along the Bitterroot River and USFS lands. Additionally, the Maclay Bridge is used by pedestrians, bicyclists, emergency response providers, and school buses.
4.2. EXISTING TRAFFIC DATA Historic traffic data for area roadways was obtained from MDT’s Bureau of Data & Statistics. Table 5 shows the most recent 20 years of traffic data for two count stations in the area: one located on River Pines Road just west of the Maclay Bridge and one located on North Avenue just west of Clements Road. The traffic data in Table 5 is representative of the average annual daily traffic (AADT) volume, in vehicles per day (vpd). AADT volumes account for seasonal and daily travel variations and represent an average number of vehicles to be expected on an average day over the course of a year. The AADT volume is based on adjustments from the ADT (Average Daily Traffic) volume which is a traffic count taken at a specific location during a time period greater than one day but less than 365 days.
Table 5: Average Annual Daily Traffic
Street Location 1992 1993 1994 1995 1996 1997 1998 1999 2000 2001River Pines Rd 300 ft W of Maclay Bridge 1610 1580 1840 2060 2190 2230 (a) (a) (a) 2230
North Ave 300 ft W of Clements Rd 1610 (a) 2200 (a) 1960 (a) 1980 (a) 1790 (a)
Street Location 2002 2003 2004 2005 2006 2007 2008 2009 2010 2011River Pines Rd 300 ft W of Maclay Bridge 2300 2060 2300 2130 2410 2460 (a) 2380 2610 2360
North Ave 300 ft W of Clements Rd 1660 (a) 2010 (a) 2140 (a) (a) (a) 2000 (a)
Source: MDT Data and Statistics Bureau, Traffic Data Collection Section, 2012 (a) Data unavailable
Table 5 shows the 2010 AADT volumes are 2,610 vpd (on River Pines Road) and 2,000 vpd (on North Avenue. The year 2010 is the most recent year for which traffic count data is available for both locations shown in Table 5. Based on field observations, the majority of traffic is automobiles accessing either adjacent properties or recreational destinations on the west side of the Bitterroot River. The area

Maclay Bridge Planning Study
Existing and Projected Conditions November 1, 2012 14
roadways are also used by school buses and emergency response vehicles. Vehicles traveling along these two roadways currently do not experience vehicle delay or congestion. However, at the single-lane Maclay Bridge, there can be some delay associated with vehicles waiting to cross the structure. Field observations have shown this delay to take up to 30 seconds during peak hour periods. Delay times will increase with future traffic projections. Travel routes to reach the Maclay Bridge include a network of various local and collector roadways. These include South Avenue, Clements Road, Woodlawn Avenue, North Avenue, and River Pines Road.
Subsequent to the second informational meeting held on July 10, 2012, it was decided to collect additional traffic data on River Pines Road to get an idea of when the hourly peak traffic volumes occur. Missoula County placed automatic hose counters on River Pines Road, just west of the Maclay Bridge, to collect hourly traffic volumes by time of day and by direction. The counter was set up to collect data on Wednesday, October 3, 2012. The peak twelve hours of data, by direction, is shown below in Table 6. These are raw traffic volumes in that no adjustments to the data were made for time of week, month of year, etc. Appendix D contains the raw data output file.
Table 6: River Pines Road Hourly Traffic Volumes – Twelve Hour Period (10/03/2012)
Time Period
Southbound Traffic Volume
(vph)
Northbound Traffic Volume
(vph)
Total Hourly Traffic Volume
(vph) 7-8 AM 19 151 170
8-9 AM 50 91 141
9-10 AM 31 66 97
10-11 AM 47 58 105
11 AM - NOON 48 64 112
NOON - 1 PM 66 55 121
1 - 2 PM 57 32 89
2 - 3 PM 58 64 122
3 - 4 PM 115 52 167
4 - 5 PM 127 64 191
5 - 6 PM 143 95 238
6 - 7 PM 127 54 181
7 - 8 PM 73 47 120
Source: Missoula County Public Works Department.
4.3. FUTURE TRAFFIC PROJECTIONS Projected transportation conditions were analyzed to estimate how traffic volumes and transportation characteristics may change compared to existing conditions. The analysis was based on existing volumes projected out to the year 2040. Two methods were examined. The first method analyzed historic traffic counts from the most recent 20-year period to arrive at an average annual growth rate (AAGR) that could be used to project traffic volumes forward. The second relied on the adopted TransCad travel demand model used by the Missoula County OPG and MDT. The TransCad model incorporates land use planning found within the Missoula County Growth Policy, including zoning, and also reflects the preferred growth scenario found within the Urban Fringe Development Area (UFDA). Additionally, the TransCad model is the tool utilized for the Missoula Area Transportation Plan (2008 and 2012 Updates). Both methods are explained in further detail below.

Maclay Bridge Planning Study
Existing and Projected Conditions November 1, 2012 15
4.3.1. Historic Traffic Growth Rates Historic traffic data was analyzed to determine traffic growth patterns near the Maclay Bridge. AAGR’s were calculated at known traffic count locations. As is evident from Table 5, traffic volumes have fluctuated along River Pines Road and North Avenue. For the purposes of projecting traffic growth, AAGR’s were calculated for each count site based on the most recent 20 years of traffic data. In addition to the AAGR’s, Table 7 shows year 2030 and 2040 AADT projections at the two traffic count sites.
Table 7: Historic Traffic Growth Rates and Projected AADT (Straight-line)
Road Location 2010
AADT AAGR
(1992 - 2011) Projected
2030 AADT (a) Projected
2040 AADT (a)
River Pines Rd 300 ft W of Maclay Bridge 2610 1.88% 3,800 4,550
North Ave 300 ft W of Clements Rd 2000 0.51% 2,200 2,350
Source: MDT Data and Statistics Bureau, Traffic Data Collection Section, 2012. (a) Projected AADT’s rounded to nearest 50 vpd.
4.3.2. Future Traffic Modeling A Travel Demand Model (TDM) was utilized as a tool to help predict future traffic growth. The TDM was developed using year 2010 information to determine baseline conditions. Estimated future land use was applied to the model to project year 2040 conditions.
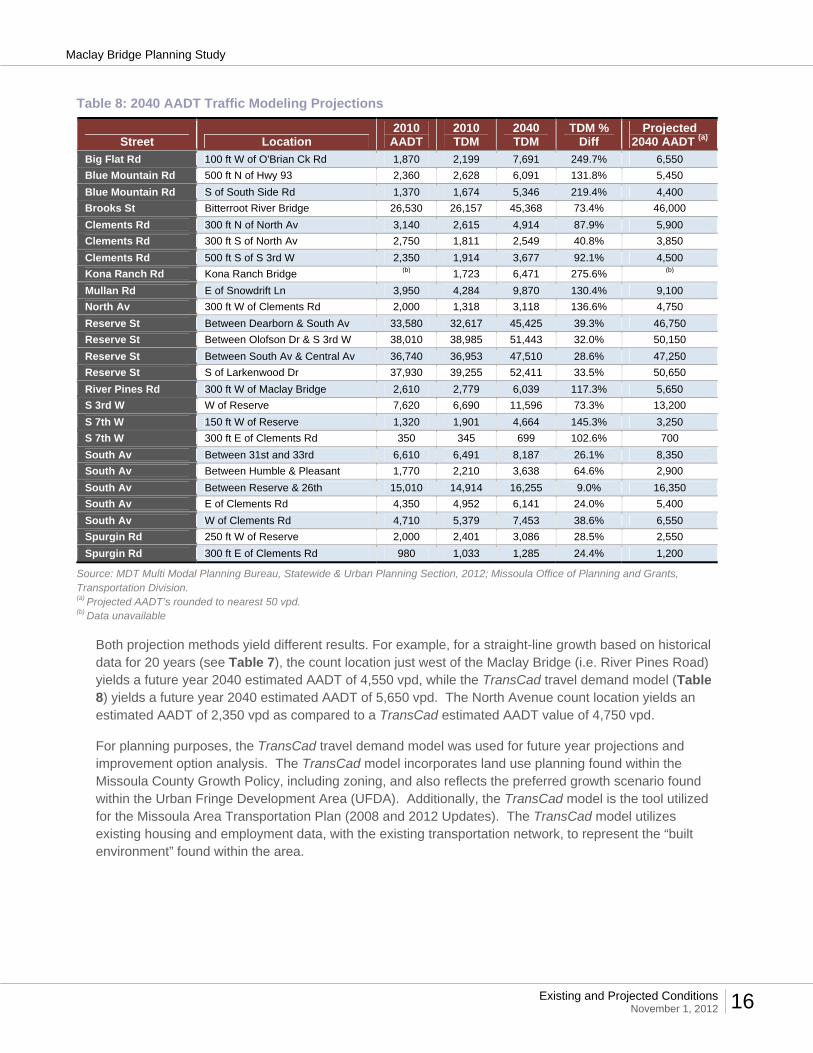
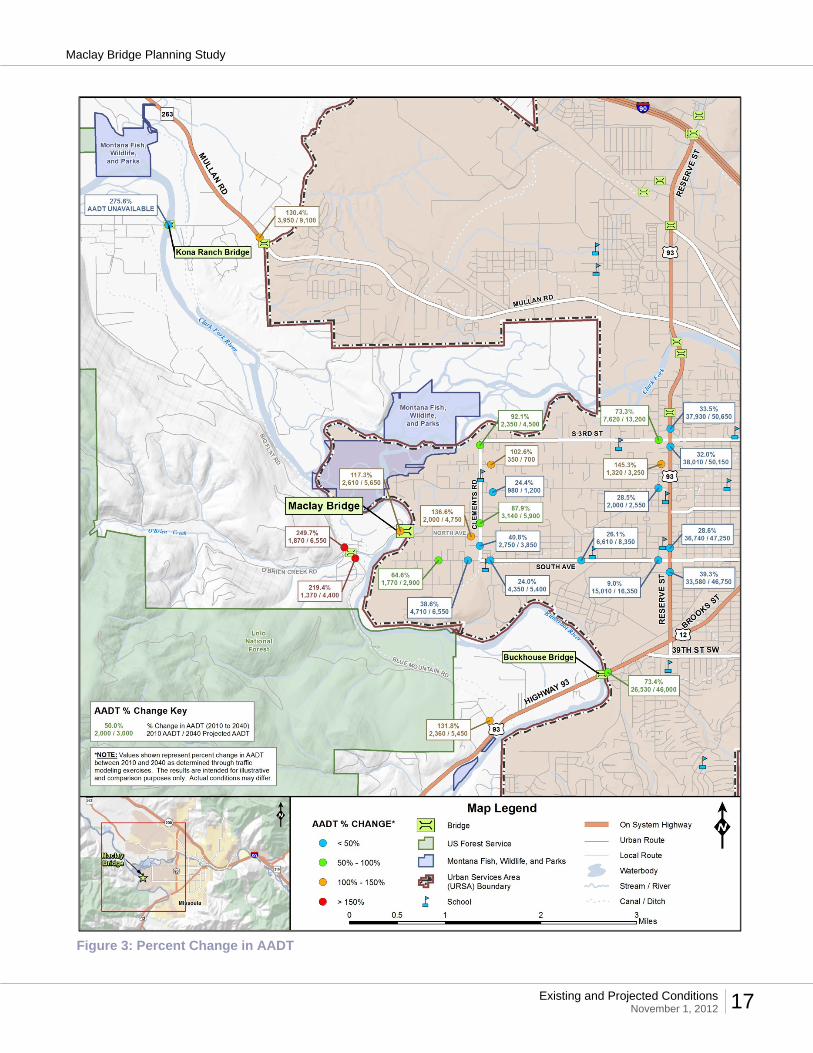
For the purposes of this study, a percent difference in year 2010 and year 2040 traffic volumes from the TDM was calculated to determine a percent growth rate at various locations. Year 2010 and year 2040 TDM traffic volumes are a product of intensive land use and transportation planning exercises that are undertaken by the Missoula County OPG via regular planning exercises. The TDM model is the best tool for forecasting potential traffic given land use plans and the transportation network. However model traffic volumes cannot be construed as being 100 percent accurate. Standard practice is to calculate the percent difference in the model, and apply that percentage to actual, known traffic volumes on the transportation system. Accordingly, the percent growth rate at various locations from the TDM was applied to known AADT traffic count locations to project 2040 AADT values. Table 8 provides a summary of traffic count locations within the study analysis area. These results are also shown graphically in Figure 3.
The results provided in Table 8 and Figure 3 differ from earlier results presented to the public at the second informational meeting held on July 10, 2012. At the second informational meeting, the results of the TransCad travel demand model were questioned as some members of the public believed the land use inputs did not represent the adopted land use strategies in place through Missoula County planning documents. Accordingly, the TransCad model input, and corresponding output, was further reviewed by Missoula County and MDT and updated. The model results shown in Table 8 and Figure 3 are from the most current TransCad model that is being used - not only for this planning study, but also the regional transportation plan update currently in process by Missoula OPG.
Maclay Bridge Planning Study
Existing and Projected Conditions November 1, 2012 16
Table 8: 2040 AADT Traffic Modeling Projections
Street Location 2010
AADT 2010 TDM
2040 TDM
TDM % Diff
Projected 2040 AADT (a)
Big Flat Rd 100 ft W of O'Brian Ck Rd 1,870 2,199 7,691 249.7% 6,550
Blue Mountain Rd 500 ft N of Hwy 93 2,360 2,628 6,091 131.8% 5,450
Blue Mountain Rd S of South Side Rd 1,370 1,674 5,346 219.4% 4,400
Brooks St Bitterroot River Bridge 26,530 26,157 45,368 73.4% 46,000
Clements Rd 300 ft N of North Av 3,140 2,615 4,914 87.9% 5,900
Clements Rd 300 ft S of North Av 2,750 1,811 2,549 40.8% 3,850
Clements Rd 500 ft S of S 3rd W 2,350 1,914 3,677 92.1% 4,500
Kona Ranch Rd Kona Ranch Bridge (b) 1,723 6,471 275.6% (b)
Mullan Rd E of Snowdrift Ln 3,950 4,284 9,870 130.4% 9,100
North Av 300 ft W of Clements Rd 2,000 1,318 3,118 136.6% 4,750
Reserve St Between Dearborn & South Av 33,580 32,617 45,425 39.3% 46,750
Reserve St Between Olofson Dr & S 3rd W 38,010 38,985 51,443 32.0% 50,150
Reserve St Between South Av & Central Av 36,740 36,953 47,510 28.6% 47,250
Reserve St S of Larkenwood Dr 37,930 39,255 52,411 33.5% 50,650
River Pines Rd 300 ft W of Maclay Bridge 2,610 2,779 6,039 117.3% 5,650
S 3rd W W of Reserve 7,620 6,690 11,596 73.3% 13,200
S 7th W 150 ft W of Reserve 1,320 1,901 4,664 145.3% 3,250
S 7th W 300 ft E of Clements Rd 350 345 699 102.6% 700
South Av Between 31st and 33rd 6,610 6,491 8,187 26.1% 8,350
South Av Between Humble & Pleasant 1,770 2,210 3,638 64.6% 2,900
South Av Between Reserve & 26th 15,010 14,914 16,255 9.0% 16,350
South Av E of Clements Rd 4,350 4,952 6,141 24.0% 5,400
South Av W of Clements Rd 4,710 5,379 7,453 38.6% 6,550
Spurgin Rd 250 ft W of Reserve 2,000 2,401 3,086 28.5% 2,550
Spurgin Rd 300 ft E of Clements Rd 980 1,033 1,285 24.4% 1,200
Source: MDT Multi Modal Planning Bureau, Statewide & Urban Planning Section, 2012; Missoula Office of Planning and Grants, Transportation Division. (a) Projected AADT’s rounded to nearest 50 vpd. (b) Data unavailable
Both projection methods yield different results. For example, for a straight-line growth based on historical data for 20 years (see Table 7), the count location just west of the Maclay Bridge (i.e. River Pines Road) yields a future year 2040 estimated AADT of 4,550 vpd, while the TransCad travel demand model (Table 8) yields a future year 2040 estimated AADT of 5,650 vpd. The North Avenue count location yields an estimated AADT of 2,350 vpd as compared to a TransCad estimated AADT value of 4,750 vpd.
For planning purposes, the TransCad travel demand model was used for future year projections and improvement option analysis. The TransCad model incorporates land use planning found within the Missoula County Growth Policy, including zoning, and also reflects the preferred growth scenario found within the Urban Fringe Development Area (UFDA). Additionally, the TransCad model is the tool utilized for the Missoula Area Transportation Plan (2008 and 2012 Updates). The TransCad model utilizes existing housing and employment data, with the existing transportation network, to represent the “built environment” found within the area.
Maclay Bridge Planning Study
Existing and Projected Conditions November 1, 2012 17
Figure 3: Percent Change in AADT

Maclay Bridge Planning Study
Existing and Projected Conditions November 1, 2012 18
4.4. CRASH ANALYSIS The MDT Traffic and Safety Bureau provided crash data for the ten-year period from January 1, 2002 to December 31, 2011. The crash data was provided for the following locations:
Township 13 North, Range 20 West, Section 26 (T13N R20W S26) Township 13 North, Range 20 West, Section 27 (T13N R20W S27) Township 13 North, Range 20 West, Section 34 (T13N R20W S34) Township 13 North, Range 20 West, Section 35 (T13N R20W S35)
According to the MDT crash database, there were 131 total crashes reported within these identified locations during the ten-year time period. Reportable crashes are defined as those with a fatality, an injury, or property damage only with a minimum of $1,000 in damages.
As part of the crash analysis, crash investigation reports were reviewed to help identify specific locations and contributing factors. Based on the information provided in the crash reports, trends and contributing factors for the crashes, along with characteristics of the drivers and vehicles involved, were identified. The information and analysis provided herein is a summary of the data as contained in the reports.
A location map of the reported crashes is shown in Figure 4. Based on the crash data, a number of crash clusters and trends were identified and are discussed further below. The crash trends and locations presented below comprise a total of 95 of the 131 reported crashes. The remaining crashes are scattered throughout the four sections of land queried for crashes.
BIG FLAT ROAD Six crashes were reported along Big Flat Road at or near the horizontal curve located approximately 0.15 miles northwest of the intersection with River Pines Road. All 6 involved single vehicles with 5 occurring during “dark not lit” conditions and two resulting in injuries. The most common contributing circumstance for the crashes was driving too fast for conditions.
BLUE MOUNTAIN ROAD Blue Mountain Road had two separate crash clusters noted within the analysis area. A crash cluster was noted approximately 0.3 miles south of the intersection with River Pines Road along a sharp horizontal curve. A total of 16 crashes were reported at this location. Of the 16 crashes, 15 involved a single vehicle. Five crashes resulted in a total of 10 injuries. Eight crashes occurred during “dark not lit” conditions. The most common contributing circumstances reported were driving too fast for conditions and careless driving. In addition, alcohol was listed as a contributing factor in 4 crashes. As noted previously in Section 1 of this report, MDT currently has a planned safety project for this location to address the identified crash trends.
A second crash cluster was noted along the horizontal curves located approximately 0.5 to 0.9 miles south of the intersection with River Pines Road. There were 13 reported crashes along the 0.4 mile segment of Blue Mountain Road. All 13 crashes were single-vehicle crashes with 4 occurring during “dark not lit” conditions. Two crashes resulted in a total of two injuries. Driving too fast for conditions and/or careless driving were listed as the most common contributing circumstances. Alcohol was a contributing factor in 4 of the crashes in this cluster.
NORTH AVENUE There were 12 crashes reported along the 0.25 mile segment of North Avenue between Humble Road and the Maclay Bridge. Seven of the 12 crashes involved more than one vehicle. The most common contributing circumstances were inattentive driving and failure to yield. Alcohol was listed as a factor in one crash.

Maclay Bridge Planning Study
Existing and Projected Conditions November 1, 2012 19
RIVER PINES DRIVE A total of 18 crashes were reported between Maclay Bridge and Riverside Drive. These crashes resulted in a total of 12 injuries. Of the 18 crashes, 12 occurred under “dark not lit” conditions and three involved multiple vehicles. Alcohol involvement was a factor in 8 of the 18 crashes. Inattentive driving, driving too fast for conditions, and careless driving were other common contributing circumstances for crashes occurring in this area of River Pines Drive. In addition, a “head-on” crash was located in this area. As noted previously in Section 1 of this report, MDT currently has a planned safety project for this location to address the identified crash trends.
A second crash cluster was noted along the horizontal curves located approximately 0.15 to 0.30 miles southwest of the intersection with Riverside Drive. Eight crashes were reported along the 0.15 mile stretch of River Pines Drive, 3 of which occurred under “dark not lit” conditions. Seven of the 8 reported crashes involved a single vehicle and none of the crashes resulted in injuries. Careless driving and driving too fast for conditions were the most common contributing circumstances. Alcohol involvement was a contributing factor in 1 crash at this location.
Another crash cluster was noted between the intersection with Big Flat Road and the sharp horizontal curve located approximately 0.25 miles east of Big Flat Road. A total of 12 crashes were reported at this location, eight of which involved a single vehicle. Five crashes occurred under “dark not lit” conditions. Three crashes resulted in a total of 4 injuries. Alcohol involvement was a factor in 5 of the 12 crashes. Careless driving and driving too fast for conditions were the most common contributing circumstances.
SOUTH AVENUE A crash cluster was noted along South Avenue between the intersections with Pauline Drive and Woodlawn Avenue. Ten crashes were reported here, with 7 occurring under “dark not lit” conditions. Eight of the 10 reported crashes involved a single vehicle, while 4 crashes resulted in a total of 5 injuries Alcohol was a contributing factor in 4 crashes.
4.4.1. Identifiable Crash Trends and Areas of Concern A number of crash trends and areas of concern were identified within the crash analysis area. The following crash trends and areas of concern were identified based on MDT-supplied crash data and field investigators reports:
Big Flat Road
o Single vehicle crashes along the horizontal curve approximately 0.15 miles north of the intersection with River Pines Road.
Blue Mountain Road
o Single vehicle crashes along the sharp horizontal curve approximately 0.3 miles south of the intersection with River Pines Road.
o Single vehicle crashes along the horizontal curves located approximately 0.5 to 0.9 miles south of the intersection with River Pines Road.
North Avenue
o Crashes with inattentive driving and failure to yield listed as contributing circumstances between Humble Road and the Maclay Bridge.

Maclay Bridge Planning Study
Existing and Projected Conditions November 1, 2012 20
River Pines Drive
o Single vehicle crashes at or near the intersection with Riverside Drive under “dark not lit” conditions.
o Single vehicle crashes along the horizontal curves located approximately 0.15 to 0.30 miles southwest of the intersection with Riverside Drive.
o Crashes between the intersection with Big Flat Road and the sharp horizontal curve located approximately 0.25 miles east of Big Flat Road.
South Avenue
o Single vehicle crashes between the intersections with Pauline Drive and Woodlawn Avenue under “dark not lit” conditions.

Maclay Bridge Planning Study
Existing and Projected Conditions November 1, 2012 21
Figure 4: Crash Locations (01/01/2002 – 12/31/2011)
Maclay Bridge Planning Study
Existing and Projected Conditions November 1, 2012 22
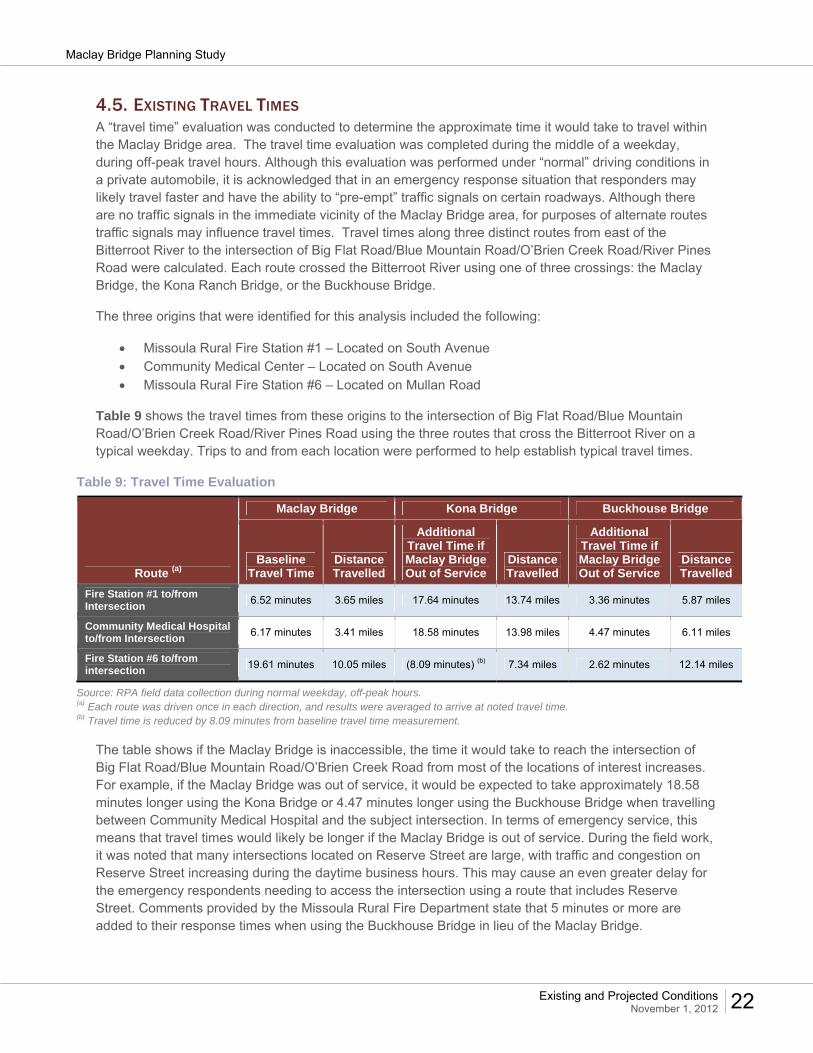
4.5. EXISTING TRAVEL TIMES A “travel time” evaluation was conducted to determine the approximate time it would take to travel within the Maclay Bridge area. The travel time evaluation was completed during the middle of a weekday, during off-peak travel hours. Although this evaluation was performed under “normal” driving conditions in a private automobile, it is acknowledged that in an emergency response situation that responders may likely travel faster and have the ability to “pre-empt” traffic signals on certain roadways. Although there are no traffic signals in the immediate vicinity of the Maclay Bridge area, for purposes of alternate routes traffic signals may influence travel times. Travel times along three distinct routes from east of the Bitterroot River to the intersection of Big Flat Road/Blue Mountain Road/O’Brien Creek Road/River Pines Road were calculated. Each route crossed the Bitterroot River using one of three crossings: the Maclay Bridge, the Kona Ranch Bridge, or the Buckhouse Bridge.
The three origins that were identified for this analysis included the following:
Missoula Rural Fire Station #1 – Located on South Avenue Community Medical Center – Located on South Avenue Missoula Rural Fire Station #6 – Located on Mullan Road
Table 9 shows the travel times from these origins to the intersection of Big Flat Road/Blue Mountain Road/O’Brien Creek Road/River Pines Road using the three routes that cross the Bitterroot River on a typical weekday. Trips to and from each location were performed to help establish typical travel times.
Table 9: Travel Time Evaluation
Route (a)
Maclay Bridge Kona Bridge Buckhouse Bridge
Baseline Travel Time
Distance Travelled
Additional Travel Time if Maclay Bridge Out of Service
Distance Travelled
Additional Travel Time if Maclay Bridge Out of Service
Distance Travelled
Fire Station #1 to/from Intersection
6.52 minutes 3.65 miles 17.64 minutes 13.74 miles 3.36 minutes 5.87 miles
Community Medical Hospital to/from Intersection
6.17 minutes 3.41 miles 18.58 minutes 13.98 miles 4.47 minutes 6.11 miles
Fire Station #6 to/from intersection
19.61 minutes 10.05 miles (8.09 minutes) (b) 7.34 miles 2.62 minutes 12.14 miles
Source: RPA field data collection during normal weekday, off-peak hours. (a) Each route was driven once in each direction, and results were averaged to arrive at noted travel time. (b) Travel time is reduced by 8.09 minutes from baseline travel time measurement.
The table shows if the Maclay Bridge is inaccessible, the time it would take to reach the intersection of Big Flat Road/Blue Mountain Road/O’Brien Creek Road from most of the locations of interest increases. For example, if the Maclay Bridge was out of service, it would be expected to take approximately 18.58 minutes longer using the Kona Bridge or 4.47 minutes longer using the Buckhouse Bridge when travelling between Community Medical Hospital and the subject intersection. In terms of emergency service, this means that travel times would likely be longer if the Maclay Bridge is out of service. During the field work, it was noted that many intersections located on Reserve Street are large, with traffic and congestion on Reserve Street increasing during the daytime business hours. This may cause an even greater delay for the emergency respondents needing to access the intersection using a route that includes Reserve Street. Comments provided by the Missoula Rural Fire Department state that 5 minutes or more are added to their response times when using the Buckhouse Bridge in lieu of the Maclay Bridge.

Maclay Bridge Planning Study
Existing and Projected Conditions November 1, 2012 23
4.6. DESIGN STANDARDS Design standards are an important consideration when assessing existing areas of concern, as well as for planning new infrastructure. Depending on funding source, different sets of design standards may be applicable to the Maclay Bridge. One set of standards are the design standards in place by Missoula County. These standards are found via the Missoula County Public Works Manual 2010, and set forth road design considerations for various roadway classifications. Table 10 depicts the roadway design considerations adopted by Missoula County, along with select subdivision standards that establish minimum surface widths for various road classifications. According to the data in Table 10, a collector roadway built to Missoula County standards would have a surface width of 44 feet. The County’s standards for collector roadways were used as a basis to evaluate existing design concerns on River Pines Road and North Avenue in section 4.7. Vertical grades and horizontal curvature were of primary importance in evaluating consistency with design standards.
Roadway functional classifications are typically defined as arterials, collector routes and local streets. These road types can apply to both an urban and a rural area, with slight modifications. Missoula County defines roads within their jurisdiction as presented in the Missoula County Public Works Manual. For the roadway classifications found within the immediate vicinity of the Maclay Bridge, the following definitions apply:
Arterial – A street or road having the primary function of moving traffic and the secondary function of providing access to adjacent land. Arterials generally carry relatively large volumes of traffic. Characteristics of an arterial are two to four lanes of traffic with limited access to abutting property.
Collector – A street or road having the equally important functions of moving traffic and providing access to adjacent land. General characteristics of collector streets are two traffic lanes and two parking lanes serving more than 200 lots. Residential collectors serve only residential neighborhoods; non-residential collectors serve other land uses.
Minor Collector – A street or road having the equally important functions of moving traffic and providing access to adjacent land. General characteristics of collector streets are two traffic lanes and one or two parking lanes serving between 40 and 199 lots.
Local Streets – A street or road having the primary function of serving abutting properties and the secondary function of moving traffic. Local streets generally consist of two traffic lanes, may include one or two parking lanes and provide access to abutting properties. Local streets shall be designed to discourage future use as collector streets. Residential local streets serve individual residential areas; non-residential local streets serve nonresidential land uses.
It is also important to note there is a difference between a facility’s design speed and its operating speed. The design speed is a selected speed used to determine the various geometric design features of the roadway. The operating speed is the highest overall speed at which a driver can travel on a given section of roadway under favorable weather conditions and under prevailing traffic conditions without at any time exceeding the safe speed as determined by the design speed. The operating speed is different than the posted speed. Posted speed limits are typically accomplished by measuring the speeds at which 85 percent of the drivers are travelling at or below, and signing for that speed within 5 mph of the result. This is typically referred to as the 85th percentile speed. Posted speeds are commonly set at 25 mph on local urban roads.

Maclay Bridge Planning Study
Existing and Projected Conditions November 1, 2012 24
Table 10: Missoula County Roadway Design Considerations
Design Parameter
Road Classification
Local Minor Collector Collector ArterialDesign Speed (mph) 25-35 25-35 25-45 35-55
Maximum Vertical Grade (%) 10 8 6 6
Minimum Horizontal Curve Radius (ft) 150 200 525 900
Return Radius Between Intersecting Streets (a) (ft) 25 35 50 50
Horizontal Clearance (ft) 20 20 20 20
Vertical Clearance (ft) 14 14 14 14
Surface Width (ft) 24-32 32 44 44
Right-of-Way Width (ft) 40-60 60-70 60-80 60-80
Source: Table 6.1, “Road Design Considerations” and Table 6.2, “Minimum Surface Widths Required for Road Improvements”, Missoula County Public Works Manual, 2010 (a) Based on road with higher classification
AASHTO design standards may be applicable since Missoula County does not have any specific “bridge related” standards to measure against. AASHTO bridge width standards allow a single-lane bridge only for very low volume roads in which traffic is less than 100 vpd. In those cases, the minimum single-lane bridge width must be no less than 15 feet in width (see AASHTO’s Guidelines for Geometric Design of Very Low-Volume Local Roads, 2001). Since existing, and projected traffic volumes, are much higher than this threshold (2,610/5,650 respectively), applicable AASHTO design standards are found in AASHTO’s A Policy on Geometric Design of Highways and Streets, 2011. For “local” and “collector” road classifications, the minimum clear width for a bridge carrying over 2,000 vpd is equal to 30 feet (two 12-foot driving lanes plus 3-foot shoulders on each side).
An additional set of design standards, and those that may be considered in design if Federal or State funds were used for any type of project identified through this planning effort, are the standards and guidelines found in MDT’s Road Design Manual (RDM). The RDM specifies general design principles and controls which determine the overall operational characteristics of the roadway and enhance the aesthetic appearance of the roadway. If a new bridge results from the study, either at its present location or an alternate location, it would connect to roadways currently classified as rural roads or streets. The RDM geometric design criteria would be reviewed in the context of the adjacent land use, topography, and function, and compared to existing Missoula County design criteria.
Using the National Bridge Inspection (NBI) Coding Guide, the minimum bridge “curb-to-curb” width needed to eliminate the “Functionally Obsolete” designation is 28 feet and applies to an ADT range of 2,001 to 5,000 vpd. If the bridge length is greater than 200 feet, then the 28 feet width could be applied to an ADT greater than 5,000 vpd. The 28 feet would allow for two 12-foot lanes, and a 2-foot shoulder on each side. Accordingly, it is likely that the minimum bridge width, “curb-to-curb”, would need to be at least 28 feet.
For most “off-system” locations such as the Maclay Bridge (i.e. not on a State-highway), local conditions and context to the surrounding land uses would be considered in developing geometric features such as road width, acceptable curves, and the need for non-motorized facilities.
4.7. ROADWAY GEOMETRICS Existing roadway geometrics were evaluated and compared to current Missoula County standards. The analysis was conducted based on a review of public information, bridge drawings, Geographic Information Systems (GIS) data, and field observations. As-built drawings for area roadways were not available. As such, a field review was conducted in April 2012 to confirm and supplement information, as

Maclay Bridge Planning Study
Existing and Projected Conditions November 1, 2012 25
well as to identify additional areas of concern within the Maclay Bridge area. Appendix A provides a log of some of the photos taken during the field review.
4.7.1. Horizontal Alignment Elements comprising horizontal alignment include curvature, superelevation (i.e. the “bank” on the road), and sight distance. These horizontal alignment elements influence traffic operation and safety. As mentioned in section 4.6, Missoula County roadway standards for a collector roadway were used as a basis to evaluate existing design concerns along River Pines Road and North Avenue. Missoula County’s standards for horizontal curves are defined in terms of curve radius, and for a collector roadway, the minimum required radius is 525 feet.
Horizontal curve radii were evaluated based on field review and aerial photography. Three horizontal curves were identified that do not meet current Missoula County standards. These three curves also do not meet current MDT design standards. Table 11 provides a summary of the three substandard horizontal curves. The presence of sub-standard curvature may contribute to crash numbers and severity.
Table 11: Horizontal Alignment Areas of Concern
Location Feature Value (a) Standard
North Ave W / Edward Ave Intersection 450' SE of Maclay Bridge Horizontal Curve 175' 525’
River Pines Rd / Riverside Dr 50' NW of Maclay Bridge Horizontal Curve 125' 525’
River Pines Rd 2300' SW of Maclay Bridge Horizontal Curve 125' 525’
(a) Estimated based on aerial photography
4.7.2. Vertical Alignment Vertical alignment is a measure of elevation change of a roadway. The length and steepness of grades directly affects the operational characteristics of the roadway. In addition, the available stopping sight distance (SSD) for the vertical alignment, and specifically the vertical curvature, also directly affects the operational characteristics of the roadway.
Missoula County roadway standards for a collector roadway define a maximum allowable vertical grade of 6.0 percent. As-built drawings were not available for River Pines Road or North Avenue, thus field observations were made and noted pertinent to vertical grades. Both roadways connecting to the Maclay Bridge were estimated to have grades that do not exceed the Missoula County standard of 6.0 percent for a collector roadway or the current MDT design standards.
4.7.3. Roadside Clear Zone The roadside clear zone, starting at the edge of the traveled way, is the total roadside border area available for safe use by errant vehicles. This area may consist of a shoulder, a recoverable slope, a non-recoverable slope, and/or recovery area. The desired clear zone width varies depending on traffic volumes, speeds, and roadside geometry. Clear zones are evaluated individually based on the roadside cross section.
Clear zones should be attained by removing or shielding obstacles if costs are reasonable. In certain instances, it may be impractical to protect or remove certain obstacles within the clear zone. As improvement options develop, roadside clear zones should be designated, to a practical extent, to meet current design standards to improve safety deficiencies to reduce the likelihood of crashes. The presence of unshielded obstacles and/or non-recoverable slopes may contribute to crash numbers and severity.

Maclay Bridge Planning Study
Existing and Projected Conditions November 1, 2012 26
Within the area, there were locations identified that do not meet the Missoula County horizontal clearance requirement as listed in Table 10 for a collector roadway. The most notable area is located along River Pines Road, just southwest of the existing bridge. At this location, the top of roadway fill slope is between 2 and 4 feet from the edge of the travel lane. In addition, trees and utility poles are found within this area. The roadway fill slope in this area is steep and lined with riprap to the river.
4.8. BRIDGE CONSIDERATIONS The dominant transportation feature located within the study area is the Maclay Bridge. It has been the subject of past technical and planning level analysis, and was analyzed in detail during the development of the 1994 Maclay Bridge Site Selection Study EA. Table 12 shows the bridge number, date of most recent inspection, type, size, and year constructed (or reconstructed). A copy of the most recent Bridge Inspection Report completed by MDT is included in Appendix B. Table 13 presents both the operating and inventory rating load for the structure, correlated to different truck sizes. Design loads are expressed in metric tons (mton), which represents the total mass of the entire vehicle, while ratings are expressed in tons, which is more common for posting.
Table 12: Bridge Location and Type
Number Structure
Name Date of Last Inspection
Type of Bridge (Dimensions)
Year Constructed (Reconstructed)
Waterbody Traversed
L32101000+01001 Maclay Bridge 10/31/2011 4‐span structure
1935 (1964) Bitterroot River (16’ wide x 346’ long)
Source: MDT Bridge Management System, 2012
The three rating vehicles include Type 3 (single truck), Type 3-S3 (semi-truck and trailer) and Type 3-3 (truck and “pup”). Figure 5 shows truck schematics for the three rating vehicles. For a short-span bridge such as the Maclay Bridge, the Type 3 (single truck) vehicle would be the likely unit for design purposes.
Figure 5: Typical Rating Vehicles for Bridge Design

Maclay Bridge Planning Study
Existing and Projected Conditions November 1, 2012 27
Table 13: Bridge Design Loads and Ratings
Rating / Truck Type Maclay BridgeOperating Load (Design) (20.9 mton)
Truck 1 Type 3 (a) Rating 19 ton
Truck 2 Type 3-S3 Rating 29 ton
Truck 3 Type 3-3 Rating 37 ton
Inventory Load (Design) (12.7 mton)
Truck 1 Type 3 (a) Rating 11 ton
Truck 2 Type 3-S3 Rating 17 ton
Truck 3 Type 3-3 Rating 22 ton
Source: MDT Bridge Management System, 2012 (a) Posted at 11 tons
The operating rating defines the absolute maximum permissible load level to which the structure may be subjected for the vehicle type used in the rating. This rating determines the capacity of the bridge for occasional use. Allowing unlimited numbers of vehicles at the operating level will compromise the bridge life.
The inventory rating defines the load level which can safely use an existing structure for an indefinite period of time.
The posting rating results in a load level which may safely use an existing structure on a routine basis for a limited period of time. When a bridge is not able to safely carry the loads allowed, it is posted for its inventory rating.
Since the 2011 Bridge Inspection Report was prepared, there has been further analysis of the bridge that resulted in the posted load limit being reduced from 14 tons to 11 tons. This reduction was based on analysis by MDT engineers. The two primary vehicles impacted by this reduction are school buses and fire trucks. School buses are generally within the 11 ton limit, as they weigh approximately 19,000 pounds when empty and 22,000 pounds when loaded. Fully loaded school buses are near or at the 11 tons limit. School buses are thus allowed across the bridge, as long as they do not exceed the posted 15 mph speed limit.
An agreement exists that allows the local rural fire department to operate their Type I fire engines (i.e. overweight vehicles) across the bridge, as long as they straddle the centerline of the bridge and travel no more than 5 mph.
The 2011 Bridge Inspection Report also noted some areas of concern related to a variety of bridge features. Some of these are reiterated below (see Appendix B for further detail).
Transverse cracking in deck asphalt surfacing; Paint loss and rusting on various features, such as floor beams, bottom chords, and steel
stringers; Minor cracking and spalling on concrete pier wall and abutments; and Moveable roller bearings are not functional and are out of alignment.
Residents reaffirmed those findings during the public process and RPA staff reviewed these areas of concern in the filed for validity. These areas of concern are listed below (select photographs of some of these concerns are included in Appendix A).

Maclay Bridge Planning Study
Existing and Projected Conditions November 1, 2012 28
The current structure exhibits spalling and cracked concrete and exposed rebar; Rust and steel pitting is observed under the bridge on some load bearing members and the deck; The bridge is a composite of varying ages and types of load-bearing steel used throughout the
structure; and The strength of the steel is unknown in much of the bridge, as it has never been tested.
4.8.1. Sufficiency Rating An important consideration in the evaluation of roadway bridges is the sufficiency rating associated with the structure. The sufficiency rating formula is the industry standard of evaluating highway bridge data to obtain a numeric value indicating the sufficiency of the bridge to remain in service. The sufficiency rating is expressed by a value ranging from 0 to 100 with 100 being an entirely sufficient bridge and 0 being an entirely deficient bridge. To receive funding through the Off-System Bridge Program, structures must be classified as “Structurally Deficient” or “Functionally Obsolete” and have a sufficiency rating of 80 or below. Structures with a sufficiency rating of 0 to 49.9 are eligible for replacement, and structures at 50 to 80 are eligible for rehabilitation unless otherwise approved for replacement by the FHWA. The following criteria determine whether or not a structure is structurally deficient or functionally obsolete:
STRUCTURALLY DEFICIENT A condition of 4 or less for any of the following:
Deck Rating Superstructure Rating Substructure Rating
Or, an appraisal of 2 or less for the following:
Structure Rating Waterway Adequacy
FUNCTIONALLY OBSOLETE An appraisal of 3 or less for the following:
Deck Geometry Under Clearance Approach Roadway Alignment
Or, an appraisal of 3 for the following:
Structure Rating Waterway Adequacy
According to the National Bridge Inspection Standards (NBIS), condition ratings are used to describe an existing bridge compared with its condition if it were new. The ratings are based on the materials, physical condition of the deck (riding surface), the superstructure (supports immediately beneath the driving surface), and the substructures (foundation and supporting posts and piers). General condition ratings range from 0 (failed condition) to 9 (excellent condition). This differs from appraisal ratings, which are usually done in the office where access to all necessary information and specifications is available, and consider the field condition, waterway adequacy, geometric and safety configurations, structural evaluation, and safe load capacity of the bridge. Based on the most recent Bridge Inspection Report, the Maclay Bridge was determined to be functionally obsolete, but not structurally deficient. Its sufficiency rating is calculated to be 27.3, which is less than 49.9, thereby making the bridge eligible for replacement.

Maclay Bridge Planning Study
Existing and Projected Conditions November 1, 2012 29
A functionally obsolete bridge is one that was built to standards that are not used today. Functionally obsolete bridges are those that do not have adequate lane widths, shoulder widths, or vertical clearances to serve current traffic demand, or those that may be occasionally flooded. Functionally obsolete bridges are not automatically rated as structurally deficient, nor are they inherently unsafe. American Association of State Highway Transportation Officials (AASHTO) standards specify single-lane bridges are appropriate on routes with AADT volumes less than 50 vpd. For the Maclay Bridge, the appraisal values for the “Deck Geometry” and the “Approach Roadway Alignment” are such that the bridge is categorized as being functionally obsolete. This is based on the single-lane width of the bridge being sub-standard for the current traffic volumes, and the sub-standard curves on both approaches to the bridge.
Table 14 shows the sufficiency rating for the Maclay Bridge. For the “Under Clearance” criteria, a notation of “N” means that the structure does not pass over a highway or railroad and is not relevant to the functionally obsolete sufficiency rating criteria. Off-system bridge data statewide suggests that 98.3 percent of all off-system bridges have a sufficiency rating higher than the Maclay Bridge health index.
Table 14: Bridge Sufficiency Rating for Maclay Bridge
Criteria Maclay Bridge
Structurally Deficiency Sufficiency Rating Criteria
Deck Rating ≤ 4 6
Superstructure Rating ≤ 4 6
Substructure Rating ≤ 4 5
Structure Rating ≤ 2 4
Waterway Adequacy ≤ 2 8
Functionally Obsolete Sufficiency Rating Criteria
Structure Rating 3 4
Deck Geometry ≤ 3 3
Under Clearance ≤ 3 N
Waterway Adequacy 3 8
Approach Roadway Alignment ≤ 3 3
Sufficiency Rating 27.3
Structure Status Functionally Obsolete / Not Structurally Deficient
Source: MDT Bridge Management System, 2012. Calculations for Sufficiency Ratings utilize a formula that includes various factors determined during the bridge field inspection and evaluation.
4.8.2. Bridge Health Index The “Health Index” is a variable based on “weighting” bridge components to establish a clear, dependable communication of bridge performance information to management, elected officials, and the public. The Bridge Health Index is a 0-100 ranking system for bridge maintenance with 100 being a “best” condition and 0 indicating a “worst” condition. The health index provides an indication of how individual bridge components rank on the 0-100 condition scale. To generate a health index rating for the entire bridge, weighted values are assigned to the individual bridge components according to the economic consequences of their failure. Thus, components whose failure has relatively little economic effect, such as railings, receive less weight than those whose failure could close the bridge, such as girders. The Health Index number provides a performance measure and management tool for bridge maintenance.
The health index is not an FHWA directive for assessing bridges, rather, it was developed by the California Department of Transportation (Caltrans) and its computations are now included in bridge management software. Guidance provided by Caltrans suggests that the health index concept for a single bridge be evaluated in context with a statewide network of bridges. Based on the recent October 31, 2011
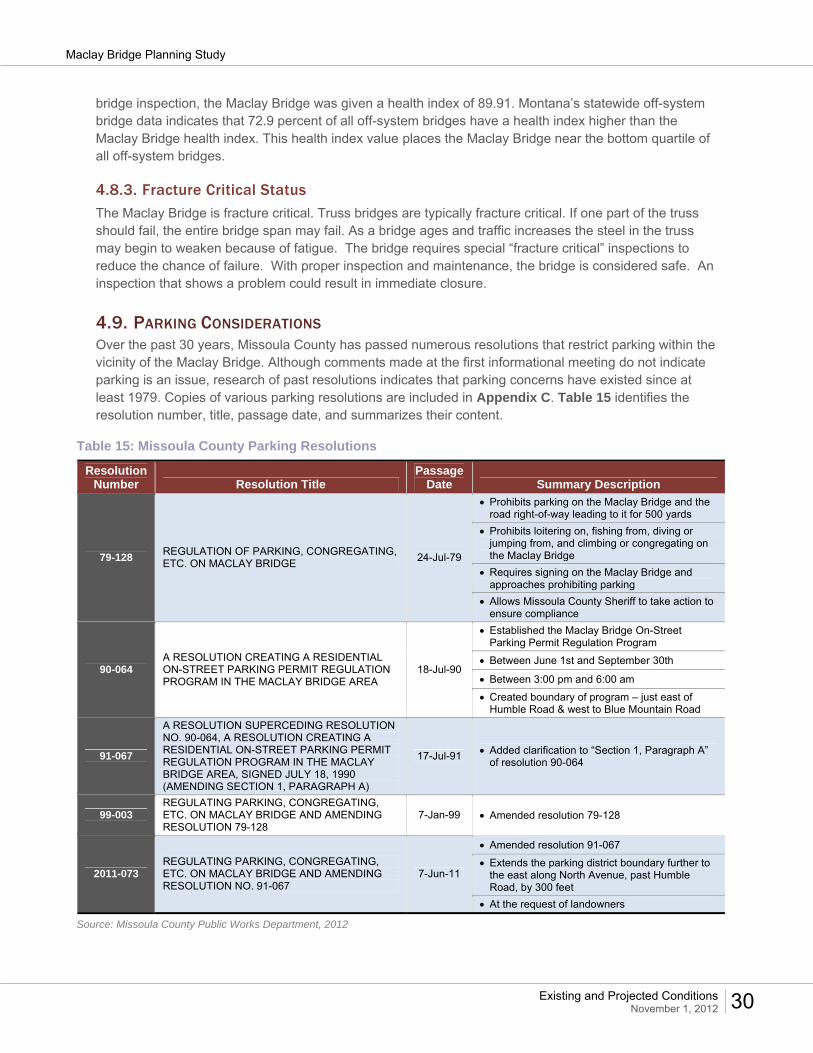
Maclay Bridge Planning Study
Existing and Projected Conditions November 1, 2012 30
bridge inspection, the Maclay Bridge was given a health index of 89.91. Montana’s statewide off-system bridge data indicates that 72.9 percent of all off-system bridges have a health index higher than the Maclay Bridge health index. This health index value places the Maclay Bridge near the bottom quartile of all off-system bridges.
4.8.3. Fracture Critical Status The Maclay Bridge is fracture critical. Truss bridges are typically fracture critical. If one part of the truss should fail, the entire bridge span may fail. As a bridge ages and traffic increases the steel in the truss may begin to weaken because of fatigue. The bridge requires special “fracture critical” inspections to reduce the chance of failure. With proper inspection and maintenance, the bridge is considered safe. An inspection that shows a problem could result in immediate closure.
4.9. PARKING CONSIDERATIONS Over the past 30 years, Missoula County has passed numerous resolutions that restrict parking within the vicinity of the Maclay Bridge. Although comments made at the first informational meeting do not indicate parking is an issue, research of past resolutions indicates that parking concerns have existed since at least 1979. Copies of various parking resolutions are included in Appendix C. Table 15 identifies the resolution number, title, passage date, and summarizes their content.
Table 15: Missoula County Parking Resolutions
Resolution Number Resolution Title
Passage Date Summary Description
79-128 REGULATION OF PARKING, CONGREGATING, ETC. ON MACLAY BRIDGE
24-Jul-79
Prohibits parking on the Maclay Bridge and the road right-of-way leading to it for 500 yards
Prohibits loitering on, fishing from, diving or jumping from, and climbing or congregating on the Maclay Bridge
Requires signing on the Maclay Bridge and approaches prohibiting parking
Allows Missoula County Sheriff to take action to ensure compliance
90-064 A RESOLUTION CREATING A RESIDENTIAL ON-STREET PARKING PERMIT REGULATION PROGRAM IN THE MACLAY BRIDGE AREA
18-Jul-90
Established the Maclay Bridge On-Street Parking Permit Regulation Program
Between June 1st and September 30th
Between 3:00 pm and 6:00 am
Created boundary of program – just east of Humble Road & west to Blue Mountain Road
91-067
A RESOLUTION SUPERCEDING RESOLUTION NO. 90-064, A RESOLUTION CREATING A RESIDENTIAL ON-STREET PARKING PERMIT REGULATION PROGRAM IN THE MACLAY BRIDGE AREA, SIGNED JULY 18, 1990 (AMENDING SECTION 1, PARAGRAPH A)
17-Jul-91 Added clarification to “Section 1, Paragraph A” of resolution 90-064
99-003 REGULATING PARKING, CONGREGATING, ETC. ON MACLAY BRIDGE AND AMENDING RESOLUTION 79-128
7-Jan-99 Amended resolution 79-128
2011-073 REGULATING PARKING, CONGREGATING, ETC. ON MACLAY BRIDGE AND AMENDING RESOLUTION NO. 91-067
7-Jun-11
Amended resolution 91-067
Extends the parking district boundary further to the east along North Avenue, past Humble Road, by 300 feet
At the request of landowners
Source: Missoula County Public Works Department, 2012

Maclay Bridge Planning Study
Existing and Projected Conditions November 1, 2012 31
In addition, a review of Missoula County “911 Calls” was completed. In a search of the call records for the Orchard Homes and Target Range areas for June, July and August of 2010 and 2011, numerous citations were issued (see Figure 6) in response to activities near the bridge. These citations included the following categories:
Criminal Mischief, Curfew and Loitering, Disorderly Conduct, Disturbance, Suspicious Activity Extra Patrol Hazardous Vehicle Other Hazard
During this time period, there were 109 calls made for the area located at the east end of the existing bridge (4680 North Avenue West). Of these calls, 42 were for “hazardous vehicle”, which is primarily related to parking concerns. The review of the provided 911 calls, coupled with the many parking resolutions passed over the four decades by Missoula County, indicate parking is a concern in the vicinity of the Maclay Bridge.

Maclay Bridge Planning Study
Existing and Projected Conditions November 1, 2012 32
Figure 6: Crime Locations in General Vicinity
4.10. ROADWAY SURFACING Existing roadway surfacing characteristics were determined through field measurements for River Pines Road, the Maclay Bridge, and North Avenue. Items measured included the surface width, lane width, shoulder width, and the presence of non-motorized features. Table 16 shows the existing roadway and bridge widths.
109 Reports at 4680 North Ave W:
9 – Criminal Mischief, Curfew and
Loitering, Disorderly Conduct,
Disturbance, and Suspicious Activities
40 – Extra Patrols
42 – Hazardous Vehicles
18 – Other Hazards

Maclay Bridge Planning Study
Existing and Projected Conditions November 1, 2012 33
Table 16: Existing Road and Bridge Surfacing
Location Lanes Surface Width
(ft) Lane Width
(ft) Shoulder Width
(ft)
North Ave W Clements Rd to Maclay Bridge 2 31 11 1 (north) / 8 (south)
Maclay Bridge On Bridge 1 14 14 0
River Pines Rd Maclay Bridge to Blue Mountain Road 2 22 11 0
Source: Estimated based on field measurements
The MDT Road Design Manual indicates a top width of 40 feet is appropriate. This roadway width would accommodate two 12-foot travel lanes and two 8-foot shoulders. The MDT RDM is a guideline only, and due to the approach roadways being under County jurisdiction, close coordination with Missoula County would be necessary to define the appropriate roadway width that is context sensitive to the community and still meets Missoula County requirements for safe and efficient travel. Missoula County standards (Table 10) indicate the required surfacing width would be 44 feet for a collector roadway. Neither the Missoula County nor MDT standard widths are attained on the bridge or its approaches.
4.11. ACCESS POINTS Access points were identified through a review of available GIS data, aerial photography and field observation. There are approximately 47 access points along River Pines Road and North Avenue. The vast majority of the access points are private approaches. There are 10 public approaches along these two segments within the study area. The prevalence of access points along a roadway can contribute to decreased safety as turning movements into and out of the access points may create conflict points. On high volume roadways it is generally desirable to attempt access management to reduce conflict points caused by turning traffic. Depending on the type of improvement options identified through this study, access management may be considered for some facilities within the vicinity of the Maclay Bridge.
Table 17 provides a summary of access points along River Pines Road and North Avenue.
Table 17: Access Points
Location Distance (mi) Public Private Access / mi North Ave W Clements Rd to Maclay Bridge 0.78 7 31 48.7
River Pines Rd Maclay Bridge to Blue Mountain Road 0.67 3 6 13.4
Total 1.45 10 37 32.4
Source: Estimated based on aerial photography
4.12. RIGHT-OF-WAY Existing right-of-way widths along River Pines Road and North Avenue are between 60 and 80 feet. New right-of-way, easements and/or construction permits from adjoining landowners will be required if improvement options extend beyond existing right-of-way limits based on legal land survey.
Also, a Montana Department of Natural Resources and Conservation (DNRC) land use license or easement would be required between the low water marks of the river for improvement options involving the construction of a bridge at a new location.
4.13. HYDRAULICS The Bitterroot River is the primary surface water feature within the study area. Any improvement option(s) identified will require an assessment of impacts to the Bitterroot River. If a project is developed that impacts the Bitterroot River, mitigation will be required depending on the type of impacts and permitting

Maclay Bridge Planning Study
Existing and Projected Conditions November 1, 2012 34
requirements. Although the Bitterroot River joins the Clark Fork River about 3,500 feet downstream from the bridge, it is unlikely any potential improvement options would affect the Clark Fork River. O’Brien Creek parallels River Pines Road and joins the Bitterroot River southwest of the existing bridge. A section of O’Brien Creek was recently restored by Montana Fish Wildlife & Parks (MFWP).
The Big Flat Irrigation Ditch crosses River Pines Road west of the Maclay Bridge and could be impacted depending of the type of improvement options identified through this study. A small Missoula Irrigation District ditch parallels South Avenue and the ditch crosses South Avenue west of Humble Road and west of Clements Road.
4.13.1. Floodplain Considerations The Maclay Bridge is located within a detailed delineated floodplain (FIRM panel 30063C1455). Accordingly, any bridge rehabilitation, reconstruction, or relocation would require a formal floodplain permit. There may be concerns pertinent to increases to the Flood Insurance Study (FIS) 100-year flood elevation. Missoula County floodplain regulations require the low chord of any “new” bridge to be 2 feet above the 100-year flood elevation. At its present North Avenue location, this would likely necessitate the bridge and associated road grade, to be raised. The existing bridge in its present condition would not be subject to the “no increase” requirement. This discussion is relevant for a future reconstruction or relocation option, and not applicable to a rehabilitation option.
Any identified improvement options, would need to be developed and analyzed to ensure impacts to the floodplain and river would be minimized. However, Federal Emergency Management Agency (FEMA) regulations require that if a project results in an increase of the published base flood elevation, a conditional letter of map revision (CLOMR) must be approved.
A CLOMR requires that FEMA approve the hydraulic model and revisions to the base flood elevation. A detailed floodplain model would be required to determine the proposed bridge opening and the effect on the base floodplain elevation. The existing FIS model would be obtained and used, however some new river cross sections would be required. This process can take a year or more.
4.13.2. Preliminary Hydrology The Bitterroot River at the Maclay Bridge drains 2,814 square miles of area and consists mostly of forested mountainous terrain within a wide populated valley. The design flood for a reconstruction or relocation improvement option would likely be the 100-year event due to the delineated floodplain and the risk to adjacent landowners. The 10, 50 and 500 year floods would also need to be modeled to meet CLOMR requirements. Table 18 contains preliminary hydrology values as computed by MDT. This information is useful to identify general “order of magnitude” flows and compare the published FIS values against USGS calculated results.
Table 18: Preliminary Hydrology for Bitterroot River
Source Area (sq mi) Q2 (cfs) Q5 (cfs) Q10 (cfs) Q25 (cfs) Q50 (cfs) Q100 (cfs) Q500 (cfs)
USGS (a) 2,814 14,500 20,000 23,400 27,300 30,000 32,500 38,000
FIS (b) 2,842 20,900 29,700 31,800 42,000
(a) USGS gage number 12352500 (b) The Flood Insurance Study (FIS) flows would likely be used for future design // Q = Flood flow in cubic feet per second (cfs)

Maclay Bridge Planning Study
Existing and Projected Conditions November 1, 2012 35
4.13.3. Channel Characteristics The Bitterroot River is meandering near the existing bridge, even though aerial photographs show that the banks have moved very little since the 1976 flood event, which was considered a historic flood year across Montana. The existing bridge has washed out at least two times since 1935. River Pines Road, located on the west side of the Bitterroot River, has rock riprap on its fill slope for approximately 750 feet upstream of the bridge. The FIS shows a 5-foot deep scour hole at the bridge, and about a foot of backwater for the base flood. Based on review of four aerial photographs from the years 1935 and 1961 (USFS), and 2003 and 2011 (USDA), it appears the scour hole has grown westward towards the west bank of the river. Scour holes can develop for a variety of reasons (i.e. poor angle of attack of the stream on the bridge, inadequate waterway opening under the bridge, etc.) and are of concern in that scour holes can eventually reach the bottom of footings and undermine bridge supports (columns and/or abutments). Channel scour was not part of the original design in the 1940’s, and the existing bridge piers are located in the river channel on unknown materials.
Gravel and sand bar development has been observed but not adequately studied both upstream and below the existing bridge. It appears the channel has been altered with the deposition of material upstream of the bridge (changing the shape of the channel changes stream flow). Increased water velocities also remove material from the stream bed. If too much material is washed away, the piers in the channel may become unstable.
Backwater is a concern as it can flood adjacent properties and change the flow regime just upstream of the bridge. There is a large island upstream from the existing bridge that has been there for a long time due to the size of the trees. Ice is considered to be light and debris is moderate at this location on the Bitterroot River. Although not properly studied, it appears that the existing bridge configuration has constricted the Bitterroot River when compared to its normal, free flow natural state. If a project is developed, this should be analyzed via detailed hydrologic and hydraulic modeling effort at some future time, if a project is developed.
4.14. TRANSIT SERVICE Transit service is currently provided by Mountain Line Transit via Route 9, which travels within the study area along South Avenue, Clements Road and Seventh Street, but does not cross the Maclay Bridge.
4.15. UTILITIES The existing Maclay Bridge carries an eight-inch natural gas line. There are overhead utility lines along the south side of South Avenue and along River Pines Road. There are also buried phone lines along both roads. Near the easterly bridge approach, there is a NorthWestern Energy natural gas substation that serves as a primary feeder hub for gas facilities on both sides of the Bitterroot River.
5.0 ENVIRONMENTAL SETTING This section provides a summary of the Environmental Scan. The primary objective of the Environmental Scan is to determine the potential constraints and opportunities within the Environmental Scan boundary. As a planning level scan, the information is obtained from various reports, websites and other documentation. This scan is not a detailed environmental investigation. Refer to the Environmental Scan for more detailed information.

Maclay Bridge Planning Study
Existing and Projected Conditions November 1, 2012 36
5.1. GEOGRAPHIC SETTING The Maclay Bridge is located at the western end of the Missoula Valley at the confluence of the Clark Fork and Bitterroot Rivers and encompasses lands in both the City of Missoula and Missoula County, Montana. The topography east of the Bitterroot River is generally level, while the area west of the Bitterroot River is comprised of foothills for the Bitterroot Mountains. Surface elevations over most of the area average about 3,120 feet above sea level with elevations exceeding 3,500 feet in the McCauley Butte area and in foothill areas.
5.1.1. Land Ownership and Land Management Most of the lands in the vicinity of the Maclay Bridge are privately owned with the exception of the Kelly Island Fishing Access Site, located near the confluence of the Clark Fork and Bitterroot Rivers, which is state-owned and managed by the MFWP. Some county-owned parcels and Lolo National Forest lands also exist in the area. Both the Five Valleys Land Trust and Rocky Mountain Elk Foundation hold conservation easements on some private lands within the general vicinity.
5.1.2. Land Use Land use in the area consists mostly of suburban residential properties on one-half acre or larger parcels, a few commercial uses, two schools and recreational/open spaces. The area also contains agricultural uses on irrigated lands ranging in size from one acre to 50 acres.
5.2. PHYSICAL RESOURCES
5.2.1. Geologic Resources According to Montana Bureau of Mines and Geology mapping, the area contains alluvial materials associated with modern channels and floodplains along with glacial lake deposits and volcanic bedrock in some portions. The foothills and mountains in the area are comprised mainly of Precambrian rocks of various formations.
5.2.2. Soils and Prime Farmland Information regarding areas of prime farmland in the area was compiled from the US Department of Agriculture, Natural Resource Conservation Service (NRCS). Using the NRCS’s Web Soil Survey website, several soil map units in the area have been classified as prime farmland if irrigated and farmland of local importance.
If a project is advanced using federal or state funds, coordination with the NRCS will be required to determine if the Farmland Protection Policy Act (FPPA) of 1981 (Title 7 United States Code, Chapter 73, Sections 4201-4209) applies and necessary NRCS processing requirements. Projects planned and completed without the assistance of a Federal agency are not subject to the FPPA.
5.2.3. Water Resources
SURFACE WATERS Surface waters in the area include the Bitterroot River, the Clark Fork River, and O’Brien Creek. Information on these surface waters within the area was obtained from the Montana Department of Environmental Quality’s (MDEQ) website. Section 303, subsection “d” of the Clean Water Act requires the State of Montana develop a list, subject to U.S. Environmental Protection Agency (USEPA) approval, of water bodies that do not meet water quality standards. When water quality fails to meet state water
Maclay Bridge Planning Study
Existing and Projected Conditions November 1, 2012 37
quality standards, MDEQ determines the causes and sources of the pollutants in a sub-basin assessment and sets maximum pollutant levels, called total maximum daily loads (TMDL).
A TMDL sets maximum pollutant levels in a watershed. The TMDLs become the basis for implementation plans to restore the water quality to a level that supports its designated beneficial uses. The implementation plans identify and describe pollutant controls and management measures to be undertaken (such as best management practices), the mechanisms by which the selected measures would be put into action, and the individuals and entities responsible for implementation projects.
The Bitterroot River and the Clark Fork River are both listed as a 303(d) water body within the area. Probable causes of impairment include nutrients, siltation/sediment, and thermal modification.
Placement of fill or excavation within these surface waters would be subject to regulation by the U.S. Army Corps of Engineers (USACOE) under Section 404 of the Clean Water Act and the Montana Stream Protection Act (SPA). Other water-related permits may also be necessary.
IRRIGATION FEATURES The area contains irrigation features and infrastructure associated with the Big Flat Irrigation District and the Missoula Irrigation District. Any potential impacts to irrigation facilities will need to be examined to determine if the irrigation facilities are considered waters of the U.S. and subject to jurisdiction by the U.S. Army Corps of Engineers (USACOE) or need approvals from the U.S. Department of the Interior Bureau of Reclamation
GROUNDWATER The Missoula aquifer, which most of the urban area population relies on, is a shallow unconfined aquifer formed in coarse alluvial material (sands and gravels) extending from the Clark Fork River at Hellgate Canyon westward across the valley to the Bitterroot River. The Missoula aquifer was designated as a Sole Source Aquifer by the USEPA in 1988. Following the designation, the Missoula Valley Water Quality District was formed in 1993. An Aquifer Protection Ordinance, administered by the Water Quality District, was adopted in 1994.
5.2.4. Wetlands The USACOE defines wetlands as those areas that are inundated or saturated by surface or ground water at a frequency and duration sufficient to support, and that under normal circumstances do support, a prevalence of vegetation typically adapted for life in saturated soil conditions. Wetlands generally include swamps, marches, bogs, and similar areas.
A wetlands survey was conducted for the Maclay Bridge EA in 1993 which identified riverine and areas of emergent and forested/shrub wetlands along the Bitterroot River. However, this survey is outdated and new wetland impact evaluation must be conducted if a project is forwarded. Wetland impacts should be avoided to the greatest extent practicable. All unavoidable wetland impacts would need to be mitigated as required by the USACOE.
5.2.5. Floodplains (EO 11988) and Floodways Executive Order (EO) 11988, Floodplain Management, requires federal agencies to avoid direct or indirect support of floodplain development whenever a practicable alternative exists. EO 11988 and 23 CFR 650 Part A requires an evaluation of project alternatives to determine the extent of any encroachment into the base floodplain. The base flood (100-year flood) is the regulatory standard used by federal agencies and most states to administer floodplain management programs. A “floodplain” is defined as lowland and relatively flat areas adjoining inland and coastal waters, including flood-prone

Maclay Bridge Planning Study
Existing and Projected Conditions November 1, 2012 38
areas of offshore islands, with a one percent or greater chance of flooding in a given year. As described in the Federal Highways Administration’s (FHWA) floodplain regulation (23 CFR 650 Part A), floodplains provide natural and beneficial values serving as areas for fish, wildlife, plants, open space, natural flood moderation, water quality maintenance, and groundwater recharge.
A FEMA delineated floodplain exists along the Bitterroot and Clark Fork Rivers in the Maclay Bridge area.
5.2.6. Hazardous Material The Montana Natural Resource Information System (NRIS) database was searched for underground storage tank (UST) sites, leaking underground storage tank (LUST) sites, abandoned mine sites, remediation response sites, landfills, National Priority List (NPL) sites, hazardous waste, crude oil pipelines, and toxic release inventory sites in the area.
The following sites where initially identified as locations with potential contamination impacts:
Eight underground storage tank locations; One leaking underground storage tank locations; and One petroleum release compensation site.
Further evaluation may be needed at specific sites to determine the potential for encountering contamination if a project requiring soil excavation is forwarded. This evaluation may include reviewing MDEQ files for specific sites and/or conducting subsurface investigation activities to determine the extent of soil and groundwater contamination at locations of interest. If contaminated soils or groundwater is encountered during construction, handling and disposing of the contaminated material would need to be conducted in accordance with State, Federal, and local laws and rules.
5.2.7. Air Quality EPA designates communities that do not meet National Ambient Air Quality Standards (NAAQS) as “non-attainment areas”. “Nonattainment areas” are localities where air pollution levels persistently exceed the NAAQS or MAAQS (Montana Ambient Air Quality Standards), or that contribute to ambient air quality in a nearby area that fails to meet standards. States are then required to develop a plan to control source emissions and ensure future attainment of NAAQS. An area that has been designated as non-attainment in the past, but now complies with the NAAQS is classified as a “maintenance” area.
The Maclay Bridge area is located in a non-attainment area for PM-10 and a maintenance area for carbon monoxide.
Transportation conformity considerations will apply in this area if projects forwarded use federal or state funds to help ensure that any proposed activities will not cause or contribute to any new violations of the NAAQS; increase the frequency or severity of NAAQS violations; or delay timely attainment of the NAAQS or any required interim milestone.
If a project forwarded uses federal of state funds, an evaluation will also be required to determine if there is any potential for Mobile Source Air Toxics Rule (MSAT) effects.
5.2.8. Noise Should a project be advanced with federal or state funds, it will be necessary to establish whether the project is a “Type I Project” as defined in 23 CFR 772.5(h). Type I projects involve:
Construction of a highway on a new location;

Maclay Bridge Planning Study
Existing and Projected Conditions November 1, 2012 39
The physical alteration of an existing highway which significantly changes either the horizontal or vertical alignment or increases the number of through-traffic lanes; or
The potential for creating a traffic noise impact (e.g., idling vehicles at rest areas, weigh stations).
A detailed noise analysis would be required for a Type I project. If it is determined that the project is not Type I, it is then considered a Type III project which does not require a noise analysis or consideration of noise abatement. Type II projects are retrofit noise abatement projects.
If a project is forwarded, future construction activities may cause localized, short-duration noise impacts. These impacts would need to be.
5.3. VISUAL RESOURCES Visual resources refer to the landscape character (what is seen), visual sensitivity (human preferences and values regarding what is seen), scenic integrity (degree of intactness and wholeness in landscape character), and landscape visibility (relative distance of seen areas) of a geographically defined view shed. The landscape throughout the area contains an array of biological, scientific, historic, wildlife, ecological, and cultural resources mixed with a remote location.
The Bitterroot River riparian corridor, the Kelly Island Fishing Access Site, Lolo National Forest land, and a large conservation easement in the McCauley Butte area provide areas of natural open space and add to the visual resources present in the area.
5.4. BIOLOGICAL RESOURCES Existing information on wildlife, fisheries and special status species known to occur or that may potentially occur in the area was reviewed from a variety of sources including the U.S. Fish and Wildlife Service (USFWS), the MFWP, the Montana Natural Heritage Program (MNHP), and other resource documents. This limited survey is in not intended to be a complete and accurate biological survey of the study area. A complete biological survey of the area would be needed before potential selection of a specific project site, if a project is forwarded.
5.4.1. Wildlife and Fish General fish and wildlife resources would need to be surveyed during any future project development process. MFWP should be contacted during the project development process for local expertise regarding the wildlife and fisheries resources of the area. If a project is forwarded from the improvement option(s), encroachment into the waterway and the associated riparian habitat should be minimized to the extent practicable.
WILDLIFE RESOURCES The most common forms of wildlife found on the developed lands in the area include species adapted to suburban life and some level of human disturbance as well as other species that make use of river and its riparian areas as permanent habitat and movement corridors. These include mule and white-tailed deer, small mammals (like coyote, red fox, squirrels, raccoons, skunks, beaver, mink), and a variety of rodents. Additionally, there are areas of winter range for elk, mule deer, and white-tailed deer located in the mountains and foothills in the area. Other species like moose, black bear, and mountain lion may occasionally pass through the riparian corridors and forested lands in the area.
Numerous species of birds occur in this portion of the Missoula area including ospreys, sandhill cranes, wild turkey, ringed-neck pheasant, a variety of raptors (osprey, bald eagles, falcons, and hawks), owls,

Maclay Bridge Planning Study
Existing and Projected Conditions November 1, 2012 40
woodpeckers, migratory waterfowl, and many neo-tropical migratory birds (flycatchers, warblers, vireos, grosbeaks, and orioles).
Amphibians and reptiles occurring in the area include spotted frog, leopard frog, bull frog, western yellow-bellied racer, western garter snake, and western painted turtle.
AQUATIC RESOURCES The major surface waters found within the area include the Bitterroot River, Clark Fork River, O’Brien Creek, and the Big Flat Ditch. All of these waters, except for the Big Flat Ditch, are managed as fisheries by the MFWP. The Bitterroot and Clark Fork Rivers have been rated as Outstanding for their fisheries resource value by MFWP. Both streams receive recreational angler use year-round for sport fishing although restrictions exist relative to fishing for certain species. O’Brien Creek has a Moderate rating for its fisheries resource value and is open to use by anglers on a seasonal basis.
According to maps developed by the USFWS, the Bitterroot and Clark Fork Rivers and O’Brien Creek are designated as Bull Trout Critical Habitat (BTCH).
5.4.2. Threatened and Endangered Wildlife Species The federal list of endangered and threatened species is maintained by the USFWS. Species on this list receive protection under the Endangered Species Act (ESA). An ‘endangered’ species is one that is in danger of extinction throughout all of a significant portion of its range. A ‘threatened’ species is one that is likely to become endangered within the foreseeable future throughout all or a significant portion of its range. The USFWS also maintains a list of species that are candidates or proposed for possible addition to the federal list.
The endangered, threatened, proposed, and candidate species list for Montana Counties (March 2012) was obtained from the USFWS website. This list generally identifies the counties where one would reasonably expect the species to occur, not necessarily every county where the species is listed. Table 19 shows the listed species that could potentially occur within Missoula County and provides information about habitats where these species typically occur.

Maclay Bridge Planning Study
Existing and Projected Conditions November 1, 2012 41
Table 19: USFWS Endangered, Threatened, Proposed, and Candidate Wildlife Species
Common Name Scientific
Name USFWS Status Habitat Requirements
Bull Trout Salvelinus confluentus
Threatened, Critical Habitat Designated
Bull trout are found in the Clark Fork and Flathead drainages of western Montana. Sub-adult and adult fluvial bull trout reside in larger streams and rivers and spawn in smaller tributary streams, whereas adfluvial bull trout reside in lakes and spawn in tributaries. Within the Maclay Bridge area, the Bitterroot River, Clark Fork River, and O’Brien Creek are designated as Critical Habitat for bull trout.
Grizzly Bear Ursus arctos horribilus
Threatened
In Montana, Grizzly Bears primarily use meadows, seeps, riparian zones, mixed shrub fields, closed timber, open timber, sidehill parks, snow chutes, and alpine slabrock habitats. Grizzly bear habitat and recovery zones in Missoula County include the Seeley, Swan, and Jocko Valleys, lower Mission Valley, and portions of the upper Rattlesnake watershed.
Canada Lynx Lynx Canadensis
Threatened, Critical Habitat Designated
West of the Divide, Canada Lynx generally occur in subalpine forests at elevations between 4,000 to 7,000 feet in stands composed of pure lodgepole pine but also mixed stands of fir, pine, larch, and hardwoods. Habitat for the species does not exist in the Maclay Bridge area.
Wolverine Gulo gulo luscus
Candidate
Wolverines live in remote and inhospitable places away from human populations. In the northern Rocky Mountains, wolverines are restricted to high mountain environments near the treeline, where conditions are cold year-round and snow cover persists well into the month of May. Habitat for the species does not exist in the Maclay Bridge area.
Yellow Billed Cuckoo (Western Population)
Coccyzus americanus
Candidate
Western cuckoos breed in large blocks of riparian habitats, particularly woodlands with cottonwoods and willows. This candidate species requires patches of at least 25 acres of dense, riparian forest with a canopy cover. This habitat may be present in the Maclay Bridge area.
Source: USFWS, List of Endangered, Threatened, Proposed and Candidate Species Montana Counties.
An evaluation of potential impacts to all endangered, threatened, proposed, or candidate species will need to be completed during the project development process.
5.4.3. Montana Animal Species of Concern Wildlife species of concern are native Montana animals that are considered to be “at risk” due to declining population trends, threats to their habitats, and/or restricted distribution. Designation of a species as a Montana Animal Species of Concern (or Potential Species of Concern) is not a statutory or regulatory classification. The designation as a Species of Concern provides a basis for resource managers and decision-makers to make proactive decisions regarding species conservation and data collection priorities. Each Species of Concern is assigned a state numeric rank ranging from S1 (highest risk, greatest concern) to S5 (demonstrably secure, least concern) reflecting the degree of risk to each species based on available information. Other state ranks applied to Species of Concern include: SU (unrankable due to insufficient information), SH (historically occurred), and SX (believed to be extinct). State ranks may be followed by modifiers, such as B (breeding), N (non-breeding), or M (migratory).
Table 20 lists the animal species of special concern by the Montana Heritage Program in the study area. The results of the data search reflect the current status of their data collection efforts. These results are not intended as a final statement on sensitive species within a given area, or as a substitute for on-site surveys. If a project is forwarded from the improvement option(s), on-site surveys will need to be completed during the project development process.

Maclay Bridge Planning Study
Existing and Projected Conditions November 1, 2012 42
Table 20: Montana Animal Species of Concern
Common Name Scientific Name State Rank
MNHP Occurrences in General Area by
Township and Range
MNHP Known Occurrences in Maclay
Bridge Area
Westslope Cutthroat Trout Oncorhynchus clarkia lewisi S2 T13N, R20W T12N, R20W
Yes
Hoary Bat Laslurus cinereus S3 T13N, R20W T12N, R20W
Yes
Fisher Martes pennanti S3 T13N, R20W Possible on Lolo National Forest
Black-backed Woodpecker Picoides arcticus S3 T13N, R20W T12N, R20W
Yes
Western Skink Eumeces skiltonianus S3 T13N, R20W Yes
Fringed Myotis Myotis thysanodes S3 T12N, R20W Yes
Grasshopper Sparrow Ammodramus savannarum S3B T12N, R20W Yes
Cassin's Finch Carpodacys cassinii S3 T12N, R20W Yes
Pileated Woodpecker Dryocopus pileatus S3 T12N, R20W Yes
Lewis's Woodpecker Melanerpes lewis S2B T12N, R20W Yes
Flammulated Owl Otus flammeolus S3B T12N, R20W No
Bald Eagle Halieetus leucocephalus T13N, R20W T12N, R20W
Yes
Great Blue Heron Ardea herodias S3 T13N, R20W T12N, R20W
Yes
Source: Montana Natural Heritage Program, Animal and Plant Species of Concern Searchable Database.
5.4.4. Vegetation This portion of the Missoula Valley contains isolated remnants of native vegetation. Areas of native dry grasslands, open ponderosa pine forest, and riparian deciduous forests and associated wetlands exist along the Bitterroot and Clark Fork Rivers. Vegetation in developed areas consists of ornamental trees and shrubs, lawns, and flowerbeds associated with residential landscapes. The area also contains areas of cultivated lands.
THREATENED AND ENDANGERED PLANT SPECIES The online database of threatened, endangered, proposed, and candidate plant species maintained by the USFWS identifies two plants—Water Howellia and Whitebark Pine—as potentially occurring in Missoula County. Water Howellia is a threatened plant species and the Whitebark Pine is a candidate species for listing. Table 21 presents habitat requirements for each of these species. Known occurrences and habitat requirements suggest these plants are unlikely to occur in the area.
Table 21: USFWS Endangered, Threatened, Proposed, and Candidate Plant Species
Common Name
Scientific Name
USFWS Status Habitat Requirements
Water Howellia Howellia aquaticus
Threatened
Water howellia is a winter annual aquatic plant that grows in small, vernal, freshwater wetlands that have an annual cycle of filling up with water over the fall, winter and early spring, followed by drying during the summer. The wetlands typically consist of small shallow ponds within a matrix of forest vegetation and are usually bordered in part by deciduous trees. Known occurrences of the species in Montana are all within the Swan River drainage in the northeastern portion of Missoula County.
Whitebark Pine Pinus albicaulis
Candidate Whitebark pine typically occurs in isolated stands on cold and windy high-elevation or high-latitude sites in western North America. This habitat does not exist in the Maclay Bridge area.
Source: USFWS, List of Endangered, Threatened, Proposed and Candidate Species Montana Counties.

Maclay Bridge Planning Study
Existing and Projected Conditions November 1, 2012 43
As with listed wildlife species, consultation with the USFWS will be necessary and an evaluation of potential impacts to all listed, candidate, and proposed plant species must be completed if a project is forwarded.
PLANT SPECIES OF CONCERN The file search of the MNHP database lists one plant species of concern—Toothcup (Rotala ramosior)—in the area. Toothcup is a rare plant identified from only a limited number of wetland sites in western Montana.
The results of the MNHP database search are not intended as a final statement on sensitive species within a given area, or as a substitute for on-site surveys. If a project is forwarded, a determination will need to be made if there is a need for any on-site surveys for plant species of concern during the project development process.
NOXIOUS WEEDS Noxious weeds degrade habitat, choke streams, crowd native plants, create fire hazards, poison and injure livestock and humans, and fouls recreation sites. Areas with a history of disturbance are at particular risk of weed encroachment. There are 32 noxious weeds in Montana, as designated by the Montana Statewide Noxious Weed List (effective April 15, 2008). According to the Montana Invaders Database, there are documented occurrences of 20 noxious weed species in Missoula County since 1875. The area will need to be surveyed for noxious weeds. County Weed Control Supervisors should be contacted regarding specific measures for weed control during project development.
5.5. CULTURAL AND ARCHAEOLOGICAL RESOURCES Section 106 of the National Historic Preservation Act (36 CFR 800) establishes requirements for taking into account the effects of proposed Federal, Federally assisted or Federally licensed undertakings on any district, site, building, structure or object included in or eligible for inclusion in the National Register of Historic Places (NRHP).
A Cultural Resources Information System (CRIS) and Cultural Resources Annotated Bibliography (CRABS) file search was conducted for the area. The CRABS file search indicates 26 cultural resource surveys have been conducted on lands within or near the area between 1978 and 2010. The CRIS file search identified 28 recorded properties within the area including one National Register-listed site—the Fort Missoula Complex (24MO0266).
Table 22 lists the site name (where known), assigned Smithsonian Site Number, resource type, and National Register of Historic Places (NRHP) eligibility status for previously recorded cultural resource sites within the study area. There may be additional unknown cultural sites located within the area have not been identified and recorded.

Maclay Bridge Planning Study
Existing and Projected Conditions November 1, 2012 44
Table 22: Summary of Cultural Resources
Resource Name Smithsonian
Site # Type of Resource National Register Eligibility Status Stettler Property 24MO05l6 Historic Residence Ineligible
Rice Property 24MO05l7 Historic Residence and Outbuildings Consensus determination of eligibility
Maxwell Property 24MO05l8 Historic Residence and Outbuildings Ineligible
Maclay Property 24MO0519 Historic Residence and Outbuildings Recommended as eligible for National Register
Missoula Irrigation District Ditches
24MO0520 Historic Irrigation System Consensus determination of eligibility
Maclay Bridge 24MO0521 Historic Vehicular/Foot Bridge Determined eligible for National Register
Big Flat Ditch 24MO0587 Historic Irrigation System Consensus determination of eligibility
Maclay Ditch 24MO0954 Historic Irrigation System Undetermined
Target Range Elementary School
24MO0589 Historic School Listed on the National Register
Site in T13N, R20W, Sec. 35 24MO0209 Lithic Material Concentration Undetermined
Site in T13N, R20W, NW 1/4 Sec. 35
24MO1388 Historic Residence Undetermined
Source: Montana Historical Society, CRIS File Search Results, 3/21/2102.
If a project is forwarded from the Planning Study, a cultural resource survey of the Area of Potential Effect (APE) for the project as specified in Section 106 of the National Historic Preservation Act would need to be conducted. Section 106 outlines a process to identify historic properties that could be affected by the undertaking, assess the effects of the project and investigate methods to avoid, minimize or mitigate any adverse effects on previously recorded and newly discovered historic or archaeological resources.
5.5.1. 4(f) Resources A review was conducted to determine the presence of Section 4(f) properties along the corridor. Section 4(f) refers to the original section within the Department of Transportation Act of 1966 (49 U.S.C. 303), which sets the requirements for consideration of park and recreational lands, wildlife and waterfowl refuges, and historic sites in transportation project development. Table 23 lists resources within the Maclay Bridge area that may potentially be subject to Section 4(f). A graphic showing 4(f) resources is included in the Environmental Scan, a separate document prepared for the Maclay Bridge Planning Study.

Maclay Bridge Planning Study
Existing and Projected Conditions November 1, 2012 45
Table 23: Summary of Potential Section 4(f) Resources
Name Type of 4(f) Resource Comments /Location
Kelly Island FAS Public Recreation Site 666-acre site located at confluence of Bitterroot and Clark Fork Rivers, owned and managed by MFWP
Rosecrest Park (a) Neighborhood Park 9.6 acres located south Spurgin Road between Clement Road and 37th Avenue. County ownership
Schmautz Park (a) Neighborhood Park 4.2 acres, undeveloped parcel located north of North Avenue and west of 42nd Avenue. County ownership
Target Range School Playground Target Range School (24MO0589)
Neighborhood Park Historic School
10-acre area containing sports fields, basketball courts, and play equipment. Target Range School is listed on National Register.
Dinsmore River Four Conservation Park Bitterroot River island habitat located south of existing Maclay Bridge County ownership
Double R Acres Conservation Park Clark Fork River riparian habitat adjoining Kelly Island FAS. County ownership
O’Brien Cr. Meadows Common Area
Conservation Park O’Brien Creek riparian area located near intersection of Big Flat Road and O’Brien Creek Road. County ownership. Identified in Missoula County Parks and Conservation Lands Plan (1997)
Capi Court Park (a) Unimproved County Park North of Spurgin Road and east of Sierra Drive
Five Valley Land Trust Conservation Easements
Wildlife Habitat/Public Use Various locations along Bitterroot River
Lolo National Forest Lands Public Multiple-use Property South and west of Maclay Bridge area, part of Blue Mountain Recreation Area
Rice Property (24MO05l7) Historic Residence and Outbuildings
Consensus determination of eligibility for National Register
Maclay Property (24MO05l9) Historic Residence and Outbuildings
Recommended as eligible for National Register
Maclay Bridge (24MO052l) Historic Vehicular/Foot Bridge
Determined eligible for National Register. Owned by Missoula County
Big Flat Ditch (24MO0587) Missoula Irrigation District Ditches (24MO0520)
Historic Irrigation Systems Consensus determination of eligibility for National Register
Sources: 1) Montana Historical Society, CRIS File Search Results, 3/21/2102; 2) Missoula County Parks and Conservation Lands Plan, 1997.; 3) Missoula County, Final Draft Parks and Trails Master Plan, 2012. (a) Capi Court, Rosecrest Park, and Schmautz Park are county parks that are the result of subdivision park and open spaces requirements from the Missoula County Subdivision Regulations, section 3-080.
Prior to approving a project that “uses” a Section 4(f) resource, FHWA must find that there is no prudent or feasible alternative that completely avoids 4(f) resources. “Use” can occur when land is permanently incorporated into a transportation facility or when there is a temporary occupancy of the land that is adverse to a 4(f) resource. Constructive “use” can also occur when a project’s proximity impacts are so severe that the protected activities, features, or attributes that qualify a resource for protection under 4(f) are “substantially impacted”.
Section 4(f) does not apply to projects that do not use federal transportation funding.
5.5.2. 6(f) Resources Section 6(f) of the Land and Water Conservation Fund Act (LWCF) (16USC, Section 4601 et. seq.) provides funds for buying or developing public use recreational lands through grants to local and state governments. Section 6(f)(3) of the Act prevents conversion of lands purchased or developed with LWCF funds to non-recreation uses, unless the Secretary of the Department of Interior (DOI), through the National Park Service (NPS), approves the conversion.
A review of the LWCF grants in Missoula County maintained by MFWP shows that Kelly Island Fishing Access Site (FAS) is the only property in the area acquired/improved under Section 6(f) of the LWCF.

Maclay Bridge Planning Study
Existing and Projected Conditions November 1, 2012 46
6.0 CONCLUSION This section provides a list and description of areas of concern and other consideration within the vicinity of the Maclay Bridge. These areas were identified through review of available reports, field review, public databases, and other resources.
6.1. TRANSPORTATION SYSTEM The following transportation system areas of concern were noted:
Traffic Volumes
Existing and projected traffic volumes (2,610 vpd and 5,650 vpd, respectively) exceed the AASHTO standard for a single-lane bridge (traffic volume < 100 vpd).
Safety
A number of crash trends and areas of concern were identified within the crash analysis area. Specific areas of concern identified are located on the following roadways: Big Flat Road Blue Mountain Road North Avenue River Pines Drive South Avenue
Travel Time
Without the existing Maclay Bridge in service, it would be expected to take approximately 18.58 minutes longer using the Kona Bridge or 4.47 minutes longer using the Buckhouse Bridge when travelling between Community Medical Hospital to the intersection of Big Flat Road/Blue Mountain Road/O’Brien Creek Road/River Pines Road. In terms of emergency service, this means that travel times would likely be longer if the Maclay Bridge is out of service.
Any delay in emergency response travel time, typically measured in seconds, is an important
consideration within the planning area. Comments provided by the Missoula Rural Fire Department state that 5 minutes or more are added to their response times when using the Buckhouse Bridge in lieu of the Maclay Bridge.
Horizontal Alignment
Three horizontal curves do not meet current Missoula County or MDT standards. Two of the sub-standard horizontal curves lead into and out of each side of the existing
bridge. A crash trend has been identified at the west end of the bridge (intersection of River Pines
Road & Riverside Drive).
Clear Zones
Numerous locations have features within the horizontal clear zone and are unprotected. Primary concern is located along River Pines Road adjacent to the Bitterroot River, where the top of fill slope is within 2 to 4 feet of the edge of the travel lane.

Maclay Bridge Planning Study
Existing and Projected Conditions November 1, 2012 47
Bridge
The existing bridge is “functionally obsolete” due to the approach geometry on both ends of the bridge, and the narrow single lane bridge width.
The existing bridge is “load restricted” due to its present condition, which prevents some vehicles from crossing.
The Maclay Bridge has a Bridge Health Index that suggests its individual components are in good condition.
The Maclay Bridge is fracture critical, indicating if one part of the truss should fail, the entire bridge span may fail. With proper inspection and maintenance, the bridge is considered safe.
There are no bicycle or pedestrian features on the bridge. The current structure exhibits spalling and cracked concrete and exposed rebar. Rust and steel pitting is observed under the bridge on some load bearing members and the deck. The bridge is a composite of varying ages and types of load-bearing steel used throughout the
structure. The strength of the steel is unknown in much of the bridge, as it has never been tested. Channel scour was not part of the original design in the 1940’s, and the existing bridge piers are
located in the river channel on unknown materials.
Parking
Parking concerns are evident based on numerous resolutions passed by the Missoula County Commission, and also based on numerous “911 calls” to the area.
Widths
The single lane bridge width of 14 feet does not meet current AASHTO, Missoula County or MDT standards for width given existing and projected traffic volumes.
Roadway widths on River Pines Road do not incorporate shoulders. Bicycle and pedestrian facilities are absent on River Pines Road.
6.2. ENVIRONMENTAL CONSIDERATIONS WITHIN ENVIRONMENTAL SCAN BOUNDARY The following environmental considerations were noted. They are referenced herein for completeness, and do not necessarily point to a defined area of concern. In some instances, the included language is intended to bring attention to unique permitting requirements if and when a project is developed. Environmental considerations are more fully described in the Environmental Scan document, a separate memorandum prepared as part of the Maclay Bridge Planning Study.
Prime Farmland
Areas of prime farmland, farmland of statewide importance, and farmland of local importance are located within the area.
Water Resources
The Bitterroot River, Clark Fork River, and O’Brien Creek are located within the area. The Bitterroot River and Clark Fork River are listed as 303(d) water bodies, which do not meet water quality standards.
Irrigation facilities exist within the area. Numerous private groundwater wells are in the area, along with on-site wastewater systems.

Maclay Bridge Planning Study
Existing and Projected Conditions November 1, 2012 48
Wetlands
Wetlands are located within the area.
Floodplains and Floodway
FEMA-delineated floodplains exist along the Bitterroot and Clark Fork Rivers, and at the confluence of O’Brien Creek and the Bitterroot River.
Missoula County would have a “no increase” requirement for the 100-year base flood elevation measured against the existing FEMA base flood elevations.
Based on field review, it appears that the existing bridge configuration has constricted the Bitterroot River when compared to its normal, free flow natural state. This should be analyzed via detailed hydrologic and hydraulic modeling effort at some future time, if a project is developed.
Although not properly studied, it appears the Bitterroot River channel has been altered with the deposition of material upstream of the bridge.
Although not properly studied, it appears that increased water velocities have removed material from the stream bed. If too much material is washed away, the piers in the channel may become unstable.
Based on an initial review, but not properly studied, of four aerial photographs from the years 1935 and 1961 (USFS), and 2003 and 2011 (USDA), it appears the scour hole has grown westward towards the west bank of the river.
Hazardous Substances
There are eight underground storage tank (UST) locations. There is one leaking underground storage tank (LUST) location. There is one petroleum release compensation site.
Air Quality
Transportation conformity analysis would be required regardless of funding sources, via the MPO’s regional emissions analysis, should an improvement option be forwarded.
Fish and Wildlife
Five endangered, threatened, proposed, or candidate species are listed for Missoula County. Of the five, two may be likely to occur within the area. These are the Bull Trout (threatened, critical habitat designated) and the Yellow Billed Cuckoo (candidate species).
13 animal species of concern are listed for Missoula County.
Vegetation
No endangered, threatened, proposed, or candidate plant species are expected to occur within the area.
One plant species of concern may potentially be found within the area – Toothcup (Rotala ramosior).
Cultural and Archaeological Resources
Eleven separate cultural resources are known to exist within the area. Fourteen 4(f) resources are located within the area. One of the fourteen is also a 6(f) site.

Maclay Bridge Planning Study
Existing and Projected Conditions November 1, 2012 49
6.3. OTHER CONSIDERATIONS The following other considerations were noted:
Neighborhood residents have expressed concern over:
Speeds being an issue on North Avenue, River Pines Road and South Avenue. Traffic Growth through the neighborhood in recent years, and the potential for that to continue. Safety and the potential for increased vehicle crashes. Noise impacts due to increasing vehicular traffic through the area. Livability and the desire to maintain the rural character of the area and limit traffic growth.
The Target Range Neighborhood Plan emphasizes the importance of continued County maintenance of the structure to help preserve access for local and Missoula Valley residents seeking recreational opportunities on nearby lands.
The Target Range Neighborhood Plan does not identify the need for a new bridge. Unreported behavior related to individuals jumping off the bridge structure and/or recreating on
the river islands, sand bars, and bridge scour hole.
Project Nomination
Missoula County has nominated the existing Maclay Bridge for replacement using funding from FHWA’s Off-System Bridge Program (formerly known as the Highway Bridge Replacement and Rehabilitation Program), pending the outcome of this planning study.