Embed Size (px)
Citation preview

This paper is included in the Proceedings of the 23rd USENIX Security Symposium.
August 20–22, 2014 • San Diego, CA
ISBN 978-1-931971-15-7
Open access to the Proceedings of the 23rd USENIX Security Symposium
is sponsored by USENIX
Exit from Hell? Reducing the Impact of Amplification DDoS Attacks
Marc Kührer, Thomas Hupperich, Christian Rossow, and Thorsten Holz, Ruhr-University Bochum
https://www.usenix.org/conference/usenixsecurity14/technical-sessions/presentation/kuhrer

USENIX Association 23rd USENIX Security Symposium 111
Exit from Hell? Reducing the Impact of Amplification DDoS Attacks
Marc Kuhrer, Thomas Hupperich, Christian Rossow, Thorsten HolzHorst Gortz Institute for IT-Security, Ruhr-University Bochum
AbstractAmplification vulnerabilities in many UDP-based net-
work protocols have been abused by miscreants to launchDistributed Denial-of-Service (DDoS) attacks that ex-ceed hundreds of Gbps in traffic volume. However, upto now little is known about the nature of the amplifica-tion sources and about countermeasures one can take toremediate these vulnerable systems. Is there any hope inmitigating the amplification problem?
In this paper, we aim to answer this question and tacklethe problem from four different angles. In a first step, wemonitored and classified amplification sources, showingthat amplifiers have a high diversity in terms of operat-ing systems and architectures. Based on these results,we then collaborated with the security community in alarge-scale campaign to reduce the number of vulnera-ble NTP servers by more than 92%. To assess possiblenext steps of attackers, we evaluate amplification vulner-abilities in the TCP handshake and show that attackerscan abuse millions of hosts to achieve 20x amplifica-tion. Lastly, we analyze the root cause for amplificationattacks: networks that allow IP address spoofing. Wedeploy a method to identify spoofing-enabled networksfrom remote and reveal up to 2,692 Autonomous Systemsthat lack egress filtering.
1 Introduction
Distributed Denial-of-Service (DDoS) attacks have beenknown since many years [8,9,24,34] and they still consti-tute an important problem today. For a long time, DDoSattacks were hard to tackle due to their semantic nature:it is difficult to distinguish an actual attack from a sud-den rise in popularity for a given service due to a flashcrowd (“Slashdot effect”). A large body of literature isavailable on this topic and many DDoS detection mecha-nisms and countermeasures have been proposed over theyears (e.g., [14,15,43]). Furthermore, advances in Cloudcomputing and load balancing techniques helped to miti-gate this problem [17,18], and nowadays simple types ofDDoS attacks such as SYN and UDP flooding are well-understood.
However, the adversaries evolved and modern DDoSattacks typically employ so called amplification attacks,in which attackers abuse UDP-based network protocolsto launch DDoS attacks that exceed hundreds of Gbpsin traffic volume [21, 22]. This is achieved via reflec-tive DDoS attacks [31] where an attacker does not di-rectly send traffic to the victim, but sends spoofed net-work packets to a large number of systems that reflect thetraffic to the victim (so called reflectors). Often, attackerschoose reflectors that send back responses that are signif-icantly larger than the requests, leading to an increased(amplified) attack volume. We call such reflectors ampli-fiers. Recently, many types of such amplification attackswere discovered [33]. However, little is known about thenature of the amplifiers and about countermeasures onecan take to remediate vulnerable systems.
In this paper, we address this problem and study theroot causes behind amplification DDoS attacks. Wetackle the problem from four different angles and pro-vide empirical measurement results based on Internet-scale scanning to quantify the problem.
In a first step, we want to understand the nature of am-plifiers and determine which kinds of systems are vul-nerable. Previous work on empirically understandingDDoS attacks typically focused on ways to estimate thesize of the problem and understanding the infrastructurebehind such attacks [1, 5, 26]. To increase the under-standing of amplification attacks, we utilized protocol-specific fingerprinting to reveal as much information aspossible from systems that can be abused on the Internet.More specifically, we enumerated the amplifier sourcesfor seven network protocols and performed large-scalescans to collect information about vulnerable systems.This enables us to categorize the types of devices thatcan be abused in the wild. We found that there is a largediversity of vulnerable devices and analyzed their prop-erties. For example, we found 40.8% of the vulnerableNTP hosts to run Cisco IOS, an OS that is deployed onCisco network devices.
Based on these insights on amplifiers, a viable nextstep is to reduce the number of vulnerable systems onthe Internet. Previous work on that topic mainly focused

112 23rd USENIX Security Symposium USENIX Association
on understanding botnet Command & Control serversthat are used to orchestrate classical DDoS attacks [5].However, modern amplification attacks use a completelydifferent modus operandi. We contributed to a globalsecurity notification procedure where our scanning re-sults were used to notify NOCs and CERTs of hun-dreds of large ISPs worldwide about NTP servers vul-nerable to amplification attacks. Furthermore, we col-laborated with security organizations in order to createadvisories that describe the technical background and ap-proaches to solve the problem. We analyzed the remedi-ation success of these measures and found that the num-ber of NTP servers vulnerable to monlist amplificationdropped by 92% in a 13-week period between November2013 and February 2014. We closely analyzed this effectand found that especially vulnerable NTP servers withinARIN have been mitigated, while other geographic re-gions lag behind.
Since it seems feasible to significantly reduce the num-ber of amplifiers, a third angle of the problem is an anal-ysis of potential attack vectors that adversaries couldabuse in the future. We start with the basic insight that upto now UDP-based protocols are leveraged by attackers,since these protocols provide large amplification factors.We study a completely different kind of amplification at-tacks, namely TCP-based ones. Surprisingly, even TCPcan be abused for amplification attacks, despite the factthat this protocol uses a 3-way handshake. This is dueto the fact that certain TCP stacks retransmit SYN/ACKpackets multiple times (some 20x or more) when theypresume that the initial SYN/ACK segment was lost. Thusan amplification of 20x or more is possible. Empiricalscan results suggest that there are hundreds of thousandsof systems on the Internet that can be abused this way.We performed protocol-specific fingerprinting to learnmore about the nature of such devices.
As a fourth angle of the problem, we analyzed theroot cause behind amplification attacks: if a given net-work does not perform egress filtering (i.e., verifiesthat the source IP address in all outbound packets iswithin the range of allocated internal address blocks, seeBCP 38 [13] for details), an attacker can spoof packetsand thus initiate the first step of reflective DDoS attacks.Identifying such networks is a challenging problem [12]and existing solutions rely on a client deployed in thenetwork under test [3,36]. We utilize a novel remote testbased on DNS proxies that enables us to identify thou-sands of Autonomous Systems that support IP spoofing.To summarize, our contributions are as follows:• We performed Internet-wide scans to identify and
monitor all relevant potential amplifiers for sevennetwork protocols vulnerable to amplification at-tacks. We fingerprint and categorize these systems,showing a high diversity in the amplifier landscape.
• We study the success of a global security notifica-tion campaign to alert administrators of vulnerableNTP servers and show the benefits and limitationsof such large-scale initiatives.
• Aiming to assess further amplification DDoS tech-niques, we identify TCP as an alternative sourcefor amplification—despite its three-way-handshakeprotocol. We reveal millions of systems that can beabused to amplify TCP traffic by a factor up to 20x.
• Finally, we aim to tackle the root cause for amplifi-cation DDoS attacks: networks that do not performegress filtering and thus allow IP address spoofing.We deploy a remote scanning technique and find upto 2,692 ASes that permit spoofed IP traffic.
Paper Outline. The paper is organized as follows. InSection 2, we define the threat model and outline ourscanning setup to perform Internet-wide scans. We thenshed light onto the landscape of hosts that are vulnerableto UDP-based amplification DDoS attacks. In Section 3,we detail the effects of our NTP case study. Section 4tackles the problem of TCP-based amplifiers, demon-strating that the TCP three-way-handshake can be abusedfor amplification attacks. In Section 5, we introduce anovel mechanism to identify networks that allow IP ad-dress spoofing. Section 6 reviews prior work and we con-clude this paper in Section 7.
2 Amplification DDoS
We begin with an analysis of the threat landscape. Tothis end, we first review the general threat model beforewe analyze different aspects of amplification DDoS at-tacks. More specifically, we study the amplifier magni-tude, measure what kinds of devices can be abused onthe Internet, and determine the churn of amplifiers.
2.1 Threat ModelThe scope of this work are amplification DDoS attacks.In such an attack, a miscreant abuses public systems(such as open recursive DNS resolvers) to reflect attacktraffic to a DDoS victim [31]. In particular, she abuseshosts that not only reflect but also amplify the traffic.Typically, the attacker chooses connection-less protocolsin which she can send relatively small requests that resultin significantly larger responses. By spoofing the sourceof the traffic (i.e., impersonating the victim), she can en-force that the public systems—unwillingly—amplify andreflect traffic to the victim. Prior work has revealed thatat least 14 UDP-based protocols are vulnerable to suchabuse [33]. These protocols offer severe amplificationrates—in the worst case, as with the monlist feature inNTP, they amplify traffic by a factor of up to 4,670.
2

USENIX Association 23rd USENIX Security Symposium 113
2.2 Amplifier Magnitude
In this paper, we try to shed light onto the landscape ofamplifiers, i.e., hosts that are vulnerable to amplificationabuse. As a first step, we enumerate and observe theseamplifiers in the IPv4 address space. That is, we per-formed Internet-wide scans for a subset of the vulnerableprotocols: DNS, SNMP, SSDP, CharGen, QOTD, NTP,and NetBIOS. We chose to monitor these protocols, asprior work only approximated the amplifier landscape forthem. The amplification vulnerabilities of these sevenprotocols can be abused by attackers to launch severeamplification attacks. In addition, all these seven pro-tocols run server-side, thus hosts running such protocolsare seemingly better connected and more stable in termsof IP address churn than hosts of end users.
Scanning Setup. We developed an efficient scanner toidentify amplifiers for these protocols in Internet-widescans. In order to respect good scanning practices as sug-gested by Durumeric et al. [11], we limit the number ofrequests that a particular network receives. For this rea-son, we compute the scan targets as a pseudo-randompermutation of the entire IPv4 address space (except theIP address 0.0.0.0). That is, we use a linear feedbackshift register (LFSR) to compute the order of the 232 −1IPv4 addresses to be scanned. In order to avoid to be-come blacklisted, we refrained from aggressive scanningand distributed the scans over 48 hours. In addition, weset up a reverse DNS (rDNS) record for our scanner andconfigured a web server that presents project informationand an explanation how to opt-out from our scans.
For each of the protocols, we send a request that can beused to amplify traffic. That is, we send NTP version
requests, SSDP SEARCH requests, SNMP v2 GetBulk
requests, DNS A lookups, and NetBIOS’ default namelookup. We ran the scans on a weekly basis from Nov22, 2013 to Feb 21, 2014 to observe potential changes interms of amplifiers. We chose to use the weekends forour scans so that the load of both our scanning networkand the scanned networks have less impact on businessactivities. In the case of CharGen and QOTD, we re-frained from repeating the scans, as the number of am-plifiers was too low to justify repeated full scans.
During the course of our scans, we received 90 emailsfrom administrators asking about the scanning experi-ments. Adhering to these requests, we excluded 91 IPprefixes and 30 individual IP addresses (about 3.7 mil-lion IP addresses in total) after administrators asked usto do so. To allow comparisons between two scans, weignored these IP addresses in all of our scans, i.e., evenif they were not blacklisted at the beginning.
Figure 1: Trend of UDP-based amplifiers
Table 1: Intersection of potential amplifiers based on theInternet-wide scan on Nov 22, 2013
Intersection (in %)
Protocol DNS CharGen NetBIOS NT P QOT D SNMP SSDP
DNS - 0.0 0.5 0.2 0.0 11.6 2.1CharGen 1.7 - 2.4 20.0 4.0 9.4 1.3NetBIOS 4.7 0.1 - 0.6 0.2 1.8 5.9NT P 0.9 0.3 0.2 - 0.0 3.2 0.1QOT D 14.0 11.8 18.5 8.4 - 4.2 8.5SNMP 33.5 0.1 0.6 2.7 0.0 - 0.2SSDP 9.9 0.0 3.1 0.2 0.1 0.4 -
Results. Figure 1 illustrates the number of identifiedamplifiers per protocol. By far the highest number ofamplifiers was found for open recursive DNS resolvers,slightly fluctuating between 23 and 25.5 million systems.For most of the other protocols, the number of ampli-fiers is quite constant. An exception are NTP amplifiers,whose popularity constantly decreases, a phenomenonthat we describe in detail in Section 3. None of the proto-cols (except for the two legacy protocols CharGen with107,725 and QOTD with 36,609 vulnerable hosts) hadfewer than 2.5 million amplifiers, showing a large land-scape of hosts that can be abused.
Quite interestingly, some systems run multiple vulner-able services. Table 1 shows the intersection betweenthe individual protocols relative to the overall number ofamplifiers for the protocols specified in the first table col-umn. The largest overlap is between DNS and SNMP:a third of the public SNMP hosts also run open recur-sive DNS resolvers. Note that the table is not symmet-ric, which, for example, reveals that less than 11.6% ofthe open DNS resolvers also run unprotected SNMP dae-mons. For most of the other protocols the intersection isnegligible, though. This means that the number of ampli-fiers basically sums up. We measured almost 46 millionamplifiers for all scanned UDP-based protocols.
3

114 23rd USENIX Security Symposium USENIX Association
Table 2: Results of the device fingerprinting for the amplifiers identified on Nov 22, 2013Hardware (in %) Architecture (in %) Operating System (in %)
Protocol Rou
ter
Embe
dded
Oth
ers
Unk
now
n
x86
MIP
S
Pow
erPC
Oth
ers
Unk
now
n
Uni
x
Linu
x
Ubu
ntu
Free
BSD
Win
dow
s
ZyN
OS
Cis
coIO
S
Juno
s
Net
OS
Oth
ers
Unk
now
n
DNS 9.7 5.7 0.6 84.0 0.6 7.0 0.0 0.4 92.0 3.6 3.4 0.0 0.0 0.8 7.5 0.1 0.0 0.0 1.1 83.5NetBIOS 0.7 1.3 2.0 96.0 87.6 0.1 0.0 0.0 12.3 0.4 0.1 0.0 0.0 87.3 0.3 0.0 0.0 0.0 0.7 11.2NT P 44.8 0.5 2.4 52.3 9.6 18.4 6.9 1.1 64.0 18.2 26.8 0.0 4.7 0.2 0.0 40.8 2.9 0.0 1.7 4.7SNMP 66.5 10.4 3.1 20.0 2.9 44.9 1.1 3.1 48.0 1.5 11.4 0.1 0.1 0.8 17.8 2.2 0.0 0.0 8.7 57.4SSDP 94.3 2.9 2.2 0.6 1.5 2.7 0.0 0.1 95.7 1.8 36.0 5.5 0.0 1.3 0.7 0.0 0.0 19.3 1.8 33.6
2.3 Amplifier ClassificationObserving the magnitude of the problem, we wonderedwhat kinds of systems allow for such amplification vec-tors. In an attempt to answer this question, we useprotocol-specific fingerprinting to reveal as much infor-mation as possible from these systems. That is, we gen-erate device fingerprints by inspecting the replies fromthe amplifiers during our UDP scans. We dissect the re-sponses of each host and protocol individually to clas-sify systems in three categories: the underlying hardware(e.g., routers, desktop computers, or printers), the systemarchitecture (such as x86, MIPS, or PowerPC), and theoperating system.
Fingerprinting Setup. We manually compiled 1,873regular expressions that allow a fine-granular genera-tion of fingerprints. We further leverage Nmap serviceprobes [27] to fingerprint the NetBIOS protocol. ForNetBIOS, we also focus on the structure of the payloadto obtain information about the OS. NTP version re-sponses reveal the processor type, OS, and the versionof the running NTP daemon. To generate fingerprintsfor the SNMP protocol, we analyze the object identi-fier values (OID) in the responses. For SSDP, the re-sponses contain text fragments resembling HTTP head-ers that provide system information in the Server headerfield. Additionally, SSDP headers include Unique Ser-vice Name (USN) and Search Target (ST) fields, provid-ing more general information about a device.
We improve the coverage of our UDP fingerprints byscanning the amplifiers for common TCP-based proto-cols. We use FTP, HTTP, HTTPS, SSH, and Telnet toleverage information in protocol banners and text frag-ments. We synchronize the TCP and UDP scans, henceonce a full Internet-wide UDP scan is finished, we initi-ate a follow-up TCP scan for hosts that are found to bean amplifier for at least one UDP protocol.
Results. Table 2 depicts the fingerprint results obtainedfor the amplifiers found on Nov 22, 2013. For reasons ofbrevity, we summarize fingerprint details with less than2% share to Others. Note that the category “router” also
includes gateways, switches, and modems as many ofthese devices provide similar features.
The best results for the OS classification are achievedfor NTP. We find that 40.8% of the vulnerable NTP hostsrun Cisco IOS, an OS that is deployed on Cisco de-vices such as business routers and switches. We fur-ther identify 1,267,008 amplifiers (17.4%) running Linuxon MIPS and 357,076 devices (4.9%) running Linux onPowerPC. These two combinations are common for con-sumer devices such as routers and modems. The majorityof NTP amplifiers thus run on networking equipment.
Similarly, two thirds of the SNMP amplifiers arerouters. With a share of 17.8%, the ZyNOS systemstands out—apparently running unprotected SNMP ser-vices per default. But we also observe a wide distribu-tion of other SNMP devices. This includes 58,000 of-fice printers (0.7%), 51,037 firewall appliances (0.6%),and 40,061 network cameras (0.5%). Routers are evenmore prominent among SSDP hosts with a share of about94.3%. This shows that at least three of the analyzed pro-tocols are overly prominent on routers.
On the contrary, the vast majority of NetBIOS ampli-fiers run Windows on x86, a typical setup of desktopcomputers. Since the Conficker outbreak in 2008, it isknown that millions of Windows systems on the Internetare reachable via the NetBIOS [32] protocol.
Unfortunately, DNS provides only limited fingerprintinformation and we thus had to solely rely on the TCPfingerprints to classify DNS servers. However, mostDNS servers did not run TCP services, resulting in ahigh number of uncategorized hosts. Even if TCP ser-vices were accessible, the provided information was of-ten too generic (e.g., banners as “Apache”, “SSH-2.0-OpenSSH”, or “FTP Server”). However, we could iden-tify 5.4% of the hosts (1,388,348) as MIPS-based routerswith ZyNOS, which is common for broadband routersdistributed by manufacturer ZyXEL.
A high diversity of amplifiers is attested when lookingat smaller clusters. For example, we find 695 vulnera-ble devices to be running Miele Logic, a payment sys-tem for Miele devices such as washing machines. Sim-ilarly, we identify 9,224 amplifiers running server man-
4

USENIX Association 23rd USENIX Security Symposium 115
Table 3: Amplifier churn rate per protocolInitial Scan Week 1 Week 13
Protocol ( # ) ( # ) ( % ) ( # ) ( % )
DNS 25,681,450 12,190,302 47.5 8,263,508 32.2NetBios 2,853,213 1,455,351 51.0 979,266 34.3NT P 7,269,015 6,859,043 94.4 4,222,060 58.1SNMP 8,866,748 4,939,118 55.7 3,411,563 38.5SSDP 5,336,107 3,088,148 57.9 2,067,830 38.8
agement systems (like iLO, iDRAC, or IPMI). We fur-ther find 51,351 Digital Video Recorders, 7,739 PowerDistribution Units, and 20,927 Network Attached Stor-age devices (NAS) to be vulnerable to amplification.
Ambiguous Fingerprints. We had to resolve a fewconflicts when combining the fingerprints from multi-ple protocols. For NTP amplifiers, we find valid TCPfingerprints for 1,919,932 hosts, while conflicts emergefor 9,945 IP addresses (0.5%). For SNMP, we lever-age TCP data for 2,042,541 amplifiers while obtaining31,346 conflicts (1.5%). We presume that these conflictswere caused by responses from “border” devices such asrouters that host some services themselves (e.g., SNMPand SSH), while requests for FTP or HTTP were for-warded to the devices connected to the router, resultingin multiple fingerprints for a single IP address. To resolvethese conflicts, we assign a lower priority to TCP finger-prints when classifying the amplifiers. In addition, we re-frained from aggregating the individual UDP fingerprintsto one large set, as the overlap between the UDP proto-cols is low anyway (cf. Table 1).
2.4 Amplifier Churn
An important aspect from the attacker’s point of view ishow fast the set of amplifiers changes. An up-to-date listof reliable amplifiers is key to achieving a high impactduring an attack. For this reason, we measure the churnrate of the amplifiers per protocol, which shows how fasta list of amplifiers becomes outdated. That is, we enu-merate the amplifiers based on their IP addresses on Nov22, 2013 and check if these hosts are still vulnerable foramplification attacks in the subsequent weeks.
Table 3 lists the numbers of amplifiers for the five UDPprotocols that we monitored on long term. Figure 2 illus-trates the ratio of amplifiers that are still reachable at thesame IP address over time. For most protocols (DNS,NetBIOS, SNMP, and SSDP) the churn of amplifiers isquite high: only about 50% of the initial hosts are stillreachable after one week. After the second week, weagain observe a minor decrease, resulting in a total of40 - 50% of available amplifiers for each protocol. Forthe following weeks we find the number of amplifiers toreach an almost steady level.
Figure 2: IP churn of potential amplifiers
To understand the nature of the significant drop afterthe first week and obtain knowledge about the vulnera-ble systems still reachable after 13 weeks, we leverageour fingerprinting techniques. We find the amplifiers thatbecame outdated within the first week to be mostly con-nected via consumer routers (e.g., 78.8% for SNMP). Weassume that these routers are connected via DSL withlow IP address lease times, causing the rapid breakdownrate after one week [37]. To confirm this assumption,we aggregated reverse DNS records for a random sampleof 100,000 unreachable amplifiers and checked for com-mon indicators of dial-up connections (i.e., the appear-ance of tokens such as “dialup”, “dyn”, or “pool”—wefurther manually verified the Top 5 providers not provid-ing indicators in the rDNS data). We indeed found atleast 82.8% of the IP addresses to be linked to connec-tions with dynamic IP address assignment. This meansthat an attacker needs to frequently re-scan for amplifiersor otherwise risks to decrease the impact of her attacks.
The amplifiers that are still reachable after 13 weekspresumably have longer lease times or static Internetconnectivity. For example, we can see a clear distinctionbetween countries in which SSDP hosts disappeared af-ter a week (e.g., China, Argentina, Russia) and countriesin which most hosts are still reachable after 13 weeks(e.g., Korea, United States, Canada). While only 3.4%of the Chinese amplifiers were still reachable after 13weeks, still more than 69% of the Canadian amplifierswere available. This shows that the geolocation of In-ternet links (and thus the risk to face IP address churn)highly influences the availability of amplifiers.
Interestingly, the NTP protocol draws a completelydifferent picture. Given a fixed list of vulnerable hosts,the ratio of available NTP amplifiers decreases at a neg-ligible rate. After four weeks, an attacker can still abuseapproximately 90% of the initial NTP amplifiers. After13 weeks, still 58.1% of the initially-scanned hosts are
5

116 23rd USENIX Security Symposium USENIX Association
reachable. Of the 41.9% decrease after 13 weeks, manysystems presumable disappeared because of our NTPamplifier notification campaign (cf. Section 3)—and notbecause of IP churn. The actual churn is thus even lowerand significantly differs from churn in the other proto-cols. In contrast to the vulnerable amplifiers of the otherprotocols, more than 40% of the NTP amplifiers are run-ning Cisco IOS that is commonly distributed on busi-ness routers and switches with static IP addresses. Wefurther find 53.7% of the vulnerable hosts to be locatedwithin the United States (31.3%), South Korea (13.0%),and Japan (9.4%) for which the typical IP lease times forbroadband are above average.
3 Case Study: NTP Amplification
After inspecting the amplification attacks in general, thissection focuses on NTP, which we consider by far theworst among all known vulnerable protocols. NTP is apromising amplification vector for an attacker for threereasons. First, NTP server implementations allow foramplification factors of up to 4,670 [33]. Attackers canabuse the monlist feature in popular ntpd versions,which requests a list of up to 600 NTP server clients inabout 44kB UDP payload. Second, as we have seen inSection 2.4, NTP servers have minimal IP address churn.Lastly, NTP offers even further amplification vectors.For example, the NTP version request reveals a ver-bose system fingerprint (OS, architecture, server info) ofthe NTP server, allowing about 24-fold amplification.
Attackers have already practically demonstrated theimpact of NTP attacks. For example, in February 2014,CloudFlare observed a 400 Gbps attack against a Frenchhosting provider [22]—the largest DDoS attack observedso far. If the attacker had even more resources (in partic-ular bandwidth) to send spoofed monlist requests, theimpact of such an attack could have been even higher.
Luckily, NTP servers can be configured such that themonlist requests are disabled for unauthorized users,and more recent ntpd versions protect this feature witha proper session handshake. These changes typicallydo not bring disadvantages for the administrators, whilethey eliminate the amplification vector. Even disablingfunctionality like monlist does not break time synchro-nization. But although secure configurations are well-documented, most administrators are not aware of theamplification vulnerabilities and operate NTP servers in(sometimes bad) default configurations. From a security-perspective this raises several urging questions: once wefound amplification vulnerabilities, how can we reducethe number of amplifiers? Can we notify administrators?How effective would such a notification procedure be?
3.1 NTP Amplifier NotificationsIn a large-scale campaign, we have launched a global no-tification procedure to alert NTP administrators about theamplification problems. We thankfully cooperated withmany parties striving towards the same goal: reducingthe number of NTP amplifiers.
Datasets. We define two datasets of NTP amplifiers.NT Pver contains all NTP servers that reply to version
requests, i.e., systems that are “less” vulnerable to am-plification abuse. This is the same dataset that we finger-printed in Section 2. As a subset of this, NT Pmon containsthe NTP servers that also support the monlist requests,i.e., systems that allow for more “severe” amplification.
Campaign. We collaborated with security organiza-tions in order to create technical advisories that de-scribe how to solve the amplification problems in NTP.This resulted in public advisories of CERT-CC [42] andMITRE [25]. Due to the high number of vulnerableCisco devices for NTP amplification (cf. Table 2), wealso contacted Cisco which resulted in a public advisoryof Cisco’s PSIRT [7]. The advisories describe how todisable the monlist feature in typical NTP server im-plementations (such as ntpd). The same configurationchange also disables version responses. Thus, in prin-ciple, the advisories help to reduce the number of serversin both datasets, NT Pver and NT Pmon.
In addition, we distributed lists of IP addresses of thesystems in NT Pmon among trusted institutions. For ex-ample, we shared our data with direct contacts in NOCsand CERTs of hundreds of large ISPs worldwide. Fur-thermore, we cooperated with data clearing houses (e.g.,TrustedIntroducer [41] and ShadowServer [35]) that in-formed their subscribers. Lastly, we informed the NTPPool Project [28] about misconfigured hosts in the publicpool of NTP servers and synchronized our notificationswith the OpenNTPProject [30] to start the announce-ments simultaneously.
We did not actively notify systems that are only inNT Pver for two reasons. First, we saw an urgent need toclose the amplifiers in NT Pmon, as the monlist amplifi-cation is in the order of magnitudes higher than of otherNTP features. Second, we can then compare the effi-ciency of advisories (which affect both datasets) with theeffects of active and personalized notifications (which af-fect only NT Pmon).
3.2 Analyzing the Remediation SuccessWe ran weekly scans for NTP amplifiers to observe thedevelopments over time. Figure 3 shows the number ofNTP amplifiers per week and marks important events.
6

USENIX Association 23rd USENIX Security Symposium 117
Figure 3: Trend of NT Pmon amplifiers
At their peaks on Dec 15, 2013, we tracked 7,364,792servers in NT Pver and 1,651,199 servers in NT Pmon, re-spectively. The number of amplifiers in NT Pmon is steadyat first, also after Symantec has released a blog articleabout the attacks late December 2013 [39]. However, thenumber of amplifiers starts to drop (15.4%) right afterwe released the CVE and shared a first (incomplete) listof IP addresses. A second major drop (43.4%) happenedduring the week we distributed twice an updated (andcomplete) list of potential amplifiers and two other ad-visories were released. After publishing further weeklynotifications (omitted from the graph for better readabil-ity) we have observed a steady decrease of amplifiers.
At the end of our measurements on Feb 24, 2014,the number of amplifiers reached a local minimum at4,802,212 (NT Pver) and 126,080 (NT Pmon). Comparedto the peak numbers, this constitutes significant drops inboth datasets. The number of amplifiers in NT Pver de-creased by 33.9%, a success likely stemming from theadvisories and recent publicity on NTP attacks in gen-eral. However, looking at the development of severe am-plifiers shows how successful global notification effortscan be: the number of amplifiers (NT Pmon) dropped by92.4% with an ongoing decrease.
To verify whether the number of amplifiers forNT Pmon still decreases continuously, we performed an-other Internet-wide scan on Jun 20, 2014 and find 87,463hosts still vulnerable to monlist amplification, i.e., a de-crease of almost 40,000 hosts since Feb 24, 2014.
Fingerprinting. We compared the fingerprints of theNT Pmon datasets at the start and end of our measure-ments. We clearly observe decreasing numbers for allarchitectures, OSes, and hardware types. Interestingly,the ratio of MIPS-based amplifiers dropped from 47.2%to 19.1%, while the ratio of x86-based systems increased
Table 4: Decrease of NT Pmon amplifiers per countryAmplifiers (in #) Remaining
Country Nov 22, 2013 Feb 24, 2014 Decrease (in %)
US 1,073,666 28,415 1,045,251 2.6KR 88,289 16,183 72,106 18.3RU 58,519 11,476 47,043 19.6DE 50,627 4,793 45,834 9.5CA 36,070 1,881 34,189 5.2CN 32,995 4,172 28,823 12.6JP 29,915 2,777 27,138 9.3GB 24,408 2,741 21,667 11.2UA 19,270 2,716 16,554 14.1BR 13,900 2,719 11,181 19.6TW 13,362 6,397 6,965 47.9NL 13,122 3,934 9,188 30.0FR 12,992 4,557 8,435 35.1CZ 11,825 1,226 10,599 10.4PL 10,891 1,960 8,931 18.0
from 40.2% to 58.0%. Similarly, 23.0% of the devicesof a popular router manufacturer remain vulnerable—avalue standing out from the average decrease. On ab-solute scale, though, the numbers drop across all finger-prints, indicating that the clean-up was not driven onlyby a single device type or manufacturer.
Geographic Distribution. We also investigated thegeographical distribution of the amplifiers. For this, weused the MaxMind GeoIP database [23] to assign a coun-try to the IP address of an amplifier. We then comparedhow the numbers of amplifiers evolve in single countries.Table 4 lists the remaining amplifiers of the 15 countries,which had the most amplifiers in Nov 2013. The clean-up was—on relative scale—most successful in the US,where the number of amplifiers decreased to only 2.6%.In other countries like Taiwan the number decreased onlyto 47.9%. These differences may be caused by the num-ber and quality of direct contacts we had in the US com-pared to Taiwan: we admittedly had more contacts in the
7

118 23rd USENIX Security Symposium USENIX Association
Table 5: Decrease of NT Pmon amplifiers per RIRAmplifiers (in #) Remaining
RIR Nov 22, 2014 Feb 24, 2014 Decrease (in %)
ARIN 1,112,422 30,766 1,081,656 2.8RIPE 283,991 53,324 230,667 18.8APNIC 202,719 38,122 164,597 18.8LACNIC 21,721 5,075 16,646 23.4AFRINIC 7,495 920 6,575 12.3
US and Europe compared to the rest of the world. Butit also shows that the current network of CERTs is notperfectly connected to share our information equally inall countries. For example, also European countries likeFrance (35.1%) and Austria (47.1%) lag behind the av-erage decrease. However, on an absolute scale, the situ-ation is different. While the number of NTP amplifierswas clearly reduced in the US, still 28,415 systems re-main vulnerable to monlist amplification.
Table 5 shows the absolute numbers of NTP serversper Regional Internet Registry (RIR), which (veryroughly) indicates the continent of the amplifiers. Itshows that we face a global problem, but also proves thatall regions in the world have acknowledged the problems.
Per-Provider Statistics. A closer look at the Au-tonomous Systems (AS) distribution sheds light ontohow amplifiers have been closed. Of the 96 ASes thathad at least 1,000 amplifiers, about half have shut downmore than 95% of the amplifiers. This shows that manyproviders either enforce most amplifiers in their networksto be shut down or successfully filter NTP traffic at thenetwork level. More specifically, we identified 73 ASes(0.44% of all ASes we observed during our monitor-ing period) that had more than 100 NTP servers in oneweek, and did not have a single vulnerable server leftopen in the subsequent weeks. This strongly suggeststhat these providers perform network-level filters, as it isunlikely that so many individual servers were all cleanedup within a few days. Nine ASes left open more thanhalf of the amplifiers, i.e., these providers do very littleto mitigate the threat. We are currently establishing in-dividual contacts with the least-active ASes and hope tounderstand the reasons for the remaining amplifier land-scape in their networks.
Result Verification. We verified if the drop in NTPamplifiers is not caused by networks blocking our scan-ner [10]. This can already be seen in the amplifier trendgraph (Figure 1), in which the number of amplifiers forother protocols remains almost constant. To be sure, wescanned for NTP amplifiers from a secondary host ina different /16 network. The primary scanner indeedmissed 8.6% of the amplifiers that the secondary scan-
ner found. We manually investigated this and found 904networks (/20) that have at least five amplifiers that theprimary scanner missed—indicating that some networksdo blacklist our scanner. While our primary scanner hasthus missed amplifiers, these systems make up an almost-negligible part of the 92.2% decrease of amplifiers.
3.3 Lessons LearnedSummarizing, the campaign to reduce the number ofNTP monlist amplifiers was quite effective and showedremediation successes for almost 95% of the vulnerablehosts just after 6 months. As such, it would be interestingto see recipes to repeat this success in similar campaignsfor other security-critical issues, such as amplificationvulnerabilities in other protocols or even unrelated, butsecurity-critical problems like the heartbleed vulnera-bility in OpenSSL. Figure 3 clearly shows that the coun-teractions (advisories and IP address lists) correlate withthe decrease in numbers of amplifiers.
Unfortunately, it is impossible to proof causality, inparticular, to see which IP address distribution channelsor which advisories were most effective. However, in ourconversations with providers we had the impression thatit helps to repeatedly point out the problem. Further, itmay not be sufficiently effective to have public advisoriesthat nobody reads. Instead, we found that communica-tion was key to motivate CERTs and providers to act ac-cordingly. Once we reached out to CERTs and providers,it typically was no problem to close the vulnerable hosts.
On the negative side, though, we experienced thatthe Internet community is not well-prepared for suchcampaigns. Although we were quite well-connectedwith nationally and internationally operating CERTsand providers, it is hard to reach out to all providersindividually. If providers and CERTs were bet-ter connected to non-profit data clearing houses (likeshadowserver.org), vulnerability notifications couldbe sent out more efficiently.
4 TCP-based Amplification Attacks
In the previous section, we have shown that we can havean influence on the amplifier landscape. As such, weintroduce next steps attackers may take once we “fix” allthe protocols that have been documented to be vulnerablefor amplification attacks [33]. Given the connection-lessnature of UDP, it comes as no real surprise that UDP-based protocols may allow for amplification attacks.
In this section, we analyze to what extent TCP allowsfor amplification attacks similar to the UDP-based at-tacks. TCP is a connection-oriented protocol, in whichearly on (i.e., during the handshake) the IP addresses ofboth communication parties are implicitly verified via
8
USENIX Association 23rd USENIX Security Symposium 119
Attacker Amplifier Victim
Beha
vior
1Be
havi
or 2
1. SYN2. SYN/ACK
4. SYN/ACK
3. SYN/ACK
n. SYN/ACK. . .
1. SYN2. SYN/ACK
3. RST
4. SYN/ACK
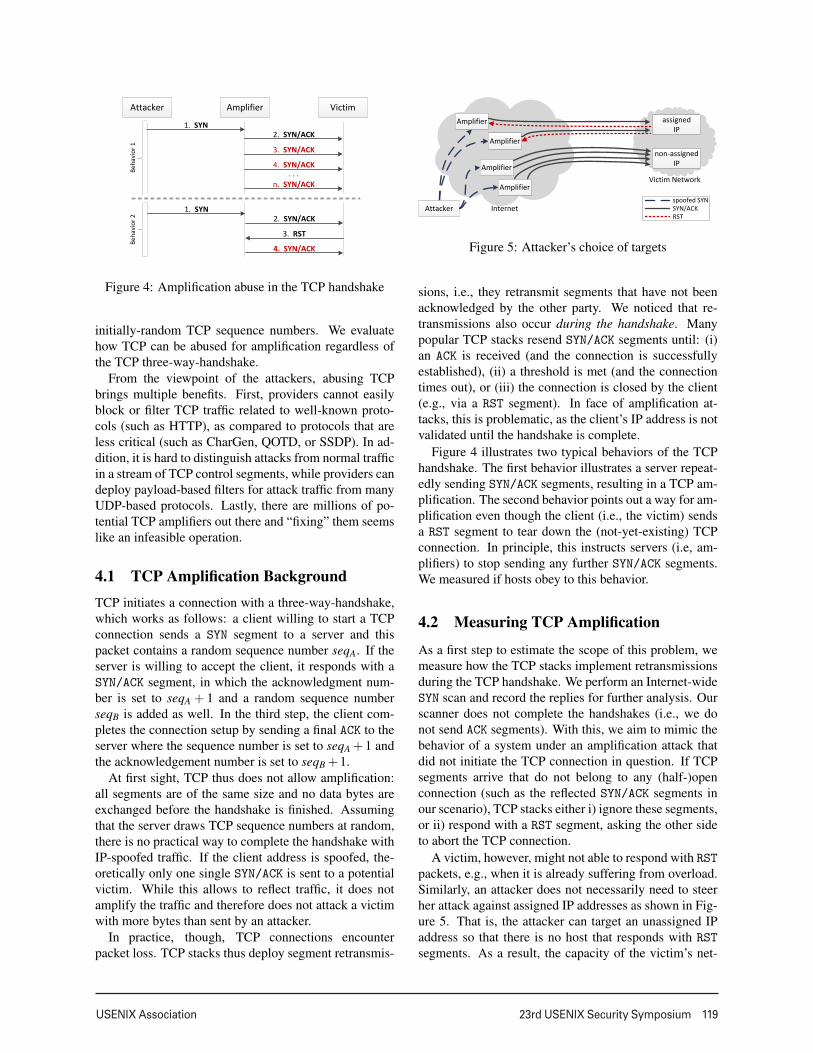
Figure 4: Amplification abuse in the TCP handshake
initially-random TCP sequence numbers. We evaluatehow TCP can be abused for amplification regardless ofthe TCP three-way-handshake.
From the viewpoint of the attackers, abusing TCPbrings multiple benefits. First, providers cannot easilyblock or filter TCP traffic related to well-known proto-cols (such as HTTP), as compared to protocols that areless critical (such as CharGen, QOTD, or SSDP). In ad-dition, it is hard to distinguish attacks from normal trafficin a stream of TCP control segments, while providers candeploy payload-based filters for attack traffic from manyUDP-based protocols. Lastly, there are millions of po-tential TCP amplifiers out there and “fixing” them seemslike an infeasible operation.
4.1 TCP Amplification BackgroundTCP initiates a connection with a three-way-handshake,which works as follows: a client willing to start a TCPconnection sends a SYN segment to a server and thispacket contains a random sequence number seqA. If theserver is willing to accept the client, it responds with aSYN/ACK segment, in which the acknowledgment num-ber is set to seqA + 1 and a random sequence numberseqB is added as well. In the third step, the client com-pletes the connection setup by sending a final ACK to theserver where the sequence number is set to seqA +1 andthe acknowledgement number is set to seqB +1.
At first sight, TCP thus does not allow amplification:all segments are of the same size and no data bytes areexchanged before the handshake is finished. Assumingthat the server draws TCP sequence numbers at random,there is no practical way to complete the handshake withIP-spoofed traffic. If the client address is spoofed, the-oretically only one single SYN/ACK is sent to a potentialvictim. While this allows to reflect traffic, it does notamplify the traffic and therefore does not attack a victimwith more bytes than sent by an attacker.
In practice, though, TCP connections encounterpacket loss. TCP stacks thus deploy segment retransmis-
Victim Network
assignedIP
non-assignedIP
Amplifier
Amplifier
Amplifier
Attacker Internet
Amplifier
spoofed SYNSYN/ACKRST
Figure 5: Attacker’s choice of targets
sions, i.e., they retransmit segments that have not beenacknowledged by the other party. We noticed that re-transmissions also occur during the handshake. Manypopular TCP stacks resend SYN/ACK segments until: (i)an ACK is received (and the connection is successfullyestablished), (ii) a threshold is met (and the connectiontimes out), or (iii) the connection is closed by the client(e.g., via a RST segment). In face of amplification at-tacks, this is problematic, as the client’s IP address is notvalidated until the handshake is complete.
Figure 4 illustrates two typical behaviors of the TCPhandshake. The first behavior illustrates a server repeat-edly sending SYN/ACK segments, resulting in a TCP am-plification. The second behavior points out a way for am-plification even though the client (i.e., the victim) sendsa RST segment to tear down the (not-yet-existing) TCPconnection. In principle, this instructs servers (i.e, am-plifiers) to stop sending any further SYN/ACK segments.We measured if hosts obey to this behavior.
4.2 Measuring TCP Amplification
As a first step to estimate the scope of this problem, wemeasure how the TCP stacks implement retransmissionsduring the TCP handshake. We perform an Internet-wideSYN scan and record the replies for further analysis. Ourscanner does not complete the handshakes (i.e., we donot send ACK segments). With this, we aim to mimic thebehavior of a system under an amplification attack thatdid not initiate the TCP connection in question. If TCPsegments arrive that do not belong to any (half-)openconnection (such as the reflected SYN/ACK segments inour scenario), TCP stacks either i) ignore these segments,or ii) respond with a RST segment, asking the other sideto abort the TCP connection.
A victim, however, might not able to respond with RSTpackets, e.g., when it is already suffering from overload.Similarly, an attacker does not necessarily need to steerher attack against assigned IP addresses as shown in Fig-ure 5. That is, the attacker can target an unassigned IPaddress so that there is no host that responds with RST
segments. As a result, the capacity of the victim’s net-
9
120 23rd USENIX Security Symposium USENIX Association
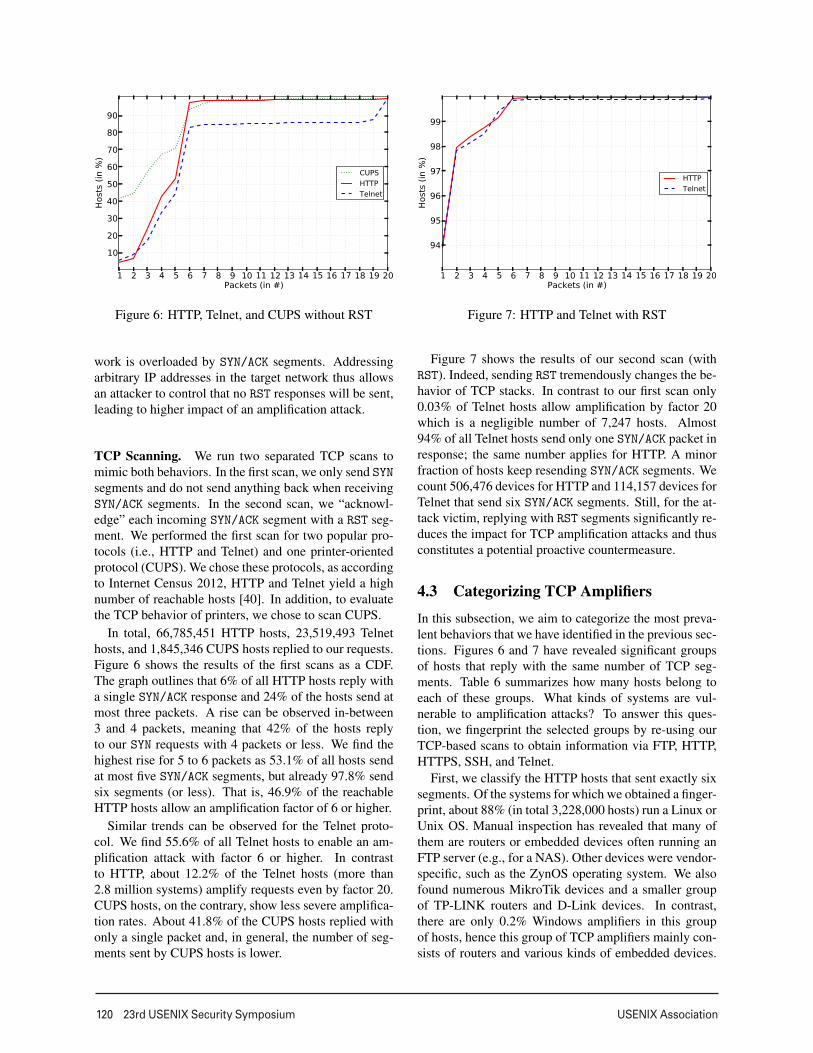
Figure 6: HTTP, Telnet, and CUPS without RST
work is overloaded by SYN/ACK segments. Addressingarbitrary IP addresses in the target network thus allowsan attacker to control that no RST responses will be sent,leading to higher impact of an amplification attack.
TCP Scanning. We run two separated TCP scans tomimic both behaviors. In the first scan, we only send SYNsegments and do not send anything back when receivingSYN/ACK segments. In the second scan, we “acknowl-edge” each incoming SYN/ACK segment with a RST seg-ment. We performed the first scan for two popular pro-tocols (i.e., HTTP and Telnet) and one printer-orientedprotocol (CUPS). We chose these protocols, as accordingto Internet Census 2012, HTTP and Telnet yield a highnumber of reachable hosts [40]. In addition, to evaluatethe TCP behavior of printers, we chose to scan CUPS.
In total, 66,785,451 HTTP hosts, 23,519,493 Telnethosts, and 1,845,346 CUPS hosts replied to our requests.Figure 6 shows the results of the first scans as a CDF.The graph outlines that 6% of all HTTP hosts reply witha single SYN/ACK response and 24% of the hosts send atmost three packets. A rise can be observed in-between3 and 4 packets, meaning that 42% of the hosts replyto our SYN requests with 4 packets or less. We find thehighest rise for 5 to 6 packets as 53.1% of all hosts sendat most five SYN/ACK segments, but already 97.8% sendsix segments (or less). That is, 46.9% of the reachableHTTP hosts allow an amplification factor of 6 or higher.
Similar trends can be observed for the Telnet proto-col. We find 55.6% of all Telnet hosts to enable an am-plification attack with factor 6 or higher. In contrastto HTTP, about 12.2% of the Telnet hosts (more than2.8 million systems) amplify requests even by factor 20.CUPS hosts, on the contrary, show less severe amplifica-tion rates. About 41.8% of the CUPS hosts replied withonly a single packet and, in general, the number of seg-ments sent by CUPS hosts is lower.
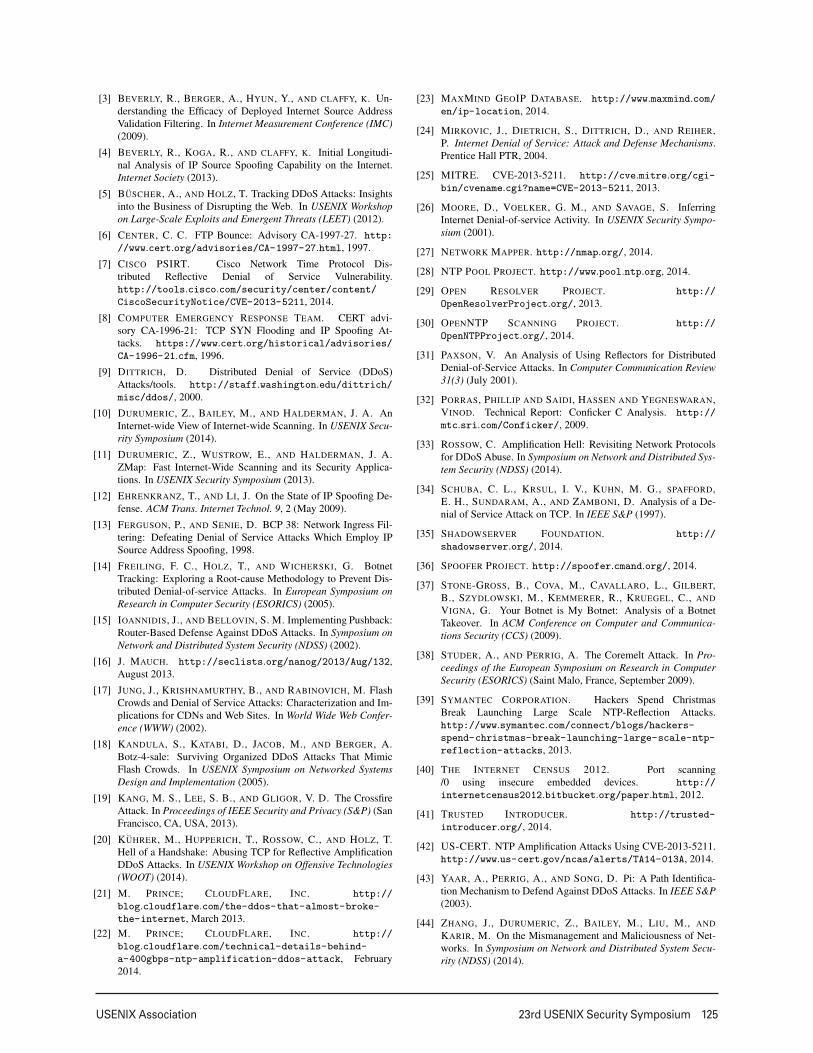
Figure 7: HTTP and Telnet with RST
Figure 7 shows the results of our second scan (withRST). Indeed, sending RST tremendously changes the be-havior of TCP stacks. In contrast to our first scan only0.03% of Telnet hosts allow amplification by factor 20which is a negligible number of 7,247 hosts. Almost94% of all Telnet hosts send only one SYN/ACK packet inresponse; the same number applies for HTTP. A minorfraction of hosts keep resending SYN/ACK segments. Wecount 506,476 devices for HTTP and 114,157 devices forTelnet that send six SYN/ACK segments. Still, for the at-tack victim, replying with RST segments significantly re-duces the impact for TCP amplification attacks and thusconstitutes a potential proactive countermeasure.
4.3 Categorizing TCP Amplifiers
In this subsection, we aim to categorize the most preva-lent behaviors that we have identified in the previous sec-tions. Figures 6 and 7 have revealed significant groupsof hosts that reply with the same number of TCP seg-ments. Table 6 summarizes how many hosts belong toeach of these groups. What kinds of systems are vul-nerable to amplification attacks? To answer this ques-tion, we fingerprint the selected groups by re-using ourTCP-based scans to obtain information via FTP, HTTP,HTTPS, SSH, and Telnet.
First, we classify the HTTP hosts that sent exactly sixsegments. Of the systems for which we obtained a finger-print, about 88% (in total 3,228,000 hosts) run a Linux orUnix OS. Manual inspection has revealed that many ofthem are routers or embedded devices often running anFTP server (e.g., for a NAS). Other devices were vendor-specific, such as the ZynOS operating system. We alsofound numerous MikroTik devices and a smaller groupof TP-LINK routers and D-Link devices. In contrast,there are only 0.2% Windows amplifiers in this groupof hosts, hence this group of TCP amplifiers mainly con-sists of routers and various kinds of embedded devices.
10

USENIX Association 23rd USENIX Security Symposium 121
Table 6: Hosts vulnerable to TCP amplificationNumber of response segments
Scan 3 4 6 20
Without RST:CUPS 12.7% 9.7% 22.9% 0.0005%
234,478 179,069 422,622 9HTTP 17.3% 18.5% 44.7% 0.6%
11,558,250 12,322,327 29,834,824 395,361Telnet 8.1% 16.1% 38.9% 12.2%
1,899,095 3,780,499 9,147,151 2,872,878
With RST:HTTP 0.44% 0.36% 0.76% 0.0005%
294,535 243,028 506,476 349Telnet 0.32% 0.37% 0.47% 0.03%
76,774 88,504 114,157 7,247
In auxiliary tests, we have measured that Windows hosts(Windows 7, Vista, and XP) send four or five SYN/ACK
segments in response—depending on the WINSOCK im-plementation. Although this amplification is not negligi-ble, it is significantly lower than for other devices.
Second, we determine what kind of Telnet hosts sentsix packets. Again, Unix and Linux are predominant asabout 115 times more hosts in this group run Unix orLinux compared to the number of devices running Win-dows. Many of these hosts (49%) are routers, while otheroccurring devices are media servers, network cameras,digital video recorders, or VoIP phones.
Third, we analyze the Telnet hosts that sent 20SYN/ACK segments. We found that 84.3% of all finger-printable hosts in this group are routers or embedded de-vices. These embedded hosts—often based on MIPS orARM architecture—include devices such as RaspberryPis and printers. We found 86.1% of the devices to utilizethe embedded web server Allegro RomPager and 37.5%to be manufactured by TP-LINK. In the remaining hosts,we also identified networking devices running ZynOS,ClearOS, or Cisco IOS. Typical desktop computers arenegligible in this group: Windows is installed on 0.3%and MacOS on 0.0005% of these systems.
Lastly, we investigate the Telnet hosts that sent morethan 20 SYN/ACK segments (21,981 hosts with an averageof 971 response segments). Most of these hosts (87.9%)were found to be business and consumer routing devicesof which 34% were running the embedded web serverGoAhead-Webs. We find 50.4% of these devices to bea specific ATM Integrated Access device manufacturedby RAD. Another 13.2% of the devices utilized the webserver Allegro RomPager that we find to be associated todevices of manufacturers such as TP-LINK and ZyXEL.More information can be found in a further paper [20].
We conclude that amplification factors of 20 and moreare largely caused by embedded devices and routers. Wehave contacted the vendors and wait for their feedbackregarding these vulnerabilities.
5 Spoofer Identification
IP address spoofing is the root cause for amplificationattacks, as it enables attackers to specify arbitrary tar-gets that are flooded with reflected traffic. The Internetcommunity addressed this issue as early as in May 2000and suggested that—whenever possible—spoofed trafficshould be blocked at the network edge [13]. However, asthe attacks in practice have shown, spoofing still seemsto be possible—yet it is unclear to what extent.
Up to now, the most powerful resource for trackingnetworks that allow spoofing is the Spoofer Project [36].The project offers a client software that one can use totest if the own network filters IP-spoofed packets. Yet,such measurements require volunteers who download,compile/install, and run a client software. Aggregatinguser measurements in a study in July 2013, Beverly etal. show that about 610 of the 2582 tested ASes allowIP spoofing (at least partially, i.e., in some of their an-nounced IP prefixes) [4]. On relative scale, however, lessthan 5% of the total number of ASes were tested. In otherwords, for more than 95% of the ASes it remains unclearif they support IP spoofing.
5.1 Remote Spoofer Test
Ideally, one would have a methodology to track networksthat allow IP spoofing without the need for individualsrunning manual or tool-based tests from within the net-work. Such remote tests would boost the measurementcoverage, so that we can alert administrators about po-tential misconfigurations that permit IP spoofing in theirnetworks. We deploy such a large-scale experiment thatenables us to identify thousands of ASes that support IPspoofing—from remote. Our DNS-based technique wasfirst mentioned by Mauch on the NANOG mailing list inAugust 2013 [16]. It relies on public DNS proxies (orDNS stub resolvers—we will refer to “proxy” in the fol-lowing) that have a broken networking implementation.
Figure 8 describes the core idea of the technique. Theparty that wants to identify spoofers (i.e., us) controlsan Internet-scale scanner S and a name server that is au-thoritative for a domain suffix dsu f . In our case the do-main dsu f is scan.syssec.rub.de. Note that we donot have control over devices on the right hand side,i.e., the DNS resolver and the optional DNS proxy, re-spectively. In step (1), the scanner S sends a DNS A
lookup for domain d to an open resolver P. The do-main d uses dsu f as domain suffix, but is specificallycrafted for each scanning target. That is, S encodesa hex-formatted IP address of the scanning target P inthe domain. This allows us to tell from the DNS re-sponse to which IP address we have sent the corre-sponding DNS request. In addition, to avoid caching
11

122 23rd USENIX Security Symposium USENIX Association
Tested AS
Public resolver’s AS
University
S: Scanner
R: Recursive DNS Resolver
Authoritative Name Server
1.2.3.4
8.8.8.8
7.7.7.7
7.7.7.8
P: DNS Resolver (2a) or DNS Proxy (2b)
2b
2a
1
A? q9ZbKc.01020304.\ scan.syssec.rub.de
Figure 8: Setup to scan for spoofing-enabled networks.R is optional if P is an iterative resolver (step 2a) and isonly used if P is a DNS proxy (step 2b)
effects, we encode a random value in d that changesper request. In our case, d for target IP address 1.2.3.4looks like q9ZbKc.01020304.scan.syssec.rub.de,whereas “q9ZbKc” is the random domain prefix and“01020304” the hex-formatted IP address.
When sending the request to P, one has to keep inmind that P may have different roles. If the scanned tar-get P is a public recursive DNS resolver, P iterativelyresolves the domain name by contacting the authorita-tive name servers down the domain tree as summarizedin step (2a). For the purposes of our experiments suchrecursive resolvers are not important because they do notforward requests or responses. As we will show later,though, our technique to identify spoofing-enabled net-works is based on the assumption that systems forwardrequests or responses. Quite often, P is not a resolverbut a DNS proxy that forwards the DNS communicationfrom a client (i.e., our scanner) to an iterative resolver R,as illustrated in step (2b).
We now leverage the fact that some DNS proxies donot correctly change the IP addresses when forwardingthe request. In principle, to forward the DNS lookup tothe resolver, the proxy P needs to change both the sourceand destination IP address of the request: it switches thesource from S to its own address and the destination fromits own address to R. Similarly, to forward the DNS re-sponse to the client, P changes the source from R to Pand the destination from P to S. However, we encoun-tered DNS proxies that do not change the addresses cor-rectly. That is, we received DNS responses for whichthe replying IP address did not match the IP address that
Public resolver’s AS
Tested AS
University
S: Scanner
1.2.3.4
8.8.8.8
7.7.7.7
DNS Request srcIP: 7.7.7.7 dstIP: 1.2.3.4
DNS Response srcIP: 8.8.8.8 dstIP: 7.7.7.7
3a
DNS Request srcIP: 1.2.3.4 dstIP: 8.8.8.8
DNS Response srcIP: 8.8.8.8 dstIP: 7.7.7.7
2b
3b
DNS Response srcIP: 8.8.8.8 dstIP: 1.2.3.4
4b
1
DNS Request srcIP: 7.7.7.7 dstIP: 8.8.8.8
2a
P: DNS Proxy
R: Recursive DNS Resolver
Figure 9: Network overview illustrating the two possiblepaths for DNS requests and responses when receiving re-sponses for which the replying IP address did not matchthe IP address that was encoded in the requested domain
was encoded in the requested domain d. Instead, when Sreceives the response, the source IP address is set to R.
There are a few potential explanations for this observa-tion. One is that P is a multi-homed system, i.e., has mul-tiple interfaces with IP addresses in different networks.In many cases, though, proxies were using well-knownresolvers (such as Google DNS) or resolvers in differentASes, excluding this possibility. Another explanation isthat these devices have broken networking implementa-tions, which cause the packets to have “wrong” IP headerinformation when being forwarded. This could, e.g., becaused by broken Network Address Translation (NAT)implementations or faulty DNS proxy software.
Figure 9 illustrates the corresponding network situ-ation when we receive a DNS response for which thesource IP address of the UDP packet does not matchthe IP address that we encoded in the domain name ofthe DNS request. When sending a DNS request to theproxy (step 1), either P does not change the source ad-dress when forwarding the request to resolver R as out-lined in step (2a) (i.e., the proxy effectively impersonatesthe sender S) so that R directly responds to S (step 3a).Alternatively, the proxy forwards the request to the re-solver R (step 2b), obtains a DNS response (step 3b), anddoes not change the source address when forwarding theresponse to the sender S (step 4b), thus impersonates theresolver R. Either way, if R and S are not within P’sAS, then the proxy P is located in a network that permitsthe transmission of spoofed IP addresses. Both behav-iors cause typical DNS clients to fail the resolution, asthe DNS response comes from an unexpected IP address.
12

USENIX Association 23rd USENIX Security Symposium 123
Table 7: Number of misconfigured DNS resolvers P andthe corresponding Autonomous SystemsFilter #P #ASP Top 3 Countries
Top 4 Resolver 42,691 301 BR (52%), IT (11%), HU (10%)Top 10 Resolver 45,072 352 BR (53%), IT (10%), HU (9%)
Distinct AS 170,451 2,692 CN (55%), BR (17%), RU (5%)Distinct AS / # respR > 1 161,988 2,063 CN (55%), BR (18%), RU (5%)Distinct AS / # respR ≥ 10 137,075 870 CN (53%), BR (20%), RU (6%)
Clients will not even receive the replies if their networkis protected by a stateful firewall, which drop UDP pack-ets unrelated to any UDP stream known to the firewall.Unfortunately, we could not examine in detail which partof the forwarding was broken, as we did not control anyof the recursive resolvers that the spoofing proxies used.
5.2 Finding Spoofing-Enabled Networks
While performing our Internet-wide scans, we observeda mismatch of source IP address and encoded target ad-dress for more than 2.2% of all responsive DNS servers,resulting in a total of 581,777 DNS proxies which redi-rect incoming requests to 225,888 distinct recursive DNSresolvers. To explore these misbehaving DNS proxiesand the corresponding ASes in more detail, we enumer-ate the number of ASes permitting IP address spoofingusing the following filtering methods:
(i) Our most conservative estimation is based onlyon responses from four commonly-used openresolvers operated by Google (i.e., 8.8.8.8 and8.8.4.4) and OpenDNS (208.67.222.222 and208.67.220.220). These servers (“Top 4”) are asubset of the servers in the second approach.
(ii) Less conservative, we take into account DNS re-sponses of the most popular ten resolvers rankedby the number of proxies using them (“Top 10”).
(iii) Lastly, we focus on proxies for which AS(S) �=AS(P) �= AS(R) applies. In other words, the proxyis not located in the same AS as both the sender Sand the resolver R, and thus is spoofing the identityof one of these identities.
Table 7 illustrates the results obtained for each filter-ing method. In total, 7.7% of the potentially-spoofingDNS proxies forward the DNS requests to the Top 10well-known resolvers (filter (ii)), resulting in 352 distinctASes the proxies are located in. When limiting our focusto the Top 4 resolvers (filter (i)), we still identify 301 dif-ferent ASes that permit spoofed traffic. Furthermore, wefind 29.3% of all proxies to be located in different ASesthan the sender S and the resolvers R (filter (iii)), result-ing in 2,692 ASes permitting the proxies to either spoofthe IP address of S or R.
Of the 225,888 individual resolvers R we find 50.7%utilized by multiple DNS proxies. To exclude potentiallymulti-homed systems with multiple interfaces in distinctASes, we restrict the set of resolvers to those which re-sponded to requests from multiple proxies and find 2,063ASes that allow spoofed traffic. When further filteringthe set to resolvers that replied to at least ten differentproxies, we still identify 870 ASes permitting spoof-ing. Using our remote test, we can thus identify morespoofing-enabled ASes than the current state-of-the-artmanual analyses performed by the Spoofer Project [36].
5.3 Fingerprinting IP-Spoofing Devices
Lastly, we want to understand what type of devices fol-low the weird practice of spoofing IP addresses whileforwarding DNS requests/responses. For this, we useour TCP-based fingerprints to classify the 42,691 de-vices that used Google DNS or OpenDNS as iterativeresolver. Of these devices, 6,120 devices replied to ourTCP requests and 5,674 resolvers provided informationsuitable for fingerprinting. In total, we find 3,033 de-vices running the Dropbear SSH daemon, particularlyemployed on embedded devices. We also identify 1,437MikroTik routers to be forwarding requests specificallyto the Google DNS servers. Further 540 devices of themanufacturer Airlive perform similar behavior.
We achieve similar results when fingerprinting thehosts of the other filtering methods (see previous sub-section). We again find Dropbear, MikroTik, and Airliveto appear frequently. We assume that these devices haveeither bad NAT rules or erroneous DNS proxy implemen-tations. However, requests for more specific informationfrom the vendors remained unanswered until now.
5.4 Remote Test Limitations
Our results show that DNS-based spoofing tests area powerful resource to identify spoofing-enabled net-works. One inherent limitation of this approach is,though, that such tests do only reveal the fact that (andnot if ) a network allows IP spoofing. We leave it up tofuture work to test if the tests can be expanded accord-ingly. For example, we could scan for DNS proxies thatcan be fingerprinted as systems that typically spoof IPaddresses. In addition, collaborating with the recursiveresolvers (such as OpenDNS or Google DNS) may re-veal further insights about the spoofing systems. Lastly,given the large number of hosts running other protocolsthan DNS, it may be possible to use further protocols forsimilar remote spoofing tests.
13

124 23rd USENIX Security Symposium USENIX Association
6 Related Work
Our work was inspired by the analysis of amplificationattacks by Rossow [33]. He identified 14 UDP-basednetwork protocols that are vulnerable to amplification at-tacks and gave a thorough overview of countermeasures.We continue this line of research and classify the ampli-fiers. We show in an Internet-wide NTP amplifier no-tification initiative that the threats can be mitigated bycooperation within the security community. We further-more investigate to what extent TCP-based amplificationattacks are possible. Lastly, we provide an overview ofspoofing-enabled networks. Our work is thus a thoroughand novel extension of Rossow’s initial analysis.
We group further related works by their topic:
TCP Amplification. To the best of our knowledge, weare the first to evaluate the amplification potential ofthe TCP three-way handshake. Prior work on TCP am-plification has addressed guessable TCP sequence num-bers, which in principle allow to establish TCP connec-tions with spoofed packets [2, 31]. In addition, Pax-son et al. looked at amplification in Transactional TCP(T/TCP)—which has very low popularity though [31].Lastly, well-known stateful TCP attacks like the FTPbounce attack also allow for amplification [6]. Many ofthese attacks have been largely fixed with secure TCPstack implementations or by hardening certain protocols(e.g., FTP). The amplification vulnerabilities that we dis-covered in the TCP three-way handshake may again re-quire improvements to TCP stacks.
Internet-Wide Scanning. Durumeric et al. presentedZMap, a publicly-available tool optimized for Internet-wide scans [11]. In fact, we leverage most of their pro-posed techniques and implemented their guidelines alsofor our custom scanner. Zhang et al. used Internet-widescans to correlate the mismanagement and the malicious-ness of networks [44]. They find networks that host openrecursive DNS resolvers highly correlate to other mali-cious activities (such as spamming) initiated from thesenetworks. Our work is orthogonal, as we follow a proac-tive approach to cooperate with the providers in order toget the vulnerabilities fixed. Two non-academic projectsdeployed by Mauch, the OpenNTPProject [30] and OpenResolver Project [29], also address the problems of am-plification sources from a practical point of view. Wehave collaborated with Mauch to inform administratorsof NTP servers vulnerable to the monlist amplificationand are grateful for his support.
DDoS Attack Types. An alternative way to launchpowerful DDoS attacks are networks of remotely-
controllable bots. Buscher and Holz analyze DirtJumper,a botnet family with the specific task to perform DDoSattacks by abusing the Internet connection of infecteddesktop computers [5]. The DirtJumper botnet attacksat the application-level layer and does not aim to exhaustbandwidth, though. Kang et al. propose the Crossfire at-tack, in which bots direct low-intensity flows to a largenumber of publicly accessible servers [19]. These flowsare concentrated on carefully chosen links such that theyflood these links and disconnect target servers from theInternet. Studer and Perrig describe the Coremelt attack,in which bots send legitimate traffic to each other to floodand disable a network link between them [38]. All theseattacks rely on bots, while our threat model only assumesthat an attacker has any spoofing-enabled Internet uplink.Although the amplification DDoS attacks primarily try tocongest bandwidth of a single victim, they can possiblybe combined with the aforementioned techniques.
7 Conclusion
We have confirmed that amplification attacks remain amajor Internet security issue—not only for UDP-basedprotocols. We identified TCP as an alternative sourcefor amplification—despite its three-way-handshake pro-tocol. We find millions of systems with TCP stacks thatcan be abused to amplify TCP traffic by a factor of 20xor higher. Our work revealed a tremendous number ofpotential amplification sources for both UDP and TCP-based protocols and classified these systems. During afirst-ever large-scale notification campaign, we have ob-served a significant decrease in the number of amplifiersfor NTP, giving hope for future attempts in fixing pro-tocols that have similarly-severe amplification vulnera-bilities. Finally, our remote spoofing test has identifiedmore than 2,000 networks that do not use proper egressfiltering—indicating that it is still a long way to go untilwe will have a spoofing-free Internet.
Acknowledgment
We would like to thank the anonymous reviewers andJared Mauch for their constructive and valuable com-ments. This work was supported by the German Fed-eral Ministry of Education and Research (BMBF Grants16BY1110 (MoBE) and 16BY1201D (iAID)).
References[1] BAILEY, M., COOKE, E., JAHANIAN, F., AND NAZARIO, J.
The Internet Motion Sensor - A Distributed Blackhole Monitor-ing System. In Symposium on Network and Distributed SystemSecurity (NDSS) (2005).
[2] BELLOVIN, S. RFC 1984: Defending Against Sequence NumberAttacks, 1996.
14
USENIX Association 23rd USENIX Security Symposium 125
[3] BEVERLY, R., BERGER, A., HYUN, Y., AND CLAFFY, K. Un-derstanding the Efficacy of Deployed Internet Source AddressValidation Filtering. In Internet Measurement Conference (IMC)(2009).
[4] BEVERLY, R., KOGA, R., AND CLAFFY, K. Initial Longitudi-nal Analysis of IP Source Spoofing Capability on the Internet.Internet Society (2013).
[5] BUSCHER, A., AND HOLZ, T. Tracking DDoS Attacks: Insightsinto the Business of Disrupting the Web. In USENIX Workshopon Large-Scale Exploits and Emergent Threats (LEET) (2012).
[6] CENTER, C. C. FTP Bounce: Advisory CA-1997-27. http:
//www.cert.org/advisories/CA-1997-27.html, 1997.
[7] CISCO PSIRT. Cisco Network Time Protocol Dis-tributed Reflective Denial of Service Vulnerability.http://tools.cisco.com/security/center/content/CiscoSecurityNotice/CVE-2013-5211, 2014.
[8] COMPUTER EMERGENCY RESPONSE TEAM. CERT advi-sory CA-1996-21: TCP SYN Flooding and IP Spoofing At-tacks. https://www.cert.org/historical/advisories/CA-1996-21.cfm, 1996.
[9] DITTRICH, D. Distributed Denial of Service (DDoS)Attacks/tools. http://staff.washington.edu/dittrich/misc/ddos/, 2000.
[10] DURUMERIC, Z., BAILEY, M., AND HALDERMAN, J. A. AnInternet-wide View of Internet-wide Scanning. In USENIX Secu-rity Symposium (2014).
[11] DURUMERIC, Z., WUSTROW, E., AND HALDERMAN, J. A.ZMap: Fast Internet-Wide Scanning and its Security Applica-tions. In USENIX Security Symposium (2013).
[12] EHRENKRANZ, T., AND LI, J. On the State of IP Spoofing De-fense. ACM Trans. Internet Technol. 9, 2 (May 2009).
[13] FERGUSON, P., AND SENIE, D. BCP 38: Network Ingress Fil-tering: Defeating Denial of Service Attacks Which Employ IPSource Address Spoofing, 1998.
[14] FREILING, F. C., HOLZ, T., AND WICHERSKI, G. BotnetTracking: Exploring a Root-cause Methodology to Prevent Dis-tributed Denial-of-service Attacks. In European Symposium onResearch in Computer Security (ESORICS) (2005).
[15] IOANNIDIS, J., AND BELLOVIN, S. M. Implementing Pushback:Router-Based Defense Against DDoS Attacks. In Symposium onNetwork and Distributed System Security (NDSS) (2002).
[16] J. MAUCH. http://seclists.org/nanog/2013/Aug/132,August 2013.
[17] JUNG, J., KRISHNAMURTHY, B., AND RABINOVICH, M. FlashCrowds and Denial of Service Attacks: Characterization and Im-plications for CDNs and Web Sites. In World Wide Web Confer-ence (WWW) (2002).
[18] KANDULA, S., KATABI, D., JACOB, M., AND BERGER, A.Botz-4-sale: Surviving Organized DDoS Attacks That MimicFlash Crowds. In USENIX Symposium on Networked SystemsDesign and Implementation (2005).
[19] KANG, M. S., LEE, S. B., AND GLIGOR, V. D. The CrossfireAttack. In Proceedings of IEEE Security and Privacy (S&P) (SanFrancisco, CA, USA, 2013).
[20] KUHRER, M., HUPPERICH, T., ROSSOW, C., AND HOLZ, T.Hell of a Handshake: Abusing TCP for Reflective AmplificationDDoS Attacks. In USENIX Workshop on Offensive Technologies(WOOT) (2014).
[21] M. PRINCE; CLOUDFLARE, INC. http://
blog.cloudflare.com/the-ddos-that-almost-broke-the-internet, March 2013.
[22] M. PRINCE; CLOUDFLARE, INC. http://
blog.cloudflare.com/technical-details-behind-a-400gbps-ntp-amplification-ddos-attack, February2014.
[23] MAXMIND GEOIP DATABASE. http://www.maxmind.com/en/ip-location, 2014.
[24] MIRKOVIC, J., DIETRICH, S., DITTRICH, D., AND REIHER,P. Internet Denial of Service: Attack and Defense Mechanisms.Prentice Hall PTR, 2004.
[25] MITRE. CVE-2013-5211. http://cve.mitre.org/cgi-bin/cvename.cgi?name=CVE-2013-5211, 2013.
[26] MOORE, D., VOELKER, G. M., AND SAVAGE, S. InferringInternet Denial-of-service Activity. In USENIX Security Sympo-sium (2001).
[27] NETWORK MAPPER. http://nmap.org/, 2014.
[28] NTP POOL PROJECT. http://www.pool.ntp.org, 2014.
[29] OPEN RESOLVER PROJECT. http://
OpenResolverProject.org/, 2013.
[30] OPENNTP SCANNING PROJECT. http://
OpenNTPProject.org/, 2014.
[31] PAXSON, V. An Analysis of Using Reflectors for DistributedDenial-of-Service Attacks. In Computer Communication Review31(3) (July 2001).
[32] PORRAS, PHILLIP AND SAIDI, HASSEN AND YEGNESWARAN,VINOD. Technical Report: Conficker C Analysis. http://
mtc.sri.com/Conficker/, 2009.
[33] ROSSOW, C. Amplification Hell: Revisiting Network Protocolsfor DDoS Abuse. In Symposium on Network and Distributed Sys-tem Security (NDSS) (2014).
[34] SCHUBA, C. L., KRSUL, I. V., KUHN, M. G., SPAFFORD,E. H., SUNDARAM, A., AND ZAMBONI, D. Analysis of a De-nial of Service Attack on TCP. In IEEE S&P (1997).
[35] SHADOWSERVER FOUNDATION. http://
shadowserver.org/, 2014.
[36] SPOOFER PROJECT. http://spoofer.cmand.org/, 2014.
[37] STONE-GROSS, B., COVA, M., CAVALLARO, L., GILBERT,B., SZYDLOWSKI, M., KEMMERER, R., KRUEGEL, C., ANDVIGNA, G. Your Botnet is My Botnet: Analysis of a BotnetTakeover. In ACM Conference on Computer and Communica-tions Security (CCS) (2009).
[38] STUDER, A., AND PERRIG, A. The Coremelt Attack. In Pro-ceedings of the European Symposium on Research in ComputerSecurity (ESORICS) (Saint Malo, France, September 2009).
[39] SYMANTEC CORPORATION. Hackers Spend ChristmasBreak Launching Large Scale NTP-Reflection Attacks.http://www.symantec.com/connect/blogs/hackers-spend-christmas-break-launching-large-scale-ntp-
reflection-attacks, 2013.
[40] THE INTERNET CENSUS 2012. Port scanning/0 using insecure embedded devices. http://
internetcensus2012.bitbucket.org/paper.html, 2012.
[41] TRUSTED INTRODUCER. http://trusted-
introducer.org/, 2014.
[42] US-CERT. NTP Amplification Attacks Using CVE-2013-5211.http://www.us-cert.gov/ncas/alerts/TA14-013A, 2014.
[43] YAAR, A., PERRIG, A., AND SONG, D. Pi: A Path Identifica-tion Mechanism to Defend Against DDoS Attacks. In IEEE S&P(2003).
[44] ZHANG, J., DURUMERIC, Z., BAILEY, M., LIU, M., ANDKARIR, M. On the Mismanagement and Maliciousness of Net-works. In Symposium on Network and Distributed System Secu-rity (NDSS) (2014).
15