Embed Size (px)
Citation preview
Expanding Horizon Transmitting Smiles

Sustainable Energy Transition through
Natural GasThe Bengal Chamber of Commerce and Industry (BCC&I)
23.08.2018
Agenda
• Natural Gas in Energy Sector
• GAIL’s presence in Gas Value Chain
• City Gas Distribution Project-An Overview
• City Gas Distribution Project in West Bengal
• Support Provided by Govt.
• Way Forward and Support Required
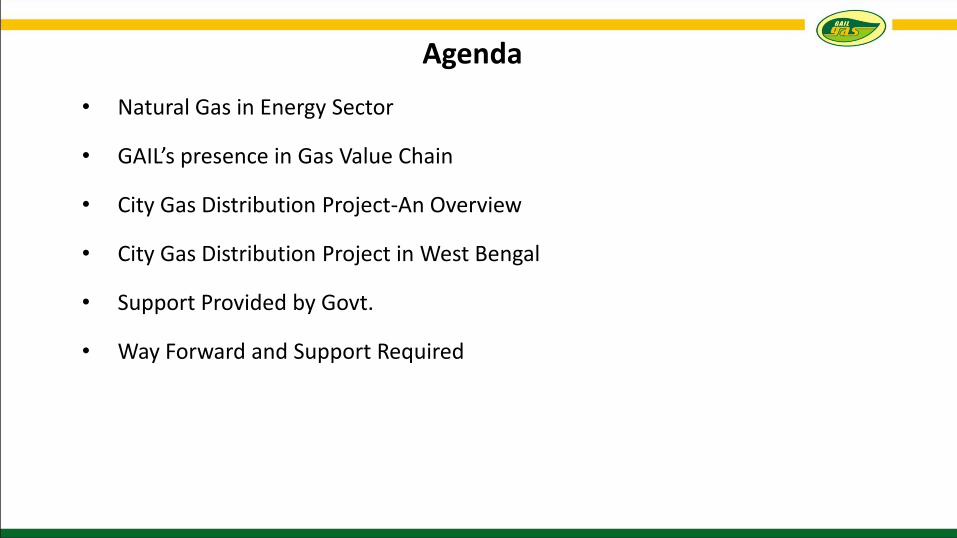
21st CENTURY - GAS
19th CENTURY - COAL
20th CENTURY - OIL
Natural Gas… Greener, Economical and Convenient Fuel
Emission
(Gms per 100 Km)CO2 UHC CO NOx SOx SPM
Petrol 22,000 85 634 78 8.3 11.1
Diesel 21,000 21 106 108 21 12.5
CNG 16,275 5.6 22.2 25.8 0.15 0.29
% Reduction
(CNG Vs. Petrol) 26% 93% 96% 67% 98% 74%
% Reduction
(CNG Vs.Diesel)23% 73% 79% 76% 99% 98%
Source : US Energy Department
Emission Table of Various fuels:
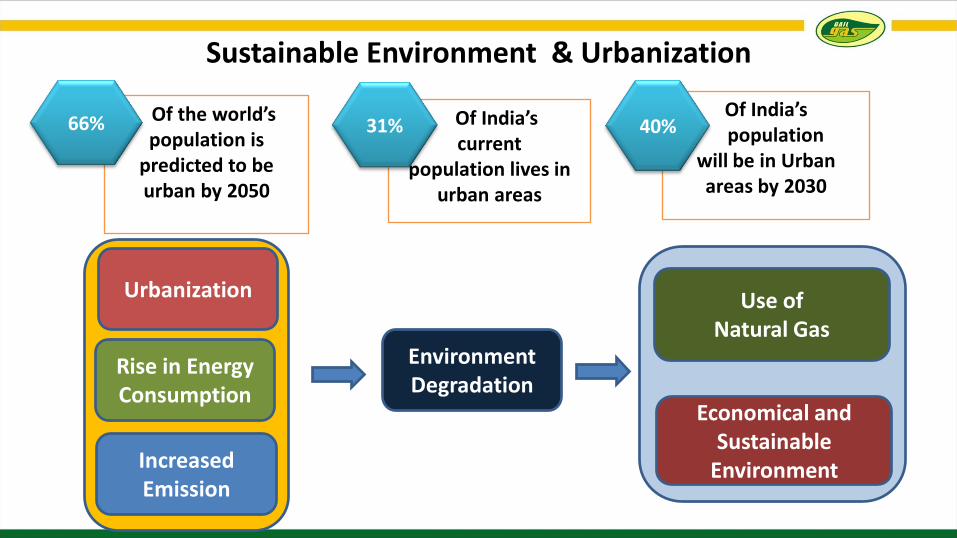
Sustainable Environment & Urbanization
Of India’s current
population lives in urban areas
31%Of India’s population
will be in Urban areas by 2030
40%Of the world’s population is
predicted to be urban by 2050
66%
Urbanization
Rise in Energy Consumption
Increased Emission
Environment Degradation
Use of Natural Gas
Economical and Sustainable
Environment

Cost Economy of CNG over Petrol / Diesel
Delhi Ahmedabad (Gujarat)
Cost per Km for Petrol /
Diesel Vehicles (Rs./Km)
Cost per Km for CNG
Vehicles (Rs./Km)% Savings by use of CNG
over Petrol/ Diesel
Particulars Delhi-NCR Gujarat
No. of Registered Vehicles
(Excluding 2 Wheelers )
~37 Lakhs ~50 Lakhs
No. of CNG run vehicles 10.32 Lakhs 9.34 Lakhs
No. of CNG Stations 438 458
02468
101214
Petrol Petrol Diesel Diesel
Auto Car/Taxi Car Bus/ Truck
61% 61% 50% 39%
0
5
10
15
Petrol Petrol Diesel Diesel
Auto Car/Taxi Car Bus/ Truck
53% 53% 44% 31%
Source : PPAC for CNG Stations & CNG vehicles; As on 01.06.2018
No. of registered vehicles as on 31.03.2015 :http://www.mospi.gov.in/

Cost Economy of PNG over LPG (Commercial Segment)
21%
38%
33%
26%
0%
5%
10%
15%
20%
25%
30%
35%
40%
0
10
20
30
40
50
60
70
80
90
Delhi Bengaluru Lucknow Agra
Price of Commercial LPG(Rs./Kg) Price of Commercial PNG (Rs./Kg) % Saving
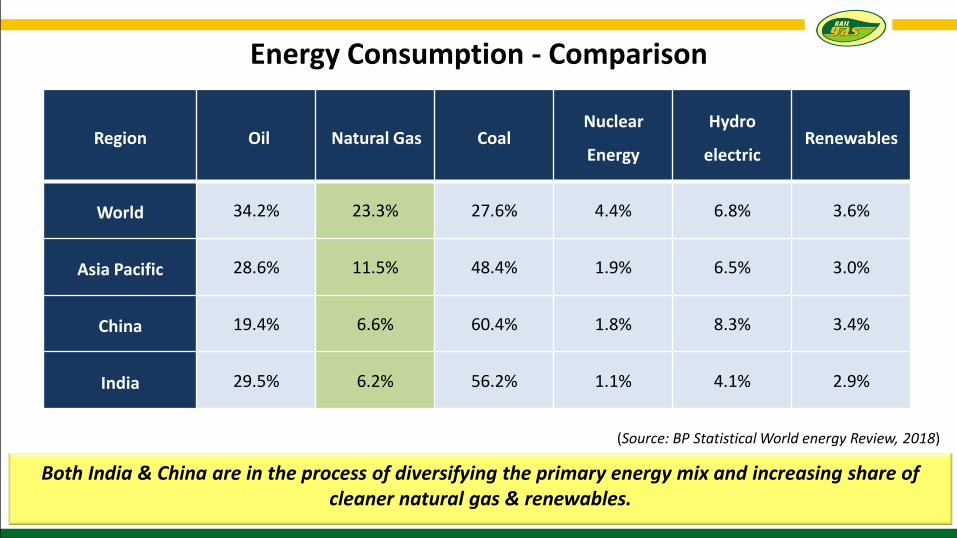
Energy Consumption - Comparison
Region Oil Natural Gas CoalNuclear
Energy
Hydro
electricRenewables
World 34.2% 23.3% 27.6% 4.4% 6.8% 3.6%
Asia Pacific 28.6% 11.5% 48.4% 1.9% 6.5% 3.0%
China 19.4% 6.6% 60.4% 1.8% 8.3% 3.4%
India 29.5% 6.2% 56.2% 1.1% 4.1% 2.9%
(Source: BP Statistical World energy Review, 2018)
Both India & China are in the process of diversifying the primary energy mix and increasing share of cleaner natural gas & renewables.
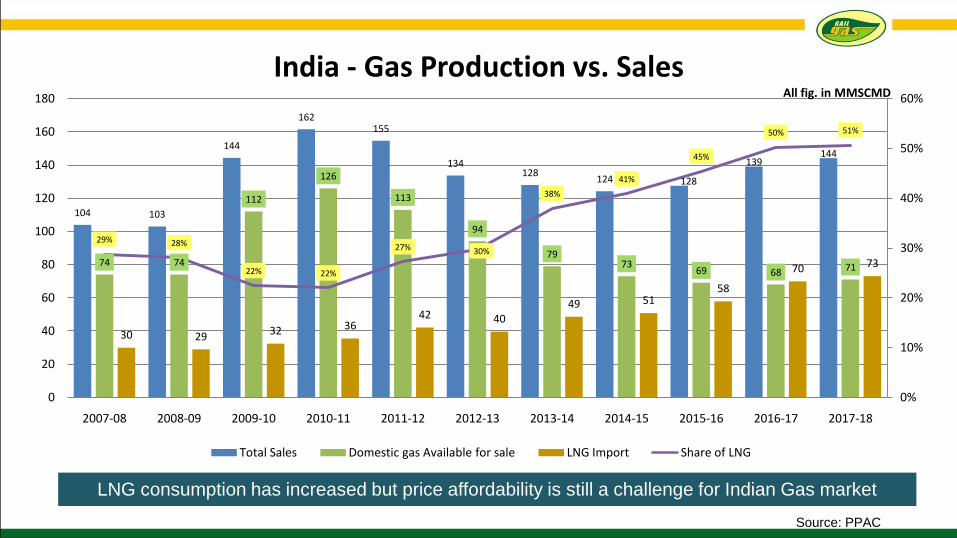
India - Gas Production vs. Sales
104 103
144
162155
134128
124 128
139144
74 74
112
126
113
94
7973
69 68 71
30 29 32 3642 40
49 5158
70 73
29% 28%
22% 22%
27% 30%
38%
41%
45%
50% 51%
0%
10%
20%
30%
40%
50%
60%
0
20
40
60
80
100
120
140
160
180
2007-08 2008-09 2009-10 2010-11 2011-12 2012-13 2013-14 2014-15 2015-16 2016-17 2017-18
Total Sales Domestic gas Available for sale LNG Import Share of LNG
Source: PPAC
LNG consumption has increased but price affordability is still a challenge for Indian Gas market
All fig. in MMSCMD

Natural Gas Consumption Pattern - India (2017-18)
Power and Fertiliser - Anchor Markets
Industrial and City Gas - Growing Markets
Gas consumption during FY (2017-18), ~144 MMSCMD
Sector-wise Break-up
* Others includes Refinery, Petrochemicals, LPG, IC and Manufacturing etc.
Gas-wise Break-up
39.76, 28%
33.49, 23%23.24, 16%
47.63, 33%
Fertilizer
Power
CGD
Others
71.06, 49%
73.06, 51%
Domestic
RLNG
Source: PPAC
Volume in MMSCMD
Fertilizer
PowerCGD
Others
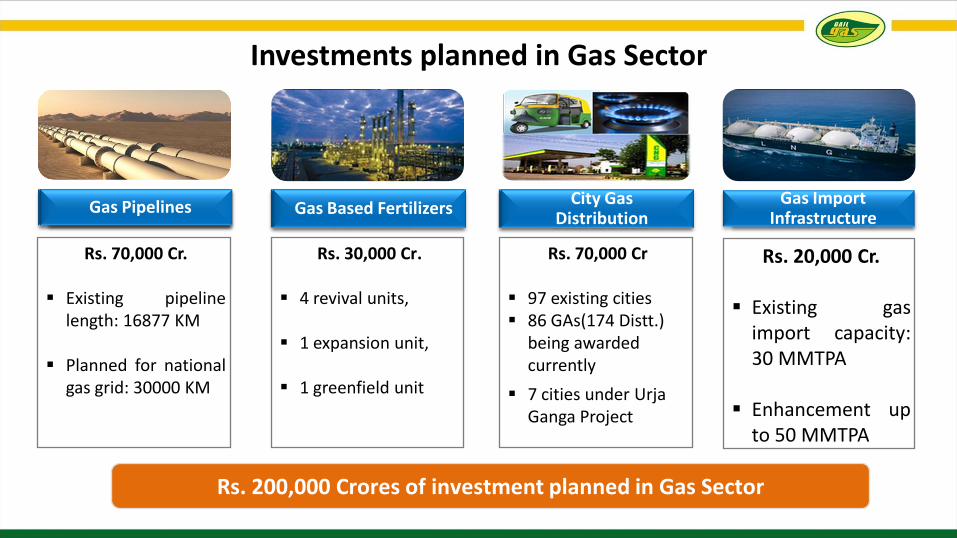
Investments planned in Gas Sector
City Gas Distribution
Gas Import Infrastructure
Rs. 20,000 Cr.
Existing gasimport capacity:30 MMTPA
Enhancement upto 50 MMTPA
Rs. 70,000 Cr
97 existing cities 86 GAs(174 Distt.)
being awarded currently
7 cities under UrjaGanga Project
Gas Based Fertilizers
Rs. 70,000 Cr.
Existing pipelinelength: 16877 KM
Planned for nationalgas grid: 30000 KM
Rs. 30,000 Cr.
4 revival units,
1 expansion unit,
1 greenfield unit
Gas Pipelines
Rs. 200,000 Crores of investment planned in Gas Sector
City Gas Distribution
Gas Based FertilizersGas Pipelines
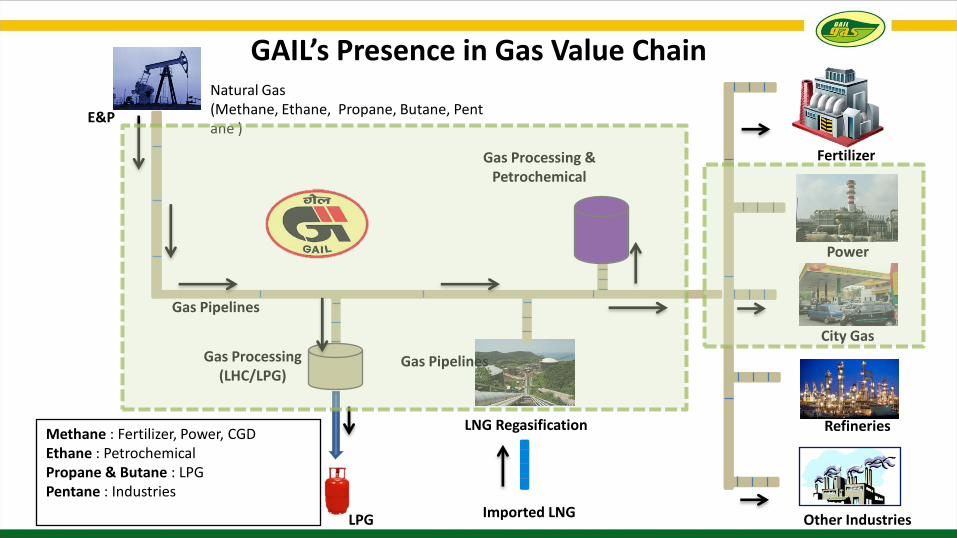
E&P
Imported LNG
LNG Regasification
Gas Pipelines
Fertilizer
Power
City Gas
Other Industries
Refineries
Gas Processing & Petrochemical
Gas Processing(LHC/LPG)
LPG
Gas Pipelines
Natural Gas (Methane, Ethane, Propane, Butane, Pentane )
Methane : Fertilizer, Power, CGDEthane : PetrochemicalPropane & Butane : LPGPentane : Industries
GAIL’s Presence in Gas Value Chain
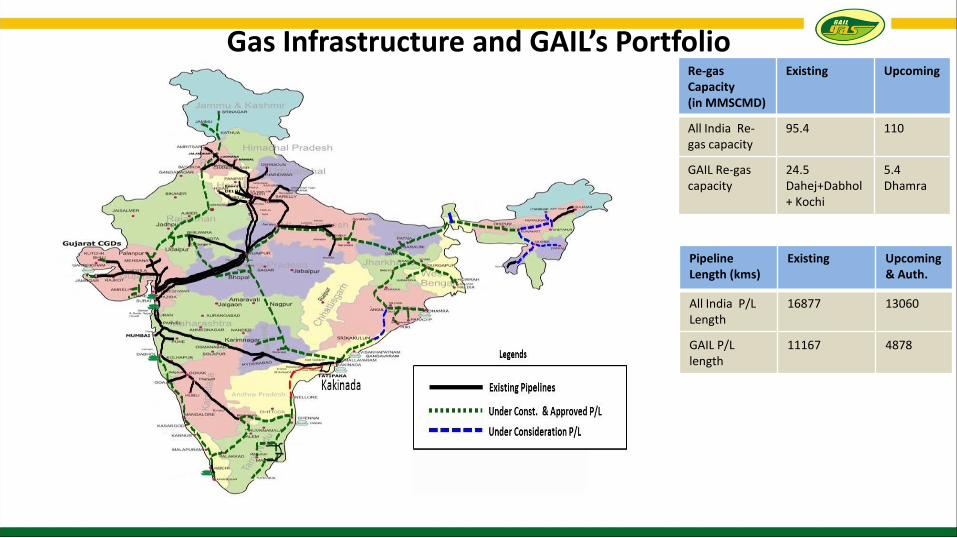
Re-gas Capacity(in MMSCMD)
Existing Upcoming
All India Re-gas capacity
95.4 110
GAIL Re-gascapacity
24.5Dahej+Dabhol+ Kochi
5.4Dhamra
Pipeline Length (kms)
Existing Upcoming & Auth.
All India P/LLength
16877 13060
GAIL P/L length
11167 4878
Gas Infrastructure and GAIL’s Portfolio
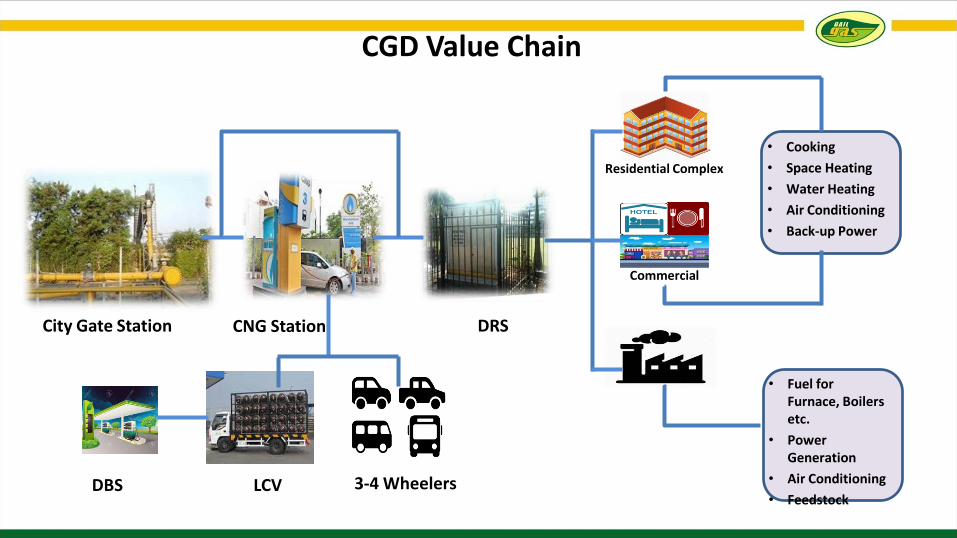
City Gate Station CNG Station DRS
CGD Value Chain
• Cooking
• Space Heating
• Water Heating
• Air Conditioning
• Back-up Power
Residential Complex
Commercial
• Fuel for Furnace, Boilers etc.
• Power Generation
• Air Conditioning
• FeedstockDBS LCV 3-4 Wheelers

CGD Sector- At a Glance• CGD entities involved : 35 in 97 GAs in 23 State(s)/ UTs.
• GAIL’s CGD Entities : 9 JVs and 1 Subsidiary in 38 GAs
• Urja Ganga : 6 CGD networks along JHBDPL by GAIL
• Present CGD Infrastructure in the Country
• Gas consumption in CGD sector for FY 2017-18 : ~24 MMSCMD [Domestic Gas ~13 MMSCMD and R-LNG ~11 MMSCMD] (16.55% of Total Gas Consumption)
Particulars PAN India Details GAIL’s CGD Entities / % of Total
PNG (Domestic) 44.43 Lakhs 25.66 Lakhs / 58%
PNG (Industrial &Commercial)
~ 34341 ~11918 / 34%
CNG Stations 1446 918 / 63%
CNG Vehicles ~ 31.71 Lakhs ~21.02 Lakhs / 66%
As on 30.06.2018
Source: PPAC

CGD Sector-PAN India TrendInvestment in CGD Sector
Financial Year 2013-14 2014-15 / Y-o-Y Change
2015-16 / Y-o-Y Change
2016-17/ Y-o-Y Change
2017-18/ Y-o-Y Change
2018-19/ Y-o-Y Change
CAGR
Amount (Rs. Cr.) 760.46 603.85 / -157 970.42 / 367 1120.73 /150 2059.81 / 939 4117 / 2057 28%
DPNG Connections
Numbers (Lakhs)
25.42 28.69 / 4 31.69 / 3 36.08 / 4 43.10 / 7(GAIL-5 Lakhs)
44.43 / 1.33 14%
CNG Stations
Numbers 966 1009 /43 1069 /60 1197 / 128 1381 /184(GAIL-120)
1446 / 65 9%
Gas Volume
Gas Volume (MMSCMD)
15 16 / 1 18 / 2 20 / 2 24 / 4 28 (E ) / 4 12%
City Gas Distribution Project
in West Bengal

Details
Thank You
Phulpur
Gorakhpur
Sindri
Jamshedpur
Dhamra
Paradip
Varanasi
Patna
Bhubaneshwar
DurgapurRanchi
Rourkela
Talcher
Kolkata
Bokaro
Barauni
Haldia
Dobhi
Sambalpur
JagdishpurThulendi
Route Map – JHBDPL (Urja Ganga Project)
Cuttack
Fertilizer CGDRefinery Others
Auraiya
PipelineStates
CoveredDistricts Covered
JHBDPL 5 50
Section-1 (755 Km)
Section-2 (875 Km)Section-3 (1025 Km)
Section-1
Section-2 & 3
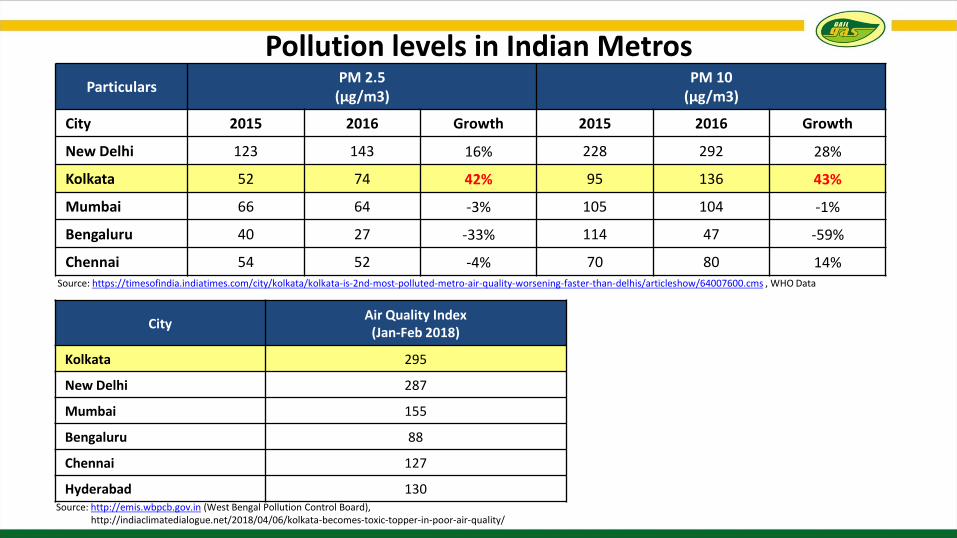
Pollution levels in Indian MetrosParticulars
PM 2.5 (µg/m3)
PM 10 (µg/m3)
City 2015 2016 Growth 2015 2016 Growth
New Delhi 123 143 16% 228 292 28%
Kolkata 52 74 42% 95 136 43%
Mumbai 66 64 -3% 105 104 -1%
Bengaluru 40 27 -33% 114 47 -59%
Chennai 54 52 -4% 70 80 14%Source: https://timesofindia.indiatimes.com/city/kolkata/kolkata-is-2nd-most-polluted-metro-air-quality-worsening-faster-than-delhis/articleshow/64007600.cms , WHO Data
CityAir Quality Index
(Jan-Feb 2018)
Kolkata 295
New Delhi 287
Mumbai 155
Bengaluru 88
Chennai 127
Hyderabad 130Source: http://emis.wbpcb.gov.in (West Bengal Pollution Control Board),
http://indiaclimatedialogue.net/2018/04/06/kolkata-becomes-toxic-topper-in-poor-air-quality/
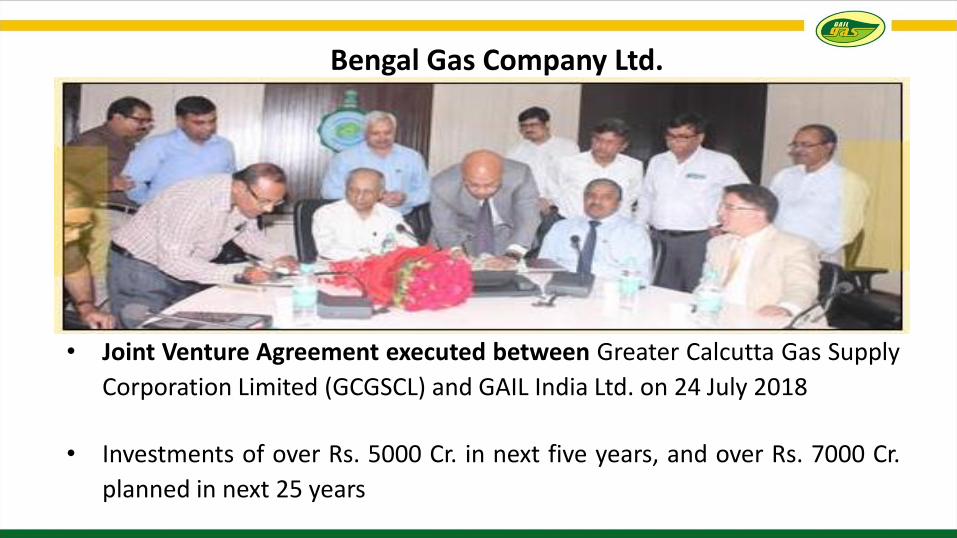
Bengal Gas Company Ltd.
• Joint Venture Agreement executed between Greater Calcutta Gas Supply
Corporation Limited (GCGSCL) and GAIL India Ltd. on 24 July 2018
• Investments of over Rs. 5000 Cr. in next five years, and over Rs. 7000 Cr.
planned in next 25 years
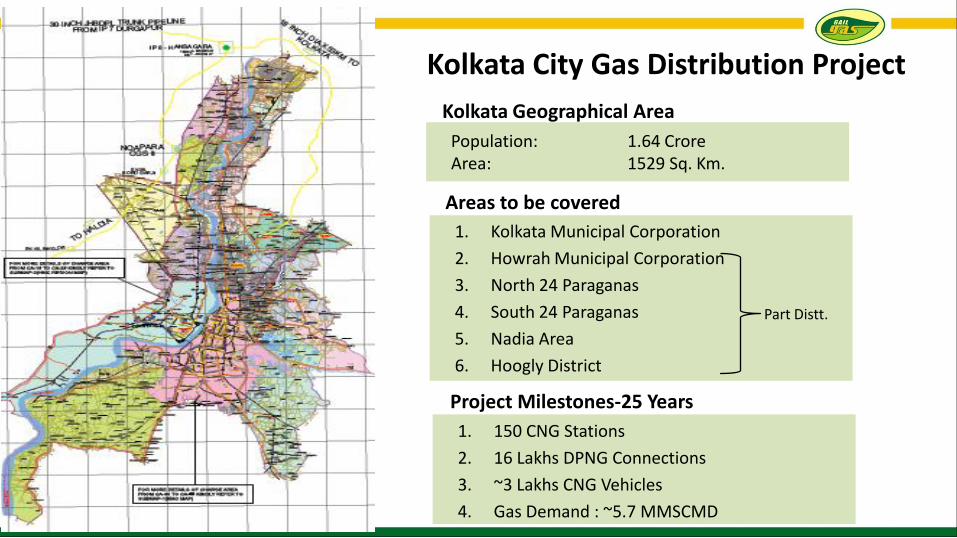
Kolkata City Gas Distribution Project
1. Kolkata Municipal Corporation
2. Howrah Municipal Corporation
3. North 24 Paraganas
4. South 24 Paraganas
5. Nadia Area
6. Hoogly District
Population: 1.64 CroreArea: 1529 Sq. Km.
Kolkata Geographical Area
Areas to be covered
1. 150 CNG Stations
2. 16 Lakhs DPNG Connections
3. ~3 Lakhs CNG Vehicles
4. Gas Demand : ~5.7 MMSCMD
Project Milestones-25 Years
Part Distt.
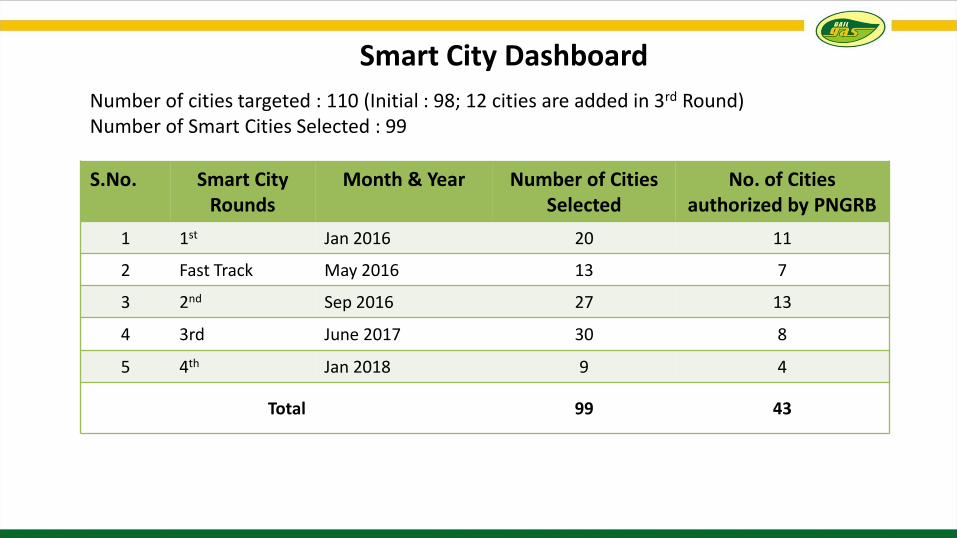
Smart City Dashboard
S.No. Smart City Rounds
Month & Year Number of Cities Selected
No. of Cities authorized by PNGRB
1 1st Jan 2016 20 11
2 Fast Track May 2016 13 7
3 2nd Sep 2016 27 13
4 3rd June 2017 30 8
5 4th Jan 2018 9 4
Total 99 43
Number of cities targeted : 110 (Initial : 98; 12 cities are added in 3rd Round)Number of Smart Cities Selected : 99

PNG – Smart Choice for Smart Cities
• Unsafe Handling in Transportation
• Increased Time to Market
• Increase in Traffic Congestion
• Occupies more space
• Human Intervention- Pilferage
• Uninterrupted supply through pipes
• Lighter than Air- Vaporizes Immediately
• Frees space in Kitchen
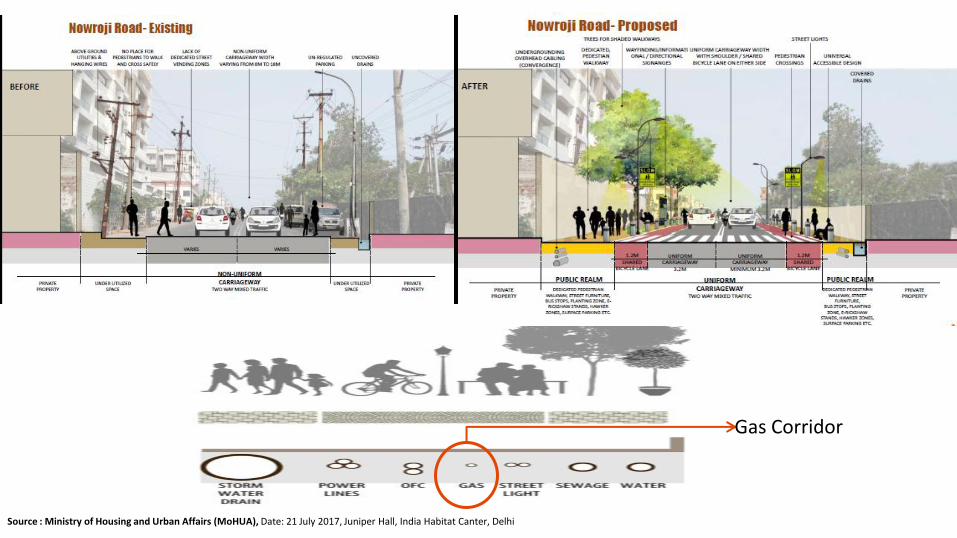
Source : Ministry of Housing and Urban Affairs (MoHUA), Date: 21 July 2017, Juniper Hall, India Habitat Canter, Delhi
Gas Corridor
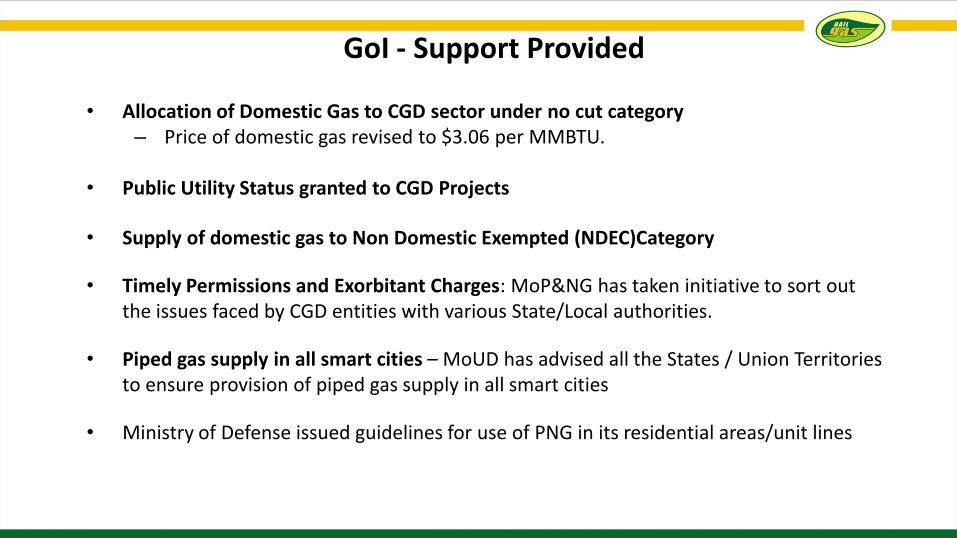
GoI - Support Provided
• Allocation of Domestic Gas to CGD sector under no cut category– Price of domestic gas revised to $3.06 per MMBTU.
• Public Utility Status granted to CGD Projects
• Supply of domestic gas to Non Domestic Exempted (NDEC)Category
• Timely Permissions and Exorbitant Charges: MoP&NG has taken initiative to sort out the issues faced by CGD entities with various State/Local authorities.
• Piped gas supply in all smart cities – MoUD has advised all the States / Union Territories to ensure provision of piped gas supply in all smart cities
• Ministry of Defense issued guidelines for use of PNG in its residential areas/unit lines

Way Forward/ Support Required- Central Govt.
• Fiscal Incentives
– Natural gas is to be brought under the ambit of GST
• Level playing field w.r.t. Commercial LPG and Furnace Oil
– Until CGD does not come under the purview of GST
• No custom duty in case RLNG is used
• Removal of Excise Duty from CNG
– Tax rate for Domestic PNG should be at par with Domestic Subsidized LPG
– “Infrastructure Status” to CGD network
• Declaring subsidized LPG free zones (14.2 Kg.) wherever there is PNG penetration.
Contd..
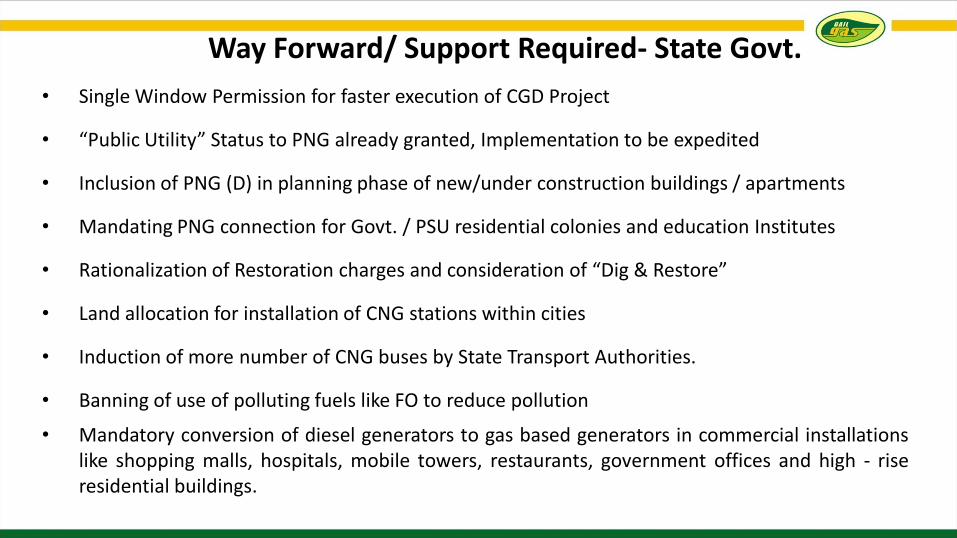
Way Forward/ Support Required- State Govt.
• Single Window Permission for faster execution of CGD Project
• “Public Utility” Status to PNG already granted, Implementation to be expedited
• Inclusion of PNG (D) in planning phase of new/under construction buildings / apartments
• Mandating PNG connection for Govt. / PSU residential colonies and education Institutes
• Rationalization of Restoration charges and consideration of “Dig & Restore”
• Land allocation for installation of CNG stations within cities
• Induction of more number of CNG buses by State Transport Authorities.
• Banning of use of polluting fuels like FO to reduce pollution
• Mandatory conversion of diesel generators to gas based generators in commercial installationslike shopping malls, hospitals, mobile towers, restaurants, government offices and high - riseresidential buildings.

Thank You
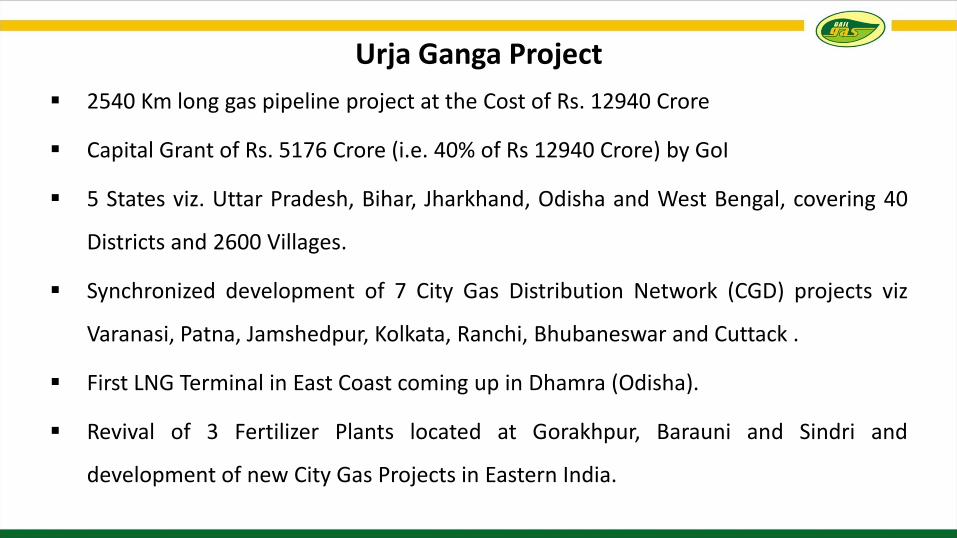
Urja Ganga Project
2540 Km long gas pipeline project at the Cost of Rs. 12940 Crore
Capital Grant of Rs. 5176 Crore (i.e. 40% of Rs 12940 Crore) by GoI
5 States viz. Uttar Pradesh, Bihar, Jharkhand, Odisha and West Bengal, covering 40
Districts and 2600 Villages.
Synchronized development of 7 City Gas Distribution Network (CGD) projects viz
Varanasi, Patna, Jamshedpur, Kolkata, Ranchi, Bhubaneswar and Cuttack .
First LNG Terminal in East Coast coming up in Dhamra (Odisha).
Revival of 3 Fertilizer Plants located at Gorakhpur, Barauni and Sindri and
development of new City Gas Projects in Eastern India.
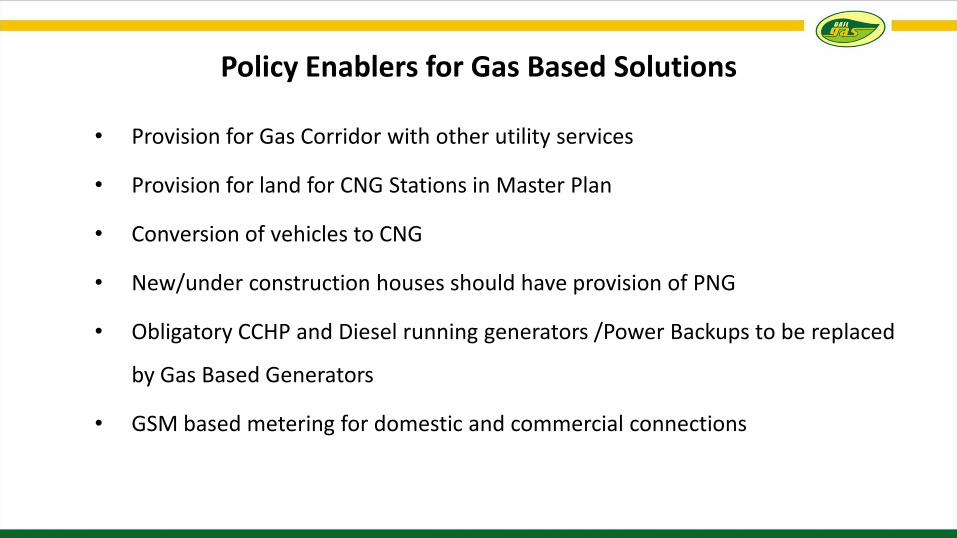
Policy Enablers for Gas Based Solutions
• Provision for Gas Corridor with other utility services
• Provision for land for CNG Stations in Master Plan
• Conversion of vehicles to CNG
• New/under construction houses should have provision of PNG
• Obligatory CCHP and Diesel running generators /Power Backups to be replaced
by Gas Based Generators
• GSM based metering for domestic and commercial connections
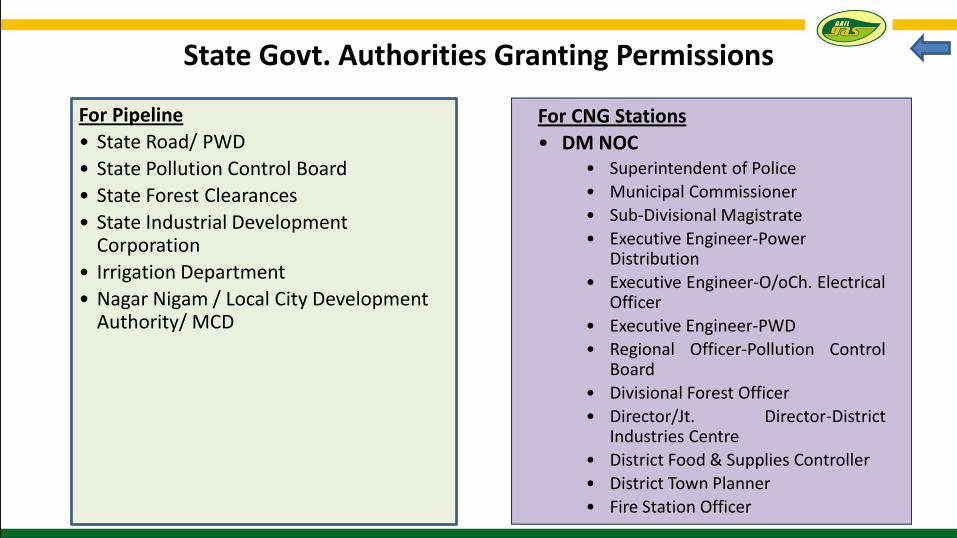
State Govt. Authorities Granting Permissions
For CNG Stations
• DM NOC• Superintendent of Police
• Municipal Commissioner
• Sub-Divisional Magistrate
• Executive Engineer-Power Distribution
• Executive Engineer-O/oCh. ElectricalOfficer
• Executive Engineer-PWD
• Regional Officer-Pollution ControlBoard
• Divisional Forest Officer
• Director/Jt. Director-DistrictIndustries Centre
• District Food & Supplies Controller
• District Town Planner
• Fire Station Officer
For Pipeline
• State Road/ PWD
• State Pollution Control Board
• State Forest Clearances
• State Industrial Development Corporation
• Irrigation Department
• Nagar Nigam / Local City Development Authority/ MCD
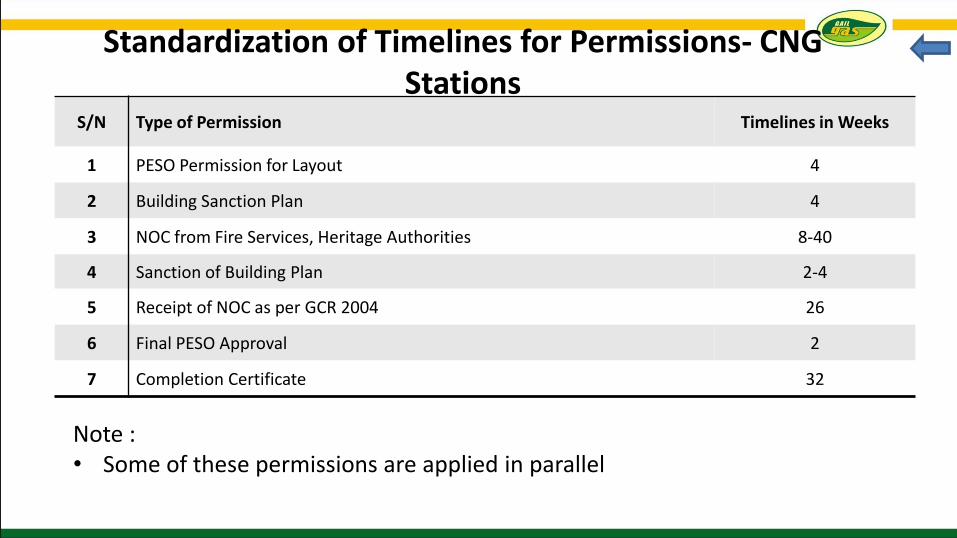
Standardization of Timelines for Permissions- CNG Stations
S/N Type of Permission Timelines in Weeks
1 PESO Permission for Layout 4
2 Building Sanction Plan 4
3 NOC from Fire Services, Heritage Authorities 8-40
4 Sanction of Building Plan 2-4
5 Receipt of NOC as per GCR 2004 26
6 Final PESO Approval 2
7 Completion Certificate 32
Note : • Some of these permissions are applied in parallel
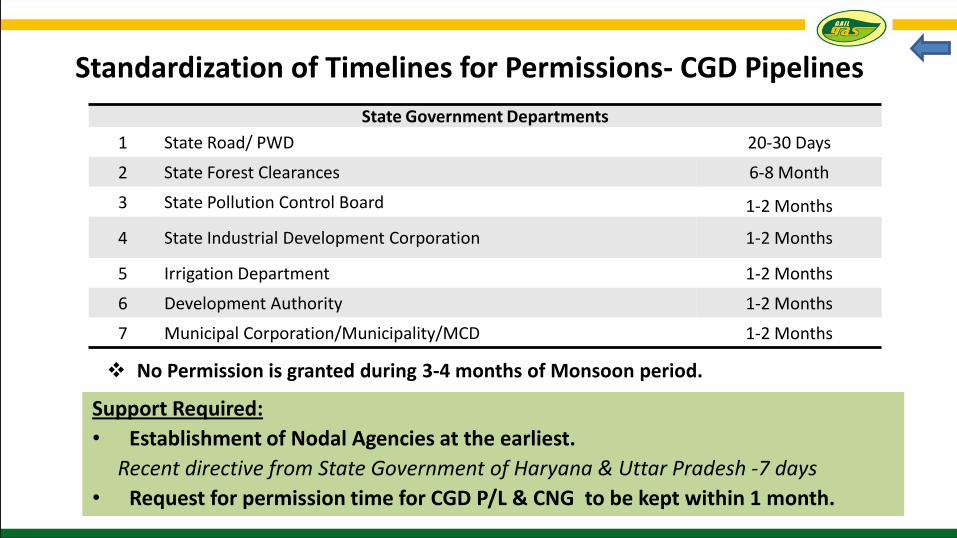
Standardization of Timelines for Permissions- CGD Pipelines
State Government Departments
1 State Road/ PWD 20-30 Days
2 State Forest Clearances 6-8 Month
3 State Pollution Control Board 1-2 Months
4 State Industrial Development Corporation 1-2 Months
5 Irrigation Department 1-2 Months
6 Development Authority 1-2 Months
7 Municipal Corporation/Municipality/MCD 1-2 Months
No Permission is granted during 3-4 months of Monsoon period.
Support Required:
• Establishment of Nodal Agencies at the earliest.
Recent directive from State Government of Haryana & Uttar Pradesh -7 days
• Request for permission time for CGD P/L & CNG to be kept within 1 month.


![InstallationandUseofPython A978-3-030-16877...312 A InstallationandUseofPython • Matplotlib4 [7,8] for plotting • IPython5 [21,22] for interactive computing • SymPy6 [2] for](https://img.pdfslide.net/doc/110x75/5f3b0618aaca8828d4142106/installationanduseofpython-a-978-3-030-16877-312-a-installationanduseofpython.jpg)