Embed Size (px)
Citation preview

Expanding the Recruiting Market:Noncognitive Testing
Jennie W. Wenger
CRM D0023223.A2/FinalSeptember 2010

This document represents the best opinion of CNA at the time of issue.It does not necessarily represent the opinion of the Department of the Navy.
Approved for Public Release; Distribution Unlimited. Specific authority: N00014-05-D-0500.Copies of this document can be obtained through the Defense Technical Information Center at www.dtic.milor contact CNA Document Control and Distribution Section at 703-824-2123.
Copyright © 2010 CNA. All Rights ReservedThis work was created in the performance of Federal Government Contract Number N00014-05-D-0500. Any copyright in this work is subject to the Government's Unlimited Rights license as defined in DFARS 252.227-7013 and/or DFARS 252.227-7014.
Approved for distribution: September 2010
Anita HattiangadiMarine Corps Manpower TeamResource Analysis Division
U.S. Sailors participate in a revised yeoman and personnel specialists advanced administration course at theCenter for Service Support learning site May 11, 2010, in San Diego. (U.S. Navy photo by MassCommunication Specialist 2nd Class Chelsea Kennedy/Released) Photographer's Name: MC2 ChelseaKennedy. Date Shot: 5/11/2010
Approved for distribution: September 2010
Anita HattiangadiMarine Corps Manpower TeamResource Analysis Division
Contents
Executive summary . . . . . . . . . . . . . . . . . . . . . . . . 1
Introduction and background. . . . . . . . . . . . . . . . . . . 3Noncognitive tests . . . . . . . . . . . . . . . . . . . . . . 4Homeschooling . . . . . . . . . . . . . . . . . . . . . . . 7The National Guard Youth ChalleNGe program . . . . . . 11The General Educational Development credential . . . . 12Implications for recruiting. . . . . . . . . . . . . . . . . . 12
Data and descriptive statistics . . . . . . . . . . . . . . . . . . . 15Description of the data. . . . . . . . . . . . . . . . . . . . 15AIM test-takers . . . . . . . . . . . . . . . . . . . . . . . . 16AIM and attrition. . . . . . . . . . . . . . . . . . . . . . . 23Regression results: AIM score and attrition . . . . . . . . . 28Implications of using AIM to determine accession
eligibility. . . . . . . . . . . . . . . . . . . . . . . . . . . 33
Conclusions . . . . . . . . . . . . . . . . . . . . . . . . . . . . 37
Appendix A: School choice in the United States . . . . . . . . . 39Magnet schools . . . . . . . . . . . . . . . . . . . . . . . . 39Charter schools . . . . . . . . . . . . . . . . . . . . . . . . 39Private schools . . . . . . . . . . . . . . . . . . . . . . . . 40Number of homeschooled students in the
United States . . . . . . . . . . . . . . . . . . . . . . . . 40
Appendix B: Descriptive statistics and regression results . . . . 43
References . . . . . . . . . . . . . . . . . . . . . . . . . . . . . 47
List of figures . . . . . . . . . . . . . . . . . . . . . . . . . . . 51
List of tables . . . . . . . . . . . . . . . . . . . . . . . . . . . . 53
i

This page intentionally left blank.
ii
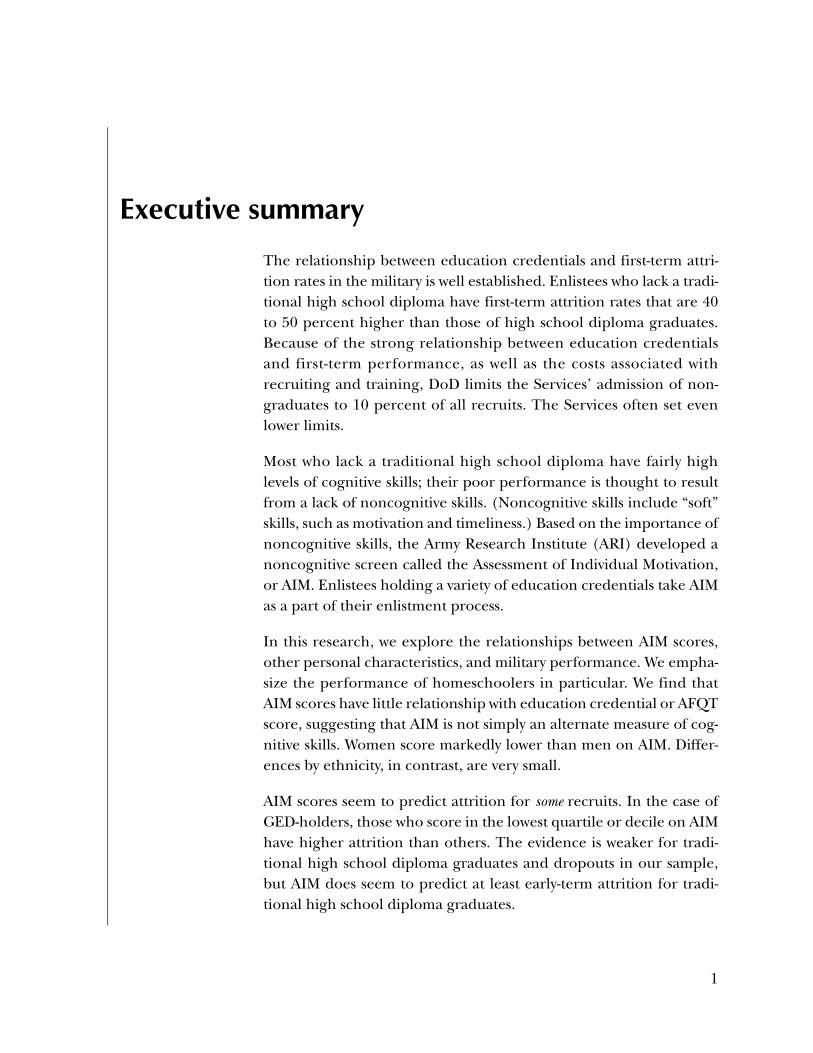
Executive summary
The relationship between education credentials and first-term attri-tion rates in the military is well established. Enlistees who lack a tradi-tional high school diploma have first-term attrition rates that are 40to 50 percent higher than those of high school diploma graduates.Because of the strong relationship between education credentialsand first-term performance, as well as the costs associated withrecruiting and training, DoD limits the Services’ admission of non-graduates to 10 percent of all recruits. The Services often set evenlower limits.
Most who lack a traditional high school diploma have fairly highlevels of cognitive skills; their poor performance is thought to resultfrom a lack of noncognitive skills. (Noncognitive skills include “soft”skills, such as motivation and timeliness.) Based on the importance ofnoncognitive skills, the Army Research Institute (ARI) developed anoncognitive screen called the Assessment of Individual Motivation,or AIM. Enlistees holding a variety of education credentials take AIMas a part of their enlistment process.
In this research, we explore the relationships between AIM scores,other personal characteristics, and military performance. We empha-size the performance of homeschoolers in particular. We find thatAIM scores have little relationship with education credential or AFQTscore, suggesting that AIM is not simply an alternate measure of cog-nitive skills. Women score markedly lower than men on AIM. Differ-ences by ethnicity, in contrast, are very small.
AIM scores seem to predict attrition for some recruits. In the case ofGED-holders, those who score in the lowest quartile or decile on AIMhave higher attrition than others. The evidence is weaker for tradi-tional high school diploma graduates and dropouts in our sample,but AIM does seem to predict at least early-term attrition for tradi-tional high school diploma graduates.
1

The case of homeschooled enlistees is more complicated. Amonghomeschoolers, those with lower AIM scores do have higher attritionbut the differences are smaller than those found among some othergroups. Also, in regression analyses, AIM has a small and statisticallyinsignificant relationship to attrition. This suggests that other factorsexplain attrition differences among homeschoolers. Past researchindicates that homeschoolers’ performance is tied more strongly toAFQT scores than is the performance of others. Our results are con-sistent with these findings, suggesting that some homeschoolers’poor performance may be due to poor cognitive skills, which could bea result of homeschoolers’ widely divergent educational experiences.
In summary, AIM offers the possibility of selecting those GED-holderswho are most likely to succeed, but there is less evidence that theinstrument will be helpful for those with other credentials.
2
Introduction and background
The relationship between education credentials and first-term attri-tion rates in the military is strong and long-standing. Nearly half ofrecruits who lack a traditional high school diploma fail to completetheir first 36 months of service; the attrition rate of these recruits is 40to 50 percent higher than the rate of high school diploma graduates.(See, for example, [1] and [2].) This attrition disrupts unit cohesion,complicates planning, and wastes recruiting and training resources.Therefore, DoD usually limits the Services to accessing no more than10 percent of their enlistees from among those whose credentials areclassified as Tier 2 or Tier 3, and the Services often set internal limitswell below the 10-percent mark.1
The exact pathway through which education credentials influencemilitary performance is not well understood. Researchers believe,however, that obtaining an education credential—in particular, a tra-ditional high school diploma—signals an ability to adapt to militarylife; some researchers refer specifically to the effect of “seat time” inexplaining why those holding other credentials do not adapt as well([3] and [4]). Alternate credentials, such as a GED certificate, usuallyrequire far less classroom instruction than a traditional high schooldiploma. Thus, many nongraduates lack cognitive skills as measuredby the Armed Services Vocational Aptitude Battery (ASVAB)/ArmedForces Qualification Test (AFQT). Consistent with this, applicantswith Tier 2 and 3 credentials are required to have higher minimumAFQT scores than applicants with Tier 1 credentials. Nonetheless,those with Tier 2 or 3 credentials attrite at much higher rates, andAFQT has relatively little explanatory power for this attrition. Based
1. The tier system divides education credentials based on expected attri-tion rates of the credential’s holders. Tier 1 includes high school diplo-mas and other credentials considered equivalent, Tier 2 includes GEDsas well as occupational/vocational certificates, and Tier 3 includes thosewith no recognized credential (“dropouts”).
3
on this observation and the notion that a high school diploma signals“adaptability,” it is likely that the poor performance of non-highschool diploma graduates results from a lack of noncognitive skills.2
Civilian researchers have begun to emphasize the role of noncogni-tive skills as well. Those who fail to complete high school often exhibitpoor noncognitive skills, especially a lack of persistence [5]. Someauthors (e.g., [5] and [6]) suggest that developing socially desirablenoncognitive skills is a primary way that schools raise earnings ofdegree-holders. In general, GED-holders possess better cognitiveskills but poorer noncognitive skills than dropouts; holding cognitiveability constant, civilian GED-holders earn less than dropouts [7].
Despite overall high attrition rates, many enlistees who lack a tradi-tional high school diploma perform very well in the military.Although obtaining a high school diploma seems to serve as an indi-cator of noncognitive skills, there are likely to be better predictors.Measuring personality aspects that are associated with good militaryperformance—in the same way that we measure cognitive skills withthe AFQT—could be very helpful for selecting those who are mostlikely to perform well.
Noncognitive tests
The Army developed the Assessment of Background and Life Experi-ence (ABLE) to measure the following aspects of personality relatedto motivation and attitude: Achievement, Adjustment, Agreeable-ness, Dependability, Leadership, and Physical Conditioning. Thesecharacteristics were originally included in ABLE because each pre-dicts job performance [8]. Indeed, testing revealed that ABLE doespredict attrition and performance, and that it does so independentlyof the ASVAB/AFQT. The particular personality aspects that ABLEmeasures are tied to motivation/effort. However, ABLE also wasfound to be fakable or coachable. In many cases, applicants could
2. Noncognitive skills include a number of traits, such as timeliness, moti-vation, and persistence.
4
determine the socially desirable answers [8]. (This problem is notunique to ABLE; it occurs with numerous noncognitive measures.)
Therefore, the Army Research Institute (ARI) set out to develop ameasure of the same constructs, with the same predictive power ofmilitary performance, but with less susceptibility to faking. TheAssessment of Individual Motivation (AIM) was the result. AIM mea-sures the same personality aspects as ABLE, but it does so with anemphasis on behavioral questions. For each item, the test-taker is pre-sented with four statements in a forced-choice format. In each case,the respondent chooses the statement that best describes his or herpersonality, as well as the statement that is least descriptive. Researchindicates that AIM is resistant to faking (although not fake-proof) andthat AIM predicts first-term attrition [9]. ARI’s research indicates thatthose with AIM scores in the top 10 percent have attrition rates thatare about half the rates of those with AIM scores in the bottom 10 per-cent. In addition, all who score above the mean on AIM have attritionrates substantively below the rates of those who score below the mean[8]. To date, AIM has not been found to have an adverse effect onwomen or minorities [8].
Although AIM was originally intended as an additional screen,recruiting conditions worsened dramatically during the period ofdevelopment (the late 1990s). Therefore, the Army has used AIM pri-marily as a market expansion tool. Beginning in 2000, the GED Plusprogram allowed some recruits who lacked a Tier 1 credential toenlist with the same incentives as high school diploma graduates, con-ditional on achieving a sufficient score on AIM. From our perspec-tive, this means that no applicant was denied entry into the militarybased solely on his or her AIM score. Rather, some applicants withTier 2 education credentials were offered opportunities normallyavailable only to those holding Tier 1 credentials.3
3. In the last few years, ARI has continued to expand its research in thearea of noncognitive skills by developing the Tier Two Attrition Screen(TTAS). TTAS uses AIM, ASVAB subtest scores, and a measure of bodymass index (BMI) to form a “whole person” measure (see [10]). TTAShas been found to predict job performance and attrition, especially forthose who lack a high school degree (see [11], [12], and [13]).
5
AIM’s primary operational focus is to allow some GED-holders oppor-tunities that are usually reserved for those with Tier 1 credentials, butAIM also may be a useful screen for those holding credentials otherthan the GED. So, along with GED-holders, several other groups tookAIM for research purposes during FY08 and FY09. In particular,homeschoolers and National Guard Youth ChalleNGe graduates tookAIM as part of the enlistment process, as did a subsample of thoseholding Tier 1 credentials.4 Thus, we have AIM scores for a samplethat includes those holding Tier 1, 2, and 3 credentials. We note thatthis research uses the AIM adaptability composite score. There areseveral AIM scores; this one correlates with adaptability to militarylife.
In this research, we explore the relationships of AIM scores, educa-tion credentials, and military performance. We investigate the possi-bility that AIM may predict military performance for those holdingvarious education credentials, and we detail groups with exception-ally low or high AIM scores. We focus on homeschoolers because pre-vious research has found that homeschoolers as a group haveattrition rates higher than those of traditional high school diplomagraduates (e.g., see [14]); however, homeschoolers who have above-average scores on the AFQT have substantially lower attrition ratesthan other homeschoolers. The lack of standardization inherent inhomeschooling provides a potential explanation for this result.AFQT scores, in general, hold little predictive power over first-termattrition for other recruits.
Next, we provide a brief overview of the history of homeschoolingand detail the level of regulation across states. We also discuss theChalleNGe program and the history of the GED credential, as well asimplications of changing education credentials for recruiting.
4. Homeschool diplomas are considered Tier 1 if holders also have above-average AFQT scores; ChalleNGe certificates are considered Tier 2. It isnot clear whether the sample of AIM test-takers holding other Tier 1credentials is random. The official instructions state that home-schoolers and those with Tier 2 credentials have priority for seating ineach AIM session, while extra seats will be filled by those with Tier 1credentials.
6
Homeschooling
Before the 1980s, homeschooling was not recognized as a legal formof education, and homeschooled students were considered to be tru-ants. During the 1980s, homeschooling advocates worked to establishthe legality of the practice. All 50 states and the District of Columbia(DC) passed laws legalizing homeschooling [15], but regulations varysubstantially from state to state. In this subsection, we present esti-mates of the total number of homeschoolers, characterize statehomeschooling laws, and place homeschooling within the broadercontext of school choice.
The number of homeschoolers must be estimated because there is nonational governing body charged with keeping such records. The taskis complicated by the fact that some states do not require home-schooling parents to notify authorities (making state-level recordsincomplete as well). Since homeschoolers make up a relatively smallgroup, few such families are included in large, national surveysdesigned to measure educational trends. Finally, there is reason tobelieve that homeschooling families attempt to limit the amount ofinformation available on homeschooled children as a way of avoidingpotential regulation (see [15] and [16]). For all of these reasons, esti-mates of the number of homeschoolers vary widely. The most credi-ble estimates imply that somewhat more than 2 percent of children,perhaps 1.5 million, are homeschooled at this time.5
Homeschooled students experience many different methods and cur-ricula; along with states’ differing approaches to regulating home-schooling, this ensures that there is no common “homeschoolingexperience.” From DoD’s perspective, therefore, knowing that apotential enlistee was homeschooled reveals very little about that per-son’s educational experiences or competencies. In this sense, a home-schooled diploma is the least standard of the common educationcredentials. This suggests that a noncognitive test has the potential toprovide valuable information about homeschoolers in particular.
5. See appendix A for more details on this estimate and a description ofschool choice in the United States.
7
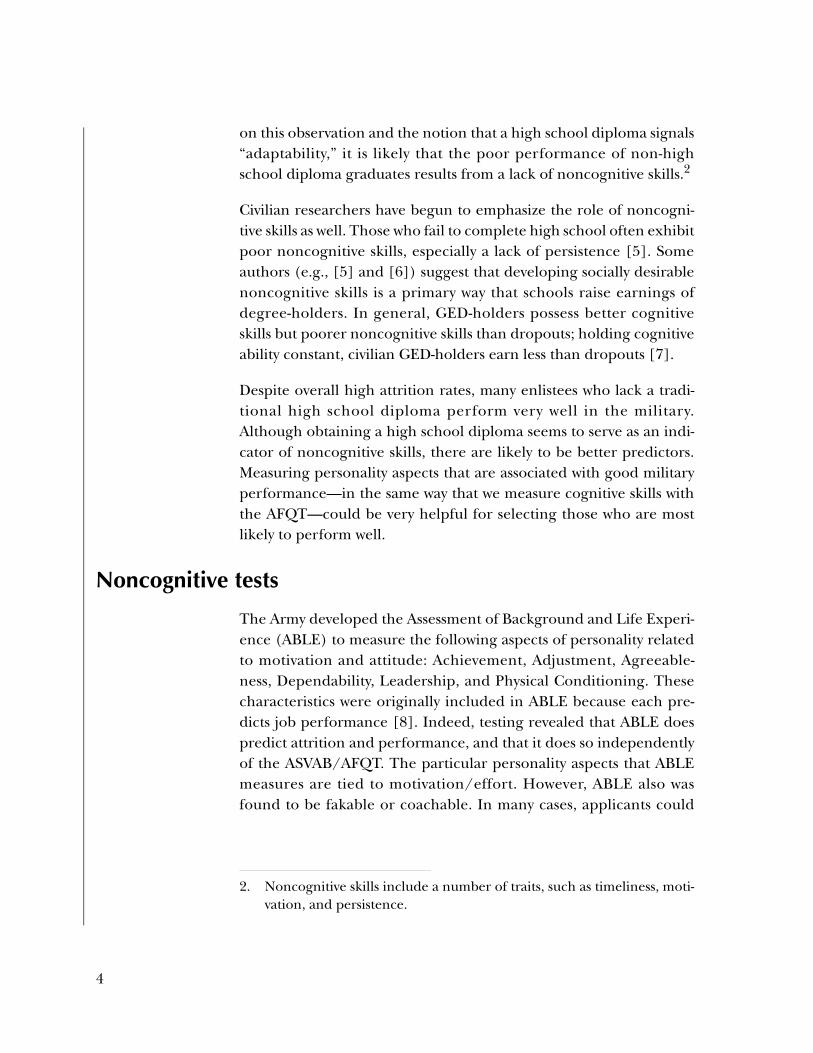
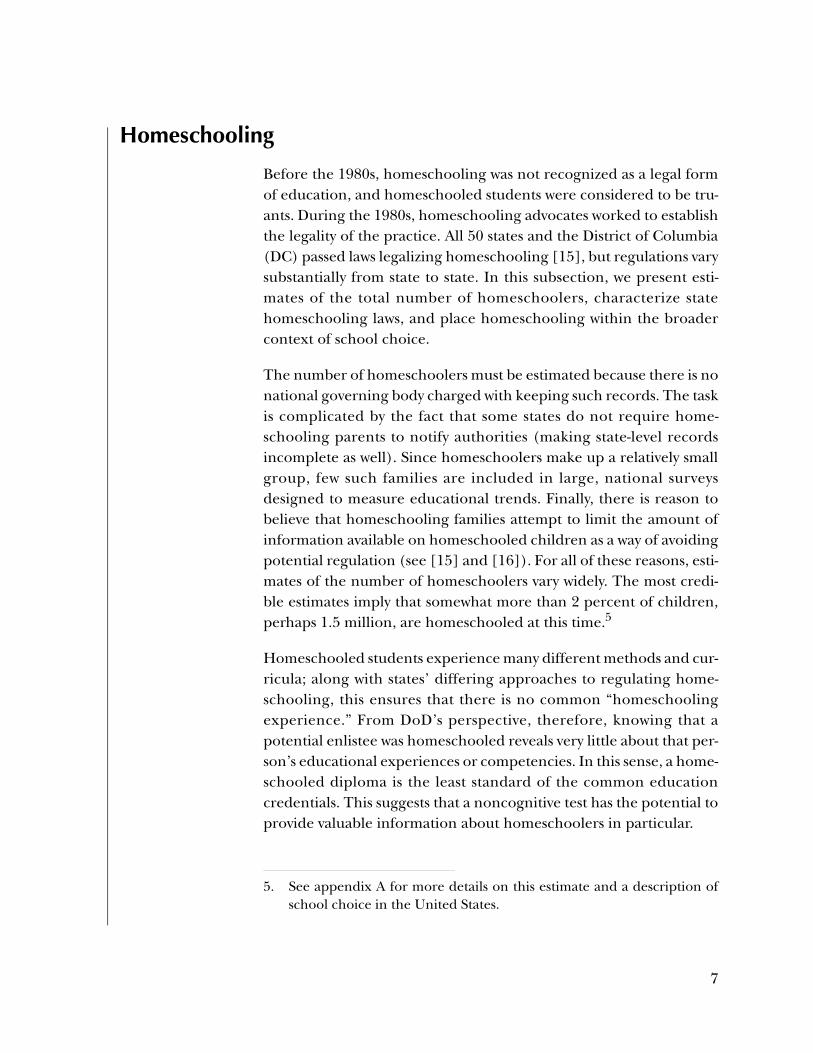
In some states, homeschoolers face virtually no regulations. In fact, in10 states, homeschooling families face no requirements whatsoeveron curriculum and are not even obligated to inform local or stateeducational agencies that they have chosen to homeschool.6 Another15 states require only that parents notify education officials of theirintent to homeschool. We consider these 25 states to have low levelsof regulation. Nineteen states and DC require that parents notify offi-cials and also present either test scores or some other evaluation ofstudent progress; these states have moderate levels of regulation.Finally, six states require notification, test scores and/or evaluation,and have other requirements, such as curriculum specifics and homevisits. We consider these states to have high levels of regulation.Figure 1 characterizes each state’s level of regulation.
6. We characterize state regulations based on information from the HomeSchooling Legal Defense Association (HSLDA). See www.hslda.org. Wealso use HSLDA’s distinctions between “low,” “moderate,” and “high”levels of homeschooling regulation.
Figure 1. Levels of homeschooling regulation vary across statesa
a. Source: Home School Legal Defense Association; www.hslda.org.
8
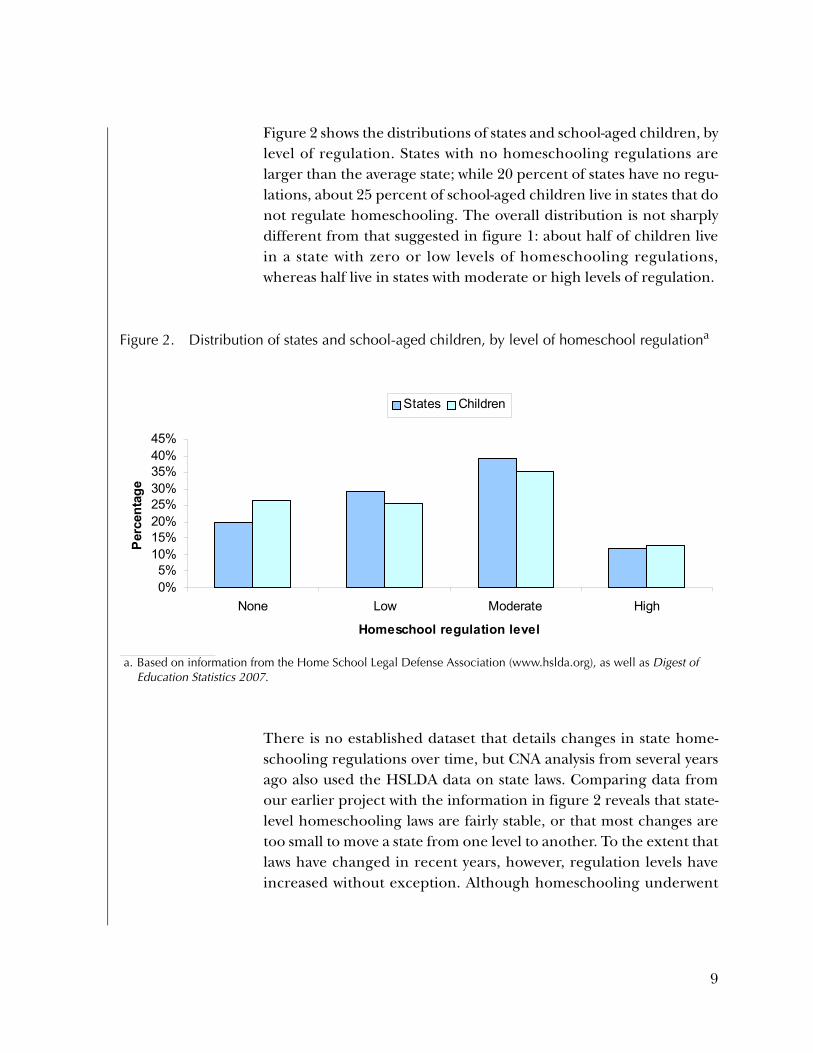
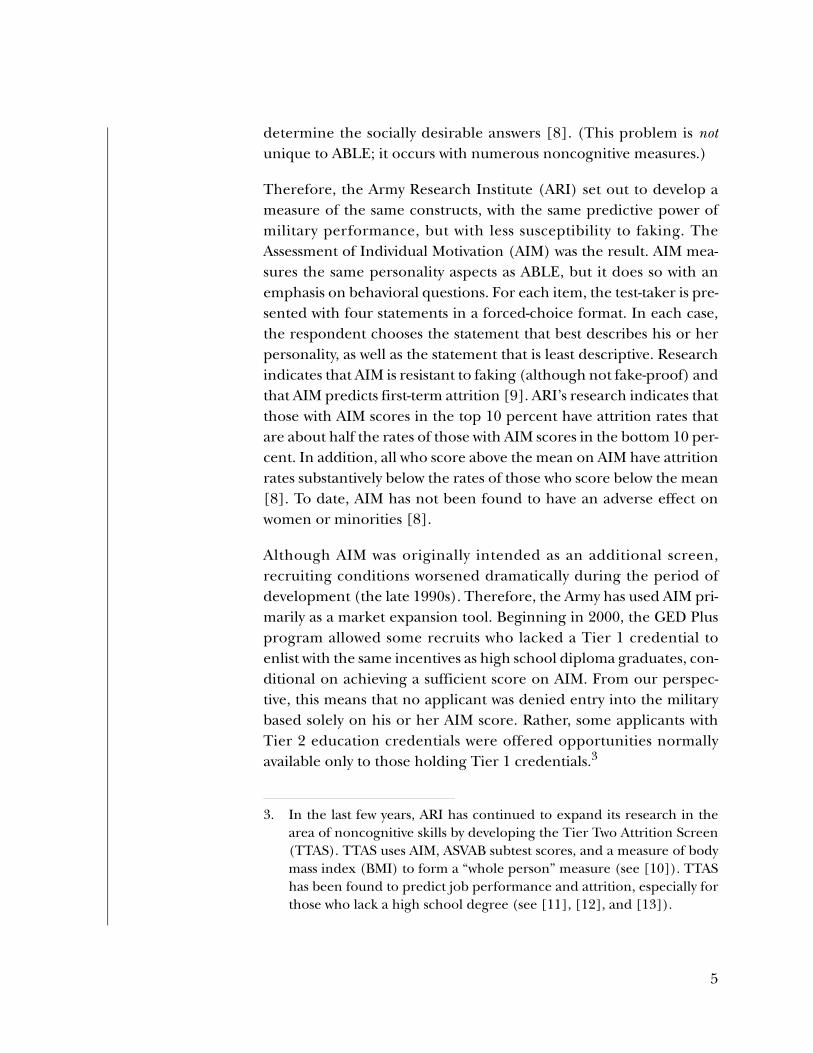
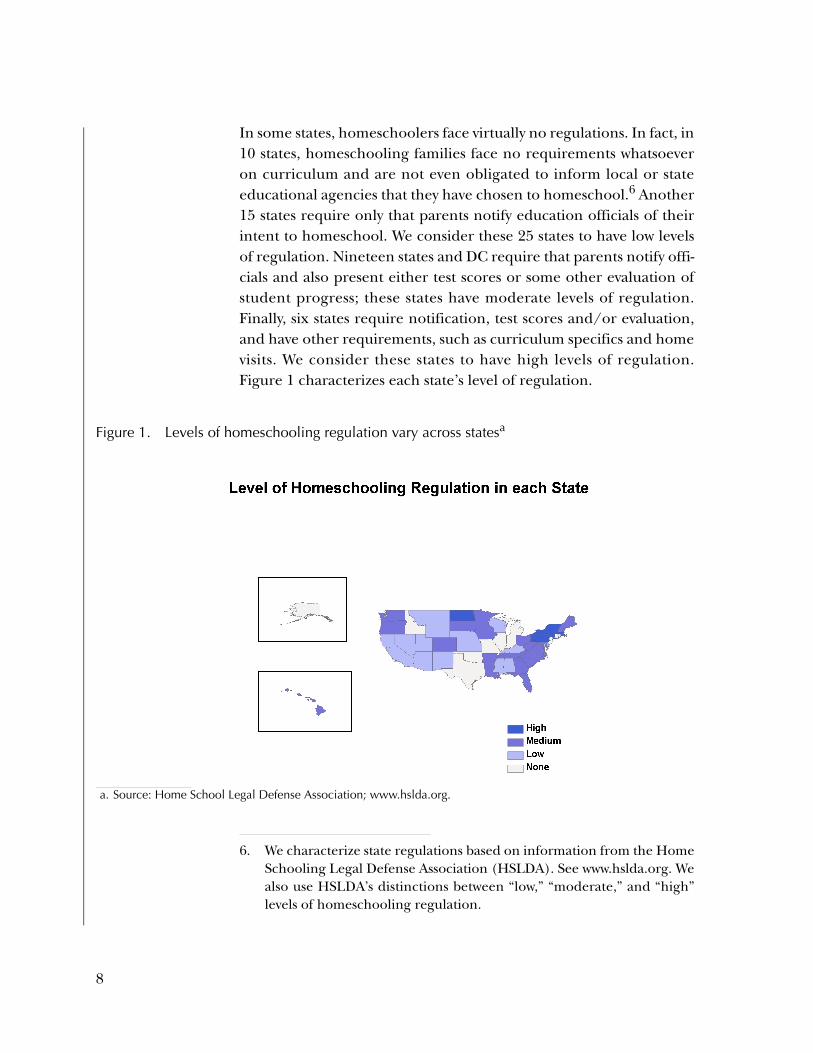
Figure 2 shows the distributions of states and school-aged children, bylevel of regulation. States with no homeschooling regulations arelarger than the average state; while 20 percent of states have no regu-lations, about 25 percent of school-aged children live in states that donot regulate homeschooling. The overall distribution is not sharplydifferent from that suggested in figure 1: about half of children livein a state with zero or low levels of homeschooling regulations,whereas half live in states with moderate or high levels of regulation.
There is no established dataset that details changes in state home-schooling regulations over time, but CNA analysis from several yearsago also used the HSLDA data on state laws. Comparing data fromour earlier project with the information in figure 2 reveals that state-level homeschooling laws are fairly stable, or that most changes aretoo small to move a state from one level to another. To the extent thatlaws have changed in recent years, however, regulation levels haveincreased without exception. Although homeschooling underwent
Figure 2. Distribution of states and school-aged children, by level of homeschool regulationa
a. Based on information from the Home School Legal Defense Association (www.hslda.org), as well as Digest of Education Statistics 2007.
0%5%
10%15%20%25%30%35%40%45%
None Low Moderate High
Homeschool regulation level
Per
cent
age
States Children
9
rapid deregulation during past decades, the current trends aretoward stable or incremental increases in the level of regulation.
Homeschooling is one of several educational movements designed toincrease family choice in schools and the types of education available.The period since the legalization of homeschooling also has beencharacterized by substantial increases in the numbers of studentsattending magnet and charter schools, as well as several large-scaleexperiments with private school vouchers. (See appendix A.) Each ofthese programs has the potential to allow children to attend a schooldifferent from their “neighborhood” or assigned school.
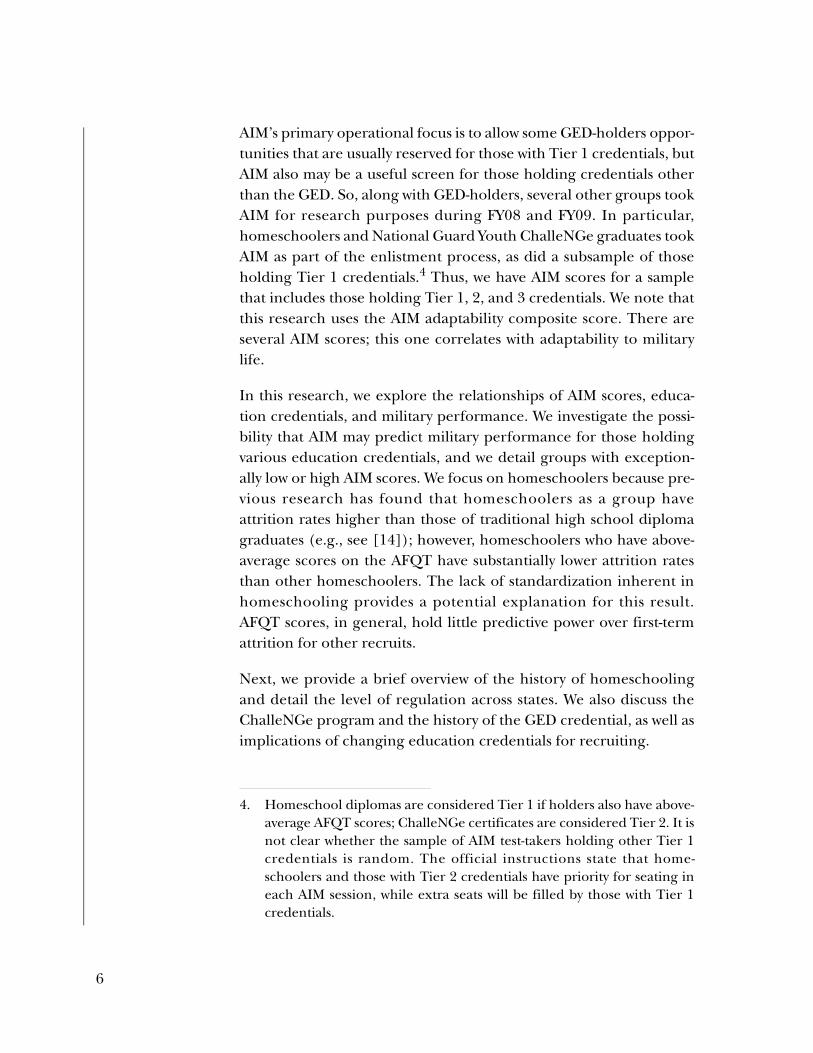
Figure 3 summarizes the number of students in each type of schooland indicates that the vast majority of students still attend traditionalpublic schools. About 20 percent of students do not attend a tradi-tional public school. Of these, the majority attend private schools,which enroll more students than all other forms of school choicecombined and three to four times as many students as homeschools.The estimated homeschool population is slightly larger than the char-ter school population but smaller than the magnet school populationand substantially smaller than the private school population.
Figure 3. Distribution of U.S. K–12 students, by type of schoola
a. Figures are the most recent available: traditional and private data are from Digest of Education Statistics 2007; magnet and charter data are from “Numbers and Types of Public Elementary and Secondary Schools From the Common Core of Data: School Year 2005-2006,” National Center for Education Statistics; the homeschooled pop-ulation is estimated as described in appendix A.
3%
2%
4%
11%
80%
Home school Charter school Magnet school Private school Traditional K-12
10
The last 20 to 30 years can be characterized as a period of increasingschool choice. Today, students may attend magnet or charter schoolswithout leaving the public school universe, they may be home-schooled, or they may attend private schools. Finally, an increasingnumber of high school students in public schools, private schools,and homeschools are enrolled in online courses. From DoD’s per-spective, these changes represent an increase in the variation inenlistees’ schooling experiences. (DoD’s education credentials donot distinguish between most types of public and private schooling;homeschooling is the exception.)
While homeschooled recruits are the focus of this research, recruitswith other credentials also took AIM during the study period. Next,we provide some background on other common credentials amongAIM test-takers.
The National Guard Youth ChalleNGe program
The ChalleNGe program, operated jointly by the states and the stateNational Guard units with federal funding, targets at-risk youthbetween the ages of 16 and 18. ChalleNGe is a residential programthat lasts 22 weeks. It includes classroom instruction on both aca-demic and life-skill subjects; the academic focus of the program isdesigned to help cadets attain a GED credential. The program alsofeatures leadership opportunities and emphasizes the developmentof short- and long-term goals. Although the ChalleNGe program hasgrown rapidly, it is still relatively small; the combined sites produceabout 7,000 to 8,000 graduates per year. ChalleNGe graduates, how-ever, have high propensities to enlist.
Past analysis has shown that ChalleNGe graduates who enlist havevery low attrition rates over the first year of their terms, but rates goup somewhat in the next 2 years (compared with other enlistees).Also, attrition rates of ChalleNGe graduates have trended downwardduring recent years. ChalleNGe cadets have low standardized testscores, suggesting weak cognitive skills [17], yet the program has astrong emphasis on the formation of noncognitive skills. Therefore,we expect ChalleNGe graduates to score relatively well on AIM.
11
The General Educational Development credential
The GED program began during World War II as a route to certifica-tion for the many returning veterans who had not completed highschool prior to enlistment.7 Such certification allowed those veteranswho had the necessary skills to take advantage of the GI Bill and entercollege without first returning to high school. In the next few years,states began to allow nonveterans to take the test; by 1959, civiliantest-takers outnumbered veteran test-takers. During the late 1960s,GED preparation programs began to receive substantial governmentfunds, and the number taking the GED exam grew rapidly. Today, theGED has become an important credential for those who do not com-plete a traditional high school course of study. (The GED is the mostcommon alternate credential among enlisted Servicemembers, aswell as among all Americans.)
Although many people who receive GEDs consider themselves highschool graduates,8 substantial research indicates that a GED is notequivalent to a traditional high school diploma. In particular, youngGED-holders have been found to work less, earn less per hour, andhave higher job turnover than otherwise similar high school diplomagraduates.9 Some research suggests that GED-holders specifically lacknoncognitive skills ([5] and [7]). For this reason, we expect thatGED-holders may score lower than others on AIM, and that AIM maybe particularly predictive of this group’s military performance.
Implications for recruiting
Education credentials are likely to remain an important predictor offirst-term attrition. Recent educational reforms, however, haveincreased the types of schools available to students. Although the vast
7. For more background on the GED, see [18] or [19].
8. This viewpoint is encouraged by the GED Testing Service, the groupthat develops, oversees, and collects information on the GED tests.
9. The seminal research is [20]; more recent research has repeatedly con-firmed those findings. DoD classifies the GED as Tier 2, based on thehistorically high attrition rates of those who enlist with the credential.
12

majority of students still attend traditional public schools, studentstoday may attend several different types of schools over the course ofa K–12 education; a student might spend a few years in a privateschool, then shift to public school, and perhaps at some point attenda magnet or charter school. Students also may move back and forthbetween homeschools and other types of schools. This type of move-ment is likely to continue, particularly for students who live in areaswith many schooling options. Finally, the education some studentsreceive at any one time may be a blend. For example, students may beprimarily homeschooled but may take a course or two at a nearbypublic school, or they may be enrolled in a private school but takesome courses in a virtual (i.e., online) school.
From the military’s perspective, a student’s education credential isdetermined by the last school attended. In general, a student attend-ing each type of school in figure 3, with the exception of a home-school, would be characterized as a regular (traditional) high schooldiploma graduate. A student who is homeschooled for the first yearsof school but who attends and graduates from a traditional highschool “looks like” a regular high school diploma graduate; a home-schooled student or a GED-holder who attends a community collegeis coded as having “some college.” Thus, any performance differencesthat we are able to measure based on DoD-coded education creden-tials are likely to understate the true differences.
The GED credential remains quite consistent; all GED-holders takeexactly the same test. Over the last 10 to 15 years, the number of stu-dents who receive a GED rather than a traditional high schooldiploma has increased. This trend, which often is not evident innational education statistics, is troubling from DoD’s perspective.The most careful estimates indicate that currently, about one-quarterof students (500,000 or so) leave high school without a diploma [21].Conservatively, at least 150,000 young people receive a GED each year[22]. Of the students who complete high school, nearly two-thirdsenroll in college [23, table 191]. Thus, the traditional recruiting mar-ket, which includes those who completed high school but do notattend college immediately, is smaller than in the past; today aboutone-quarter of all students fall in this category. The group without ahigh school diploma is roughly the same size, but no more than 10
13

percent of enlistees may be nongraduates. This is likely to prove prob-lematic for recruiting in the future.
We next present our empirical results; we examine the performanceof enlistees who took AIM during FY08 and FY09. We continue tofocus on homeschoolers but also examine nongraduates based onAIM’s potential to measure noncognitive skills and the evidence thatthose who lack a high school diploma also lack noncognitive skills.
14

Data and descriptive statistics
Description of the data
To undertake this research, we first requested and received data onall applicants who took AIM in FY08 and FY09. We matched these datato the Defense Manpower Data Center (DMDC) active-duty accessionfiles, producing a dataset that includes a variety of information on allaccessions who took AIM. In particular, DMDC added a variable indi-cating whether the Servicemember completed the first months of ser-vice.10
We have differing amounts of performance data on those whoaccessed at different times.11 However, we observe at least 6 monthsof service for all accessions; thus, we focus on early-term performanceand comment on longer-term performance where appropriate.
Over 67,000 potential recruits took AIM during FY08 and FY09. Notall who took AIM enlisted, and we have no performance measures onthose who did not enlist.12 In addition, some entered the Delayed
10. We thank Mr. Louie Pappamichiel at Military Entrance Processing Com-mand (MEPCOM) for helping us to obtain AIM data and Ms. MarisaMichaels at DMDC for providing accession data and expertise.
11. When we first requested FY08 data, only 3 months of data were available.At our sponsors’ request, we asked for and received more FY08 data andreturned to request data on FY09 accessions. Thus, we requested data atseveral different points. At the end of the project, we had obtained dataon FY08 accessions through September 2009 and on FY09 accessionsthrough April 2010. Therefore, we have 9 to 21 months of informationon FY08 accessions (depending on their date of accession) and 7 to 19months of information on FY09 accessions. For this reason, we focus on3- and 6-month attrition rates, which we have for all accessions, and sup-plement these with 12-month rates, which we have for some accessions.
12. Of those who did not enlist, some failed to meet the standards; otherschose not to enlist or not to enlist in available specialties/occupations.
15
Entry Program (DEP) prior to enlistment; in some cases, we observeentry into DEP but not active-duty performance—either because ofDEP attrition or because of remaining in DEP beyond the end of oursample period. These people are not in our sample. The majority ofthose who took AIM, however, did enlist during our sample period.
Among those who did enlist, nearly half joined the Guard orReserves. Although those who entered the Guard/Reserves tended toresemble those who enlisted to active duty, they were more likely tobe women and were slightly older. They were less likely than active-duty accessions to hold a GED and had somewhat lower AFQT scores.Finally, Guard/Reserve accessions had slightly lower AIM scores. Thevast majority (over 80 percent) of homeschoolers who took AIMentered the active-duty forces, not the Guard/Reserves.
Because of the different structure of service in the Guard/Reserves,performance data between those on active duty and those in theGuard/Reserves are not directly comparable. Also, DMDC does notkeep integrated performance files on guardsmen/reservists. Forthese reasons, from this point on, we focus our attention on thosewho enlist into the active component.13
AIM test-takers
Our sample includes 24,989 Servicemembers who took AIM beforebeginning active-duty service in either FY08 or FY09. The medianAIM score is 52, whereas the mean is roughly 50.6; the standard devi-ation is about 10. (A higher AIM score indicates a higher level of moti-vation.) The distributions by year, and by Service, are very similar.
About 96 percent of our sample entered the Army. TTAS drives thelarge number of AIM test-takers who join the active-duty Armybecause all who are screened by TTAS take AIM; since TTAS is aimedat GED-holders, nearly three-quarters of the Army sample hold aGED. The rest is made up of homeschoolers (1,192), ChalleNGe par-ticipants (495), and Servicemembers with other education creden-
13. Specifically, our sample includes all non-prior-service (NPS) active-dutyaccessions with nonzero AFQT scores.
16
tials who took AIM on a time-available basis (5,818). Because allhomeschoolers took AIM, only about half of the homeschoolers inour sample entered the Army; the rest entered another Service.
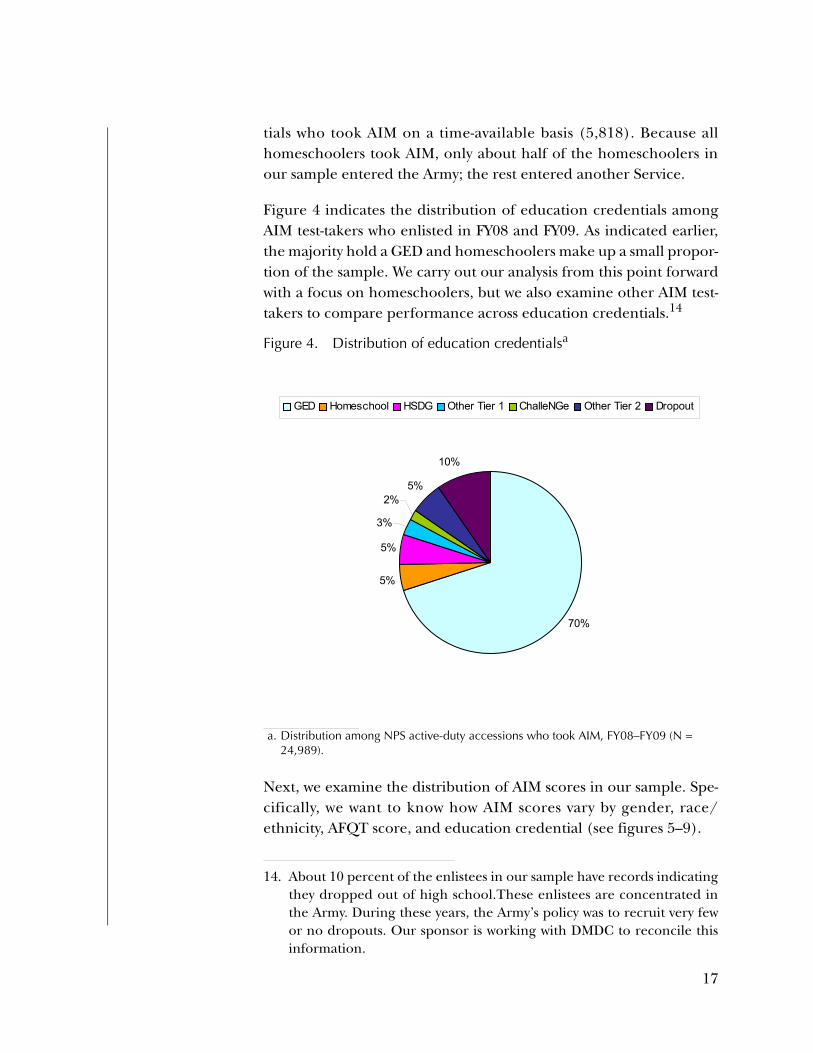
Figure 4 indicates the distribution of education credentials amongAIM test-takers who enlisted in FY08 and FY09. As indicated earlier,the majority hold a GED and homeschoolers make up a small propor-tion of the sample. We carry out our analysis from this point forwardwith a focus on homeschoolers, but we also examine other AIM test-takers to compare performance across education credentials.14
Next, we examine the distribution of AIM scores in our sample. Spe-cifically, we want to know how AIM scores vary by gender, race/ethnicity, AFQT score, and education credential (see figures 5–9).
Figure 4. Distribution of education credentialsa
a. Distribution among NPS active-duty accessions who took AIM, FY08–FY09 (N = 24,989).
14. About 10 percent of the enlistees in our sample have records indicatingthey dropped out of high school.These enlistees are concentrated inthe Army. During these years, the Army’s policy was to recruit very fewor no dropouts. Our sponsor is working with DMDC to reconcile thisinformation.
70%
5%
5%
3%
2%5%
10%
GED Homeschool HSDG Other Tier 1 ChalleNGe Other Tier 2 Dropout
17
18
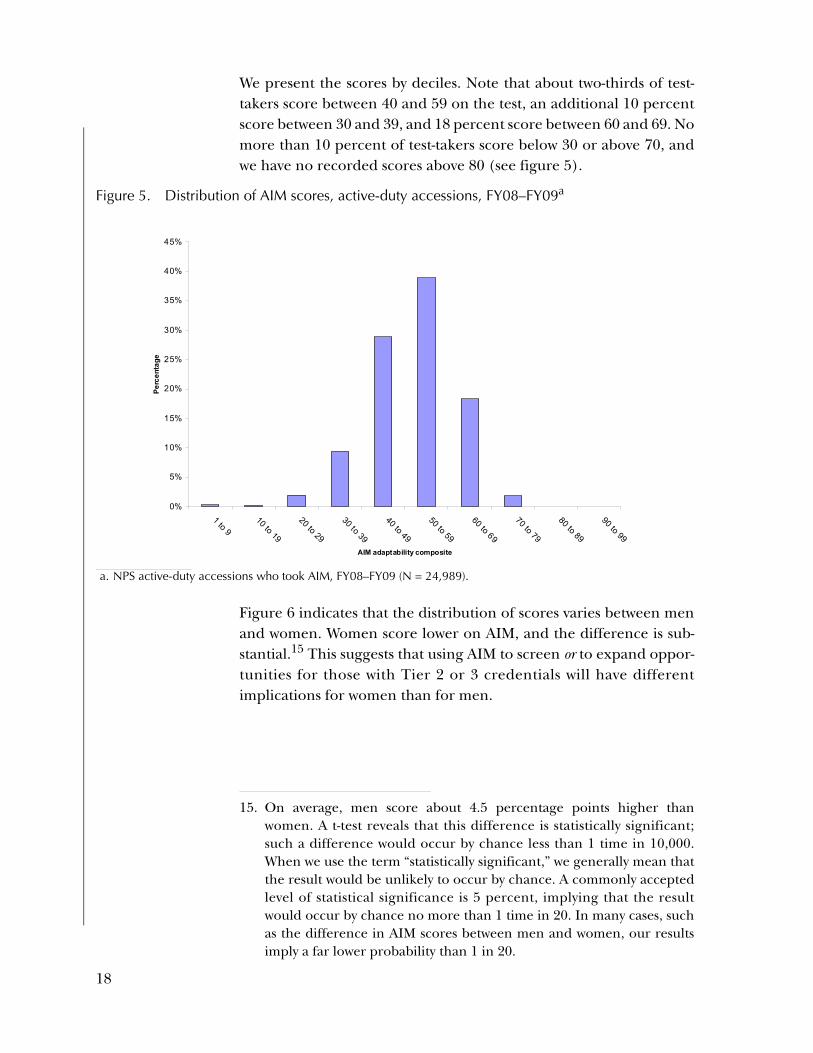
We present the scores by deciles. Note that about two-thirds of test-takers score between 40 and 59 on the test, an additional 10 percentscore between 30 and 39, and 18 percent score between 60 and 69. Nomore than 10 percent of test-takers score below 30 or above 70, andwe have no recorded scores above 80 (see figure 5).
Figure 6 indicates that the distribution of scores varies between menand women. Women score lower on AIM, and the difference is sub-stantial.15 This suggests that using AIM to screen or to expand oppor-tunities for those with Tier 2 or 3 credentials will have differentimplications for women than for men.
Figure 5. Distribution of AIM scores, active-duty accessions, FY08–FY09a
a. NPS active-duty accessions who took AIM, FY08–FY09 (N = 24,989).
15. On average, men score about 4.5 percentage points higher thanwomen. A t-test reveals that this difference is statistically significant;such a difference would occur by chance less than 1 time in 10,000.When we use the term “statistically significant,” we generally mean thatthe result would be unlikely to occur by chance. A commonly acceptedlevel of statistical significance is 5 percent, implying that the resultwould occur by chance no more than 1 time in 20. In many cases, suchas the difference in AIM scores between men and women, our resultsimply a far lower probability than 1 in 20.
0%
5%
10%
15%
20%
25%
30%
35%
40%
45%
1 to 910 to 19
20 to 29
30 to 39
40 to 49
50 to 59
60 to 69
70 to 79
80 to 89
90 to 99
AIM adaptability composite
Perc
enta
ge

Figure 7 shows that the distribution of scores varies little by race/eth-nicity. That said, the scores of Asian/Pacific Islanders (Asian/PIs) areslightly lower than the scores of other racial/ethnic groups.16
Figure 8 shows that most AIM scores are distributed similarly regard-less of AFQT score.17 Those whose AFQT score is below 31 are theexception; in these cases, AIM scores tend to be lower than for othertest-takers.18 This suggests that, for the vast majority of the sample,AIM may distinguish noncognitive characteristics. (In general, AIM isnot strongly associated with AFQT score; thus, if AIM is associatedwith attrition, it may be measuring some noncognitive aspect.)
Figure 6. Distribution of AIM scores, men versus womena
a. NPS active-duty accessions who took AIM, FY08–FY09 (N = 24,989).
16. Mean scores of Asian/PIs are about 2 percentage points lower thanscores of others in our dataset. A t-test reveals that this difference wouldbe expected to occur by chance less than 1 time in 1,000.
17. Categories of AFQT scores follow: I, 90 to 99; II, 65 to 92; IIIA, 51 to 64;IIIB, 31 to 49; IV, 10 to 30. Entrance is sharply limited for Category IVprospective recruits; our sample includes only 68 people.
18. Those whose AFQT scores are in Category IV score about 3 percentagepoints lower than others on AIM. A t-test indicates that such a differencewould occur by chance about 1 time in 100.
0%
5%
10%
15%
20%
25%
30%
35%
40%
45%
1 to 910 to 19
20 to 29
30 to 39
40 to 49
50 to 59
60 to 69
70 to 79
80 to 89
90 to 99
AIM adaptability composite
Perc
enta
ge
19
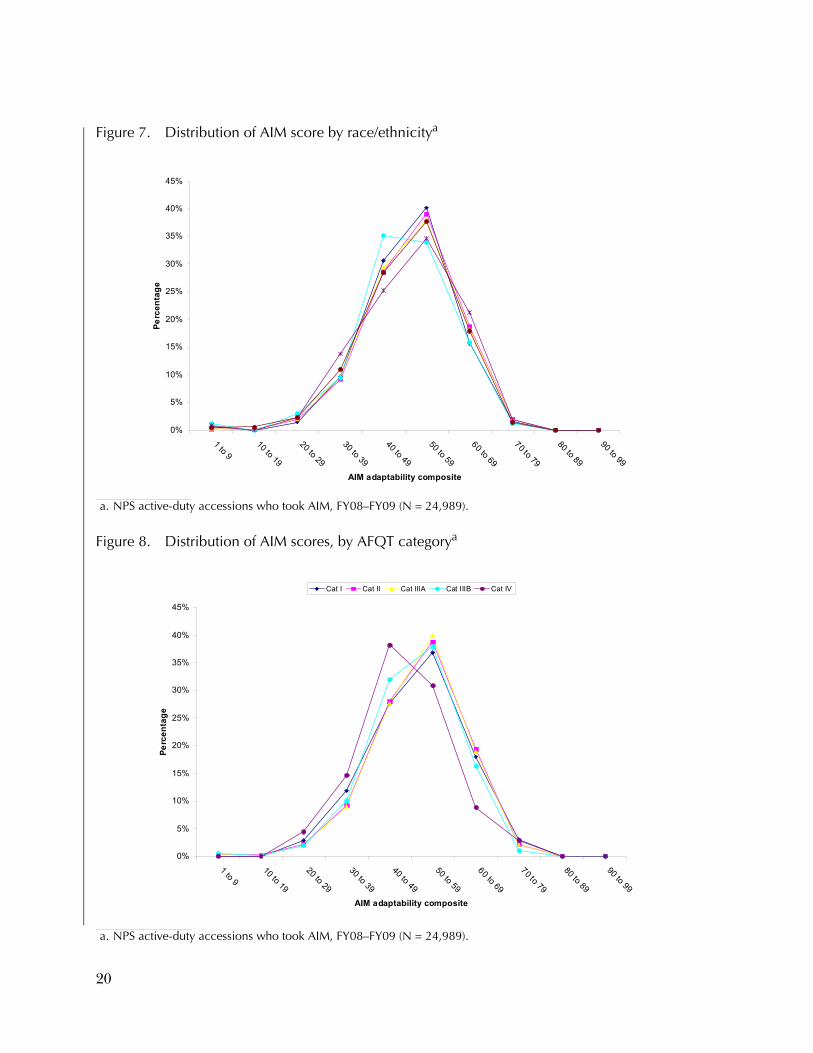
Figure 7. Distribution of AIM score by race/ethnicitya
a. NPS active-duty accessions who took AIM, FY08–FY09 (N = 24,989).
Figure 8. Distribution of AIM scores, by AFQT categorya
a. NPS active-duty accessions who took AIM, FY08–FY09 (N = 24,989).
0%
5%
10%
15%
20%
25%
30%
35%
40%
45%
1 to 910 to 19
20 to 29
30 to 39
40 to 49
50 to 59
60 to 69
70 to 79
80 to 89
90 to 99
AIM adaptability composite
Perc
enta
ge
0%
5%
10%
15%
20%
25%
30%
35%
40%
45%
1 to 910 to 19
20 to 29
30 to 39
40 to 49
50 to 59
60 to 69
70 to 79
80 to 89
90 to 99
AIM adaptability composite
Perc
enta
ge
Cat I Cat II Cat IIIA Cat IIIB Cat IV
20
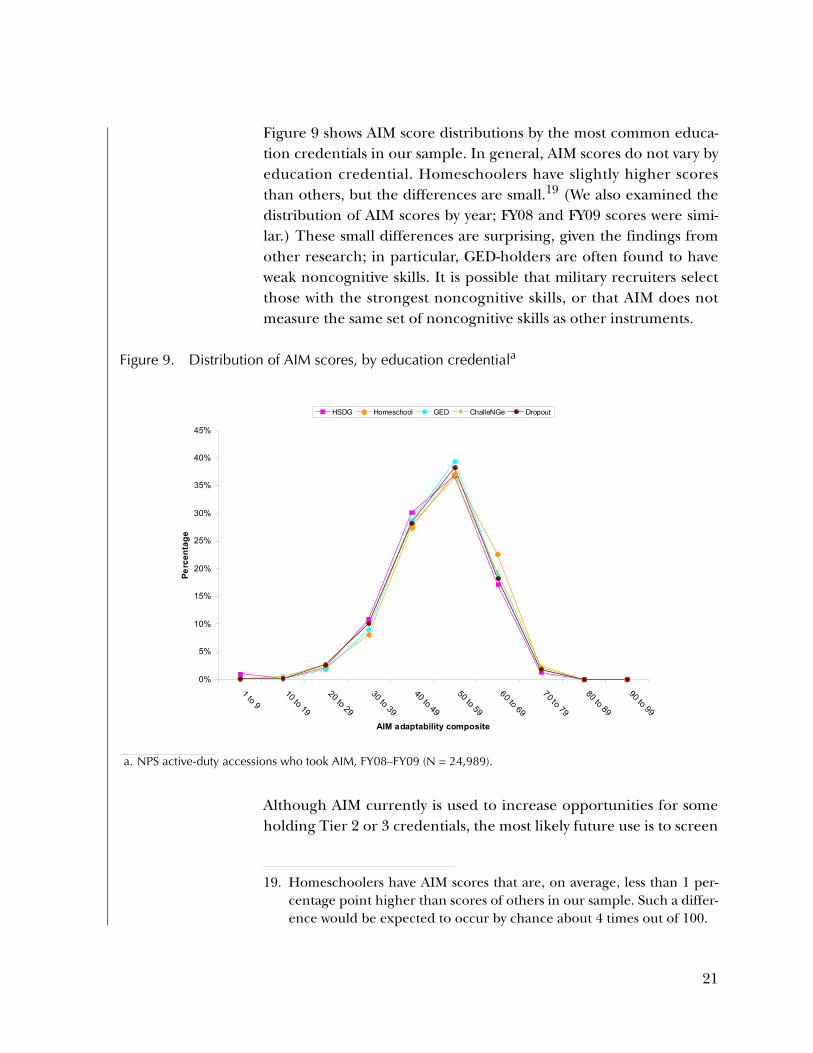
Figure 9 shows AIM score distributions by the most common educa-tion credentials in our sample. In general, AIM scores do not vary byeducation credential. Homeschoolers have slightly higher scoresthan others, but the differences are small.19 (We also examined thedistribution of AIM scores by year; FY08 and FY09 scores were simi-lar.) These small differences are surprising, given the findings fromother research; in particular, GED-holders are often found to haveweak noncognitive skills. It is possible that military recruiters selectthose with the strongest noncognitive skills, or that AIM does notmeasure the same set of noncognitive skills as other instruments.
Although AIM currently is used to increase opportunities for someholding Tier 2 or 3 credentials, the most likely future use is to screen
19. Homeschoolers have AIM scores that are, on average, less than 1 per-centage point higher than scores of others in our sample. Such a differ-ence would be expected to occur by chance about 4 times out of 100.
Figure 9. Distribution of AIM scores, by education credentiala
a. NPS active-duty accessions who took AIM, FY08–FY09 (N = 24,989).
0%
5%
10%
15%
20%
25%
30%
35%
40%
45%
1 to 910 to 19
20 to 29
30 to 39
40 to 49
50 to 59
60 to 69
70 to 79
80 to 89
90 to 99
AIM adaptability composite
Perc
enta
ge
HSDG Homeschool GED ChalleNGe Dropout
21
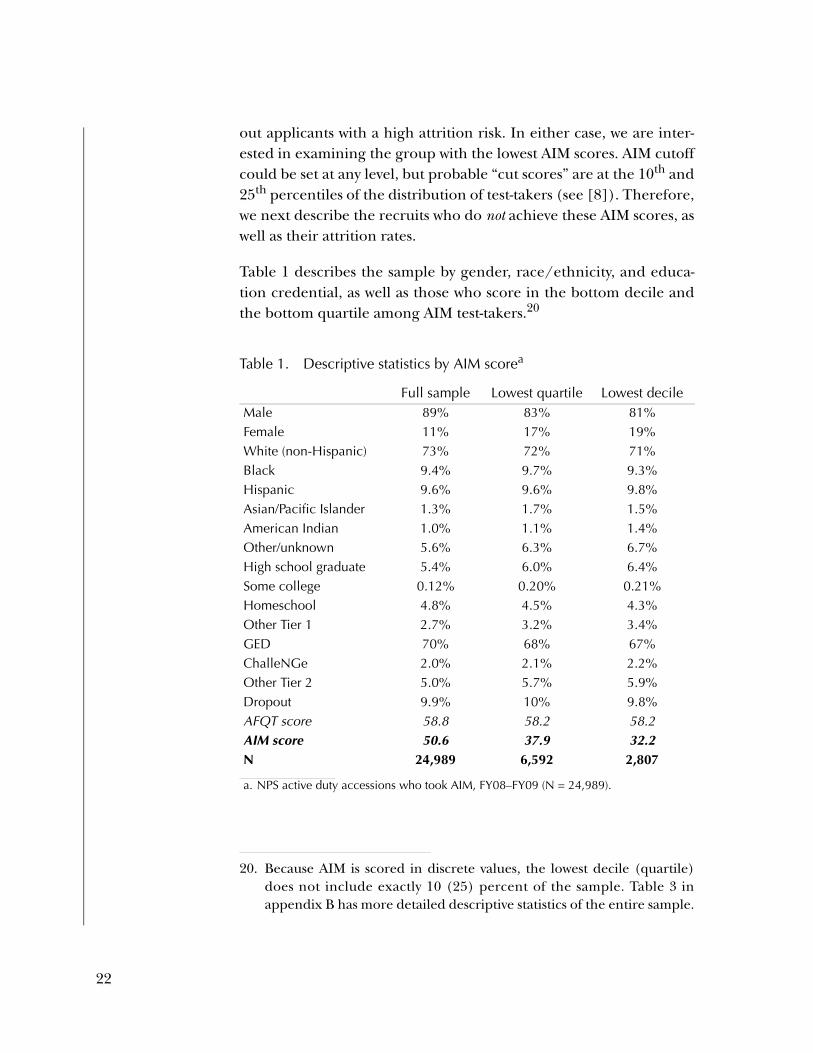
out applicants with a high attrition risk. In either case, we are inter-ested in examining the group with the lowest AIM scores. AIM cutoffcould be set at any level, but probable “cut scores” are at the 10th and25th percentiles of the distribution of test-takers (see [8]). Therefore,we next describe the recruits who do not achieve these AIM scores, aswell as their attrition rates.
Table 1 describes the sample by gender, race/ethnicity, and educa-tion credential, as well as those who score in the bottom decile andthe bottom quartile among AIM test-takers.20
Table 1. Descriptive statistics by AIM scorea
a. NPS active duty accessions who took AIM, FY08–FY09 (N = 24,989).
Full sample Lowest quartile Lowest decileMale 89% 83% 81%Female 11% 17% 19%White (non-Hispanic) 73% 72% 71%Black 9.4% 9.7% 9.3%Hispanic 9.6% 9.6% 9.8%Asian/Pacific Islander 1.3% 1.7% 1.5%American Indian 1.0% 1.1% 1.4%Other/unknown 5.6% 6.3% 6.7%High school graduate 5.4% 6.0% 6.4%Some college 0.12% 0.20% 0.21%Homeschool 4.8% 4.5% 4.3%Other Tier 1 2.7% 3.2% 3.4%GED 70% 68% 67%ChalleNGe 2.0% 2.1% 2.2%Other Tier 2 5.0% 5.7% 5.9%Dropout 9.9% 10% 9.8%AFQT score 58.8 58.2 58.2AIM score 50.6 37.9 32.2N 24,989 6,592 2,807
20. Because AIM is scored in discrete values, the lowest decile (quartile)does not include exactly 10 (25) percent of the sample. Table 3 inappendix B has more detailed descriptive statistics of the entire sample.
22
Non-Hispanic whites are slightly less likely than others to have lowAIM scores. Consistent with figure 9, there is no clear relationshipbetween education and AIM, although high school graduates areslightly overrepresented among those with low AIM scores and home-schoolers are slightly underrepresented. The clearest pattern is that,as suggested by figure 6, women make up a disproportionate numberof those with low AIM scores. However, based on the similarity in edu-cation credentials and AFQT scores between those with high versuslow AIM scores, table 1 suggests that AIM measures something otherthan education credential or cognitive ability.
AIM and attrition
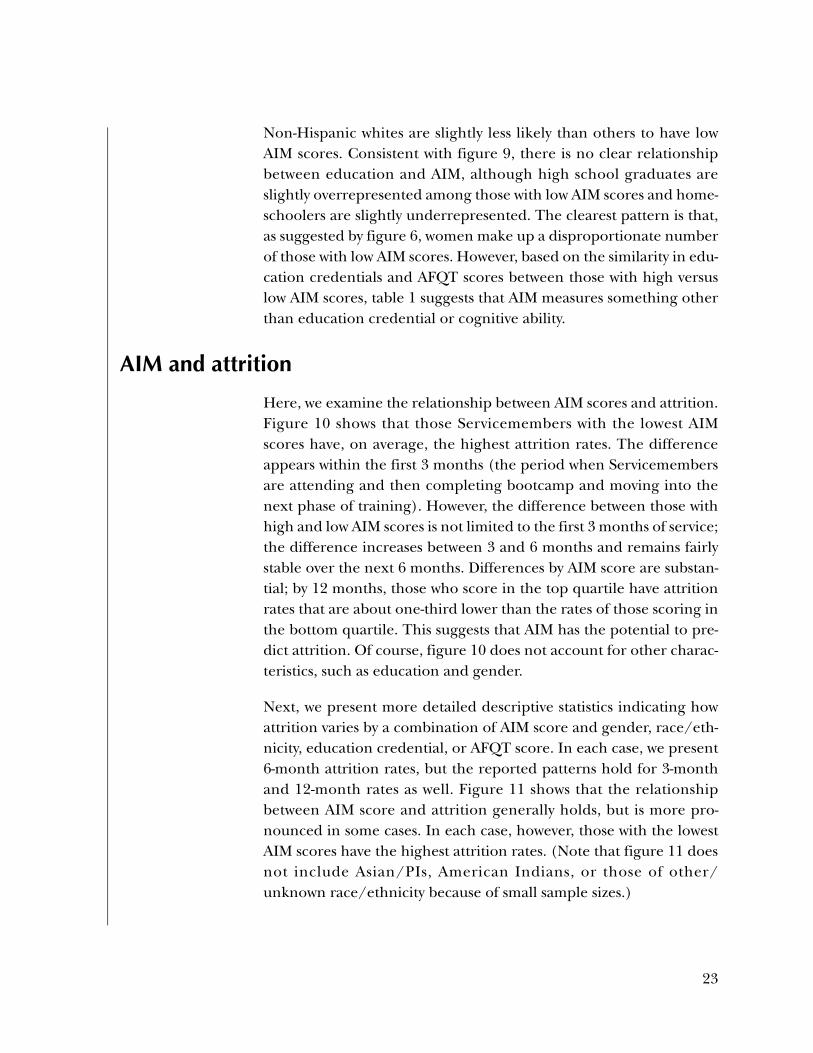
Here, we examine the relationship between AIM scores and attrition.Figure 10 shows that those Servicemembers with the lowest AIMscores have, on average, the highest attrition rates. The differenceappears within the first 3 months (the period when Servicemembersare attending and then completing bootcamp and moving into thenext phase of training). However, the difference between those withhigh and low AIM scores is not limited to the first 3 months of service;the difference increases between 3 and 6 months and remains fairlystable over the next 6 months. Differences by AIM score are substan-tial; by 12 months, those who score in the top quartile have attritionrates that are about one-third lower than the rates of those scoring inthe bottom quartile. This suggests that AIM has the potential to pre-dict attrition. Of course, figure 10 does not account for other charac-teristics, such as education and gender.
Next, we present more detailed descriptive statistics indicating howattrition varies by a combination of AIM score and gender, race/eth-nicity, education credential, or AFQT score. In each case, we present6-month attrition rates, but the reported patterns hold for 3-monthand 12-month rates as well. Figure 11 shows that the relationshipbetween AIM score and attrition generally holds, but is more pro-nounced in some cases. In each case, however, those with the lowestAIM scores have the highest attrition rates. (Note that figure 11 doesnot include Asian/PIs, American Indians, or those of other/unknown race/ethnicity because of small sample sizes.)
23
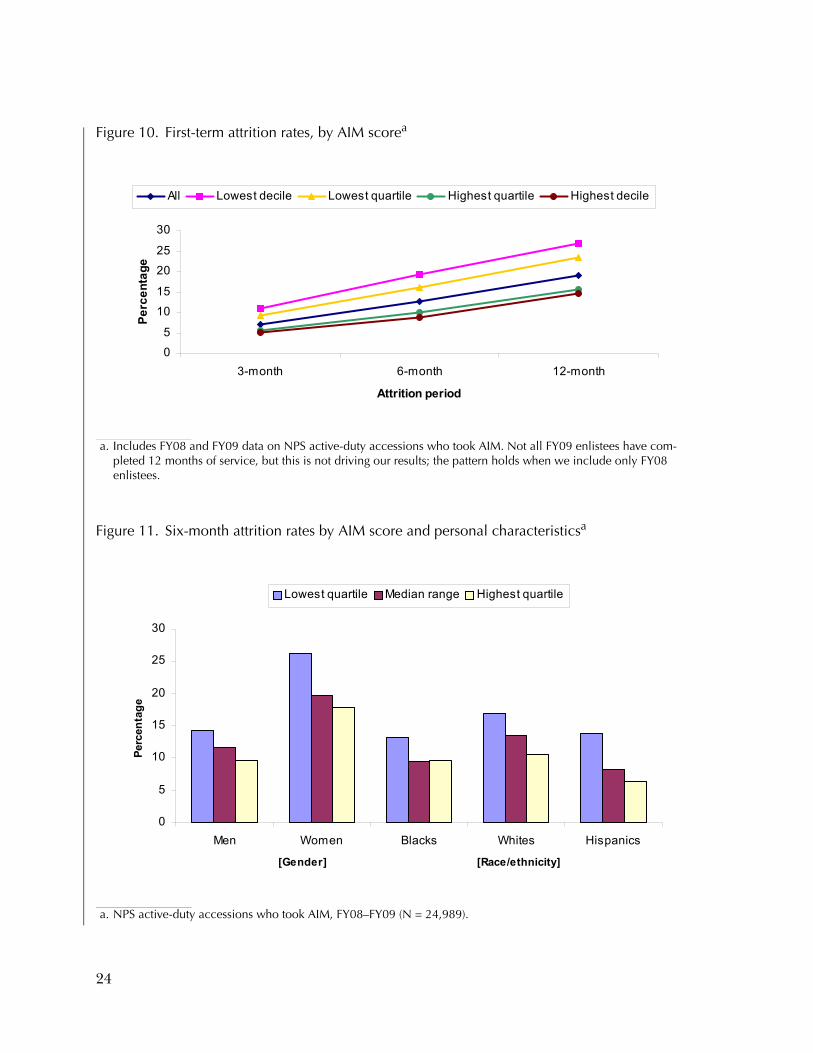
Figure 10. First-term attrition rates, by AIM scorea
a. Includes FY08 and FY09 data on NPS active-duty accessions who took AIM. Not all FY09 enlistees have com-pleted 12 months of service, but this is not driving our results; the pattern holds when we include only FY08 enlistees.
Figure 11. Six-month attrition rates by AIM score and personal characteristicsa
a. NPS active-duty accessions who took AIM, FY08–FY09 (N = 24,989).
0
5
10
15
20
25
30
3-month 6-month 12-month
Attrition period
Perc
enta
ge
All Lowest decile Lowest quartile Highest quartile Highest decile
0
5
10
15
20
25
30
Men Women Blacks Whites Hispanics
[Gender] [Race/ethnicity]
Perc
enta
ge
Lowest quartile Median range Highest quartile
24
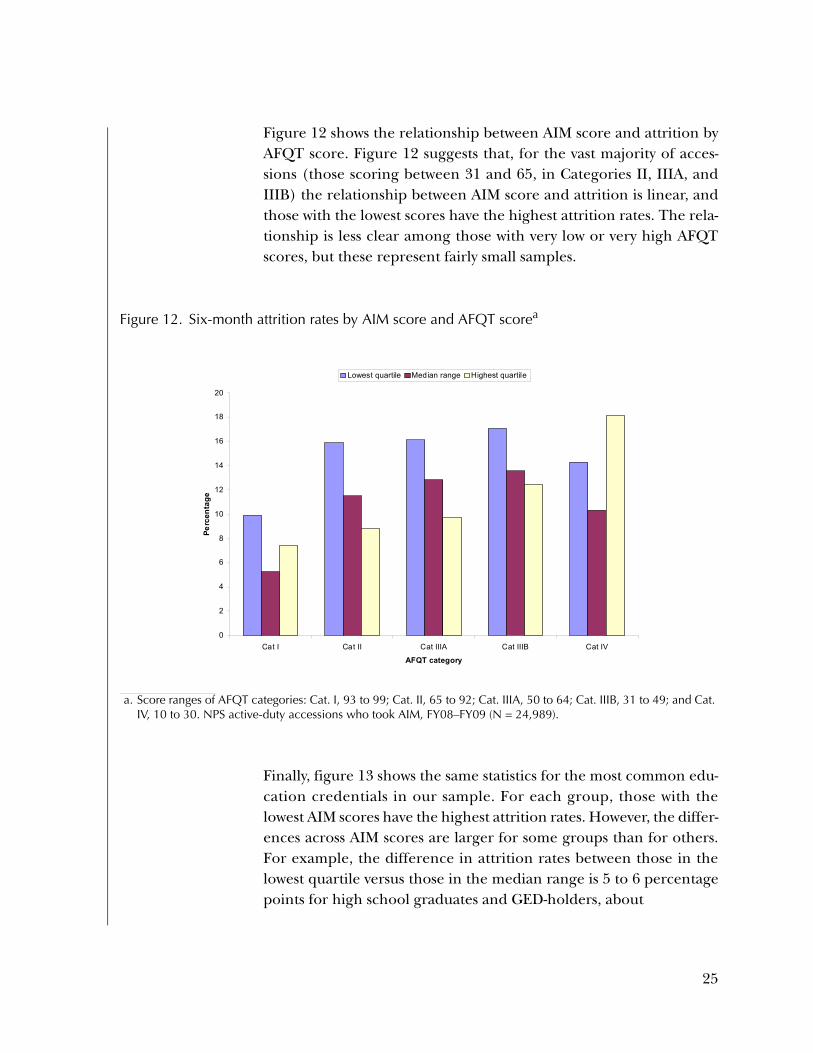
Figure 12 shows the relationship between AIM score and attrition byAFQT score. Figure 12 suggests that, for the vast majority of acces-sions (those scoring between 31 and 65, in Categories II, IIIA, andIIIB) the relationship between AIM score and attrition is linear, andthose with the lowest scores have the highest attrition rates. The rela-tionship is less clear among those with very low or very high AFQTscores, but these represent fairly small samples.
Finally, figure 13 shows the same statistics for the most common edu-cation credentials in our sample. For each group, those with thelowest AIM scores have the highest attrition rates. However, the differ-ences across AIM scores are larger for some groups than for others.For example, the difference in attrition rates between those in thelowest quartile versus those in the median range is 5 to 6 percentagepoints for high school graduates and GED-holders, about
Figure 12. Six-month attrition rates by AIM score and AFQT scorea
a. Score ranges of AFQT categories: Cat. I, 93 to 99; Cat. II, 65 to 92; Cat. IIIA, 50 to 64; Cat. IIIB, 31 to 49; and Cat. IV, 10 to 30. NPS active-duty accessions who took AIM, FY08–FY09 (N = 24,989).
0
2
4
6
8
10
12
14
16
18
20
Cat I Cat II Cat IIIA Cat IIIB Cat IV
AFQT category
Perc
enta
ge
Lowest quartile Median range Highest quartile
25
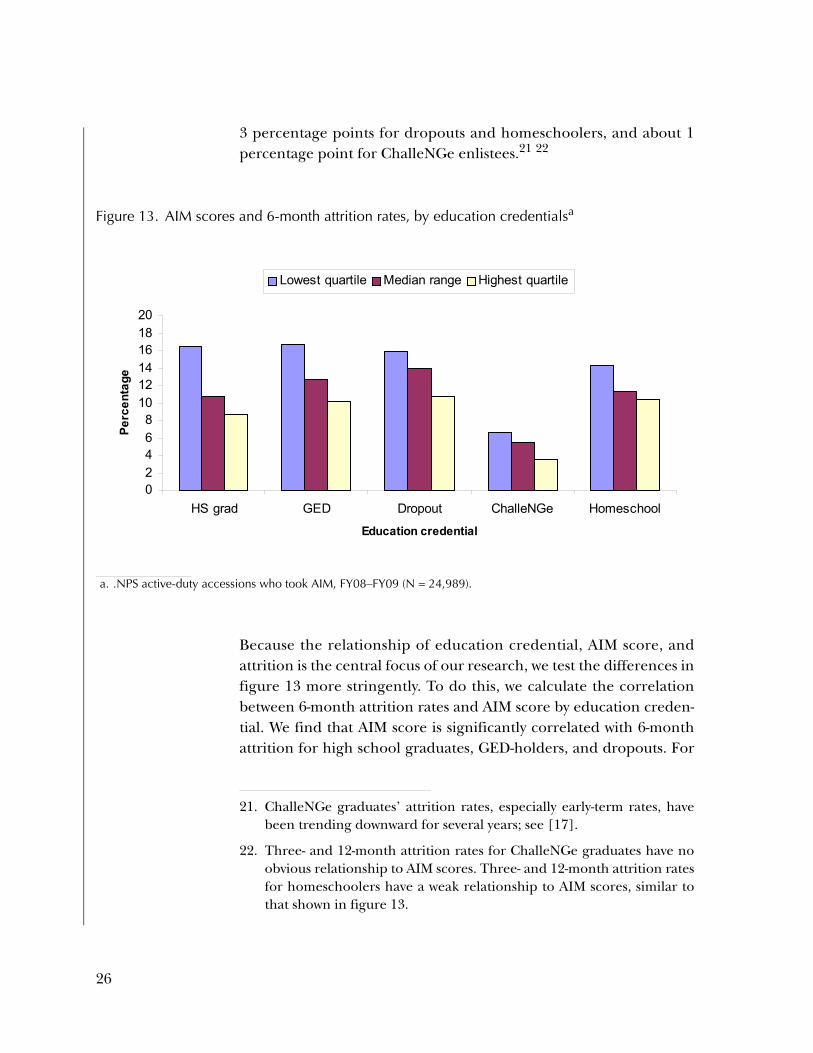
3 percentage points for dropouts and homeschoolers, and about 1percentage point for ChalleNGe enlistees.21 22
Because the relationship of education credential, AIM score, andattrition is the central focus of our research, we test the differences infigure 13 more stringently. To do this, we calculate the correlationbetween 6-month attrition rates and AIM score by education creden-tial. We find that AIM score is significantly correlated with 6-monthattrition for high school graduates, GED-holders, and dropouts. For
Figure 13. AIM scores and 6-month attrition rates, by education credentialsa
a. .NPS active-duty accessions who took AIM, FY08–FY09 (N = 24,989).
21. ChalleNGe graduates’ attrition rates, especially early-term rates, havebeen trending downward for several years; see [17].
22. Three- and 12-month attrition rates for ChalleNGe graduates have noobvious relationship to AIM scores. Three- and 12-month attrition ratesfor homeschoolers have a weak relationship to AIM scores, similar tothat shown in figure 13.
02468
101214161820
HS grad GED Dropout ChalleNGe Homeschool
Education credential
Perc
enta
ge
Lowest quartile Median range Highest quartile
26
homeschoolers, the relationship fails to achieve statistical significance; for ChalleNGe enlistees, the relationship is smaller thanfor other groups and again fails to achieve statistical significance.23
To summarize, our descriptive statistics indicate that AIM scores dodiffer by personal characteristics. In particular, scores are distributeddifferently between men and women, and there are slight differencesacross racial/ethnic groups. Distributions are similar across most edu-cation credentials (homeschoolers have only slightly higher scoresthan others). For the vast majority of accessions, AIM scores differlittle by AFQT scores. This last fact suggests that AIM scores may mea-sure noncognitive skills.
Across the sample, AIM scores are related to early-term attrition. Inparticular, those who score in the lowest AIM quartile have attritionrates that are substantially higher than others. However, the relation-ship between AIM score and attrition is stronger for some groupsthan for others. In the case of homeschoolers, those with the lowestAIM scores have higher attrition than others at the 6- and 12-monthpoints, but the relationship between AIM score and attrition is not aswell defined as for some other groups. Among ChalleNGe graduates,AIM scores seem only weakly related to attrition. Thus, our descrip-tive statistics suggest that AIM scores may be more predictive of attri-tion for some groups than for others. Next, we use regression analysisto separate the effects of gender, race/ethnicity, education creden-tial, AFQT score, and AIM score on early-term attrition.
23. AIM score and 6-month attrition correlations, by education credential,follow: High school graduates: -0.11 (0.000); GED-holders: -0.09(0.000); Dropouts: -0.07 (0.006); ChalleNGe enlistees: -0.05 (0.11);Homeschoolers: -0.08 (0.07). In each case, the correlation is negative,meaning that those with higher AIM scores have lower attrition, but therelationship achieves statistical significance only for high school gradu-ates, GED-holders, and dropouts. In the case of ChalleNGe enlistees,there is a 1-in-9 probability that such a relationship could occur bychance; in the case of homeschoolers, the probability is about 1 in 14.We also tested the relationship between 6-month attrition and scoringin the bottom quartile of AIM; results were consistent with thosereported above.
27
Regression results: AIM score and attrition
Regression analysis allows us to separate the effects of AIM on attri-tion from the effects of other characteristics. Consider the effect ofage; some research finds that older recruits perform better in the mil-itary, but older recruits also may perform better on AIM. In this case,regression analysis allows us to parse the relationship between age,AIM score, and attrition.
In our regression models, we seek to explain early-term attrition(attrition is our dependent variable). We include personal character-istics previously found to be linked to attrition, such as gender, race/ethnicity, age, fiscal year, marital status, and body mass index (BMI),as well as education credential, AFQT category, and Service. We runseparate regressions for 3-, 6-, and 12-month attrition.24 25
Figure 14 shows some of the predicted probabilities from our basicregression models (complete results are in table 4 of appendix B).The broken horizontal lines indicate average attrition rates for maleGED-holders with average AIM scores; these lines are for comparisonpurposes.
Figure 14 demonstrates that the effect of having an AIM score in thebottom quartile (i.e., a low AIM score) increases attrition, but by a rel-atively small amount. Specifically, those with AIM scores in thebottom quartile have higher attrition than others, but the differenceis much smaller than the difference between ChalleNGe graduatesand GED-holders and also much smaller than the difference between
24. Attrition is a dichotomous variable (it occurs or it does not). In suchcases, linear regression models yield incorrect results, so we use a logit(logistic) model. The relationship between the estimated coefficients ina logit model and the marginal effects is nonlinear, so coefficients arenot indicative of the size of marginal effects. Figure 14 presents pre-dicted probabilities; complete regression results are in appendix B.
25. BMI is defined as a person’s weight in kilograms divided by the squareof his or her height in meters. The Services use such measures of heightand weight as a screen during enlistment. A BMI of 18.5 to 24.9 is con-sidered normal, while a BMI of 25 to 29.9 is “overweight,” a BMI of 30or more is “obese,” and a BMI of less than 18.5 is “underweight.”
28
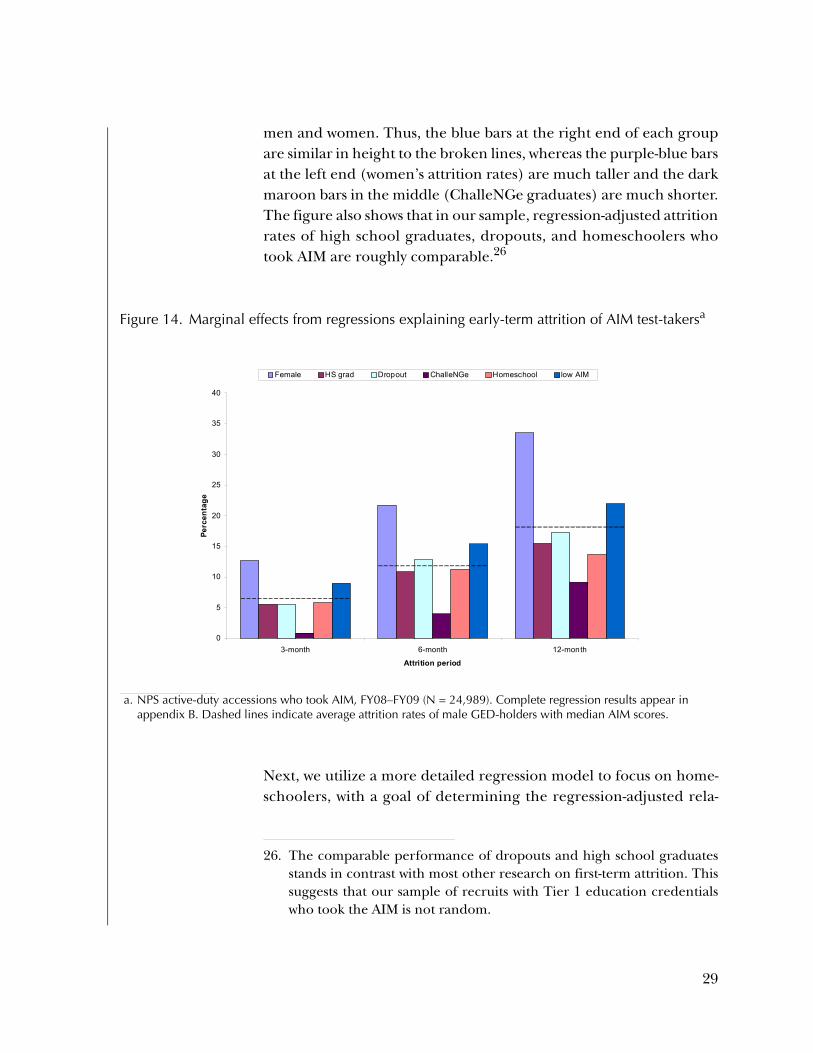
men and women. Thus, the blue bars at the right end of each groupare similar in height to the broken lines, whereas the purple-blue barsat the left end (women’s attrition rates) are much taller and the darkmaroon bars in the middle (ChalleNGe graduates) are much shorter.The figure also shows that in our sample, regression-adjusted attritionrates of high school graduates, dropouts, and homeschoolers whotook AIM are roughly comparable.26
Next, we utilize a more detailed regression model to focus on home-schoolers, with a goal of determining the regression-adjusted rela-
Figure 14. Marginal effects from regressions explaining early-term attrition of AIM test-takersa
a. NPS active-duty accessions who took AIM, FY08–FY09 (N = 24,989). Complete regression results appear in appendix B. Dashed lines indicate average attrition rates of male GED-holders with median AIM scores.
26. The comparable performance of dropouts and high school graduatesstands in contrast with most other research on first-term attrition. Thissuggests that our sample of recruits with Tier 1 education credentialswho took the AIM is not random.
0
5
10
15
20
25
30
35
40
3-month 6-month 12-month
Attrition period
Perc
enta
ge
Female HS grad Dropout ChalleNGe Homeschool low AIM
29
tionship between AIM scores and homeschoolers’ attrition rates.27
Our regression results (presented in table 5, appendix B) indicatethat GED-holders with AIM scores in the lowest quartile consistentlyhave higher attrition than other GED-holders. High school diplomagraduates with AIM scores in the lowest quartile have higher attritionrates than other high school diploma graduates at the 3- and 6-monthpoints, but the difference is smaller and insignificant by 12 months.For other groups in our dataset, the results are less clear. Our resultssuggest that dropouts and homeschoolers with low AIM scores alsomay have higher attrition than otherwise similar enlistees with aver-age AIM scores, but the results are not statistically significant and theeffects are smaller than those observed for GED-holders and highschool diploma graduates. In the case of ChalleNGe graduates, ourestimated effects were even smaller, always insignificant, and some-times not in the expected direction. Finally, we estimated a more par-simonious version of our regression on homeschoolers alone; again,our results were not statistically significant, and the estimated effectswere smaller than those found for GED-holders or high schooldiploma graduates.
Based on all of our results, descriptive statistics as well as regressionmodels, we find limited evidence that AIM scores can be used to pre-dict the attrition behavior of homeschooled recruits. Although home-schoolers with the lowest AIM scores do have higher attrition thanother homeschoolers, our regression results suggest that other fac-tors may explain this. However, evidence suggests that the test is morelikely to be effective for GED-holders than for homeschoolers (orChalleNGe graduates).
Because of the different distribution of AIM scores between men andwomen, we tested the idea that AIM may predict attrition differentlyfor men and women. In our models looking at 3- and 6-month attri-tion, there was some indication that men with low AIM scores hadslightly lower attrition rates than women with low AIM scores, but
27. This model includes interactions between education credentials andlow AIM scores; in this manner, we can determine whether the effect ofhaving a low AIM score varies by education credential as our descriptivestatistics suggest (refer back to figure 13).
30
there was no difference by 12 months and the earlier differences werequite small.28 Overall, AIM had very similar predictive power for menand women.
AIM measures personality traits. If personality traits differ acrosspeople with different education credentials who apply to enlist, thiscould explain our findings that AIM seems to be more closely relatedto attrition behavior for those who hold GEDs than for those holdingother credentials.
Of course, our samples of dropouts, ChalleNGe graduates, andhomeschoolers are much smaller than our sample of GED-holders.We tested the idea that small sample sizes prevented us from discov-ering the relationship between AIM and performance in the courseof this project (the original research plan included FY08 data only).Adding FY09 data increased the statistical power of our models withrespect to high school graduates; given the estimated coefficients,however, it seems less likely that small samples are driving our resultsin the cases of homeschoolers and ChalleNGe graduates.
Past research indicates that AFQT scores may predict attrition behav-ior better for homeschoolers than for other recruits. This could bedue to the nonstandard nature of homeschooling [14]. As discussedin the background section, homeschooling laws are set at the statelevel and vary substantially from state to state. Some states have spe-cific requirements in terms of subject matter, hours/days in the class-room, and testing, whereas others do not even require thatauthorities be informed of homeschooling. On top of this, it is likelythat parents choose to homeschool for a wide variety of reasons;therefore, we would expect that homeschooling curricula vary widely.
Homeschoolers who enlist are a nonrandom sample of all home-schoolers. Therefore, the relationship between AIM scores and attri-
28. The marginal effects suggested that men with low AIM scores may have,at most, attrition rates that are 20 percent lower than those of womenwith low AIM scores. However, this effect is much smaller than the over-all difference between men’s and women’s attrition rates. Thus, AIMscores provide little explanation for the attrition differences betweenmen and women.
31
tion for homeschoolers has few or no implications for the broaderhomeschooling community. But our results suggest that other factorsunrelated to AIM may determine homeschoolers’ early attrition rates.
Homeschoolers do not appear to be disadvantaged by AIM; in fact,they score slightly higher than many other groups (see figure 9).However, our regression results indicate that AIM is not an especiallyeffective predictor of homeschoolers’ early-term attrition behavior.Although the homeschoolers in our sample have, on average, slightlyhigher AFQT scores than others in our sample, it is possible thathomeschoolers who leave the Service do so primarily for academicreasons, perhaps because of the tremendous variation in home-schooling curricula. Consistent with this, we find that AFQT scoreand attrition are more strongly (negatively) correlated for home-schoolers than for others in our sample.29 In other words, those withlower AFQT scores have higher attrition, and this relationship ismore pronounced among homeschoolers in our sample than amongothers. Of course, noncognitive aspects not picked up by AIM alsocould explain homeschoolers’ military performance. Our data do notallow us to distinguish between these possibilities.
AIM does not seem to predict early attrition of ChalleNGe graduates.The ChalleNGe program is a quasi-military, residential programwhose graduates are familiar with many aspects of bootcamp life. Pastresearch indicates that ChalleNGe graduates tend to perform quitewell in the early months of the first term; some struggle in latermonths. However, the overall attrition rate of ChalleNGe graduateshas been dropping steadily over the past few years [17], and ourresults are consistent with this trend. ChalleNGe graduates as a group
29. The correlation between AFQT score and 6-month attrition is -0.0853for homeschoolers and -0.0293 for others in our sample; the correlationbetween AFQT score and 12-month attrition is -0.0947 for homeschool-ers and -0.0192 for others in our sample. Each correlation is statisticallysignificant at the 0.5-percent level or better, indicating that such rela-tionships would be expected to occur by chance no more than 1 time in200. The coefficients in our regressions generally are consistent withthis result as well, though in some cases they do not achieve statisticalsignificance.
32
have lower AFQT scores than GED-holders and therefore tend toenter the military at a disadvantage in terms of cognitive skills, but theChalleNGe program has a strong emphasis on leadership and non-cognitive skills.30 This is reflected in AIM scores of ChalleNGe gradu-ates, which are equivalent to those of other groups. This suggests thatChalleNGe graduates who enlist have fairly strong noncognitive skills.Like homeschoolers, ChalleNGe graduates may struggle later in theterm for cognitive reasons or because of noncognitive aspects notpicked up by AIM. In any case, AIM is unlikely to serve as a helpfulscreen for ChalleNGe enlistees.
It is not surprising that AIM predicts attrition for GED-holders whoenlist. This group has relatively high AFQT scores, but civilianresearch has characterized male GED-holders in particular as lackingnoncognitive skills [5]. Therefore, we would expect a noncognitivescreen to be particularly effective for this group. AIM also seems tohave some predictive power over high school diploma graduates inour sample, especially in the early months of service.
In summary, although it is possible that AIM scores will better predictlater-term attrition for homeschoolers, or will predict attrition fordropouts with bigger samples, our results to date indicate that AIM ispredictive of attrition behavior only for GED-holders (and for highschool graduates in the early months of service). Although AIM scoreis related to attrition behavior for homeschoolers in simple correla-tions, the relationship does not hold up in regression models.
Implications of using AIM to determine accession eligibility
As discussed earlier, AIM’s most likely use is as a cut score. For exam-ple, the Services could require all recruits, or some recruits, toachieve a given AIM score as a condition for enlistment. Using AIMin such a manner has different implications for different groups. AIMscores vary relatively little by education credential or race/ethnicity,but they vary more between men and women. (Refer back to figure
30. ChalleNGe enlistees have, on average, AFQT scores that are about 7points lower than others in our sample; this difference is statistically sig-nificant, predicted to occur by chance less than 1 time in 10,000.
33
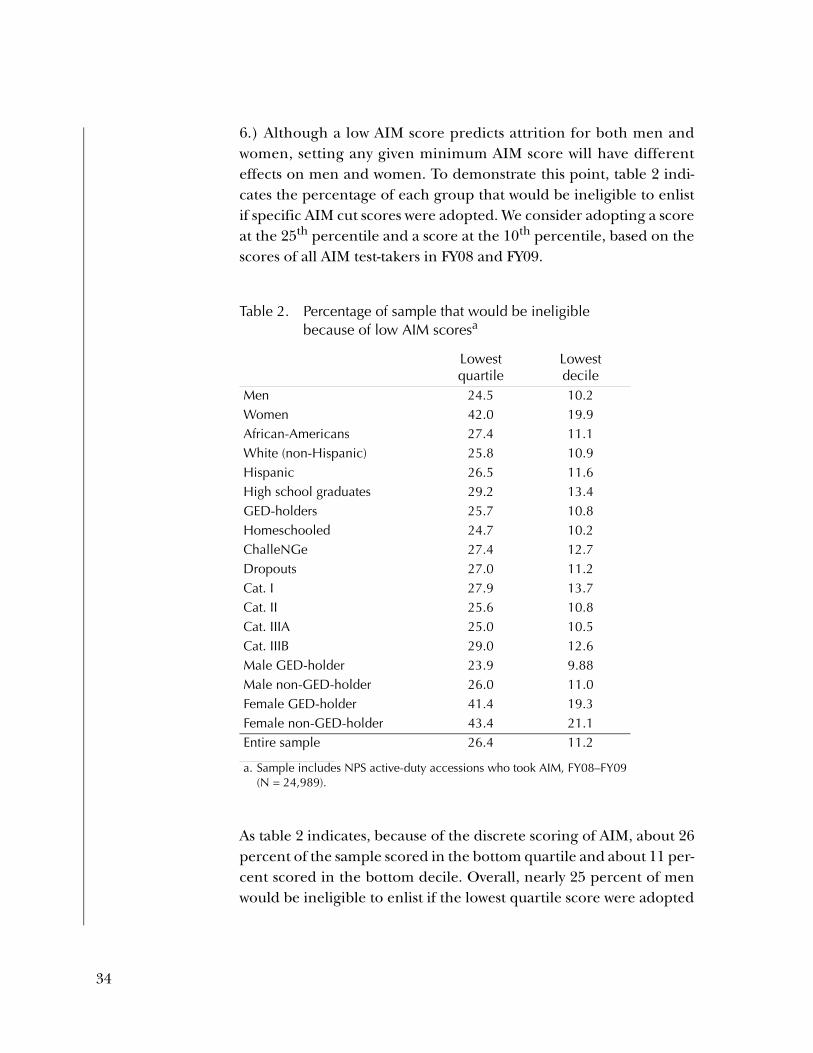
6.) Although a low AIM score predicts attrition for both men andwomen, setting any given minimum AIM score will have differenteffects on men and women. To demonstrate this point, table 2 indi-cates the percentage of each group that would be ineligible to enlistif specific AIM cut scores were adopted. We consider adopting a scoreat the 25th percentile and a score at the 10th percentile, based on thescores of all AIM test-takers in FY08 and FY09.
As table 2 indicates, because of the discrete scoring of AIM, about 26percent of the sample scored in the bottom quartile and about 11 per-cent scored in the bottom decile. Overall, nearly 25 percent of menwould be ineligible to enlist if the lowest quartile score were adopted
Table 2. Percentage of sample that would be ineligible because of low AIM scoresa
a. Sample includes NPS active-duty accessions who took AIM, FY08–FY09 (N = 24,989).
Lowest quartile
Lowest decile
Men 24.5 10.2Women 42.0 19.9African-Americans 27.4 11.1White (non-Hispanic) 25.8 10.9Hispanic 26.5 11.6High school graduates 29.2 13.4GED-holders 25.7 10.8Homeschooled 24.7 10.2ChalleNGe 27.4 12.7Dropouts 27.0 11.2Cat. I 27.9 13.7Cat. II 25.6 10.8Cat. IIIA 25.0 10.5Cat. IIIB 29.0 12.6Male GED-holder 23.9 9.88Male non-GED-holder 26.0 11.0Female GED-holder 41.4 19.3Female non-GED-holder 43.4 21.1Entire sample 26.4 11.2
34
as a cutoff; if the lowest decile score marked the cutoff, nearly 10 per-cent of men would be ineligible. The percentages ineligible areroughly equal across many of the characteristics shown in table 2, butthe situation is different for women. About 42 percent of womenscore in the bottom quartile on AIM, and about 20 percent score inthe bottom decile. Thus, while AIM scores have roughly the same pre-dictive power for women and men, an AIM cutoff has quite differentimplications for women than for men. AIM cut scores at the 10th or25th percentile would disqualify a much higher percentage of womenthan men.
The distribution of AIM scores also differs slightly between GED-holders and others. GED-holders are slightly more likely than thoseholding other credentials to exceed the 10th and the 25th percentiles.This is summarized near the bottom of table 2: both men and womenwho do not hold a GED are more likely than others to score below the10th or 25th percentile, while the opposite is true of GED-holders.Thus, a cut score at the 10th or 25th percentile would disqualify alower percentage of GED-holders than others; this is a cause for con-cern because our findings suggest that AIM’s predictive power forother groups is limited.
Also, we consider the likely implications of using AIM versus the morerecently developed TTAS (Tier Two Attrition Screen). TTAS is a“whole person” measure; it is formed by combining AIM score withtwo ASVAB subtest scores and a BMI measure. The BMI measure is agender-specific indicator that the potential enlistee’s BMI falls in thetop 5 percent or the bottom 5 percent of the distribution. Thus, thosewho are heaviest for their height and those who are lightest for theirheight are flagged and receive lower TTAS scores as a result. Ourmodels include BMI indicators for underweight, overweight, andobese as well as the category of the person’s AFQT score. Therefore,our models include most aspects of TTAS, although not the exactmeasure. We find that those with the highest AFQT scores haveslightly lower attrition, whereas those who are either underweight oroverweight have somewhat higher attrition. We do not test theseeffects to see whether they differ between men and women orbetween those holding different education credentials; if theseeffects are more constant across groups than AIM’s effect, this would
35

indicate that TTAS is likely to better predict attrition across recruitsthan AIM.
Finally, ARI researchers have found that TTAS is predictive of home-schoolers’ first-term attrition [24]. This result is somewhat in contrastto our results; however, our datasets differ substantially. First, the ARIdata include a longer period of time, beginning in 2005 and moreobservations. Also, recall that TTAS includes components from theASVAB, as well as an indicator for very high or low BMI scores. Ourresults, combined with those of ARI, suggest that these other compo-nents of TTAS may be especially important in explaining the attritionof homeschoolers. This, in turn, suggests that TTAS has more poten-tial utility than AIM, especially to the extent that recruits with differ-ent education credentials tend to attrite for different reasons (i.e.,cognitive versus noncognitive). This is consistent with TTAS’s designas a “whole person” test; AIM, in contrast, focuses on noncognitiveskills.
36

Conclusions
In this research, we explore the relationship between the Assessmentof Individual Motivation (AIM) and early first-term attrition. Ourdata include all who took AIM and enlisted to active duty in FY08 andFY09. We emphasize homeschoolers and nongraduates because ofthe likely link between noncognitive skills and military performance.Our results suggest that AIM does measure some noncognitive skillsand that the distribution of AIM scores is similar across race/ethnic-ity, education credential, and AFQT score in most cases. We find,however, that women score substantially lower than men on AIM.
We find evidence that AIM predicts early-term attrition, for some inour sample. Specifically, AIM predicts attrition for GED-holders, andalso for high school diploma graduates in the early months of service.Research suggests that male GED-holders have poor noncognitiveskills and that this explains their relatively poor performance in themilitary and the civilian labor market. Within our sample, GED-hold-ers had average AIM scores at least as high as those of other groups,but the attrition of those GED-holders with low AIM scores was sub-stantially and significantly higher than the attrition of GED-holderswith higher AIM scores.
Our research also suggests, however, that the early-term performanceof several other groups is less tied to noncognitive skills (or, at least,to those skills measured by AIM). In particular, the tie between AIMand early-term performance is weak for dropouts and homeschoolersand practically nonexistent for ChalleNGe graduates. In the case ofhomeschoolers, descriptive statistics indicate that those with lowerAIM scores have higher attrition, but regression results suggest thatother factors explain this.
Past research indicates that homeschoolers’ military performance istied more strongly to AFQT scores than the performance of others.In particular, homeschoolers who score at least 50 on the AFQT have
37
attrition rates generally similar to those of traditional high schoolgraduates; homeschoolers who score lower on the AFQT have attri-tion rates more similar to those of GED-holders. In contrast, AIMoffers only a limited opportunity to distinguish between homeschool-ers with a high probability of early attrition and those with a lowerprobability. Taken together, these findings suggest that homeschool-ers’ noncognitive skills (as measured by AIM) play a relatively smallrole in explaining attrition. It is possible that homeschoolers, whoseeducational experiences vary widely, are a diverse group in terms ofcognitive skills; in this case, we would expect the AFQT to serve as auseful screen, and this is what other research finds.
Graduates of the National Guard Youth ChalleNGe program tend tohave relatively low AFQT scores, but have AIM scores that are similarto others in our sample. Their low AFQT scores are not a surprisebecause ChalleNGe graduates tend to be recent high school drop-outs; upon entering the program, their average achievement is at the7th grade level. Early-term attrition for this group, however, is quitelow and has fallen in recent years. We expected ChalleNGe graduatesto score well on AIM because of the program’s explicit emphasis onnoncognitive skills—specifically, leadership and planning. In fact,ChalleNGe graduates have AIM scores generally similar to those ofGED-holders or high school graduates. It is possible that AIM doesnot measure the noncognitive skills developed in the ChalleNGe pro-gram or that ChalleNGe cadets’ early-term low attrition is related toother factors (e.g., general familiarity with bootcamp). The attritionof ChalleNGe graduates tends to increase compared with that ofother groups between months 12 and 36; this may be related to theircognitive skills.
In summary, AIM offers the possibility of selecting those GED-holderswho are most likely to succeed, but there is less evidence that theinstrument will be helpful for those with other education credentials.We suggest tracking all groups throughout their first terms; longer-term analysis may uncover a stronger relationship between AIM andattrition for some other groups. At this point, however, we do not rec-ommend using AIM alone to select among recruits holding creden-tials other than a GED.
38

Appendix A: School choice in the United States
In this section, we detail the types of schools available. Also, we pro-vide some background on the estimated number of homeschooledstudents in the United States and the number or proportion of stu-dents attending each type.
Magnet schools
Magnet schools are public schools that allow enrollment based onnongeographic factors. Magnet schools tend to be clustered in ornear urban areas. Some magnet schools require entrance tests; manyhave “themes” or areas of specialization. In general, magnet schoolsreceive extra funding but follow the same regulations as other publicschools. As of 2006, there were more than 2,700 magnet schools inthe United States enrolling about 2.1 million students [25].
Charter schools
Charter schools also are funded with public dollars, but these schoolsare not bound by many of the requirements that other public schoolsface. In particular, principals at charter schools usually have a greatdeal of control over the process of hiring and firing teachers, and—in most cases—teachers have no collective bargaining agreement.Also, charter schools may meet for more hours per day, or more daysper year, than regular public schools.
The first charter school law was passed in 1991 in Minnesota; manyother states rapidly followed suit. Ten states currently do not have acharter school law, and thus have no charter schools, but most ofthese states are fairly small; about 93 percent of children live in a statethat permits charter schools. However, charter schools are quite con-centrated; more than half of all charter schools are located in onlyfive states [25]. Charter school regulations also vary among states.
39

Charter school enrollments have grown dramatically in recent years.In 2004, about 3,000 charter schools served some 638,000 students; by2009, there were over 4,600 schools serving some 1.5 million students[25, 26]. Thus, the number of students in charter schools appears tobe growing more quickly than the number of students in other typesof nontraditional schools (homeschools, magnet schools, and privateschools).
Private schools
At one time, school choice was synonymous with private school atten-dance. The total number of private school students in the UnitedStates is about 5 million.31 Despite several experiments with vouchers(credits that can be used to pay private school tuition), the vast major-ity of private school students do not use them; of course, the schoolsare free to offer reduced tuition or scholarships to some students.
We detail these other types of nontraditional schools because home-schooling does not exist in a vacuum. Although some parents wouldprobably choose to homeschool regardless of other choices available,it is likely that many families carefully consider and choose among allavailable options. Moreover, growth in one type of nontraditionalschool is likely to affect total enrollment in other types. For example,private school enrollments have grown very little in the past 10 to 20years; this stagnation is likely related to the expansion of magnet,charter, and/or homeschooling options.
Number of homeschooled students in the United States
Estimates based on surveys of homeschooled children, usually doneby homeschooling advocates, tend to produce numbers at the highend of the range. For example, the Homeschool Legal Defense Asso-ciation (HSLDA) uses information provided by the National Home
31. Private Schools Universe Survey, http://nces.ed.gov/surveys/pss. TheUniverse Survey estimates that the number of private school studentsfell between 2001–2002 and 2005–2006; no figures from later years areavailable.
40
Education Research Institute to estimate that about 2 million chil-dren were homeschooled during the 2002–2003 school year [27] andthat homeschooling is growing rapidly—perhaps at rates of 7 to 15percent per year [28].
Estimates based on responses to national surveys tend to be muchlower. For example, [29] estimates that there were about 850,000homeschooled students in 1999 and, using a similar methodology,[16] estimates that there were about 1.1 million in 2003.32 Reference[30] combined information from several sources to produce perhapsthe most credible estimates available; it estimated that there wereabout 1 million homeschooled students in 2001. All these estimatestogether suggest there are perhaps 1.5 million homeschooled stu-dents in the United States today.
32. These estimates, however, depend on national samples. The actualnumber of homeschooled students was very small (less than 300) inboth cases; therefore, the confidence intervals around these estimatesare quite large.
41

This page intentionally left blank.
42
Appendix B: Descriptive statistics and regression results
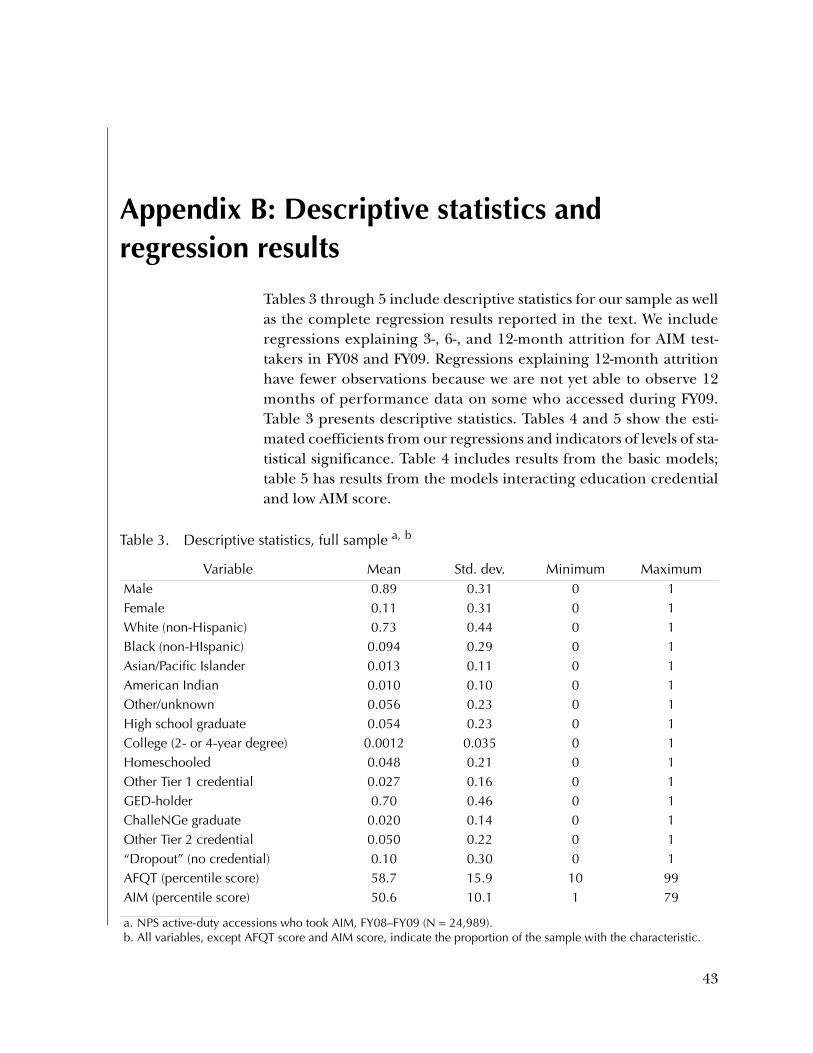
Tables 3 through 5 include descriptive statistics for our sample as wellas the complete regression results reported in the text. We includeregressions explaining 3-, 6-, and 12-month attrition for AIM test-takers in FY08 and FY09. Regressions explaining 12-month attritionhave fewer observations because we are not yet able to observe 12months of performance data on some who accessed during FY09.Table 3 presents descriptive statistics. Tables 4 and 5 show the esti-mated coefficients from our regressions and indicators of levels of sta-tistical significance. Table 4 includes results from the basic models;table 5 has results from the models interacting education credentialand low AIM score.
Table 3. Descriptive statistics, full sample a, b
a. NPS active-duty accessions who took AIM, FY08–FY09 (N = 24,989).b. All variables, except AFQT score and AIM score, indicate the proportion of the sample with the characteristic.
Variable Mean Std. dev. Minimum MaximumMale 0.89 0.31 0 1Female 0.11 0.31 0 1White (non-Hispanic) 0.73 0.44 0 1Black (non-HIspanic) 0.094 0.29 0 1Asian/Pacific Islander 0.013 0.11 0 1American Indian 0.010 0.10 0 1Other/unknown 0.056 0.23 0 1High school graduate 0.054 0.23 0 1College (2- or 4-year degree) 0.0012 0.035 0 1Homeschooled 0.048 0.21 0 1Other Tier 1 credential 0.027 0.16 0 1GED-holder 0.70 0.46 0 1ChalleNGe graduate 0.020 0.14 0 1Other Tier 2 credential 0.050 0.22 0 1“Dropout” (no credential) 0.10 0.30 0 1AFQT (percentile score) 58.7 15.9 10 99AIM (percentile score) 50.6 10.1 1 79
43
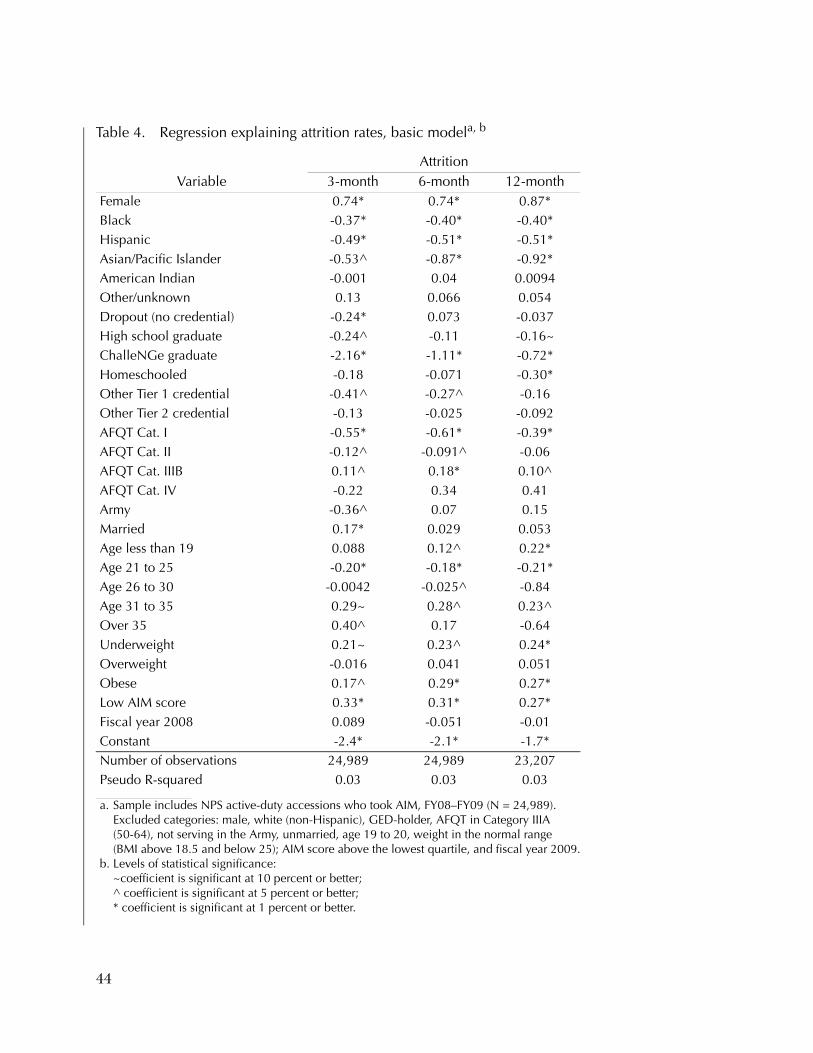
Table 4. Regression explaining attrition rates, basic modela, b
AttritionVariable 3-month 6-month 12-month
Female 0.74* 0.74* 0.87*Black -0.37* -0.40* -0.40*Hispanic -0.49* -0.51* -0.51*Asian/Pacific Islander -0.53^ -0.87* -0.92*American Indian -0.001 0.04 0.0094Other/unknown 0.13 0.066 0.054Dropout (no credential) -0.24* 0.073 -0.037High school graduate -0.24^ -0.11 -0.16~ChalleNGe graduate -2.16* -1.11* -0.72*Homeschooled -0.18 -0.071 -0.30*Other Tier 1 credential -0.41^ -0.27^ -0.16Other Tier 2 credential -0.13 -0.025 -0.092AFQT Cat. I -0.55* -0.61* -0.39*AFQT Cat. II -0.12^ -0.091^ -0.06AFQT Cat. IIIB 0.11^ 0.18* 0.10^AFQT Cat. IV -0.22 0.34 0.41Army -0.36^ 0.07 0.15Married 0.17* 0.029 0.053Age less than 19 0.088 0.12^ 0.22*Age 21 to 25 -0.20* -0.18* -0.21*Age 26 to 30 -0.0042 -0.025^ -0.84Age 31 to 35 0.29~ 0.28^ 0.23^Over 35 0.40^ 0.17 -0.64Underweight 0.21~ 0.23^ 0.24*Overweight -0.016 0.041 0.051Obese 0.17^ 0.29* 0.27*Low AIM score 0.33* 0.31* 0.27*Fiscal year 2008 0.089 -0.051 -0.01Constant -2.4* -2.1* -1.7*Number of observations 24,989 24,989 23,207Pseudo R-squared 0.03 0.03 0.03
a. Sample includes NPS active-duty accessions who took AIM, FY08–FY09 (N = 24,989). Excluded categories: male, white (non-Hispanic), GED-holder, AFQT in Category IIIA (50-64), not serving in the Army, unmarried, age 19 to 20, weight in the normal range (BMI above 18.5 and below 25); AIM score above the lowest quartile, and fiscal year 2009.
b. Levels of statistical significance: ~coefficient is significant at 10 percent or better; ^ coefficient is significant at 5 percent or better; * coefficient is significant at 1 percent or better.
44
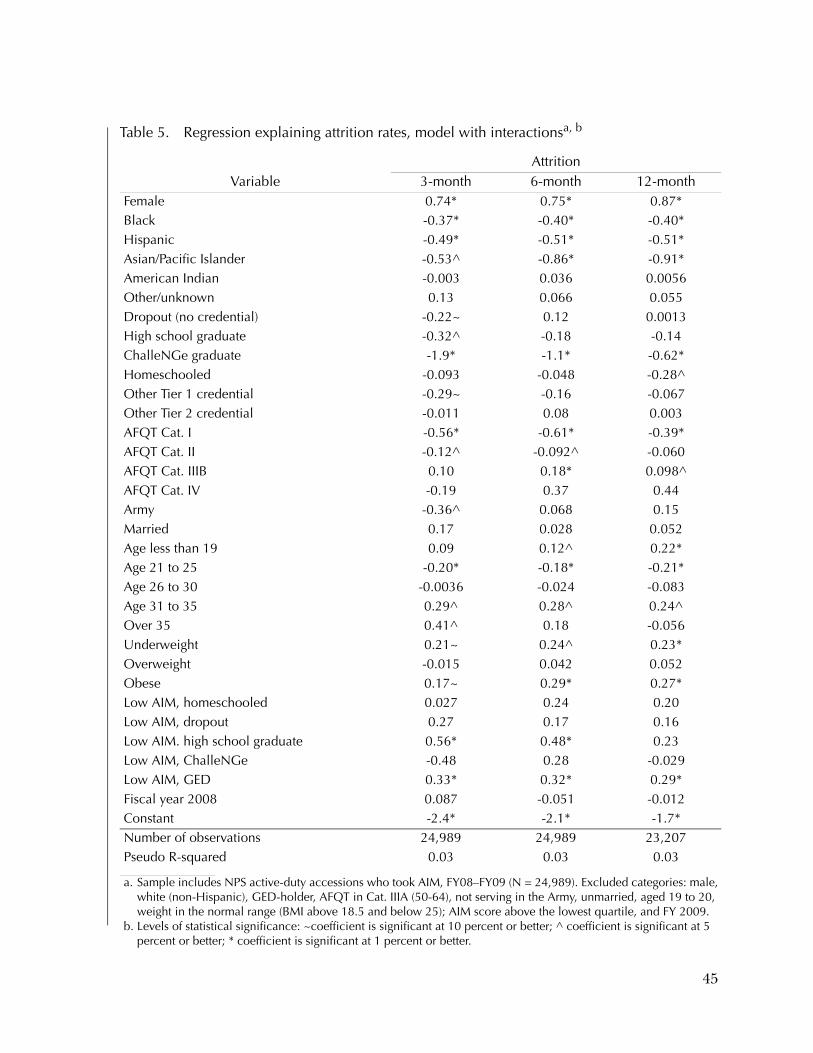
Table 5. Regression explaining attrition rates, model with interactionsa, b
AttritionVariable 3-month 6-month 12-month
Female 0.74* 0.75* 0.87*Black -0.37* -0.40* -0.40*Hispanic -0.49* -0.51* -0.51*Asian/Pacific Islander -0.53^ -0.86* -0.91*American Indian -0.003 0.036 0.0056Other/unknown 0.13 0.066 0.055Dropout (no credential) -0.22~ 0.12 0.0013High school graduate -0.32^ -0.18 -0.14ChalleNGe graduate -1.9* -1.1* -0.62*Homeschooled -0.093 -0.048 -0.28^Other Tier 1 credential -0.29~ -0.16 -0.067Other Tier 2 credential -0.011 0.08 0.003AFQT Cat. I -0.56* -0.61* -0.39*AFQT Cat. II -0.12^ -0.092^ -0.060AFQT Cat. IIIB 0.10 0.18* 0.098^AFQT Cat. IV -0.19 0.37 0.44Army -0.36^ 0.068 0.15Married 0.17 0.028 0.052Age less than 19 0.09 0.12^ 0.22*Age 21 to 25 -0.20* -0.18* -0.21*Age 26 to 30 -0.0036 -0.024 -0.083Age 31 to 35 0.29^ 0.28^ 0.24^Over 35 0.41^ 0.18 -0.056Underweight 0.21~ 0.24^ 0.23*Overweight -0.015 0.042 0.052Obese 0.17~ 0.29* 0.27*Low AIM, homeschooled 0.027 0.24 0.20Low AIM, dropout 0.27 0.17 0.16Low AIM. high school graduate 0.56* 0.48* 0.23Low AIM, ChalleNGe -0.48 0.28 -0.029Low AIM, GED 0.33* 0.32* 0.29*Fiscal year 2008 0.087 -0.051 -0.012Constant -2.4* -2.1* -1.7*Number of observations 24,989 24,989 23,207Pseudo R-squared 0.03 0.03 0.03
a. Sample includes NPS active-duty accessions who took AIM, FY08–FY09 (N = 24,989). Excluded categories: male, white (non-Hispanic), GED-holder, AFQT in Cat. IIIA (50-64), not serving in the Army, unmarried, aged 19 to 20, weight in the normal range (BMI above 18.5 and below 25); AIM score above the lowest quartile, and FY 2009.
b. Levels of statistical significance: ~coefficient is significant at 10 percent or better; ^ coefficient is significant at 5 percent or better; * coefficient is significant at 1 percent or better.
45

This page intentionally left blank.
46
References
[1] Janice Laurence, Jennifer Naughton, and Dickie Harris. Attri-tion Revisited: Identifying the Problem and Its Solutions, 1996(United States Army Research Institute for the Behavioraland Social Sciences, ARI Research Note 96-20)
[2] Federico Garcia et al. Evaluation of the Pilot Program for HomeSchool and ChalleNGe Program Recruits, 2004 (CNA ResearchMemorandum D0004598.A4)
[3] Janice Laurence. Education Standards for Military Enlistment andthe Search for Successful Recruits, 1984 (Human ResourcesResearch Organization Final Report 84-4, FR-PRD-84-4)
[4] J. Toomepuu. Soldier Capability—Army Combat Effectiveness(SCACE), Vol. I: Main Report, Apr 1981 (Fort Benjamin Harri-son, IN, U.S. Army Soldier Support Center, ACN64024; citedin Laurence (1984))
[5] James Heckman and Yona Rubinstein. “The Importance ofNoncognitive Skills: Lessons From the GED Testing Pro-gram.” American Economic Review 91(2), 2001: 145–149
[6] Samuel Bowles, Herbert Gintis, and Melissa Osborne. “TheDeterminants of Earnings: A Behavioral Approach.” Journal ofEconomic Literature 39(4), 2001: 1131–1176
[7] James Heckman, Jora Stixrud, and Sergio Uruza. “The Effectsof Cognitive and Noncognitive Abilities on Labor MarketOutcomes and Social Behavior,” 2006 (NBER Working Paper12006)
[8] Leonard White and Mark Young. “Validation of a Faking-Resistant Measure of Temperament Constructs,” 2001 (paper
47
presented at the annual meeting of the Society for Industrial/Organizational Psychology, San Diego, CA)
[9] Mark Young et al. “Army Pre-Implementation Research Find-ings on the Assessment of Individual Motivation (AIM),” 2000(paper presented at the annual meeting of the American Psy-chological Association, Washington, DC)
[10] Arwen Hunter, Leonard White, and Mark Young. “PredictingFirst-Term Enlisted Attrition: The Tier Two Attrition Screen,”2008 (paper presented at meetings of the American Psycho-logical Association, Boston, MA)
[11] Leonard White et al. “Development of a Non-High SchoolDiploma Graduate Pre-Enlistment Screening Model ToEnhance the Future Force,” 2004 (paper presented at the24th Army Science Conference, Orlando, FL, 29 Nov through2 Dec 2004)
[12] Mark Young and Leonard White. “Preliminary OperationalFindings From the Army’s Tier Two Attrition Screen (TTAS)Measure,” 2006 (paper prepared for the 25th Army ScienceConference in Orlando, FL, 27–30 Nov 2006)
[13] Leonard White, Arwen Hunter, and Mark Young. “U.S.Army’s Tier Two Attrition Screen,” 2007 (paper presented atthe 115th annual meeting of the American Psychological Asso-ciation, San Francisco, CA)
[14] Jennie Wenger and Apriel Hodari. Final Analysis of Evaluationof Homeschool and ChalleNGe Program Recruits, Jan 2004 (CNAResearch Memorandum D0009351.A2)
[15] Eric Isenberg. “What Have We Learned About Homeschool-ing?” Peabody Journal of Education 82(2-3), 2007: 387–409
[16] S. Bielick, C. Chapman, and D. Princiotta. “1.1 Million Home-schooled Students in the United States 2003,” Jul 2004 (IssueBrief, U.S. Department of Education, Institute of EducationSciences, NCES 2004-15)
48

[17] Jennie Wenger and Cathleen McHugh. Attrition Rates and Per-formance of ChalleNGe Participants Over Time, Apr 2006 (CNAResearch Memorandum D0013758.A2)
[18] John Tyler. “The Economic Benefits of the GED: LessonsFrom Recent Research,” 2002 (Brown University and NBERworking paper)
[19] David Boesel, Nabeel Alsalam, and Thomas Smith. Educa-tional and Labor Market Performance of GED Recipients, 1998(Washington, DC: Office of Educational Research andImprovement, U.S. Department of Education, NationalLibrary of Education Research Synthesis, Publication NLE-98-2023)
[20] Stephen Cameron and James Heckman. “The Nonequiva-lence of High School Equivalents.” Journal of Labor Economics11(1), Jan 1993: 1–47
[21] James Heckman and Paul LaFontaine. The American HighSchool Graduation Rate: Trends and Levels, 2007 (IZA DiscussionPaper No. 3216)
[22] Jennie Wenger and Diana Lien. Does Education Reform MakeRecruiting More Difficult? Dec 2005 (CNA Research Memoran-dum D0013184.A1)
[23] National Center for Education Statistics. Digest of EducationStatistics 2007 (Washington, DC: U.S. Department of Educa-tion, NCES Publication 2008-022)
[24] Tonia Heffner and Leonard White. “Screening for Attritionand Performance with Non-Cognitive Measures,” 2010(paper presented to the Center for Naval Analyses, 25 May2010)
[25] U.S. Department of Education. Number and Types of Public Ele-mentary and Secondary Schools from the Common Core of Data:School Year 2005-06, 2007 (National Center for Education Sta-tistics Publication 2007-34)
49

[26] Center for Education Reform, “National Charter School andEnrollment Statistics 2009” (available at http://www.edre-form.com/_upload/CER_charter_numbers.pdf)
[27] Brian Ray. “Research Facts on Homeschooling,” 2009 (http://www.nheri.org/Research-Facts-on-Homeschooling.html)
[28] Brian Ray. Worldwide Guide to Homeschooling: Facts and Stats onthe Benefits of Homeschooling, 2005–2006 (National Home Edu-cation Research Institute)
[29] S. Bielick, K. Chandler, and S. P. Broughman. “Homeschool-ing in the United States: 1999,” 2001 (Washington, DC: U.S.Department of Education, National Center for Education Sta-tistics Publication NCES 2001-033)
[30] Patricia Lines. Homeschooling, 2001 (U.S. Department of Edu-cation, EDO-EA-01-08, ERIC Digest Number 151)
50
List of figures
Figure 1. Levels of homeschooling regulation vary across states . . . . . . . . . . . . . . . . . . . . . . 8
Figure 2. Distribution of states and school-aged children, by level of homeschool regulation . . . . . . . . . . 9
Figure 3. Distribution of U.S. K–12 students, by type of school . . . . . . . . . . . . . . . . . . . . . . . . 10
Figure 4. Distribution of education credentials . . . . . . . . 17
Figure 5. Distribution of AIM scores, active-duty accessions, FY08–FY09. . . . . . . . . . . . . . . . . 18
Figure 6. Distribution of AIM scores, men versus women . . . 19
Figure 7. Distribution of AIM score by race/ethnicity . . . . . 20
Figure 8. Distribution of AIM scores, by AFQT category. . . . 20
Figure 9. Distribution of AIM scores, by education credential . . . . . . . . . . . . . . . . . . . . . . . 21
Figure 10. First-term attrition rates, by AIM score . . . . . . . . 24
Figure 11. Six-month attrition rates by AIM score and personal characteristics . . . . . . . . . . . . . . . . 24
Figure 12. Six-month attrition rates by AIM score and AFQT score . . . . . . . . . . . . . . . . . . . . . . 25
Figure 13. AIM scores and 6-month attrition rates, by education credentials . . . . . . . . . . . . . . . . . 26
Figure 14. Marginal effects from regressions explaining early-term attrition of AIM test-takers . . . . . . . . 29
51

This page intentionally left blank.
52
List of tables
Table 1. Descriptive statistics by AIM score . . . . . . . . . . 22
Table 2. Percentage of sample that would be ineligible because of low AIM scores . . . . . . . . . . . . . . 34
Table 3. Descriptive statistics, full sample , . . . . . . . . . . 43
Table 4. Regression explaining attrition rates, basic model, . . . . . . . . . . . . . . . . . . . . . . 44
Table 5. Regression explaining attrition rates, model with interactions, . . . . . . . . . . . . . . . 45
53

This page intentionally left blank.
54


4825 Mark Center Drive, Alexandria, VA 22311-1850 703-824-2000 www.cna.org
CRM D0023223.A2/Final