Embed Size (px)
Citation preview
A M B E A A B ( P U B L ) O R G . N R . 5 5 6 4 6 8 - 4 3 5 4 | Q 4 I N T E R I M A N D Y E A R - E N D R E P O R T 2 0 1 7 1
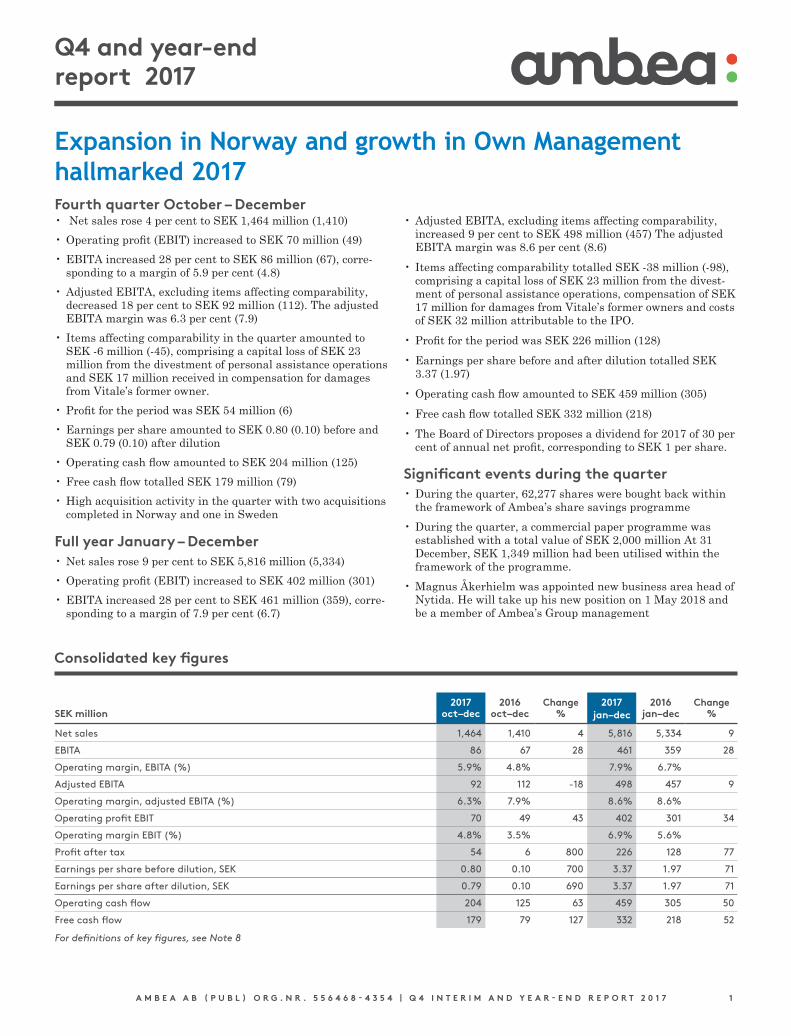
Fourth quarter October – December• Net sales rose 4 per cent to SEK 1,464 million (1,410) • Operating profit (EBIT) increased to SEK 70 million (49)• EBITA increased 28 per cent to SEK 86 million (67), corre
sponding to a margin of 5.9 per cent (4.8)• Adjusted EBITA, excluding items affecting comparability,
decreased 18 per cent to SEK 92 million (112). The adjusted EBITA margin was 6.3 per cent (7.9)
• Items affecting comparability in the quarter amounted to SEK 6 million (45), comprising a capital loss of SEK 23 million from the divestment of personal assistance operations and SEK 17 million received in compensation for damages from Vitale’s former owner.
• Profit for the period was SEK 54 million (6)• Earnings per share amounted to SEK 0.80 (0.10) before and
SEK 0.79 (0.10) after dilution • Operating cash flow amounted to SEK 204 million (125)• Free cash flow totalled SEK 179 million (79)• High acquisition activity in the quarter with two acquisitions
completed in Norway and one in Sweden
Full year January – December • Net sales rose 9 per cent to SEK 5,816 million (5,334) • Operating profit (EBIT) increased to SEK 402 million (301)• EBITA increased 28 per cent to SEK 461 million (359), corre
sponding to a margin of 7.9 per cent (6.7)
• Adjusted EBITA, excluding items affecting comparability, increased 9 per cent to SEK 498 million (457) The adjusted EBITA margin was 8.6 per cent (8.6)
• Items affecting comparability totalled SEK 38 million (98), comprising a capital loss of SEK 23 million from the divestment of personal assistance operations, compensation of SEK 17 million for damages from Vitale’s former owners and costs of SEK 32 million attributable to the IPO.
• Profit for the period was SEK 226 million (128)• Earnings per share before and after dilution totalled SEK
3.37 (1.97) • Operating cash flow amounted to SEK 459 million (305)• Free cash flow totalled SEK 332 million (218)• The Board of Directors proposes a dividend for 2017 of 30 per
cent of annual net profit, corresponding to SEK 1 per share.
Significant events during the quarter• During the quarter, 62,277 shares were bought back within
the framework of Ambea’s share savings programme • During the quarter, a commercial paper programme was
established with a total value of SEK 2,000 million At 31 December, SEK 1,349 million had been utilised within the framework of the programme.
• Magnus Åkerhielm was appointed new business area head of Nytida. He will take up his new position on 1 May 2018 and be a member of Ambea’s Group management
Expansion in Norway and growth in Own Management hallmarked 2017
Q4 and year-end report 2017
Consolidated key figures
2017 2016 Change 2017 2016 ChangeSEK million oct–dec oct–dec % jan–dec jan–dec %
Net sales 1,464 1,410 4 5,816 5,334 9
EBITA 86 67 28 461 359 28
Operating margin, EBITA (%) 5.9% 4.8% 7.9% 6.7%
Adjusted EBITA 92 112 -18 498 457 9
Operating margin, adjusted EBITA (%) 6.3% 7.9% 8.6% 8.6%
Operating profit EBIT 70 49 43 402 301 34
Operating margin EBIT (%) 4.8% 3.5% 6.9% 5.6%
Profit after tax 54 6 800 226 128 77
Earnings per share before dilution, SEK 0.80 0.10 700 3.37 1.97 71
Earnings per share after dilution, SEK 0.79 0.10 690 3.37 1.97 71
Operating cash flow 204 125 63 459 305 50
Free cash flow 179 79 127 332 218 52
For definitions of key figures, see Note 8
A M B E A A B ( P U B L ) O R G . N R . 5 5 6 4 6 8 - 4 3 5 4 | Q 4 I N T E R I M A N D Y E A R - E N D R E P O R T 2 0 1 7 2
Q4 and year-end report 2017
Expansion in Norway and growth in Own Management hallmarked 2017During 2017, we increased our Own Management units through acquisitions and start-ups and expanded our operations in Norway, which generated favourable growth and profitability. We built up a strong Own Management pipeline ahead of the coming year, which will contribute to organic growth. Ambea’s focus on customer satisfaction and quality generated tangible results, in part through a number of quality awards.
Net sales rose in the fourth quarter to SEK 1,464 million (1,410). The share of net sales in Own Management was 65 per cent (60). Adjusted EBITA, excluding items affecting comparability, decreased 18 per cent to SEK 92 million (112).
Net sales in Own Management in the quarter were strong, as a result of acquisitions and startups. Large volumes in Contract Management operations were handed back during the year, which had a negative impact on sales in 2017, a trend that continued during the fourth quarter. Net sales in staffing solutions declined in the quarter due to a weaker trend in the RentADoctor service.
Our profit performance in 2017 was favourable, mainly as a result of our increased share of Own Management units. Operating profit declined in the fourth quarter compared to the same period a year ago, primarily due to the termination of a number of management contracts, and to startup and acquisitionrelated costs. The two biggest segments have improved profitability compared to the same quarter a year ago.
We maintained a favourable trend of acquisitions during the year, with a total of six completed acquisitions, including three in the fourth quarter. In early November, Ambea acquired the company BoA Mellanvård in Sweden, which operates HVB homes and supported living units in Stockholm for children and young people with psychosocial problems. We continued to grow in Norway through two new acquisitions Målrettet, and Tiltaksgruppa – the fourth and fifth acquisition since the Norwegian operations were established two years ago. Målrettet conducts operations focusing on psychosocial problems and disabled care. In addition to residential care, Tiltaksgruppa provides family support, temporary relief and learning support at school. Ambea’s personal assistance operations were divested at the end of the quarter.
We are continuing to build our platform for future organic growth and we had a total of 990 placements/beds under construction and signed leases at the end of December. During the year, we opened 54 beds in Vardaga, 42 beds and 99 placements in Nytida and 24 beds in Norway. During the fourth quarter, we opened five new units in Nytida – two LSS homes, one HVB home and two daycare units. We will also open our new elderly care residence in Tyresö during the forthcoming quarter.
Early in the year, we were forced to temporarily close 60 beds in supported living units pending permits from IVO, and we have now finally been granted thee permits. Since the permitgranting process took longer than expected, the closed units had a negative impact on profitability during the fourth quarter and for the full year. Work on staffing and filling these units has
now been initiated and is expected to take six months. Another challenge during the year was a declining tender market. Although a number of major tenders were on offer during the first half of 2017, we saw a weaker tender market in the second half of the year, which will affect our development in 2018.
Also in this quarter we have been acknowledged for our quality work. The fund company Indecap ranked Ambea as one of the stock exchange companies that offer the most equal opportunities. Ambea is also nominated for the Arla Golden Cow award in the category food enjoyment among seniors. The prize has been awarded for 18 years and highlights skilful work in the field of publicsector gastronomy. I would also like to point to the results of the National Board of Health and Welfare’s survey of residential care and daycare activities for adults in the field of LSS throughout Sweden. The survey included questions regarding implementation plans, methods for user influence, procedures and staff skills. We are proud of the results, with a high score for Nytida and an average score that significantly surpassed the scores of both municipalities and other private operators.
2017 was an eventful year. Ambea was listed on the stock exchange and we thus gained an opportunity to further illuminate how we add value for all of our stakeholders. By focusing on quality and the development of our business, and by opening new residential care facilities, we contribute to the provision of good care. We acquire companies and invest in new residential care units, and have built a strong platform for continued expansion in Sweden and Norway.
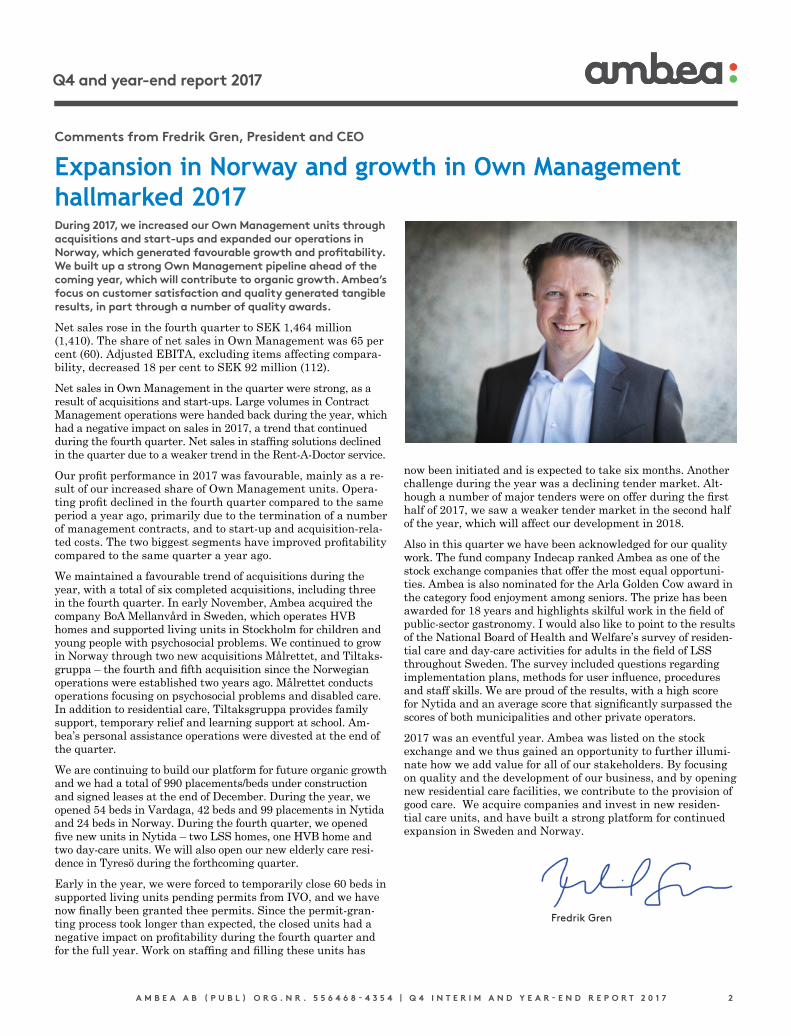
Comments from Fredrik Gren, President and CEO
Fredrik Gren
A M B E A A B ( P U B L ) O R G . N R . 5 5 6 4 6 8 - 4 3 5 4 | Q 4 I N T E R I M A N D Y E A R - E N D R E P O R T 2 0 1 7 3
Q4 and year-end report 2017
Group
Fourth quarter Net salesNet sales rose 4 per cent to SEK 1,464 million (1,410).
Net sales in Own Management amounted to SEK 973 million (859), up 13 per cent compared with the yearearlier period, due to acquisitions and startup units.
Net sales in Contract Management amounted to SEK 412 million (465). The decrease in sales compared with the yearearlier period was due to the fact that contracts won did not offset contracts terminated.
Net sales in Staffing rose 7 per cent to SEK 79 million (85).
Earnings EBIT rose 43 per cent to SEK 70 million (49), corresponding to a margin of 4.8 per cent (3.5).
EBITA rose 28 per cent to SEK 86 million (67). The EBITA margin was 5.9 per cent (4.8). EBITA for the quarter was impacted by items affecting comparability of SEK 6 million (45), attributable to a capital loss of SEK 23 million from the divestment of personal assistance operations and compensation of SEK 17 million for damages from Vitale’s former owners.
Adjusted EBITA for the quarter decreased 18 per cent to SEK 92 million (112). Acquired companies and startup units had a positive impact on earnings. The development of Management Contracts and higher startup and acquisitionrelated costs had a negative impact. The adjusted EBITA margin was 6.3 per cent (7.9).
Net financial itemsNet financial items for the quarter amounted to SEK 11 million (38). The change was due to improved terms on the refinancing completed in the second quarter of this year.
Income tax Tax expense for the period amounted to SEK 6 million (5), corresponding to a tax rate of 9 per cent (44). The lower tax rate in 2017 is due to taxexempt income of SEK 35 million from property sales, damages of SEK 17 million received in Norway and nondeductible expenses of SEK 23 million for the sale of personal assistance.
Profit for the period Net profit for the period amounted to SEK 54 million (6), corresponding to earnings per share of SEK 0.80 (0.10) before dilution and SEK 0.79 (0.10) after dilution.
A M B E A A B ( P U B L ) O R G . N R . 5 5 6 4 6 8 - 4 3 5 4 | Q 4 I N T E R I M A N D Y E A R - E N D R E P O R T 2 0 1 7 4
Q4 and year-end report 2017
Distribution of net sales
Vardaga NytidaOther: Norway and Staffing solutions
Unallocated items Group
2017 2016 Change 2017 2016 Change 2017 2016 Change 2017 2016 2017 2016 ChangeSEK million oct–dec oct–dec % oct–dec oct–dec % oct–dec oct–dec % oct–dec oct–dec oct–dec oct–dec %
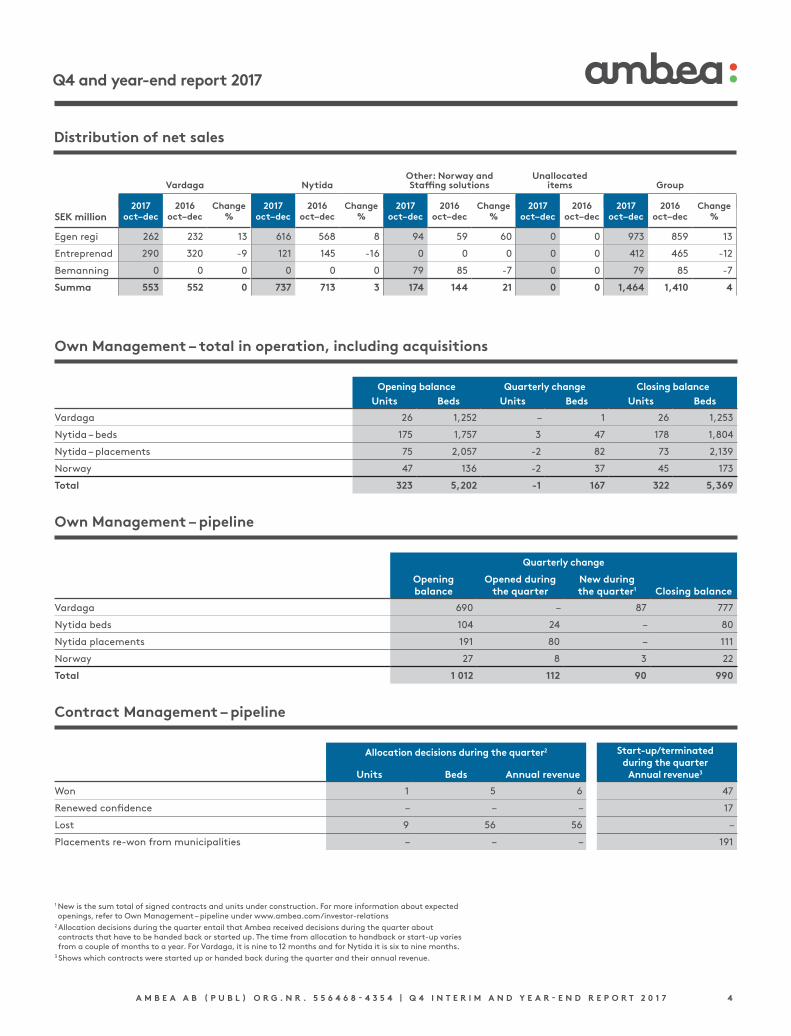
Egen regi 262 232 13 616 568 8 94 59 60 0 0 973 859 13
Entreprenad 290 320 -9 121 145 -16 0 0 0 0 0 412 465 -12
Bemanning 0 0 0 0 0 0 79 85 -7 0 0 79 85 -7
Summa 553 552 0 737 713 3 174 144 21 0 0 1,464 1,410 4
Opening balance Quarterly change Closing balanceUnits Beds Units Beds Units Beds
Vardaga 26 1,252 – 1 26 1,253
Nytida – beds 175 1,757 3 47 178 1,804
Nytida – placements 75 2,057 -2 82 73 2,139
Norway 47 136 -2 37 45 173
Total 323 5,202 -1 167 322 5,369
Own Management – total in operation, including acquisitions
1 New is the sum total of signed contracts and units under construction. For more information about expected openings, refer to Own Management – pipeline under www.ambea.com/investor-relations
2 Allocation decisions during the quarter entail that Ambea received decisions during the quarter about contracts that have to be handed back or started up. The time from allocation to handback or start-up varies from a couple of months to a year. For Vardaga, it is nine to 12 months and for Nytida it is six to nine months.
3 Shows which contracts were started up or handed back during the quarter and their annual revenue.
Quarterly change
Opening balance
Opened during the quarter
New during the quarter1 Closing balance
Vardaga 690 – 87 777
Nytida beds 104 24 – 80
Nytida placements 191 80 – 111
Norway 27 8 3 22
Total 1 012 112 90 990
Own Management – pipeline
Allocation decisions during the quarter2 Start-up/terminated during the quarter
Annual revenue3 Units Beds Annual revenue
Won 1 5 6 47
Renewed confidence – – – 17
Lost 9 56 56 –
Placements re-won from municipalities – – – 191
Contract Management – pipeline
A M B E A A B ( P U B L ) O R G . N R . 5 5 6 4 6 8 - 4 3 5 4 | Q 4 I N T E R I M A N D Y E A R - E N D R E P O R T 2 0 1 7 5
Q4 and year-end report 2017
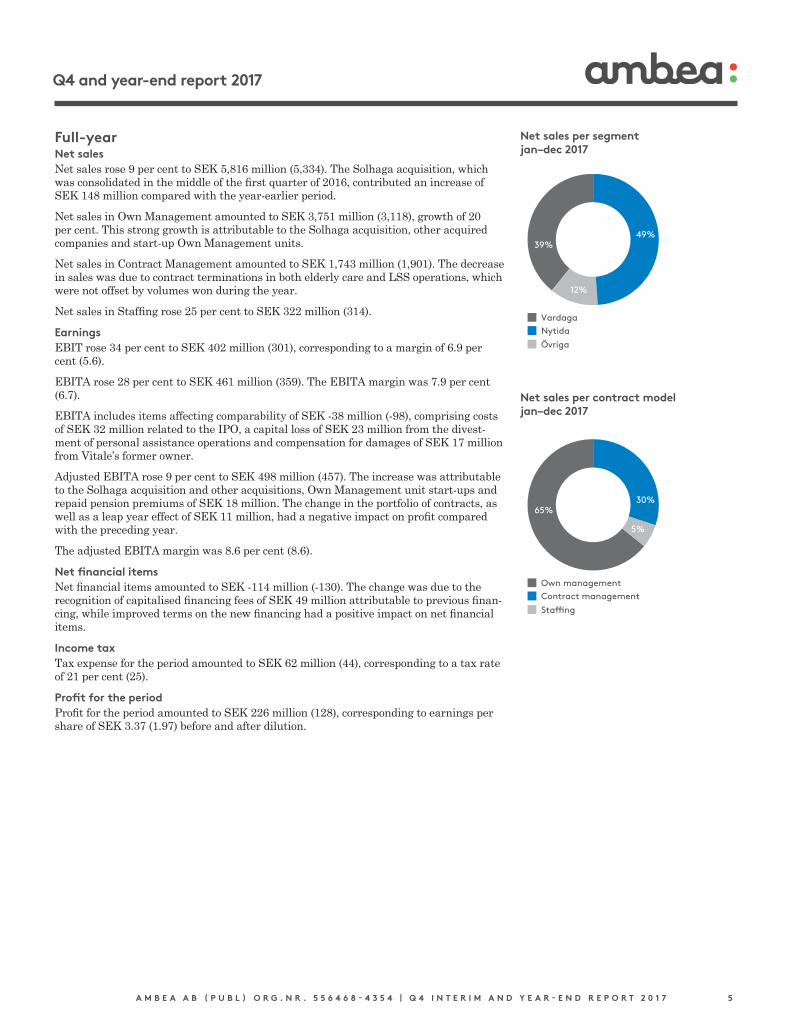
Full-year Net salesNet sales rose 9 per cent to SEK 5,816 million (5,334). The Solhaga acquisition, which was consolidated in the middle of the first quarter of 2016, contributed an increase of SEK 148 million compared with the yearearlier period.
Net sales in Own Management amounted to SEK 3,751 million (3,118), growth of 20 per cent. This strong growth is attributable to the Solhaga acquisition, other acquired companies and startup Own Management units.
Net sales in Contract Management amounted to SEK 1,743 million (1,901). The decrease in sales was due to contract terminations in both elderly care and LSS operations, which were not offset by volumes won during the year.
Net sales in Staffing rose 25 per cent to SEK 322 million (314).
Earnings EBIT rose 34 per cent to SEK 402 million (301), corresponding to a margin of 6.9 per cent (5.6).
EBITA rose 28 per cent to SEK 461 million (359). The EBITA margin was 7.9 per cent (6.7).
EBITA includes items affecting comparability of SEK 38 million (98), comprising costs of SEK 32 million related to the IPO, a capital loss of SEK 23 million from the divestment of personal assistance operations and compensation for damages of SEK 17 million from Vitale’s former owner.
Adjusted EBITA rose 9 per cent to SEK 498 million (457). The increase was attributable to the Solhaga acquisition and other acquisitions, Own Management unit startups and repaid pension premiums of SEK 18 million. The change in the portfolio of contracts, as well as a leap year effect of SEK 11 million, had a negative impact on profit compared with the preceding year.
The adjusted EBITA margin was 8.6 per cent (8.6).
Net financial itemsNet financial items amounted to SEK 114 million (130). The change was due to the recognition of capitalised financing fees of SEK 49 million attributable to previous financing, while improved terms on the new financing had a positive impact on net financial items.
Income tax Tax expense for the period amounted to SEK 62 million (44), corresponding to a tax rate of 21 per cent (25).
Profit for the period Profit for the period amounted to SEK 226 million (128), corresponding to earnings per share of SEK 3.37 (1.97) before and after dilution.
Net sales per segmentjan–dec 2017
Net sales per contract modeljan–dec 2017
49%39%
12%
VardagaNytida
Övriga
30%65%
5%
Own managementContract management
Sta�ng
A M B E A A B ( P U B L ) O R G . N R . 5 5 6 4 6 8 - 4 3 5 4 | Q 4 I N T E R I M A N D Y E A R - E N D R E P O R T 2 0 1 7 6
Q4 and year-end report 2017
Distribution of net sales
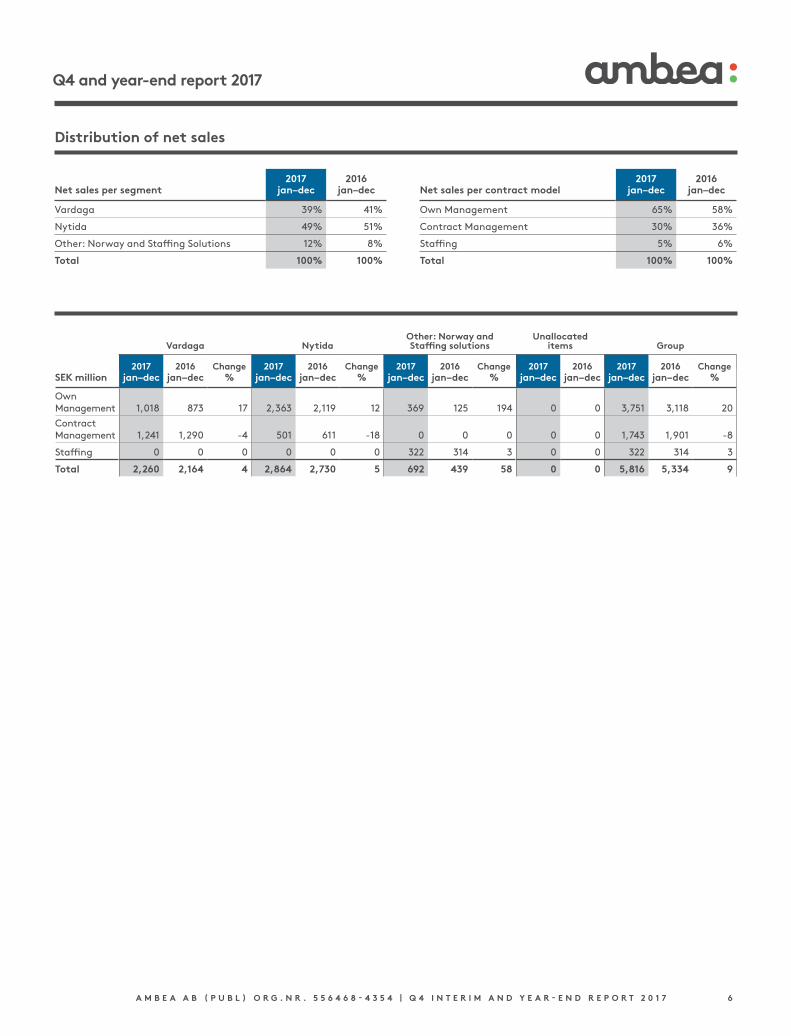
2017 2016Net sales per segment jan–dec jan–dec
Vardaga 39% 41%
Nytida 49% 51%
Other: Norway and Staffing Solutions 12% 8%
Total 100% 100%
2017 2016Net sales per contract model jan–dec jan–dec
Own Management 65% 58%
Contract Management 30% 36%
Staffing 5% 6%
Total 100% 100%
Vardaga NytidaOther: Norway and Staffing solutions
Unallocated items Group
2017 2016 Change 2017 2016 Change 2017 2016 Change 2017 2016 2017 2016 ChangeSEK million jan–dec jan–dec % jan–dec jan–dec % jan–dec jan–dec % jan–dec jan–dec jan–dec jan–dec %
Own Management 1,018 873 17 2,363 2,119 12 369 125 194 0 0 3,751 3,118 20
Contract Management 1,241 1,290 -4 501 611 -18 0 0 0 0 0 1,743 1,901 -8
Staffing 0 0 0 0 0 0 322 314 3 0 0 322 314 3
Total 2,260 2,164 4 2,864 2,730 5 692 439 58 0 0 5,816 5,334 9
A M B E A A B ( P U B L ) O R G . N R . 5 5 6 4 6 8 - 4 3 5 4 | Q 4 I N T E R I M A N D Y E A R - E N D R E P O R T 2 0 1 7 7
Q4 and year-end report 2017
2017 2016 2017 2016SEK million oct–dec oct–dec jan–dec jan–dec
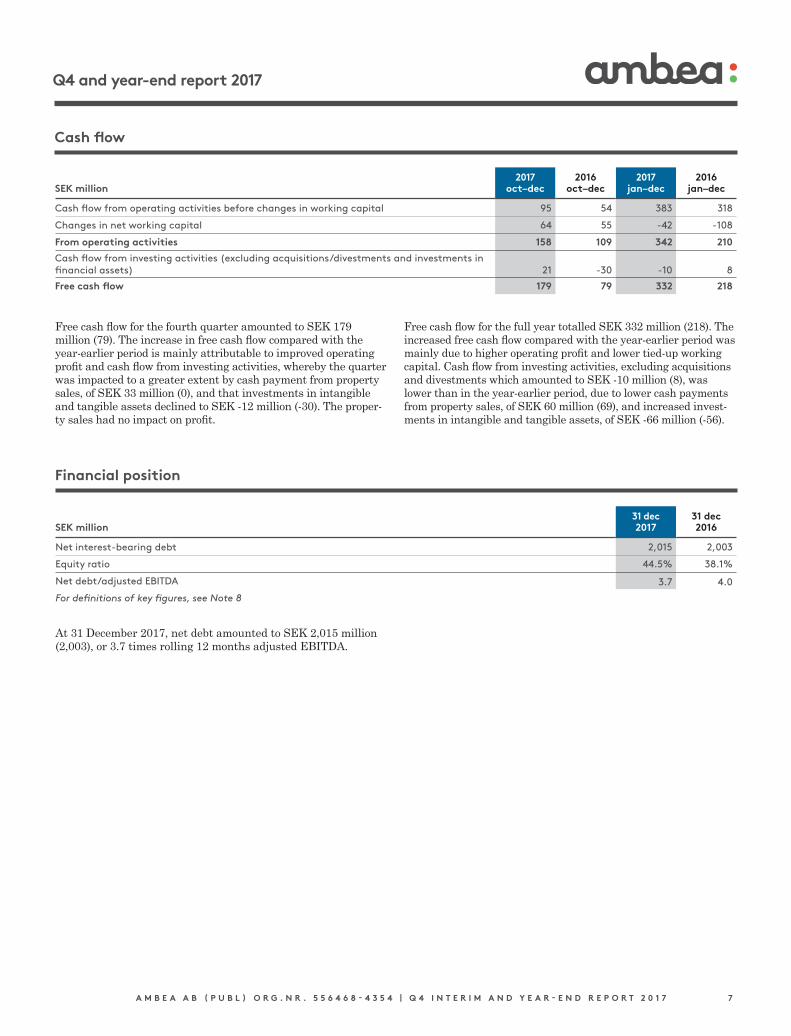
Cash flow from operating activities before changes in working capital 95 54 383 318
Changes in net working capital 64 55 -42 -108
From operating activities 158 109 342 210
Cash flow from investing activities (excluding acquisitions/divestments and investments in financial assets) 21 -30 -10 8
Free cash flow 179 79 332 218
Free cash flow for the fourth quarter amounted to SEK 179 million (79). The increase in free cash flow compared with the yearearlier period is mainly attributable to improved operating profit and cash flow from investing activities, whereby the quarter was impacted to a greater extent by cash payment from property sales, of SEK 33 million (0), and that investments in intangible and tangible assets declined to SEK 12 million (30). The property sales had no impact on profit.
Free cash flow for the full year totalled SEK 332 million (218). The increased free cash flow compared with the yearearlier period was mainly due to higher operating profit and lower tiedup working capital. Cash flow from investing activities, excluding acquisitions and divestments which amounted to SEK 10 million (8), was lower than in the yearearlier period, due to lower cash payments from property sales, of SEK 60 million (69), and increased investments in intangible and tangible assets, of SEK 66 million (56).
31 dec 31 decSEK million 2017 2016
Net interest-bearing debt 2,015 2,003
Equity ratio 44.5% 38.1%
Net debt/adjusted EBITDA 3.7 4.0
For definitions of key figures, see Note 8
At 31 December 2017, net debt amounted to SEK 2,015 million (2,003), or 3.7 times rolling 12 months adjusted EBITDA.
Cash flow
Financial position
A M B E A A B ( P U B L ) O R G . N R . 5 5 6 4 6 8 - 4 3 5 4 | Q 4 I N T E R I M A N D Y E A R - E N D R E P O R T 2 0 1 7 8
Q4 and year-end report 2017
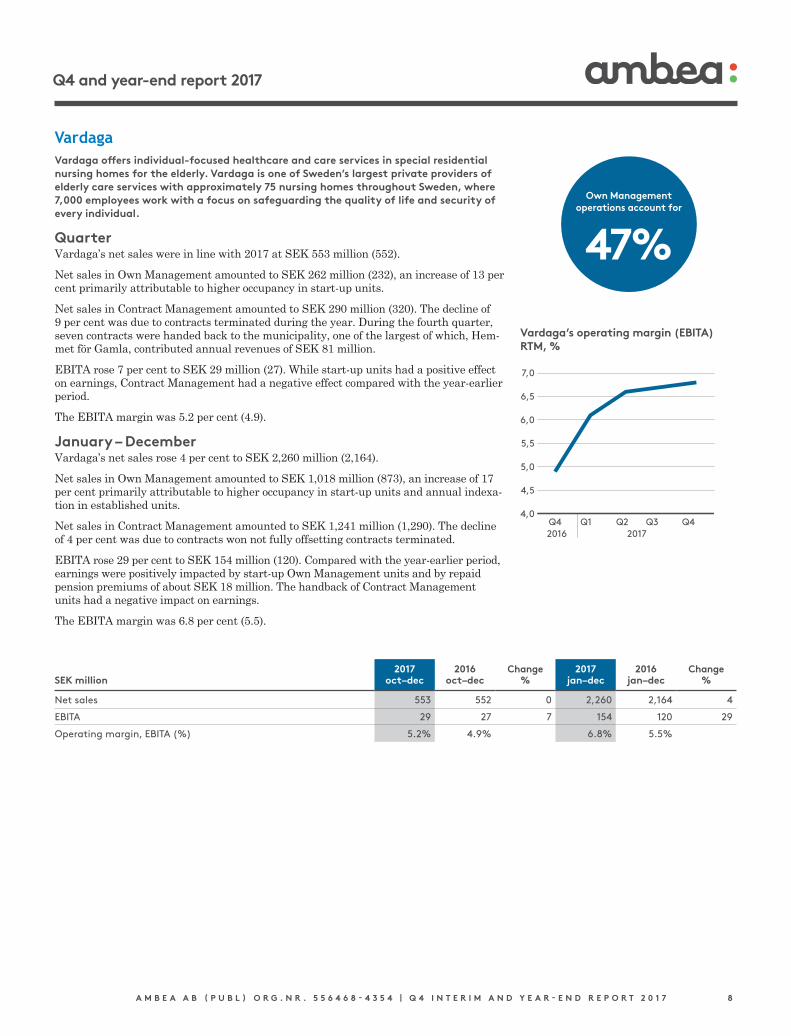
VardagaVardaga offers individual-focused healthcare and care services in special residential nursing homes for the elderly. Vardaga is one of Sweden’s largest private providers of elderly care services with approximately 75 nursing homes throughout Sweden, where 7,000 employees work with a focus on safeguarding the quality of life and security of every individual.
Quarter Vardaga’s net sales were in line with 2017 at SEK 553 million (552).
Net sales in Own Management amounted to SEK 262 million (232), an increase of 13 per cent primarily attributable to higher occupancy in startup units.
Net sales in Contract Management amounted to SEK 290 million (320). The decline of 9 per cent was due to contracts terminated during the year. During the fourth quarter, seven contracts were handed back to the municipality, one of the largest of which, Hemmet för Gamla, contributed annual revenues of SEK 81 million.
EBITA rose 7 per cent to SEK 29 million (27). While startup units had a positive effect on earnings, Contract Management had a negative effect compared with the yearearlier period.
The EBITA margin was 5.2 per cent (4.9).
January – DecemberVardaga’s net sales rose 4 per cent to SEK 2,260 million (2,164).
Net sales in Own Management amounted to SEK 1,018 million (873), an increase of 17 per cent primarily attributable to higher occupancy in startup units and annual indexation in established units.
Net sales in Contract Management amounted to SEK 1,241 million (1,290). The decline of 4 per cent was due to contracts won not fully offsetting contracts terminated.
EBITA rose 29 per cent to SEK 154 million (120). Compared with the yearearlier period, earnings were positively impacted by startup Own Management units and by repaid pension premiums of about SEK 18 million. The handback of Contract Management units had a negative impact on earnings.
The EBITA margin was 6.8 per cent (5.5).
4,0
4,5
5,0
5,5
6,0
6,5
7,0
Q4 Q1 Q2 Q3 Q42016 2017
Vardaga’s operating margin (EBITA) RTM, %
2017 2016 Change 2017 2016 ChangeSEK million oct–dec oct–dec % jan–dec jan–dec %
Net sales 553 552 0 2,260 2,164 4
EBITA 29 27 7 154 120 29
Operating margin, EBITA (%) 5.2% 4.9% 6.8% 5.5%
Own Management operations account for
47%
A M B E A A B ( P U B L ) O R G . N R . 5 5 6 4 6 8 - 4 3 5 4 | Q 4 I N T E R I M A N D Y E A R - E N D R E P O R T 2 0 1 7 9
Q4 and year-end report 2017
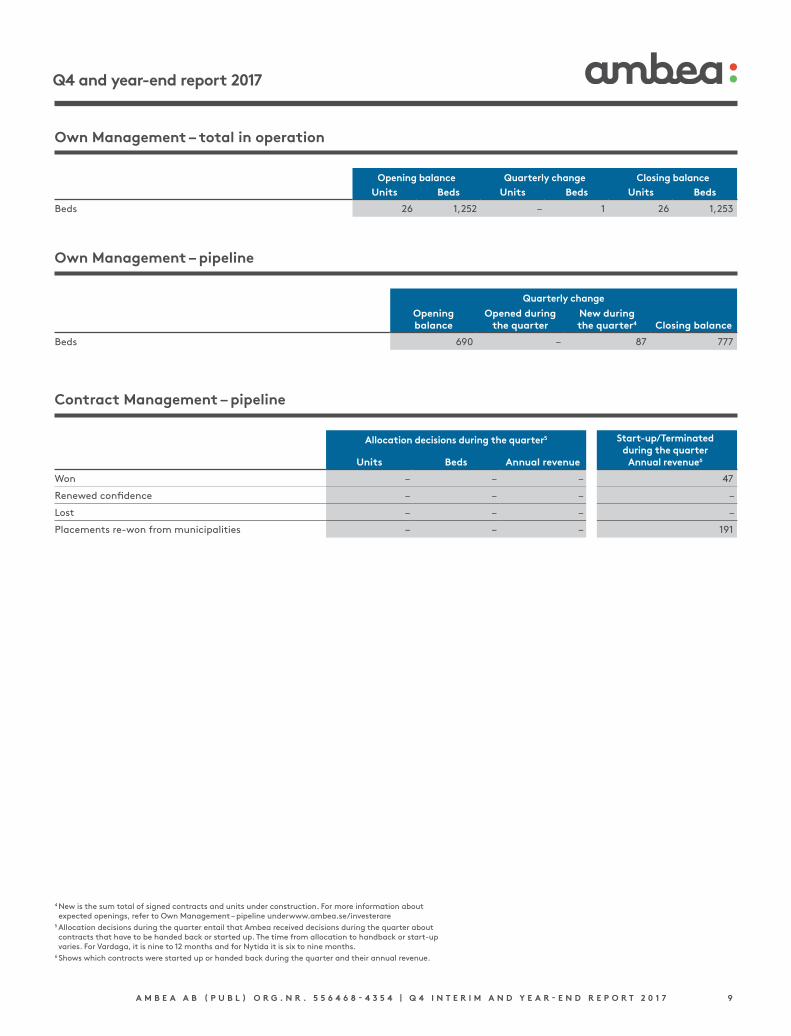
Opening balance Quarterly change Closing balanceUnits Beds Units Beds Units Beds
Beds 26 1,252 – 1 26 1,253
Own Management – total in operation
Quarterly changeOpening balance
Opened during the quarter
New during the quarter4 Closing balance
Beds 690 – 87 777
Own Management – pipeline
Allocation decisions during the quarter5 Start-up/Terminated during the quarter
Annual revenue6Units Beds Annual revenue
Won – – – 47
Renewed confidence – – – –
Lost – – – –
Placements re-won from municipalities – – – 191
Contract Management – pipeline
4 New is the sum total of signed contracts and units under construction. For more information about expected openings, refer to Own Management – pipeline underwww.ambea.se/investerare
5 Allocation decisions during the quarter entail that Ambea received decisions during the quarter about contracts that have to be handed back or started up. The time from allocation to handback or start-up varies. For Vardaga, it is nine to 12 months and for Nytida it is six to nine months.
6 Shows which contracts were started up or handed back during the quarter and their annual revenue.
A M B E A A B ( P U B L ) O R G . N R . 5 5 6 4 6 8 - 4 3 5 4 | Q 4 I N T E R I M A N D Y E A R - E N D R E P O R T 2 0 1 7 1 0
Q4 and year-end report 2017
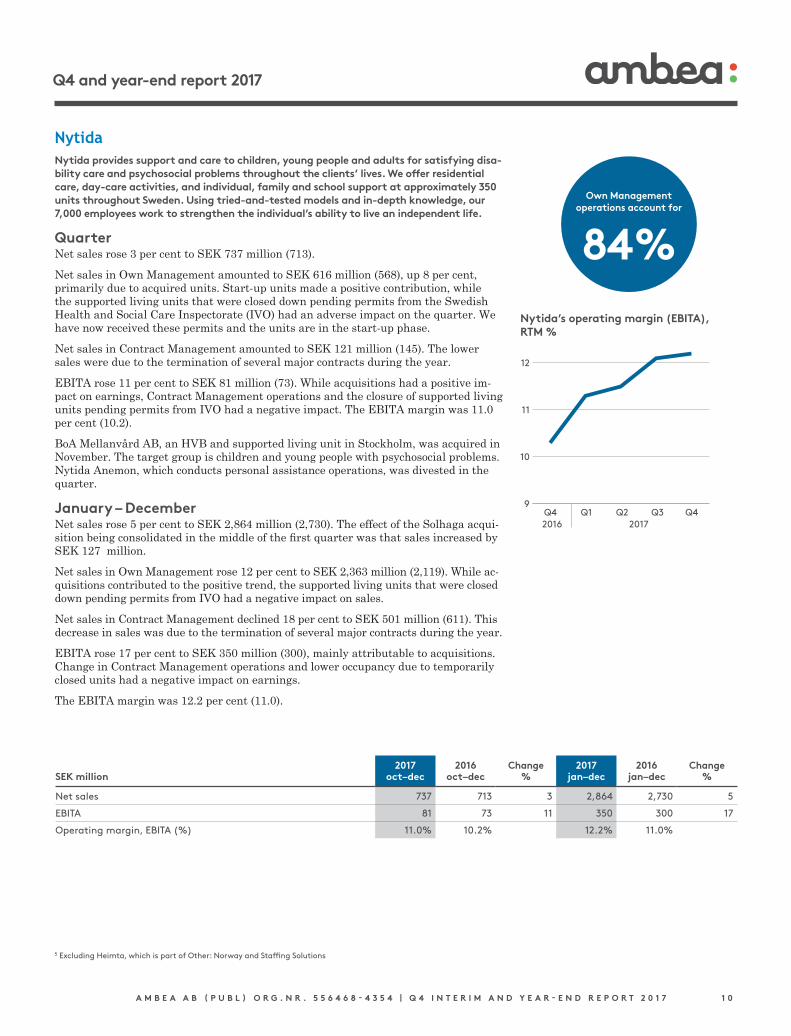
NytidaNytida provides support and care to children, young people and adults for satisfying disa-bility care and psychosocial problems throughout the clients’ lives. We offer residential care, day-care activities, and individual, family and school support at approximately 350 units throughout Sweden. Using tried-and-tested models and in-depth knowledge, our 7,000 employees work to strengthen the individual’s ability to live an independent life.
QuarterNet sales rose 3 per cent to SEK 737 million (713).
Net sales in Own Management amounted to SEK 616 million (568), up 8 per cent, primarily due to acquired units. Startup units made a positive contribution, while the supported living units that were closed down pending permits from the Swedish Health and Social Care Inspectorate (IVO) had an adverse impact on the quarter. We have now received these permits and the units are in the startup phase.
Net sales in Contract Management amounted to SEK 121 million (145). The lower sales were due to the termination of several major contracts during the year.
EBITA rose 11 per cent to SEK 81 million (73). While acquisitions had a positive impact on earnings, Contract Management operations and the closure of supported living units pending permits from IVO had a negative impact. The EBITA margin was 11.0 per cent (10.2).
BoA Mellanvård AB, an HVB and supported living unit in Stockholm, was acquired in November. The target group is children and young people with psychosocial problems. Nytida Anemon, which conducts personal assistance operations, was divested in the quarter.
January – DecemberNet sales rose 5 per cent to SEK 2,864 million (2,730). The effect of the Solhaga acquisition being consolidated in the middle of the first quarter was that sales increased by SEK 127 million.
Net sales in Own Management rose 12 per cent to SEK 2,363 million (2,119). While acquisitions contributed to the positive trend, the supported living units that were closed down pending permits from IVO had a negative impact on sales.
Net sales in Contract Management declined 18 per cent to SEK 501 million (611). This decrease in sales was due to the termination of several major contracts during the year.
EBITA rose 17 per cent to SEK 350 million (300), mainly attributable to acquisitions. Change in Contract Management operations and lower occupancy due to temporarily closed units had a negative impact on earnings.
The EBITA margin was 12.2 per cent (11.0).
9
10
11
12
Q4 Q1 Q2 Q3 Q42016 2017
5 Excluding Heimta, which is part of Other: Norway and Staffing Solutions
2017 2016 Change 2017 2016 ChangeSEK million oct–dec oct–dec % jan–dec jan–dec %
Net sales 737 713 3 2,864 2,730 5
EBITA 81 73 11 350 300 17
Operating margin, EBITA (%) 11.0% 10.2% 12.2% 11.0%
Own Management operations account for
84%Nytida’s operating margin (EBITA), RTM %
A M B E A A B ( P U B L ) O R G . N R . 5 5 6 4 6 8 - 4 3 5 4 | Q 4 I N T E R I M A N D Y E A R - E N D R E P O R T 2 0 1 7 1 1
Q4 and year-end report 2017
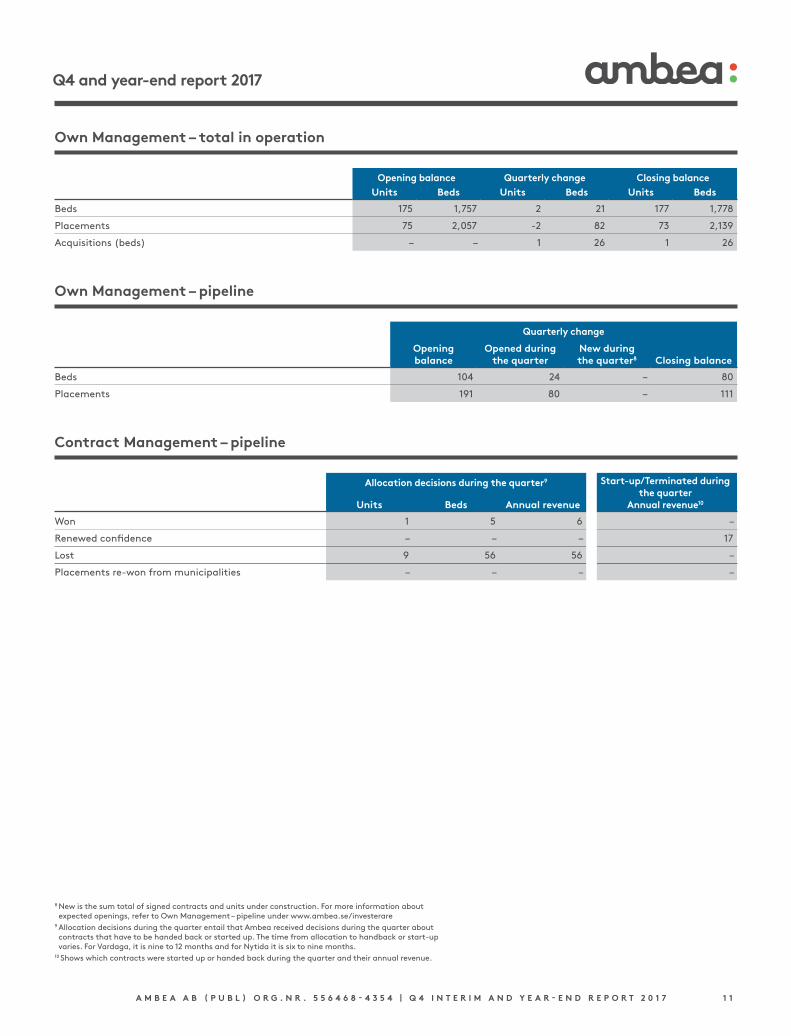
Opening balance Quarterly change Closing balanceUnits Beds Units Beds Units Beds
Beds 175 1,757 2 21 177 1,778
Placements 75 2,057 -2 82 73 2,139
Acquisitions (beds) – – 1 26 1 26
Own Management – total in operation
Quarterly change
Opening balance
Opened during the quarter
New during the quarter8 Closing balance
Beds 104 24 – 80
Placements 191 80 – 111
Own Management – pipeline
Allocation decisions during the quarter9 Start-up/Terminated during the quarter
Annual revenue10Units Beds Annual revenue
Won 1 5 6 –
Renewed confidence – – – 17
Lost 9 56 56 –
Placements re-won from municipalities – – – –
Contract Management – pipeline
8 New is the sum total of signed contracts and units under construction. For more information about expected openings, refer to Own Management – pipeline under www.ambea.se/investerare
9 Allocation decisions during the quarter entail that Ambea received decisions during the quarter about contracts that have to be handed back or started up. The time from allocation to handback or start-up varies. For Vardaga, it is nine to 12 months and for Nytida it is six to nine months.
10 Shows which contracts were started up or handed back during the quarter and their annual revenue.
A M B E A A B ( P U B L ) O R G . N R . 5 5 6 4 6 8 - 4 3 5 4 | Q 4 I N T E R I M A N D Y E A R - E N D R E P O R T 2 0 1 7 1 2
Q4 and year-end report 2017
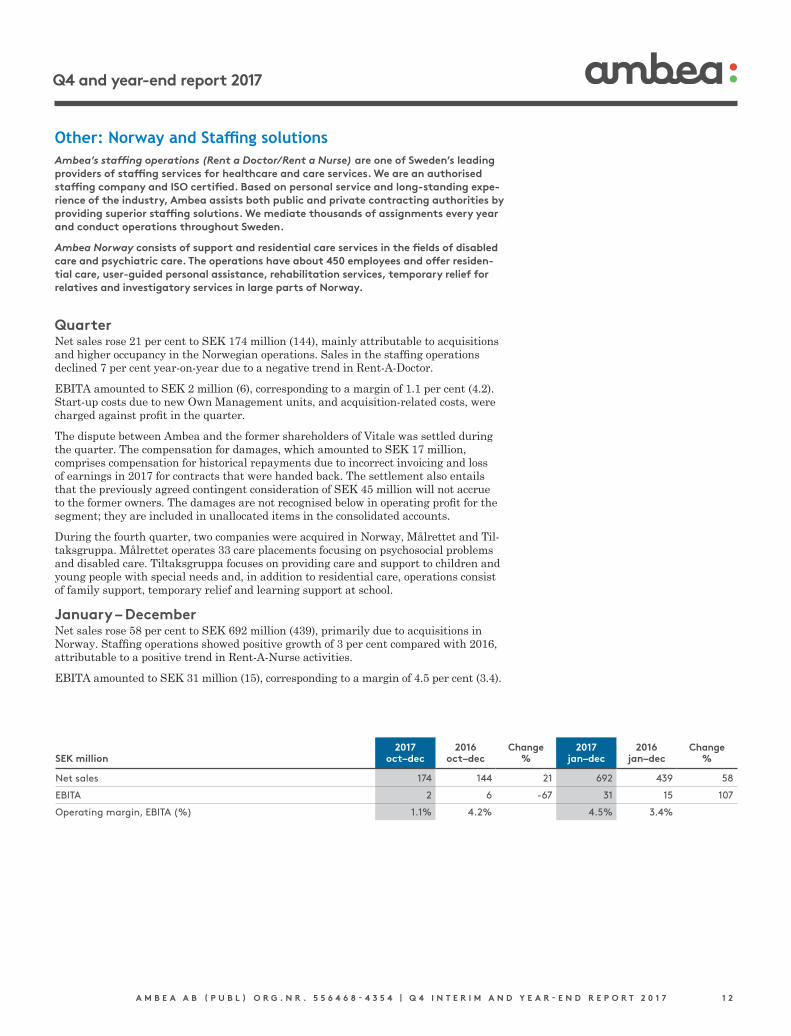
Other: Norway and Staffing solutionsAmbea’s staffing operations (Rent a Doctor/Rent a Nurse) are one of Sweden’s leading providers of staffing services for healthcare and care services. We are an authorised staffing company and ISO certified. Based on personal service and long-standing expe-rience of the industry, Ambea assists both public and private contracting authorities by providing superior staffing solutions. We mediate thousands of assignments every year and conduct operations throughout Sweden.
Ambea Norway consists of support and residential care services in the fields of disabled care and psychiatric care. The operations have about 450 employees and offer residen-tial care, user-guided personal assistance, rehabilitation services, temporary relief for relatives and investigatory services in large parts of Norway.
QuarterNet sales rose 21 per cent to SEK 174 million (144), mainly attributable to acquisitions and higher occupancy in the Norwegian operations. Sales in the staffing operations declined 7 per cent yearonyear due to a negative trend in RentADoctor.
EBITA amounted to SEK 2 million (6), corresponding to a margin of 1.1 per cent (4.2). Startup costs due to new Own Management units, and acquisitionrelated costs, were charged against profit in the quarter.
The dispute between Ambea and the former shareholders of Vitale was settled during the quarter. The compensation for damages, which amounted to SEK 17 million, comprises compensation for historical repayments due to incorrect invoicing and loss of earnings in 2017 for contracts that were handed back. The settlement also entails that the previously agreed contingent consideration of SEK 45 million will not accrue to the former owners. The damages are not recognised below in operating profit for the segment; they are included in unallocated items in the consolidated accounts.
During the fourth quarter, two companies were acquired in Norway, Målrettet and Tiltaksgruppa. Målrettet operates 33 care placements focusing on psychosocial problems and disabled care. Tiltaksgruppa focuses on providing care and support to children and young people with special needs and, in addition to residential care, operations consist of family support, temporary relief and learning support at school.
January – DecemberNet sales rose 58 per cent to SEK 692 million (439), primarily due to acquisitions in Norway. Staffing operations showed positive growth of 3 per cent compared with 2016, attributable to a positive trend in RentANurse activities.
EBITA amounted to SEK 31 million (15), corresponding to a margin of 4.5 per cent (3.4).
2017 2016 Change 2017 2016 ChangeSEK million oct–dec oct–dec % jan–dec jan–dec %
Net sales 174 144 21 692 439 58
EBITA 2 6 -67 31 15 107
Operating margin, EBITA (%) 1.1% 4.2% 4.5% 3.4%
A M B E A A B ( P U B L ) O R G . N R . 5 5 6 4 6 8 - 4 3 5 4 | Q 4 I N T E R I M A N D Y E A R - E N D R E P O R T 2 0 1 7 1 3
Q4 and year-end report 2017
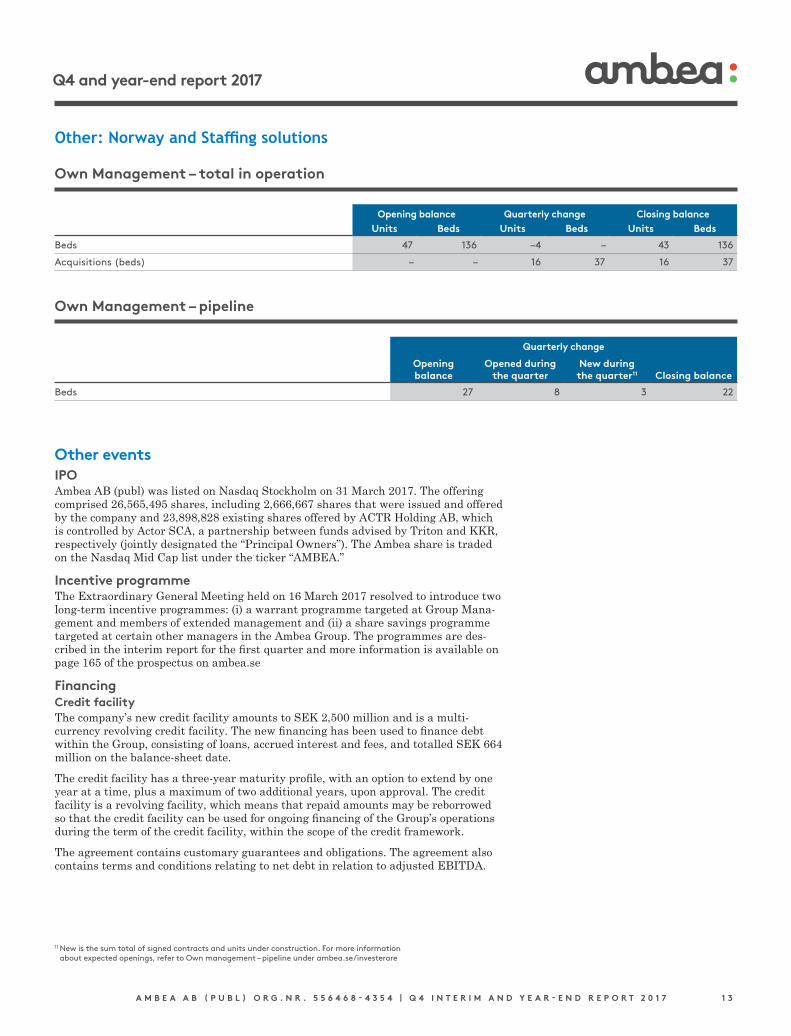
Other eventsIPO Ambea AB (publ) was listed on Nasdaq Stockholm on 31 March 2017. The offering comprised 26,565,495 shares, including 2,666,667 shares that were issued and offered by the company and 23,898,828 existing shares offered by ACTR Holding AB, which is controlled by Actor SCA, a partnership between funds advised by Triton and KKR, respectively (jointly designated the “Principal Owners”). The Ambea share is traded on the Nasdaq Mid Cap list under the ticker “AMBEA.”
Incentive programme The Extraordinary General Meeting held on 16 March 2017 resolved to introduce two longterm incentive programmes: (i) a warrant programme targeted at Group Management and members of extended management and (ii) a share savings programme targeted at certain other managers in the Ambea Group. The programmes are described in the interim report for the first quarter and more information is available on page 165 of the prospectus on ambea.se
Financing Credit facilityThe company’s new credit facility amounts to SEK 2,500 million and is a multicurrency revolving credit facility. The new financing has been used to finance debt within the Group, consisting of loans, accrued interest and fees, and totalled SEK 664 million on the balancesheet date.
The credit facility has a threeyear maturity profile, with an option to extend by one year at a time, plus a maximum of two additional years, upon approval. The credit facility is a revolving facility, which means that repaid amounts may be reborrowed so that the credit facility can be used for ongoing financing of the Group’s operations during the term of the credit facility, within the scope of the credit framework.
The agreement contains customary guarantees and obligations. The agreement also contains terms and conditions relating to net debt in relation to adjusted EBITDA.
Opening balance Quarterly change Closing balanceUnits Beds Units Beds Units Beds
Beds 47 136 –4 – 43 136
Acquisitions (beds) – – 16 37 16 37
Own Management – total in operation
Quarterly change
Opening balance
Opened during the quarter
New during the quarter11 Closing balance
Beds 27 8 3 22
Own Management – pipeline
11 New is the sum total of signed contracts and units under construction. For more information about expected openings, refer to Own management – pipeline under ambea.se/investerare
Other: Norway and Staffing solutions
A M B E A A B ( P U B L ) O R G . N R . 5 5 6 4 6 8 - 4 3 5 4 | Q 4 I N T E R I M A N D Y E A R - E N D R E P O R T 2 0 1 7 1 4
Q4 and year-end report 2017
Commercial paperAmbea has established a Swedish commercial paper programme with a limit of SEK 2,000 million, of which SEK 1,349 million was outstanding at 31 December. DNB is the arranger and issue institute and Danske Bank is an issue institute. The commercial paper programme is used to reduce the Group’s outstanding debt under its credit facility.
Shares and share capitalFollowing a resolution by the Extraordinary General Meeting on 16 March 2017, a new issue of 2,666,667 shares was implemented. The new issue contributed SEK 200 million before transaction expenses to Ambea. The new issue was registered on 4 April 2017 and increased the share capital by SEK 66,581.46, resulting in a dilution effect of 3.9 per cent. On the balancesheet date, equity amounted to SEK 2,480 million, compared with SEK 2,067 million on 31 December 2016.
With the authorisation of the 2017 Annual General Meeting, the Board of Directors has decided to buy back up to 62,277 shares (approximately SEK 4.7 million) up to the 2018 Annual General Meeting. The purchase of 62,277 shares was implemented during the month of November. The aim of the buyback is to save the shares for delivery under Ambea’s share savings programme.
Related party transactionsNo transactions took place during the quarter between Ambea and its related parties that had any material impact on the company’s position and earnings. The nature of transactions and volume remained unchanged during the quarter compared with the yearearlier period.
Events after the end of the quarterAfter the end of the quarter, the option to extend the credit facility was exercised.
SeasonalityAmbea’s results of operations are affected by seasonal variations, weekends and public holidays.
Weekends and public holidays reduce Ambea’s profitability due to higher personnel costs based on inconvenient working hours. The first or second quarter is affected by Easter, depending on which quarter the Easter holiday occurs, while the first and fourth quarter are affected by the Christmas and New Year’s holidays.
The company’s personnel costs are affected in a similar manner, depending on when individual employees take their holiday. For example, the company is most profitable in the third quarter, as employees typically take holiday leave during the months of July and August and therefore receive holiday pay that is accrued continuously throughout the year. Costs during summer months are also generally lower due to a reduced schedule of central activities, such as mandatory training programmes and central initiatives, over this period.
EmployeesThe average number of fulltime employees (FTEs) during the year was 8,445 (7,429), with the increase mainly due to acquisitions.
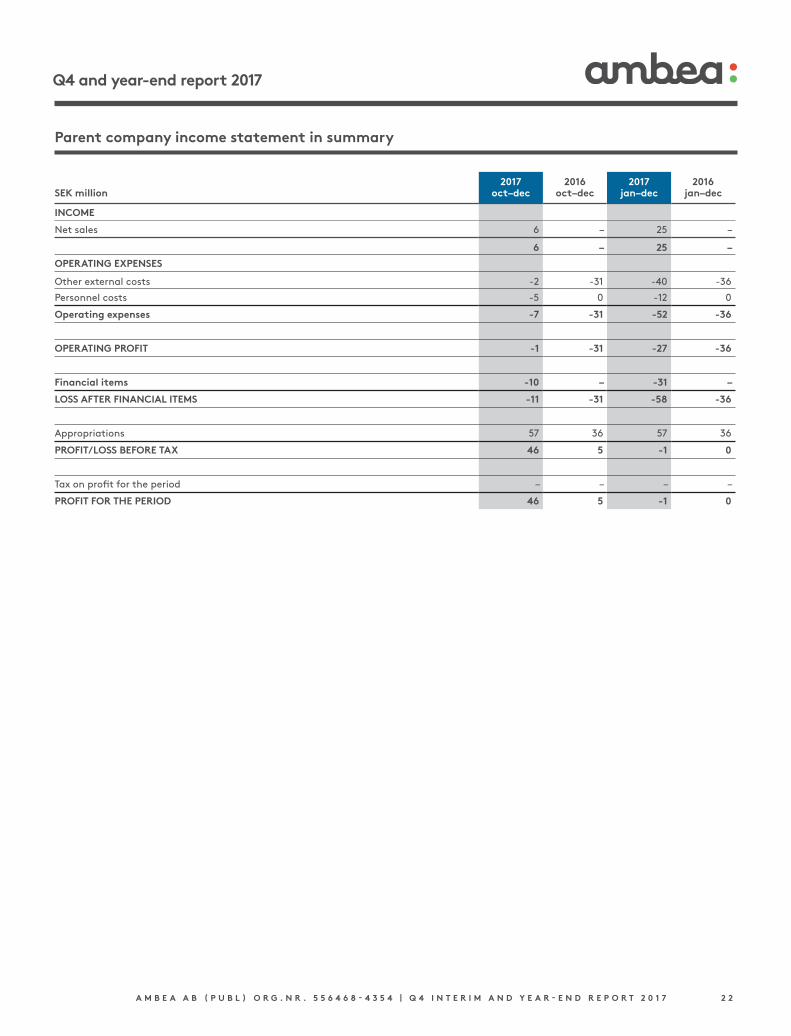
Parent companyThe Parent Company’s earnings pertain to Groupwide costs. During the quarter, the Parent Company’s net sales amounted to SEK 6 million (0). Earnings for the quarter amounted to SEK 46 million (5).
The main reason for the improved earnings was that the preceding year was charged with legal and consultancy fees connected to the IPO process, and that Group contributions increased during 2017 to SEK 57 million (36).
A M B E A A B ( P U B L ) O R G . N R . 5 5 6 4 6 8 - 4 3 5 4 | Q 4 I N T E R I M A N D Y E A R - E N D R E P O R T 2 0 1 7 1 5
Q4 and year-end report 2017
Risks and uncertaintiesAmbea’s operations and development are impacted by demographic, economic and political factors, as well as by the general development in the market for care services. Change Ambea works continuously on following up, analysing and taking actions to mitigate risks. Risk management is based on developed systems, division of responsibilities and procedures that are well secured in the organisation.
Demand for Ambea’s care services is impacted to a great extent by legislation and political decisions, since municipalities are customers and the procuring party. Accordingly, Ambea’s development depends on the orientation of the various municipalities in terms of the provision of healthcare and care services. Risks associated with freedom of choice can include Ambea being be unable to perform the specific service at the set price, or that not enough care recipients choose the company’s residential care units or locations. There is also a risk that during public procurement, the company will not have its existing contracts extended or will not win new contracts.
Restrictions in the possibility to provide private care services for profit and stricter rules and regulations as regards permits and supervision can lead to restrictions of Ambea’s business model. Ambea is thus affected by, and must comply with, changes and interpretations of new and current legislation, ordinances, regulations and practices. Infringements or shortcomings in the fulfilment of these could result in the company being subject to fees, fines, penalties or other sanctions. Such factors can also lead to adaptation actions and costs.
The quality of our operations is Ambea’s principal priority. In addition to rigorous and systematic internal followups of quality, comprehensive followups and quality checks are performed by authorities, and permits are required for conducting operations. Should the company be unable to fulfil the contractual requirements and quality standards, the company could become subject to penalties, damages, contractual penalties, or ultimately lose the customer contracts and/or permits which the company needs to conduct business. Since Ambea’s operations are also dependent on permits, the loss of, or delays in receiving, permits could adversely affect Ambea’s operations, earnings and financial position.
Ambea is also exposed to financial risks, whereby changes in the credit and capital market could affect Ambea’s financial position.
Risks associated with the performance of care services are managed by the management of the various companies at different levels, taking into account the procedures and governance principles applied in the Group. Followup of the operations occurs in part in cooperation with contracting authorities and customers and in part in the form of internal quality checks. The design of contracts has a material impact on the risks associated with individual assignments. Financial risks are managed by the finance department.
Other information The company’s auditors have not reviewed this report.
A M B E A A B ( P U B L ) O R G . N R . 5 5 6 4 6 8 - 4 3 5 4 | Q 4 I N T E R I M A N D Y E A R - E N D R E P O R T 2 0 1 7 1 6
Q4 and year-end report 2017
The Board of Directors’ assurance The Board of Directors and President hereby provide their assurance that this yearend report provides a true and fair overview of the operations, position and earnings of the Parent Company and the Group, and describes the material risks and uncertainties facing the Parent Company and the companies in the Group.
Stockholm, 20 February 2018
Lena Andersson Hofsberger Chairman of the Board
Daniel Björklund Anders Borg Thomas Hofvenstam
Ingrid Jonasson Blank Hans Fredrik Årstad Gunilla Rudebjer
Patricia Briceño Haralampos Kalpakas Magnus Sällström Employee representative Employee representative Employee representative
Fredrik Gren President and CEO
Presentation of fourth quarter of 2017Ambea will hold a presentation for the financial market, including the possibility to participate in a teleconference, at 10:00 a.m. CET on Wednesday 21 February 2018. The presentation will be held in English and will also be available as a webcast on www.ambea.se
Call-up informationTo make sure that the hookup to the conference call works, please call a few minutes before the conference call starts to register by stating the code “Ambea.”
Phone numbersSweden: +46 8 5033 6574United Kingdom: +44 330 336 9105USA: +1 323 794 2551
ContactLouise Tjeder, IR and Strategy Manager, telephone +46 (0)73 143 17 68
Calendar17 April The Annual Report will be published on the ambea.se website. The printed Annual Report will be available at Ambea’s Head Office as of 2 April 2018.
17 May Q1 interim report
23 May The Annual General Meeting will be held at 9:00 a.m. in Näringslivets Hus, Wallenbergaren, Storgatan 19, Stock-holm, Sweden. Shareholders who wish to have a matter addressed by the AGM must submit a written request to [email protected] or Ambea AB Attn: Louise Tjeder Box 1565 SE-171 29 Solna Sweden
The request must have reached the Board of Directors no later than 4 April 2018
21 August Q2 interim report
13 November Q3 interim report
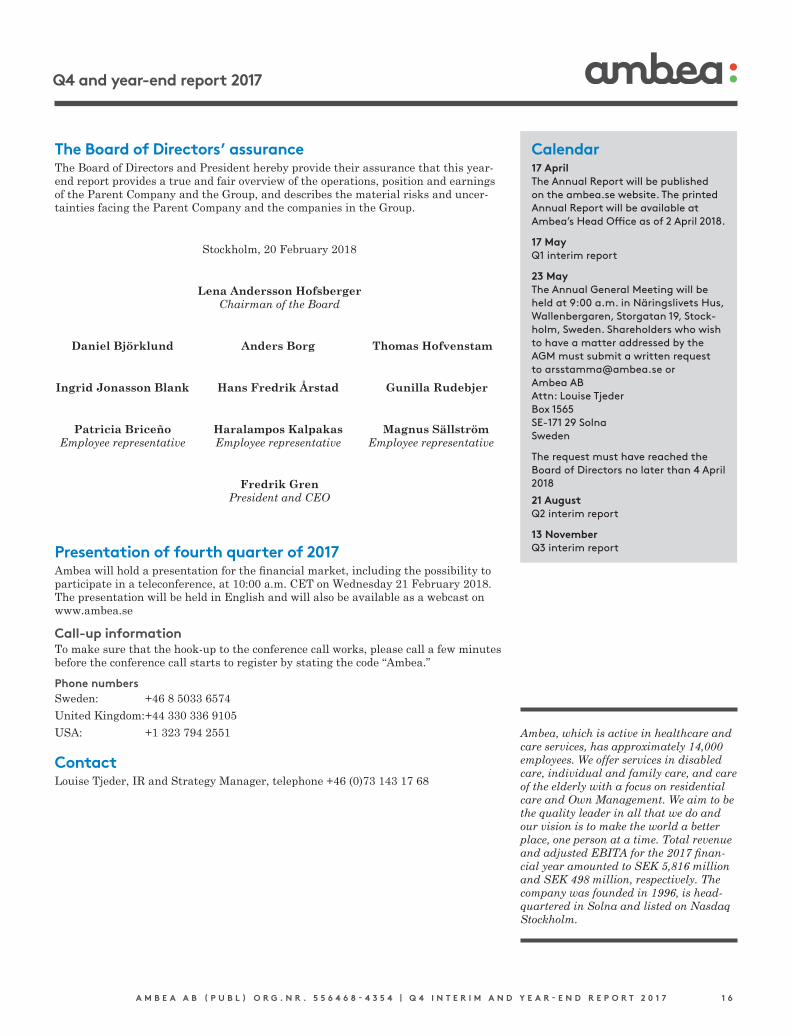
Ambea, which is active in healthcare and care services, has approximately 14,000 employees. We offer services in disabled care, individual and family care, and care of the elderly with a focus on residential care and Own Management. We aim to be the quality leader in all that we do and our vision is to make the world a better place, one person at a time. Total revenue and adjusted EBITA for the 2017 finan-cial year amounted to SEK 5,816 million and SEK 498 million, respectively. The company was founded in 1996, is head-quartered in Solna and listed on Nasdaq Stockholm.
A M B E A A B ( P U B L ) O R G . N R . 5 5 6 4 6 8 - 4 3 5 4 | Q 4 I N T E R I M A N D Y E A R - E N D R E P O R T 2 0 1 7 1 7
Q4 and year-end report 2017
Consolidated income statement in summary
2017 2016 2017 2016SEK million oct–dec oct–dec jan–dec jan–dec
OPERATING INCOME
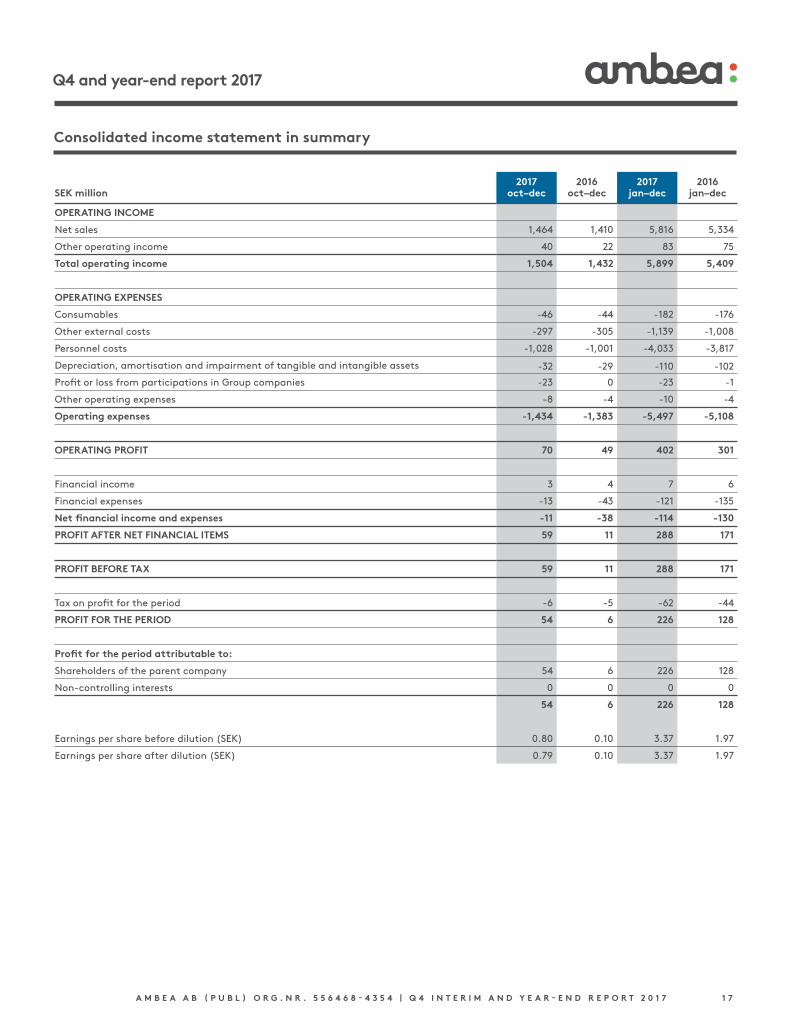
Net sales 1,464 1,410 5,816 5,334
Other operating income 40 22 83 75
Total operating income 1,504 1,432 5,899 5,409
OPERATING EXPENSES
Consumables -46 -44 -182 -176
Other external costs -297 -305 -1,139 -1,008
Personnel costs -1,028 -1,001 -4,033 -3,817
Depreciation, amortisation and impairment of tangible and intangible assets -32 -29 -110 -102
Profit or loss from participations in Group companies -23 0 -23 -1
Other operating expenses -8 -4 -10 -4
Operating expenses -1,434 -1,383 -5,497 -5,108
OPERATING PROFIT 70 49 402 301
Financial income 3 4 7 6
Financial expenses -13 -43 -121 -135
Net financial income and expenses -11 -38 -114 -130
PROFIT AFTER NET FINANCIAL ITEMS 59 11 288 171
PROFIT BEFORE TAX 59 11 288 171
Tax on profit for the period -6 -5 -62 -44
PROFIT FOR THE PERIOD 54 6 226 128
Profit for the period attributable to:
Shareholders of the parent company 54 6 226 128
Non-controlling interests 0 0 0 0
54 6 226 128
Earnings per share before dilution (SEK) 0.80 0.10 3.37 1.97
Earnings per share after dilution (SEK) 0.79 0.10 3.37 1.97
A M B E A A B ( P U B L ) O R G . N R . 5 5 6 4 6 8 - 4 3 5 4 | Q 4 I N T E R I M A N D Y E A R - E N D R E P O R T 2 0 1 7 1 8
Q4 and year-end report 2017
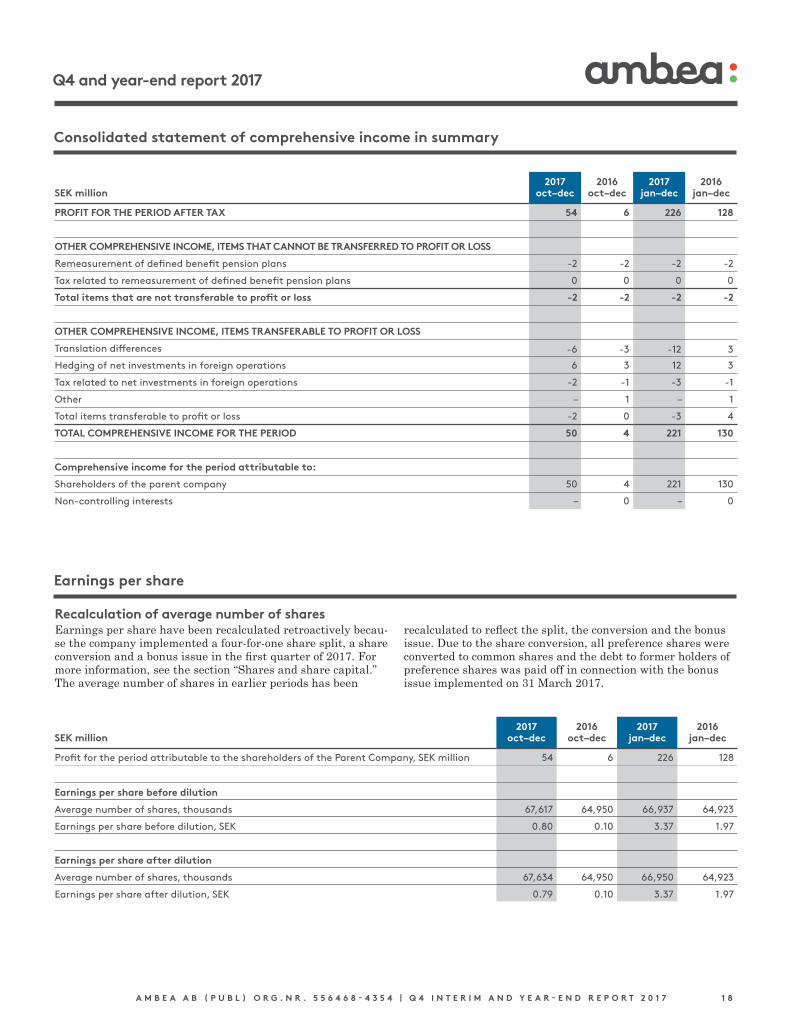
Consolidated statement of comprehensive income in summary
2017 2016 2017 2016SEK million oct–dec oct–dec jan–dec jan–dec
PROFIT FOR THE PERIOD AFTER TAX 54 6 226 128
OTHER COMPREHENSIVE INCOME, ITEMS THAT CANNOT BE TRANSFERRED TO PROFIT OR LOSS
Remeasurement of defined benefit pension plans -2 -2 -2 -2
Tax related to remeasurement of defined benefit pension plans 0 0 0 0
Total items that are not transferable to profit or loss -2 -2 -2 -2
OTHER COMPREHENSIVE INCOME, ITEMS TRANSFERABLE TO PROFIT OR LOSS
Translation differences -6 -3 -12 3
Hedging of net investments in foreign operations 6 3 12 3
Tax related to net investments in foreign operations -2 -1 -3 -1
Other – 1 – 1
Total items transferable to profit or loss -2 0 -3 4
TOTAL COMPREHENSIVE INCOME FOR THE PERIOD 50 4 221 130
Comprehensive income for the period attributable to:
Shareholders of the parent company 50 4 221 130
Non-controlling interests – 0 – 0
2017 2016 2017 2016SEK million oct–dec oct–dec jan–dec jan–dec
Profit for the period attributable to the shareholders of the Parent Company, SEK million 54 6 226 128
Earnings per share before dilution
Average number of shares, thousands 67,617 64,950 66,937 64,923
Earnings per share before dilution, SEK 0.80 0.10 3.37 1.97
Earnings per share after dilution
Average number of shares, thousands 67,634 64,950 66,950 64,923
Earnings per share after dilution, SEK 0.79 0.10 3.37 1.97
Earnings per share
Recalculation of average number of sharesEarnings per share have been recalculated retroactively because the company implemented a fourforone share split, a share conversion and a bonus issue in the first quarter of 2017. For more information, see the section “Shares and share capital.” The average number of shares in earlier periods has been
recalculated to reflect the split, the conversion and the bonus issue. Due to the share conversion, all preference shares were converted to common shares and the debt to former holders of preference shares was paid off in connection with the bonus issue implemented on 31 March 2017.
A M B E A A B ( P U B L ) O R G . N R . 5 5 6 4 6 8 - 4 3 5 4 | Q 4 I N T E R I M A N D Y E A R - E N D R E P O R T 2 0 1 7 1 9
Q4 and year-end report 2017
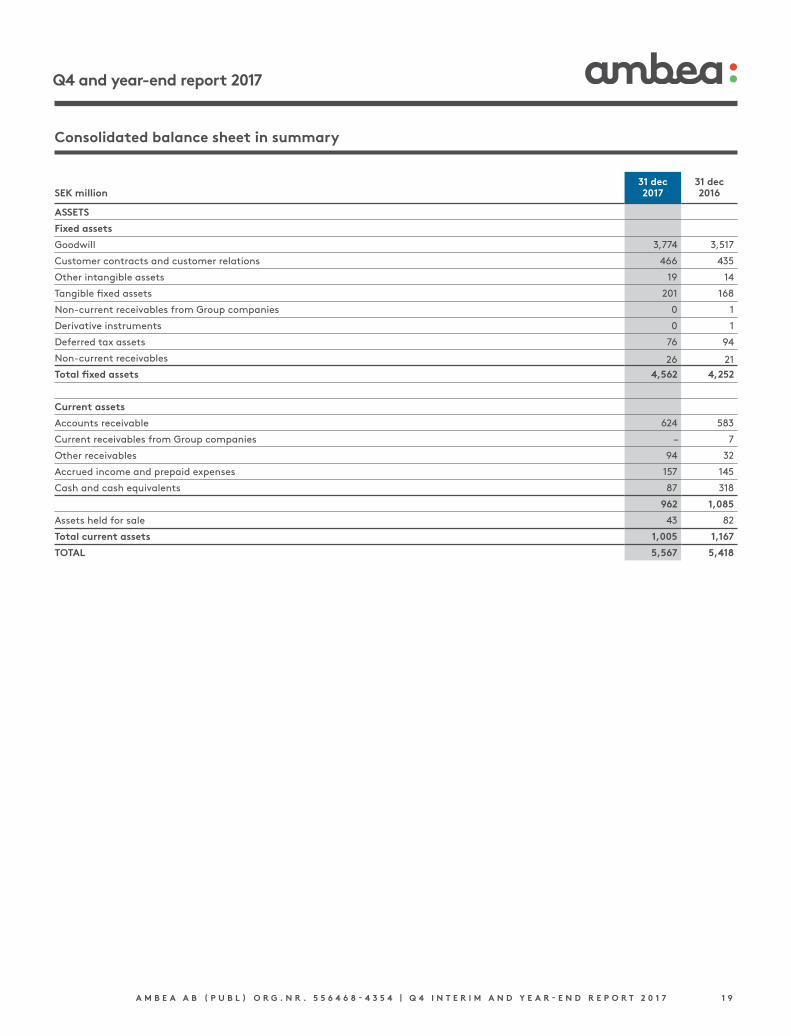
Consolidated balance sheet in summary
31 dec 31 decSEK million 2017 2016
ASSETS
Fixed assets
Goodwill 3,774 3,517
Customer contracts and customer relations 466 435
Other intangible assets 19 14
Tangible fixed assets 201 168
Non-current receivables from Group companies 0 1
Derivative instruments 0 1
Deferred tax assets 76 94
Non-current receivables 26 21
Total fixed assets 4,562 4,252
Current assets
Accounts receivable 624 583
Current receivables from Group companies – 7
Other receivables 94 32
Accrued income and prepaid expenses 157 145
Cash and cash equivalents 87 318
962 1,085
Assets held for sale 43 82
Total current assets 1,005 1,167
TOTAL 5,567 5,418
A M B E A A B ( P U B L ) O R G . N R . 5 5 6 4 6 8 - 4 3 5 4 | Q 4 I N T E R I M A N D Y E A R - E N D R E P O R T 2 0 1 7 2 0
Q4 and year-end report 2017
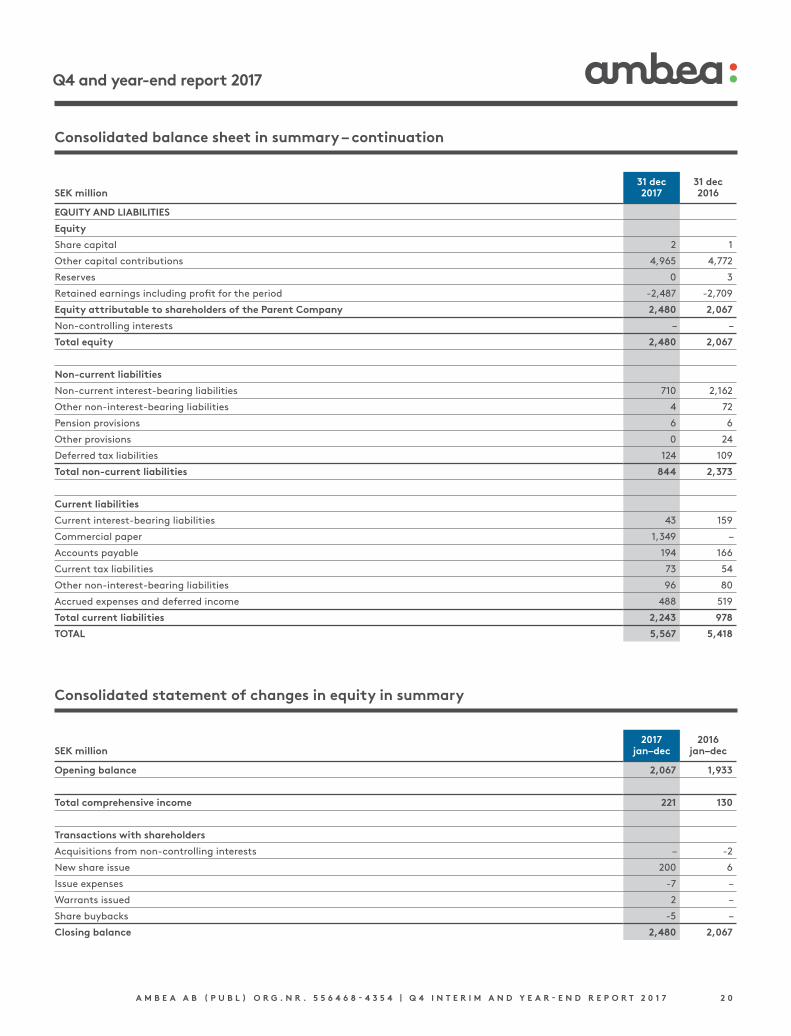
Consolidated balance sheet in summary – continuation
31 dec 31 decSEK million 2017 2016
EQUITY AND LIABILITIES
Equity
Share capital 2 1
Other capital contributions 4,965 4,772
Reserves 0 3
Retained earnings including profit for the period -2,487 -2,709
Equity attributable to shareholders of the Parent Company 2,480 2,067
Non-controlling interests – –
Total equity 2,480 2,067
Non-current liabilities
Non-current interest-bearing liabilities 710 2,162
Other non-interest-bearing liabilities 4 72
Pension provisions 6 6
Other provisions 0 24
Deferred tax liabilities 124 109
Total non-current liabilities 844 2,373
Current liabilities
Current interest-bearing liabilities 43 159
Commercial paper 1,349 –
Accounts payable 194 166
Current tax liabilities 73 54
Other non-interest-bearing liabilities 96 80
Accrued expenses and deferred income 488 519
Total current liabilities 2,243 978
TOTAL 5,567 5,418
Consolidated statement of changes in equity in summary
2017 2016SEK million jan–dec jan–dec
Opening balance 2,067 1,933
Total comprehensive income 221 130
Transactions with shareholders
Acquisitions from non-controlling interests – -2
New share issue 200 6
Issue expenses -7 –
Warrants issued 2 –
Share buybacks -5 –
Closing balance 2,480 2,067
A M B E A A B ( P U B L ) O R G . N R . 5 5 6 4 6 8 - 4 3 5 4 | Q 4 I N T E R I M A N D Y E A R - E N D R E P O R T 2 0 1 7 2 1
Q4 and year-end report 2017
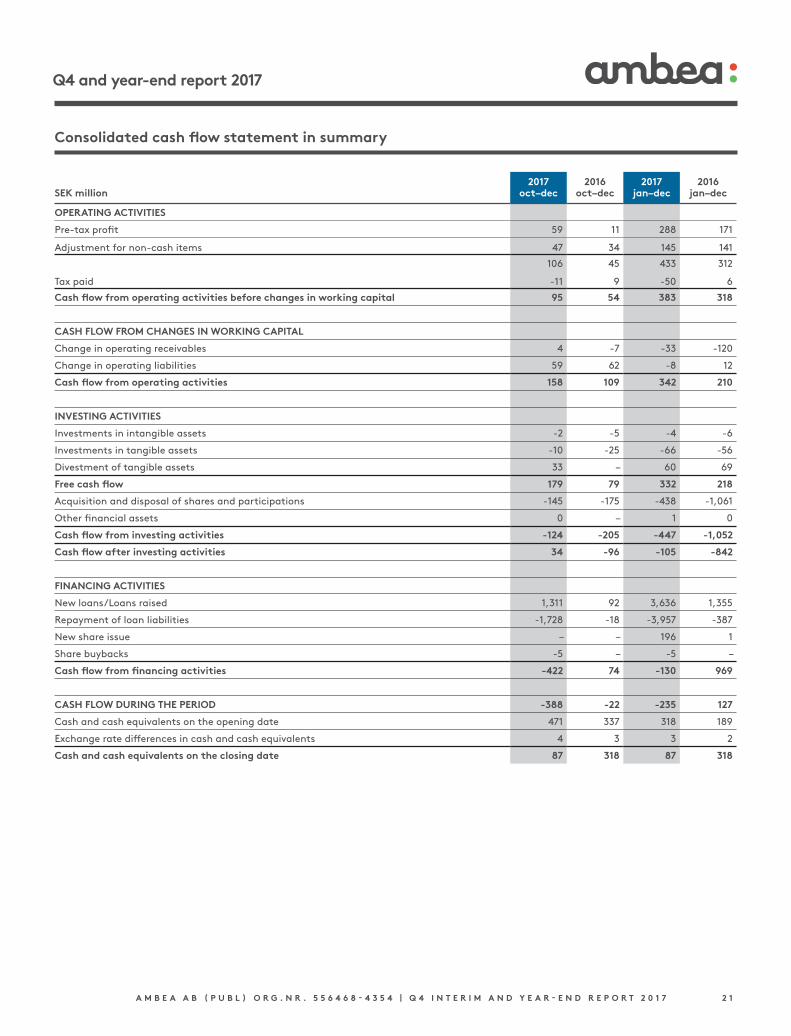
Consolidated cash flow statement in summary
2017 2016 2017 2016SEK million oct–dec oct–dec jan–dec jan–dec
OPERATING ACTIVITIES
Pre-tax profit 59 11 288 171
Adjustment for non-cash items 47 34 145 141
106 45 433 312
Tax paid -11 9 -50 6
Cash flow from operating activities before changes in working capital 95 54 383 318
CASH FLOW FROM CHANGES IN WORKING CAPITAL
Change in operating receivables 4 -7 -33 -120
Change in operating liabilities 59 62 -8 12
Cash flow from operating activities 158 109 342 210
INVESTING ACTIVITIES
Investments in intangible assets -2 -5 -4 -6
Investments in tangible assets -10 -25 -66 -56
Divestment of tangible assets 33 – 60 69
Free cash flow 179 79 332 218
Acquisition and disposal of shares and participations -145 -175 -438 -1,061
Other financial assets 0 – 1 0
Cash flow from investing activities -124 -205 -447 -1,052
Cash flow after investing activities 34 -96 -105 -842
FINANCING ACTIVITIES
New loans/Loans raised 1,311 92 3,636 1,355
Repayment of loan liabilities -1,728 -18 -3,957 -387
New share issue – – 196 1
Share buybacks -5 – -5 –
Cash flow from financing activities -422 74 -130 969
CASH FLOW DURING THE PERIOD -388 -22 -235 127
Cash and cash equivalents on the opening date 471 337 318 189
Exchange rate differences in cash and cash equivalents 4 3 3 2
Cash and cash equivalents on the closing date 87 318 87 318
A M B E A A B ( P U B L ) O R G . N R . 5 5 6 4 6 8 - 4 3 5 4 | Q 4 I N T E R I M A N D Y E A R - E N D R E P O R T 2 0 1 7 2 2
Q4 and year-end report 2017
Parent company income statement in summary
2017 2016 2017 2016SEK million oct–dec oct–dec jan–dec jan–dec
INCOME
Net sales 6 – 25 –
6 – 25 –
OPERATING EXPENSES
Other external costs -2 -31 -40 -36
Personnel costs -5 0 -12 0
Operating expenses -7 -31 -52 -36
OPERATING PROFIT -1 -31 -27 -36
Financial items -10 – -31 –
LOSS AFTER FINANCIAL ITEMS -11 -31 -58 -36
Appropriations 57 36 57 36
PROFIT/LOSS BEFORE TAX 46 5 -1 0
Tax on profit for the period – – – –
PROFIT FOR THE PERIOD 46 5 -1 0
A M B E A A B ( P U B L ) O R G . N R . 5 5 6 4 6 8 - 4 3 5 4 | Q 4 I N T E R I M A N D Y E A R - E N D R E P O R T 2 0 1 7 2 3
Q4 and year-end report 2017
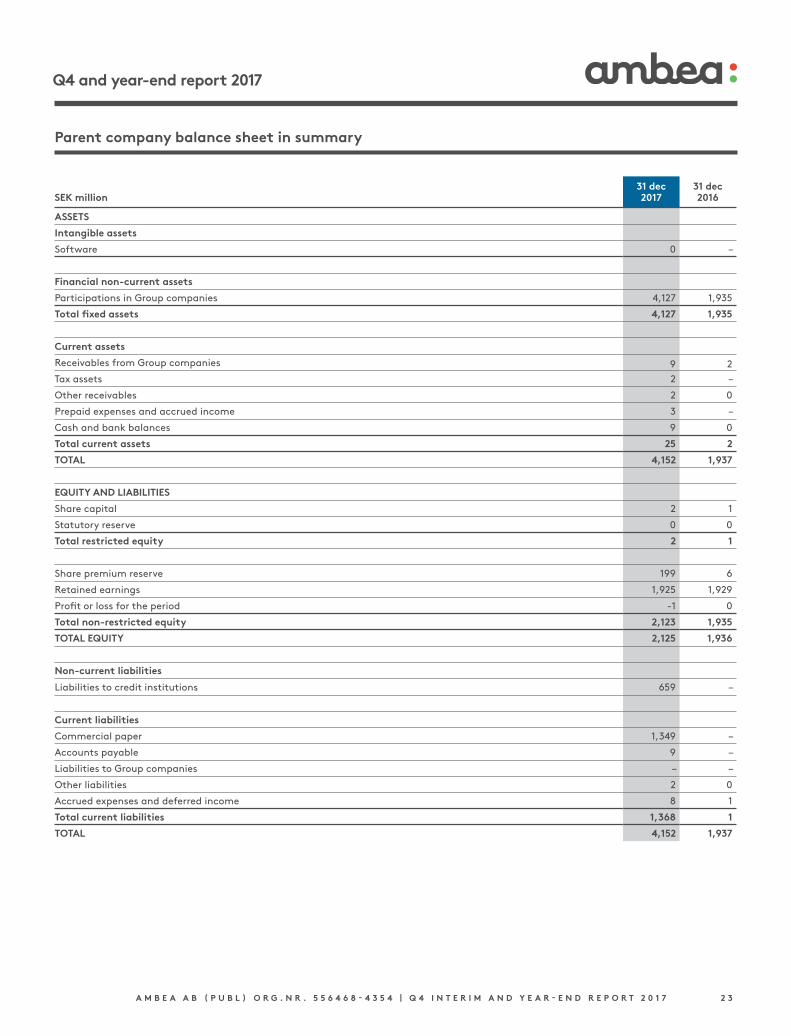
Parent company balance sheet in summary
31 dec 31 decSEK million 2017 2016
ASSETS
Intangible assets
Software 0 –
Financial non-current assets
Participations in Group companies 4,127 1,935
Total fixed assets 4,127 1,935
Current assets
Receivables from Group companies 9 2
Tax assets 2 –
Other receivables 2 0
Prepaid expenses and accrued income 3 –
Cash and bank balances 9 0
Total current assets 25 2
TOTAL 4,152 1,937
EQUITY AND LIABILITIES
Share capital 2 1
Statutory reserve 0 0
Total restricted equity 2 1
Share premium reserve 199 6
Retained earnings 1,925 1,929
Profit or loss for the period -1 0
Total non-restricted equity 2,123 1,935
TOTAL EQUITY 2,125 1,936
Non-current liabilities
Liabilities to credit institutions 659 –
Current liabilities
Commercial paper 1,349 –
Accounts payable 9 –
Liabilities to Group companies – –
Other liabilities 2 0
Accrued expenses and deferred income 8 1
Total current liabilities 1,368 1
TOTAL 4,152 1,937
A M B E A A B ( P U B L ) O R G . N R . 5 5 6 4 6 8 - 4 3 5 4 | Q 4 I N T E R I M A N D Y E A R - E N D R E P O R T 2 0 1 7 2 4
Q4 and year-end report 2017
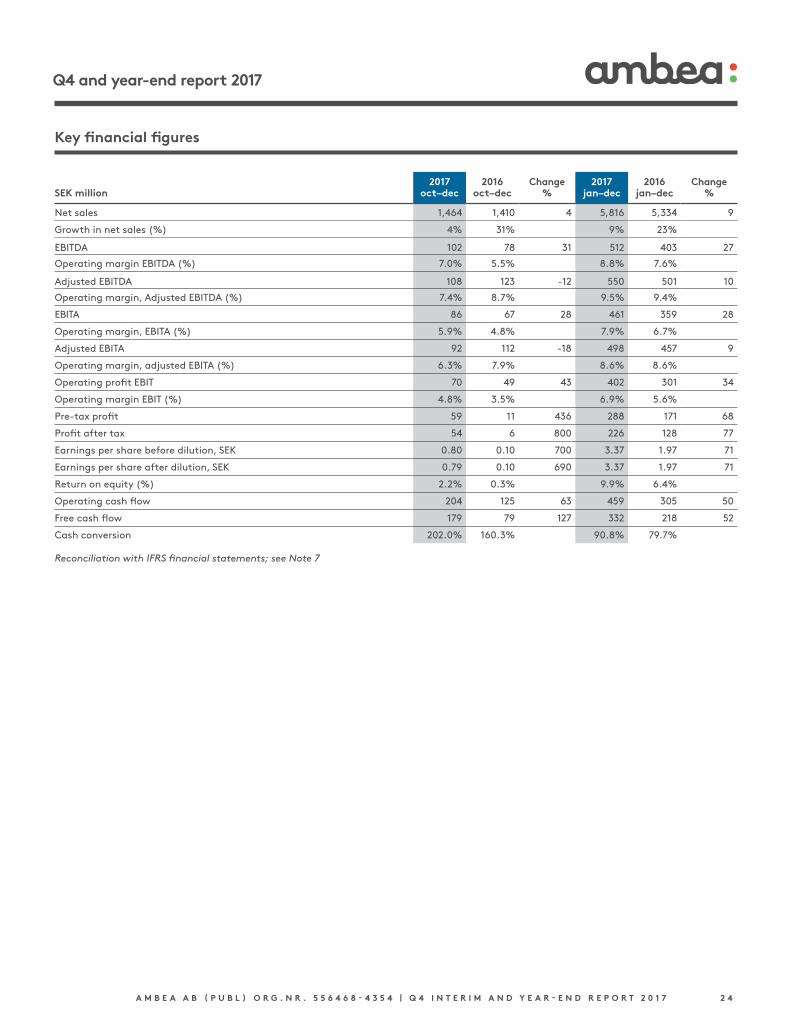
Key financial figures
2017 2016 Change 2017 2016 ChangeSEK million oct–dec oct–dec % jan–dec jan–dec %
Net sales 1,464 1,410 4 5,816 5,334 9
Growth in net sales (%) 4% 31% 9% 23%
EBITDA 102 78 31 512 403 27
Operating margin EBITDA (%) 7.0% 5.5% 8.8% 7.6%
Adjusted EBITDA 108 123 -12 550 501 10
Operating margin, Adjusted EBITDA (%) 7.4% 8.7% 9.5% 9.4%
EBITA 86 67 28 461 359 28
Operating margin, EBITA (%) 5.9% 4.8% 7.9% 6.7%
Adjusted EBITA 92 112 -18 498 457 9
Operating margin, adjusted EBITA (%) 6.3% 7.9% 8.6% 8.6%
Operating profit EBIT 70 49 43 402 301 34
Operating margin EBIT (%) 4.8% 3.5% 6.9% 5.6%
Pre-tax profit 59 11 436 288 171 68
Profit after tax 54 6 800 226 128 77
Earnings per share before dilution, SEK 0.80 0.10 700 3.37 1.97 71
Earnings per share after dilution, SEK 0.79 0.10 690 3.37 1.97 71
Return on equity (%) 2.2% 0.3% 9.9% 6.4%
Operating cash flow 204 125 63 459 305 50
Free cash flow 179 79 127 332 218 52
Cash conversion 202.0% 160.3% 90.8% 79.7%
Reconciliation with IFRS financial statements; see Note 7
A M B E A A B ( P U B L ) O R G . N R . 5 5 6 4 6 8 - 4 3 5 4 | Q 4 I N T E R I M A N D Y E A R - E N D R E P O R T 2 0 1 7 2 5
Q4 and year-end report 2017
NotesNote 1 Accounting policiesThis interim report has been prepared in accordance with IAS 34 Interim Financial Reporting and the Swedish Annual Accounts Act, as well as the Swedish Financial Reporting Board’s RFR 1, Supplementary Accounting Rules for Groups, and RFR 2 Accounting for Legal Entities. The applied accounting policies comply with the accounting policies used when preparing the latest annual accounts, with the exception of a changed policy for recognising items affecting comparability.
New and amended IFRS standards not yet appliedA number of new and amended IFRS standards are not yet effective and have not been applied in advance in the preparation of these financial statements. Listed below are the standards that may have an impact on the consolidated financial statements.
IFRS 9 Financial Instruments encompasses the classification and measurement of financial assets and liabilities. Because Ambea’s accounts receivable generally relate to customers with good payment capacity, the provision for expected credit losses due to the changed standard will not be material. The option to apply hedge accounting is facilitated in general under IFRS 9, which may affect accounting of financial statements. The classification of financial instruments under IFRS 9 is not expected to affect the accounting. IFRS 9 will become effective on 1 January 2018.
IFRS 15 Revenue from Contracts with Customers introduces new ways of determining how revenue is recognised. Revenue is now to be recognised once control of a good or service is transferred to the customer, which differs from the previous basis of the transfer of risks and benefits to the customer. On the basis of the analysis made by the company, the new standard will not result in a material difference in relation to the former standard. IFRS 15 will become effective on 1 January 2018.
IFRS 16 Leases will become effective on 1 January 2019. The new standard is expected to have a material effect on the income statement and balance sheet (but not the cash flow). Monetary estimations of the effect of IFRS 16 and the choice of transition methods have not yet been carried out. The information provided for operating leases in the 2016 Annual Report gives an indication of the nature and scope of the leases that currently exist. No decision has been made as to whether IFRS 16 will be adopted early as of 2018 or from 2019.
Changed policy for items affecting the comparability.In this yearend report, the policies for recognising items affecting the comparability have been changed. Reversal of the result for closure of an entire segment is recognised under unallocated items instead of under segments. The compensation for damages from Vitale’s former owner in an amount of SEK 17 million is recognised and adjusted under unallocated items and thus only affects consolidated revenue and profit (see Segment Other: Norway and Staffing Solution page 12).
Note 2 Key estimates and judgments For information on key estimates and judgments in the interim report, reference is made to Note K35 in the company’s 2016 Annual Report.
Note 3 Segment informationThe Norwegian operations and staffing operations together constitute a small proportion of the Group’s operations that falls below the quantitative thresholds according to IFRS 8 p 13 requiring separate reporting. As of 2016, they have therefore been merged under a miscellaneous segment – Other: Norway and Staffing Solutions. In previous years, the staffing operations were reported as a separate segment.
Vardaga Consists of elderly care
Nytida Consists of care for people with functional disabilities
Other: Norway and Staffing solutions Consists of staffing solutions and hiring of doctors, nurses and other care professionals, as well as the Norwegian operations. The Norwegian operations mainly comprise psychiatric support in residential care and outpatient care and residential care for people with lifelong disabilities.
A M B E A A B ( P U B L ) O R G . N R . 5 5 6 4 6 8 - 4 3 5 4 | Q 4 I N T E R I M A N D Y E A R - E N D R E P O R T 2 0 1 7 2 6
Q4 and year-end report 2017
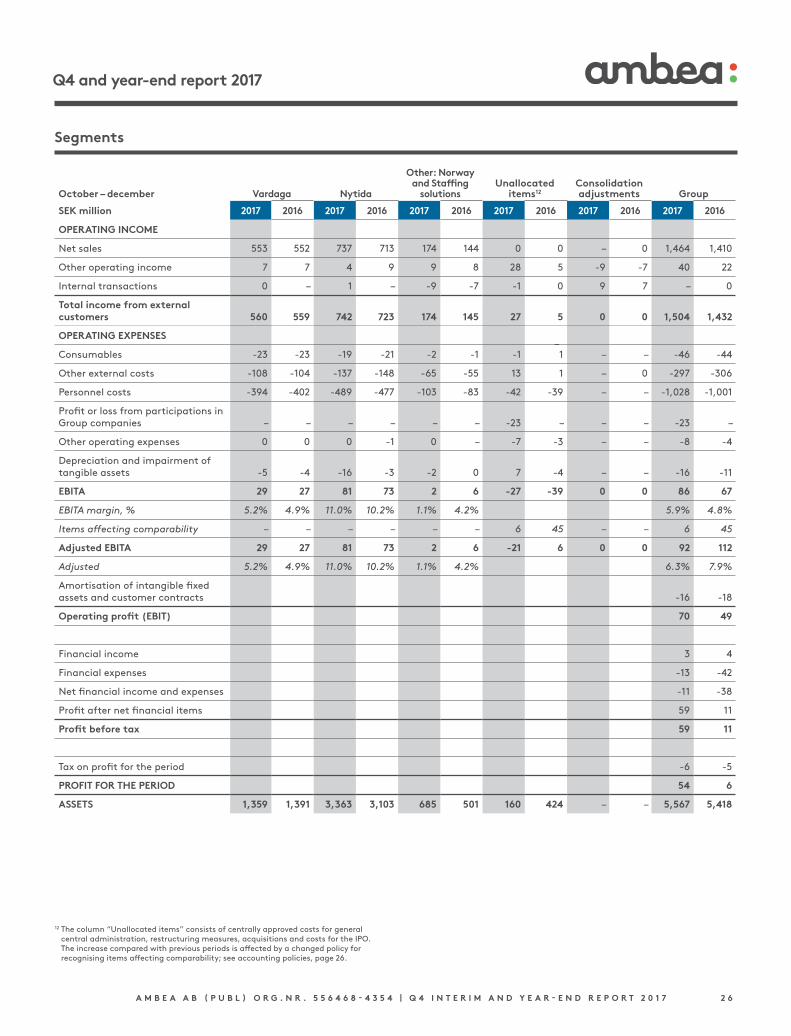
October – december Vardaga Nytida
Other: Norway and Staffing
solutionsUnallocated
items12Consolidation adjustments Group
SEK million 2017 2016 2017 2016 2017 2016 2017 2016 2017 2016 2017 2016
OPERATING INCOME
Net sales 553 552 737 713 174 144 0 0 – 0 1,464 1,410
Other operating income 7 7 4 9 9 8 28 5 -9 -7 40 22
Internal transactions 0 – 1 – -9 -7 -1 0 9 7 – 0
Total income from external customers 560 559 742 723 174 145 27 5 0 0 1,504 1,432
OPERATING EXPENSES
Consumables -23 -23 -19 -21 -2 -1 -1 1 – – -46 -44
Other external costs -108 -104 -137 -148 -65 -55 13 1 – 0 -297 -306
Personnel costs -394 -402 -489 -477 -103 -83 -42 -39 – – -1,028 -1,001
Profit or loss from participations in Group companies – – – – – – -23 – – – -23 –
Other operating expenses 0 0 0 -1 0 – -7 -3 – – -8 -4
Depreciation and impairment of tangible assets -5 -4 -16 -3 -2 0 7 -4 – – -16 -11
EBITA 29 27 81 73 2 6 -27 -39 0 0 86 67
EBITA margin, % 5.2% 4.9% 11.0% 10.2% 1.1% 4.2% 5.9% 4.8%
Items affecting comparability – – – – – – 6 45 – – 6 45
Adjusted EBITA 29 27 81 73 2 6 -21 6 0 0 92 112
Adjusted 5.2% 4.9% 11.0% 10.2% 1.1% 4.2% 6.3% 7.9%
Amortisation of intangible fixed assets and customer contracts -16 -18
Operating profit (EBIT) 70 49
Financial income 3 4
Financial expenses -13 -42
Net financial income and expenses -11 -38
Profit after net financial items 59 11
Profit before tax 59 11
Tax on profit for the period -6 -5
PROFIT FOR THE PERIOD 54 6
ASSETS 1,359 1,391 3,363 3,103 685 501 160 424 – – 5,567 5,418
Segments
12 The column “Unallocated items” consists of centrally approved costs for general central administration, restructuring measures, acquisitions and costs for the IPO. The increase compared with previous periods is affected by a changed policy for recognising items affecting comparability; see accounting policies, page 26.
–

A M B E A A B ( P U B L ) O R G . N R . 5 5 6 4 6 8 - 4 3 5 4 | Q 4 I N T E R I M A N D Y E A R - E N D R E P O R T 2 0 1 7 2 7
Q4 and year-end report 2017
January – december Vardaga Nytida
Other: Norway and Staffing
solutionsUnallocated
items13Consolidation adjustments Group
SEK million 2017 2016 2017 2016 2017 2016 2017 2016 2017 2016 2017 2016
OPERATING INCOME
Net sales 2,260 2,164 2,864 2,730 692 439 0 0 – – 5,816 5,334
Other operating income 29 24 17 22 35 26 35 28 -34 -24 83 75
Internal transactions 0 – 1 – -34 -24 – – 34 24 – 1
Total income from external customers 2,288 2,188 2,882 2,751 693 442 36 28 - 0 5,899 5,409
OPERATING EXPENSES
Consumables -92 -90 -79 -84 -6 -2 -5 0 – – -182 -176
Other external costs -431 -394 -526 -534 -269 -153 85 72 – 0 -1,139 -1,008
Personnel costs -1,595 -1,570 -1,898 -1,819 -384 -271 -156 -156 – – -4,033 -3,817
Profit or loss from participations in Group companies
– – – -1 – 0 -23 – – – -23 -1
Other operating expenses -1 -1 -1 -1 0 – -8 -3 – – -10 -4
Depreciation and impairment of tangible assets
-16 -15 -29 -12 -4 -1 -4 -16 2 0 -52 -44
EBITA 154 120 350 300 31 15 -75 -75 2 0 461 359
EBITA margin, % 6.8% 5.5% 12.2% 11.0% 4.5% 3.4% 7.9% 6.7%
Items affecting comparability – – – – – – 38 98 – – 38 98
Adjusted EBITA 154 120 350 300 31 15 -37 22 2 0 498 457
Adjusted 6.8% 5.5% 12.2% 11.0% 4.5% 3.4% 8.6% 8.6%
Amortisation of intangible fixed assets and customer contracts
-59 -58
Operating profit (EBIT) 402 301
Financial income 7 6
Financial expenses -121 -134
Net financial income and expenses -114 -130
Profit after net financial items 288 171
Profit before tax 288 171
Tax on profit for the period -62 -44
PROFIT FOR THE PERIOD 226 128
ASSETS 1,359 1,391 3,363 3,103 685 501 160 424 – – 5,567 5,418
13 The column “Unallocated items” consists of centrally approved costs for general central administration, restructuring measures, acquisitions and costs for the IPO. The increase compared with previous periods is affected by a changed policy for recognising items affecting comparability; see accounting policies, page 26.
A M B E A A B ( P U B L ) O R G . N R . 5 5 6 4 6 8 - 4 3 5 4 | Q 4 I N T E R I M A N D Y E A R - E N D R E P O R T 2 0 1 7 2 8
Q4 and year-end report 2017
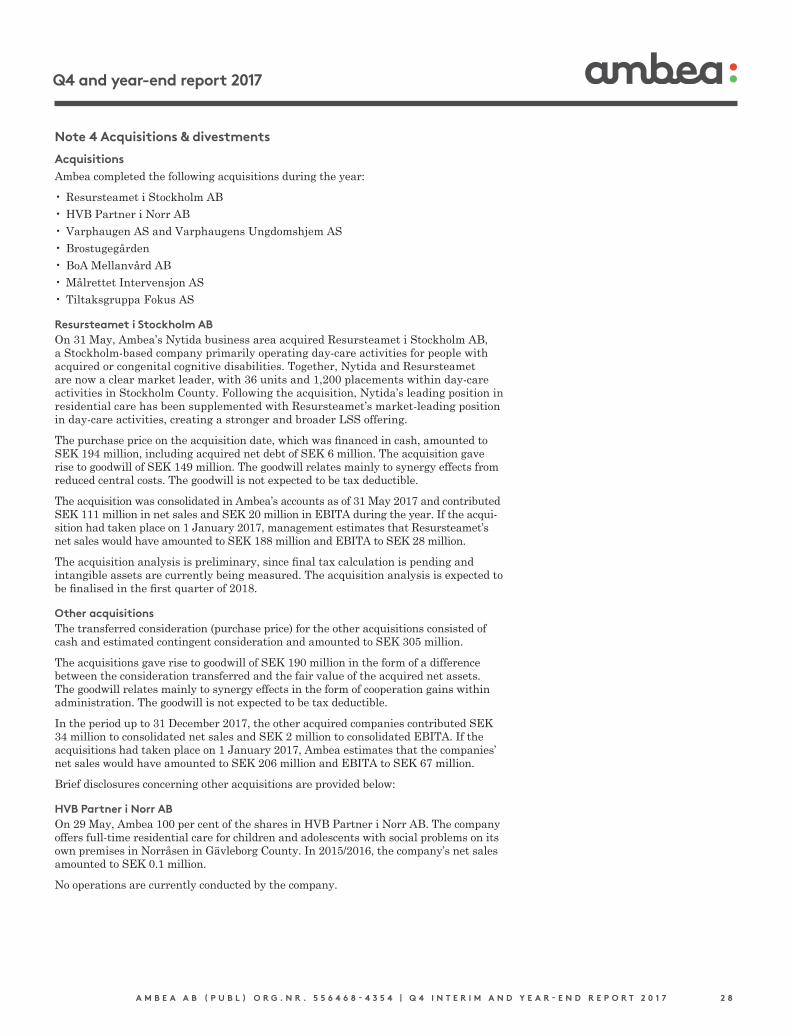
Note 4 Acquisitions & divestments
AcquisitionsAmbea completed the following acquisitions during the year:
• Resursteamet i Stockholm AB• HVB Partner i Norr AB• Varphaugen AS and Varphaugens Ungdomshjem AS• Brostugegården• BoA Mellanvård AB• Målrettet Intervensjon AS• Tiltaksgruppa Fokus AS
Resursteamet i Stockholm ABOn 31 May, Ambea’s Nytida business area acquired Resursteamet i Stockholm AB, a Stockholmbased company primarily operating daycare activities for people with acquired or congenital cognitive disabilities. Together, Nytida and Resursteamet are now a clear market leader, with 36 units and 1,200 placements within daycare activities in Stockholm County. Following the acquisition, Nytida’s leading position in residential care has been supplemented with Resursteamet’s marketleading position in daycare activities, creating a stronger and broader LSS offering.
The purchase price on the acquisition date, which was financed in cash, amounted to SEK 194 million, including acquired net debt of SEK 6 million. The acquisition gave rise to goodwill of SEK 149 million. The goodwill relates mainly to synergy effects from reduced central costs. The goodwill is not expected to be tax deductible.
The acquisition was consolidated in Ambea’s accounts as of 31 May 2017 and contributed SEK 111 million in net sales and SEK 20 million in EBITA during the year. If the acquisition had taken place on 1 January 2017, management estimates that Resursteamet’s net sales would have amounted to SEK 188 million and EBITA to SEK 28 million.
The acquisition analysis is preliminary, since final tax calculation is pending and intangible assets are currently being measured. The acquisition analysis is expected to be finalised in the first quarter of 2018.
Other acquisitionsThe transferred consideration (purchase price) for the other acquisitions consisted of cash and estimated contingent consideration and amounted to SEK 305 million.
The acquisitions gave rise to goodwill of SEK 190 million in the form of a difference between the consideration transferred and the fair value of the acquired net assets. The goodwill relates mainly to synergy effects in the form of cooperation gains within administration. The goodwill is not expected to be tax deductible.
In the period up to 31 December 2017, the other acquired companies contributed SEK 34 million to consolidated net sales and SEK 2 million to consolidated EBITA. If the acquisitions had taken place on 1 January 2017, Ambea estimates that the companies’ net sales would have amounted to SEK 206 million and EBITA to SEK 67 million.
Brief disclosures concerning other acquisitions are provided below:
HVB Partner i Norr ABOn 29 May, Ambea 100 per cent of the shares in HVB Partner i Norr AB. The company offers fulltime residential care for children and adolescents with social problems on its own premises in Norråsen in Gävleborg County. In 2015/2016, the company’s net sales amounted to SEK 0.1 million.
No operations are currently conducted by the company.
A M B E A A B ( P U B L ) O R G . N R . 5 5 6 4 6 8 - 4 3 5 4 | Q 4 I N T E R I M A N D Y E A R - E N D R E P O R T 2 0 1 7 2 9
Q4 and year-end report 2017
Varphaugen Varphaugen was acquired on 10 July, with operations in care for children and young people in Østlandet, Norway. The operations consist of two legal entities, Varphaugen AS and Varphaugen Ungdomshjem AS, seven residential units for emergency placement, investigation and longterm accommodation as well as family homes for children and young people. In 2016, sales amounted to just over NOK 40 million.
Brostugegården ABOn 25 August, Ambea’s Nytida business area acquired Brostugegården AB based in Uppsala, a residential care facility with special services for people with psychosocial disabilities. Brostugegården has 30 placements and offers a comfortable home environment, as well as support and assistance for an independent and meaningful life based on the individual’s conditions. In 2016, sales amounted to about SEK 22 million.
BoA Mellanvård ABEffective 31 October, Ambea’s Nytida business area acquired BoA Mellanvård, which conducts HVB and supported living operations in Stockholm.
BoA Mellanvård has 26 beds for young people in HVB and supported living units in the Stockholm area, generating annual revenue of about SEK 15 million. The operation offers youths and young adults an opportunity to develop independent lives by providing various types of support in own accommodation.
Målrettet Intervensjon ASEffective 29 December, Målrettet Intervensjon AS was acquired, which focuses on care for psychosocial problems and disabled care in the Norwegian counties of Hedmark and Oppland. The operation has 33 placements and had revenue of NOK 49 million in 2016.
Tiltaksgruppa Fokus ASEffective 29 December, Tiltaksgruppa Fokus AS was acquired, which provides care and support for children and young people with special needs and is mainly active in the Norwegian county of Fredrikstad/Sarpsborg. The operation had revenue of NOK 63 million in 2016.
DivestmentsAmbea divested Nytida Anemon and thus discontinued its personal assistance operations. During the quarter, profit was charged SEK 23 million resulting from participations in Group companies.
A M B E A A B ( P U B L ) O R G . N R . 5 5 6 4 6 8 - 4 3 5 4 | Q 4 I N T E R I M A N D Y E A R - E N D R E P O R T 2 0 1 7 3 0
Q4 and year-end report 2017
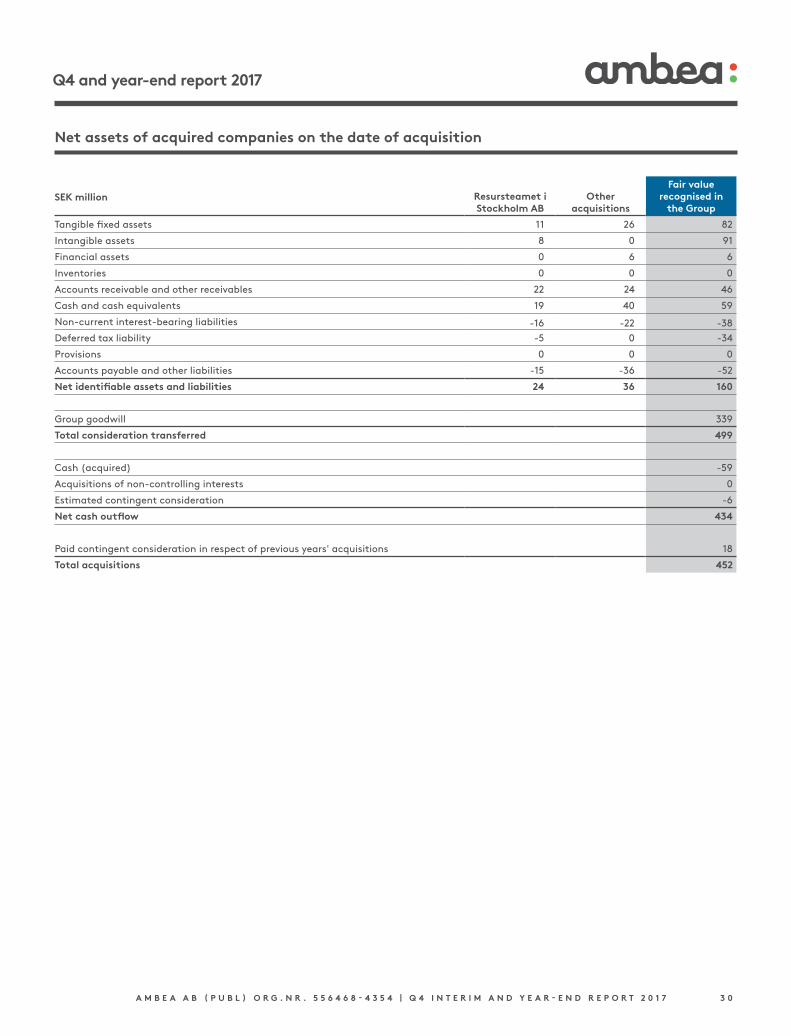
Net assets of acquired companies on the date of acquisition
Resursteamet i Stockholm AB
Other acquisitions
Fair value recognised in
the GroupSEK million
Tangible fixed assets 11 26 82
Intangible assets 8 0 91
Financial assets 0 6 6
Inventories 0 0 0
Accounts receivable and other receivables 22 24 46
Cash and cash equivalents 19 40 59
Non-current interest-bearing liabilities -16 -22 -38
Deferred tax liability -5 0 -34
Provisions 0 0 0
Accounts payable and other liabilities -15 -36 -52
Net identifiable assets and liabilities 24 36 160
Group goodwill 339
Total consideration transferred 499
Cash (acquired) -59
Acquisitions of non-controlling interests 0
Estimated contingent consideration -6
Net cash outflow 434
Paid contingent consideration in respect of previous years' acquisitions 18
Total acquisitions 452
A M B E A A B ( P U B L ) O R G . N R . 5 5 6 4 6 8 - 4 3 5 4 | Q 4 I N T E R I M A N D Y E A R - E N D R E P O R T 2 0 1 7 3 1
Q4 and year-end report 2017
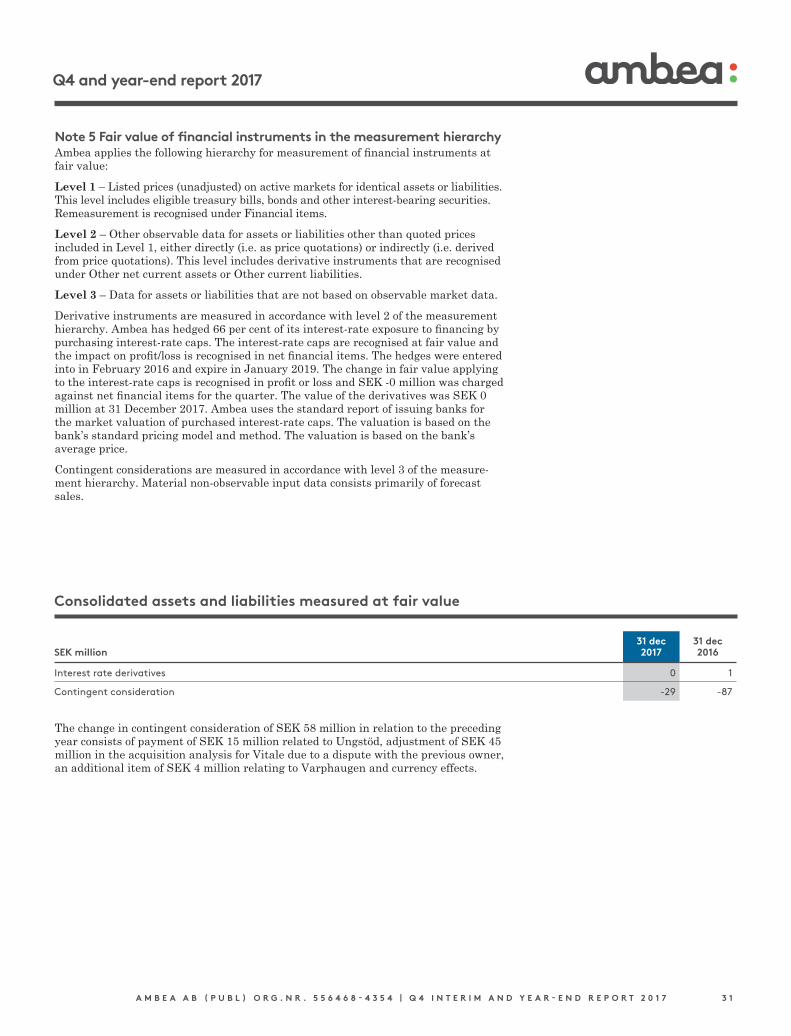
Note 5 Fair value of financial instruments in the measurement hierarchy Ambea applies the following hierarchy for measurement of financial instruments at fair value:
Level 1 – Listed prices (unadjusted) on active markets for identical assets or liabilities. This level includes eligible treasury bills, bonds and other interestbearing securities. Remeasurement is recognised under Financial items.
Level 2 – Other observable data for assets or liabilities other than quoted prices included in Level 1, either directly (i.e. as price quotations) or indirectly (i.e. derived from price quotations). This level includes derivative instruments that are recognised under Other net current assets or Other current liabilities.
Level 3 – Data for assets or liabilities that are not based on observable market data.
Derivative instruments are measured in accordance with level 2 of the measurement hierarchy. Ambea has hedged 66 per cent of its interestrate exposure to financing by purchasing interestrate caps. The interestrate caps are recognised at fair value and the impact on profit/loss is recognised in net financial items. The hedges were entered into in February 2016 and expire in January 2019. The change in fair value applying to the interestrate caps is recognised in profit or loss and SEK 0 million was charged against net financial items for the quarter. The value of the derivatives was SEK 0 million at 31 December 2017. Ambea uses the standard report of issuing banks for the market valuation of purchased interestrate caps. The valuation is based on the bank’s standard pricing model and method. The valuation is based on the bank’s average price.
Contingent considerations are measured in accordance with level 3 of the measurement hierarchy. Material nonobservable input data consists primarily of forecast sales.
Consolidated assets and liabilities measured at fair value
31 dec 31 decSEK million 2017 2016
Interest rate derivatives 0 1
Contingent consideration -29 -87
The change in contingent consideration of SEK 58 million in relation to the preceding year consists of payment of SEK 15 million related to Ungstöd, adjustment of SEK 45 million in the acquisition analysis for Vitale due to a dispute with the previous owner, an additional item of SEK 4 million relating to Varphaugen and currency effects.
A M B E A A B ( P U B L ) O R G . N R . 5 5 6 4 6 8 - 4 3 5 4 | Q 4 I N T E R I M A N D Y E A R - E N D R E P O R T 2 0 1 7 3 2
Q4 and year-end report 2017
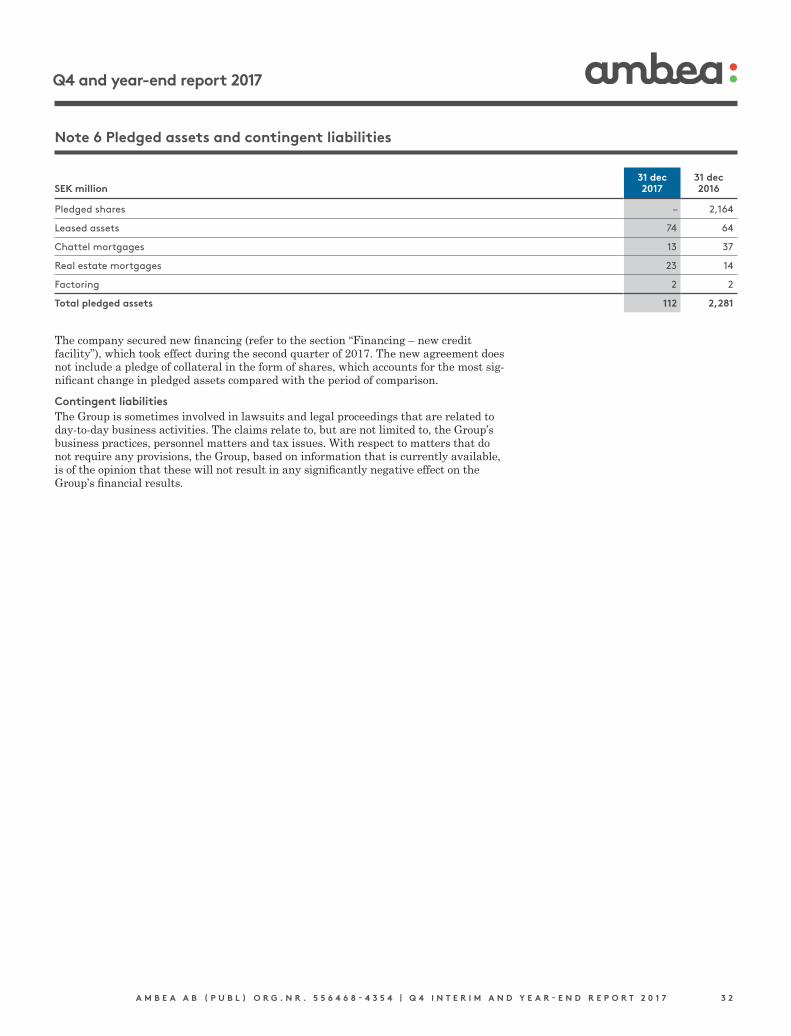
Note 6 Pledged assets and contingent liabilities
31 dec 31 decSEK million 2017 2016
Pledged shares – 2,164
Leased assets 74 64
Chattel mortgages 13 37
Real estate mortgages 23 14
Factoring 2 2
Total pledged assets 112 2,281
The company secured new financing (refer to the section “Financing – new credit facility”), which took effect during the second quarter of 2017. The new agreement does not include a pledge of collateral in the form of shares, which accounts for the most significant change in pledged assets compared with the period of comparison.
Contingent liabilitiesThe Group is sometimes involved in lawsuits and legal proceedings that are related to daytoday business activities. The claims relate to, but are not limited to, the Group’s business practices, personnel matters and tax issues. With respect to matters that do not require any provisions, the Group, based on information that is currently available, is of the opinion that these will not result in any significantly negative effect on the Group’s financial results.
A M B E A A B ( P U B L ) O R G . N R . 5 5 6 4 6 8 - 4 3 5 4 | Q 4 I N T E R I M A N D Y E A R - E N D R E P O R T 2 0 1 7 3 3
Q4 and year-end report 2017
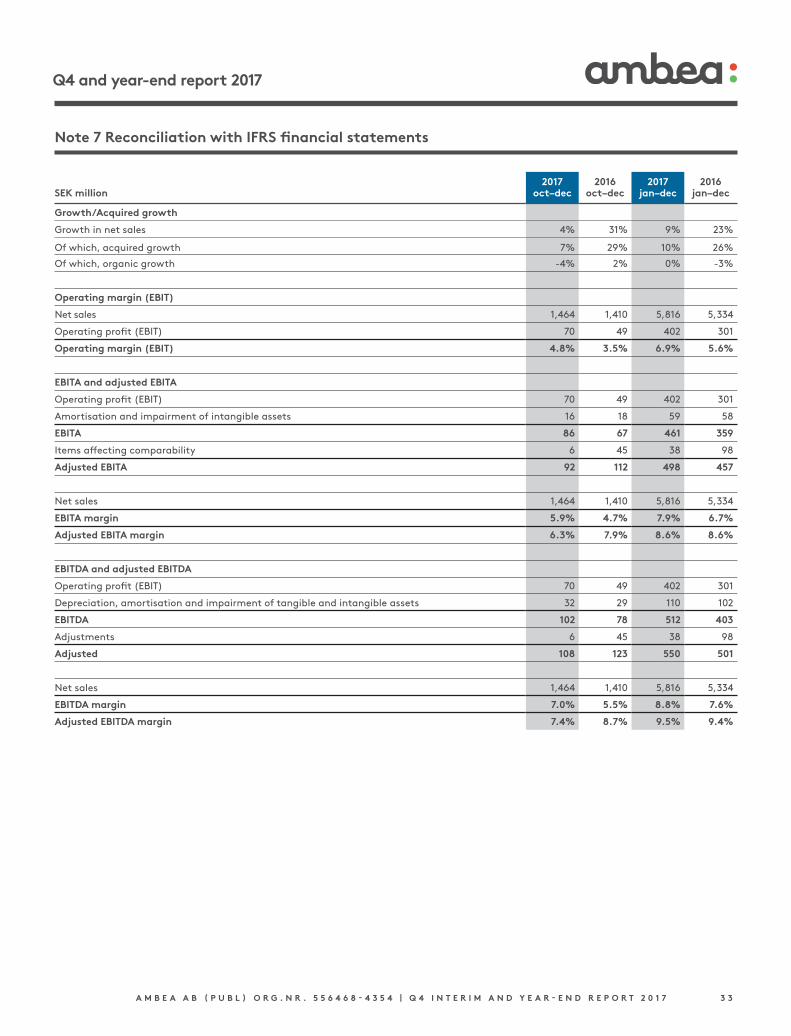
Note 7 Reconciliation with IFRS financial statements
2017 2016 2017 2016SEK million oct–dec oct–dec jan–dec jan–dec
Growth/Acquired growth
Growth in net sales 4% 31% 9% 23%
Of which, acquired growth 7% 29% 10% 26%
Of which, organic growth -4% 2% 0% -3%
Operating margin (EBIT)
Net sales 1,464 1,410 5,816 5,334
Operating profit (EBIT) 70 49 402 301
Operating margin (EBIT) 4.8% 3.5% 6.9% 5.6%
EBITA and adjusted EBITA
Operating profit (EBIT) 70 49 402 301
Amortisation and impairment of intangible assets 16 18 59 58
EBITA 86 67 461 359
Items affecting comparability 6 45 38 98
Adjusted EBITA 92 112 498 457
Net sales 1,464 1,410 5,816 5,334
EBITA margin 5.9% 4.7% 7.9% 6.7%
Adjusted EBITA margin 6.3% 7.9% 8.6% 8.6%
EBITDA and adjusted EBITDA
Operating profit (EBIT) 70 49 402 301
Depreciation, amortisation and impairment of tangible and intangible assets 32 29 110 102
EBITDA 102 78 512 403
Adjustments 6 45 38 98
Adjusted 108 123 550 501
Net sales 1,464 1,410 5,816 5,334
EBITDA margin 7.0% 5.5% 8.8% 7.6%
Adjusted EBITDA margin 7.4% 8.7% 9.5% 9.4%
A M B E A A B ( P U B L ) O R G . N R . 5 5 6 4 6 8 - 4 3 5 4 | Q 4 I N T E R I M A N D Y E A R - E N D R E P O R T 2 0 1 7 3 4
Q4 and year-end report 2017
2017 2016 2017 2016SEK million oct–dec oct–dec jan–dec jan–dec
Items affecting comparability
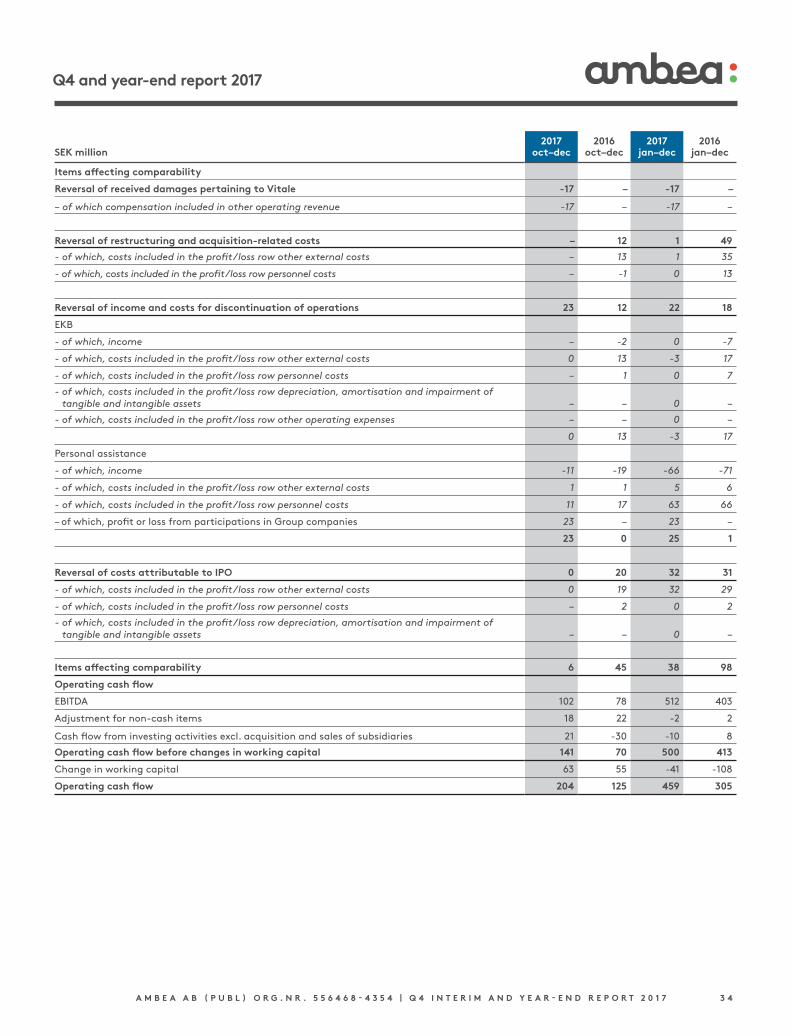
Reversal of received damages pertaining to Vitale -17 – -17 –
– of which compensation included in other operating revenue -17 – -17 –
Reversal of restructuring and acquisition-related costs – 12 1 49
- of which, costs included in the profit/loss row other external costs – 13 1 35
- of which, costs included in the profit/loss row personnel costs – -1 0 13
Reversal of income and costs for discontinuation of operations 23 12 22 18
EKB
- of which, income – -2 0 -7
- of which, costs included in the profit/loss row other external costs 0 13 -3 17
- of which, costs included in the profit/loss row personnel costs – 1 0 7
- of which, costs included in the profit/loss row depreciation, amortisation and impairment of tangible and intangible assets – – 0 –
- of which, costs included in the profit/loss row other operating expenses – – 0 –
0 13 -3 17
Personal assistance
- of which, income -11 -19 -66 -71
- of which, costs included in the profit/loss row other external costs 1 1 5 6
- of which, costs included in the profit/loss row personnel costs 11 17 63 66
– of which, profit or loss from participations in Group companies 23 – 23 –
23 0 25 1
Reversal of costs attributable to IPO 0 20 32 31
- of which, costs included in the profit/loss row other external costs 0 19 32 29
- of which, costs included in the profit/loss row personnel costs – 2 0 2
- of which, costs included in the profit/loss row depreciation, amortisation and impairment of tangible and intangible assets – – 0 –
Items affecting comparability 6 45 38 98
Operating cash flow
EBITDA 102 78 512 403
Adjustment for non-cash items 18 22 -2 2
Cash flow from investing activities excl. acquisition and sales of subsidiaries 21 -30 -10 8
Operating cash flow before changes in working capital 141 70 500 413
Change in working capital 63 55 -41 -108
Operating cash flow 204 125 459 305
A M B E A A B ( P U B L ) O R G . N R . 5 5 6 4 6 8 - 4 3 5 4 | Q 4 I N T E R I M A N D Y E A R - E N D R E P O R T 2 0 1 7 3 5
Q4 and year-end report 2017
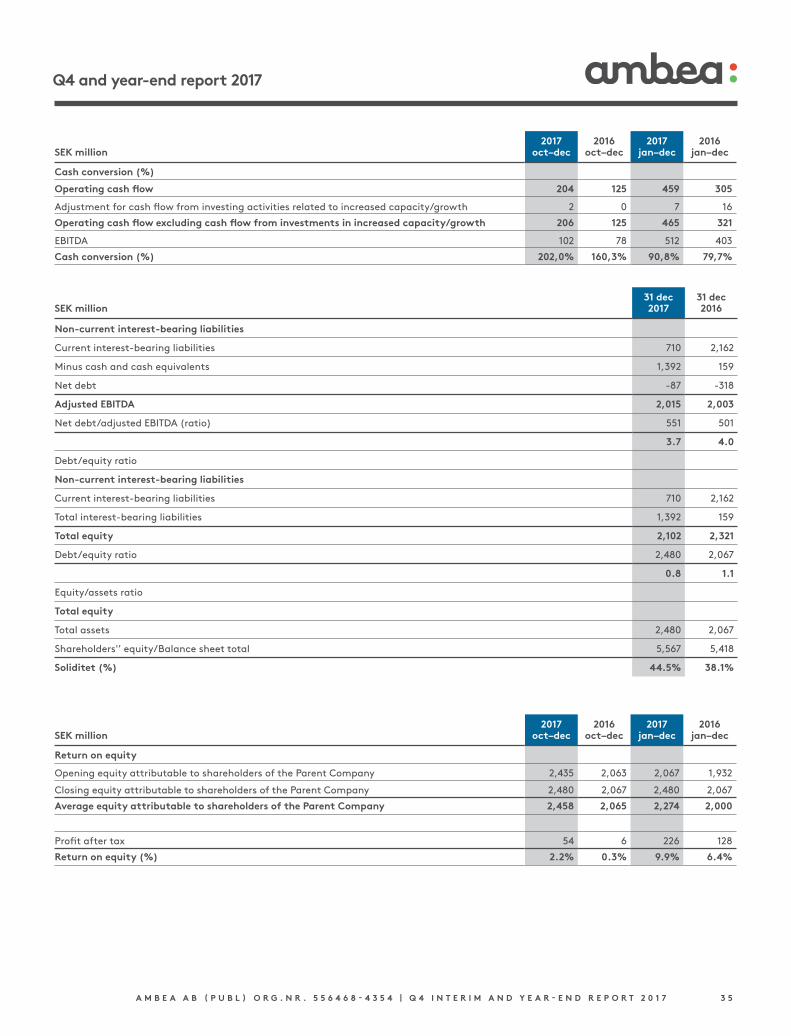
31 dec 31 decSEK million 2017 2016
Non-current interest-bearing liabilities
Current interest-bearing liabilities 710 2,162
Minus cash and cash equivalents 1,392 159
Net debt -87 -318
Adjusted EBITDA 2,015 2,003
Net debt/adjusted EBITDA (ratio) 551 501
3.7 4.0
Debt/equity ratio
Non-current interest-bearing liabilities
Current interest-bearing liabilities 710 2,162
Total interest-bearing liabilities 1,392 159
Total equity 2,102 2,321
Debt/equity ratio 2,480 2,067
0.8 1.1
Equity/assets ratio
Total equity
Total assets 2,480 2,067
Shareholders'’ equity/Balance sheet total 5,567 5,418
Soliditet (%) 44.5% 38.1%
2017 2016 2017 2016SEK million oct–dec oct–dec jan–dec jan–dec
Cash conversion (%)
Operating cash flow 204 125 459 305
Adjustment for cash flow from investing activities related to increased capacity/growth 2 0 7 16
Operating cash flow excluding cash flow from investments in increased capacity/growth 206 125 465 321
EBITDA 102 78 512 403
Cash conversion (%) 202,0% 160,3% 90,8% 79,7%
2017 2016 2017 2016SEK million oct–dec oct–dec jan–dec jan–dec
Return on equity
Opening equity attributable to shareholders of the Parent Company 2,435 2,063 2,067 1,932
Closing equity attributable to shareholders of the Parent Company 2,480 2,067 2,480 2,067
Average equity attributable to shareholders of the Parent Company 2,458 2,065 2,274 2,000
Profit after tax 54 6 226 128
Return on equity (%) 2.2% 0.3% 9.9% 6.4%
A M B E A A B ( P U B L ) O R G . N R . 5 5 6 4 6 8 - 4 3 5 4 | Q 4 I N T E R I M A N D Y E A R - E N D R E P O R T 2 0 1 7 3 6
Q4 and year-end report 2017
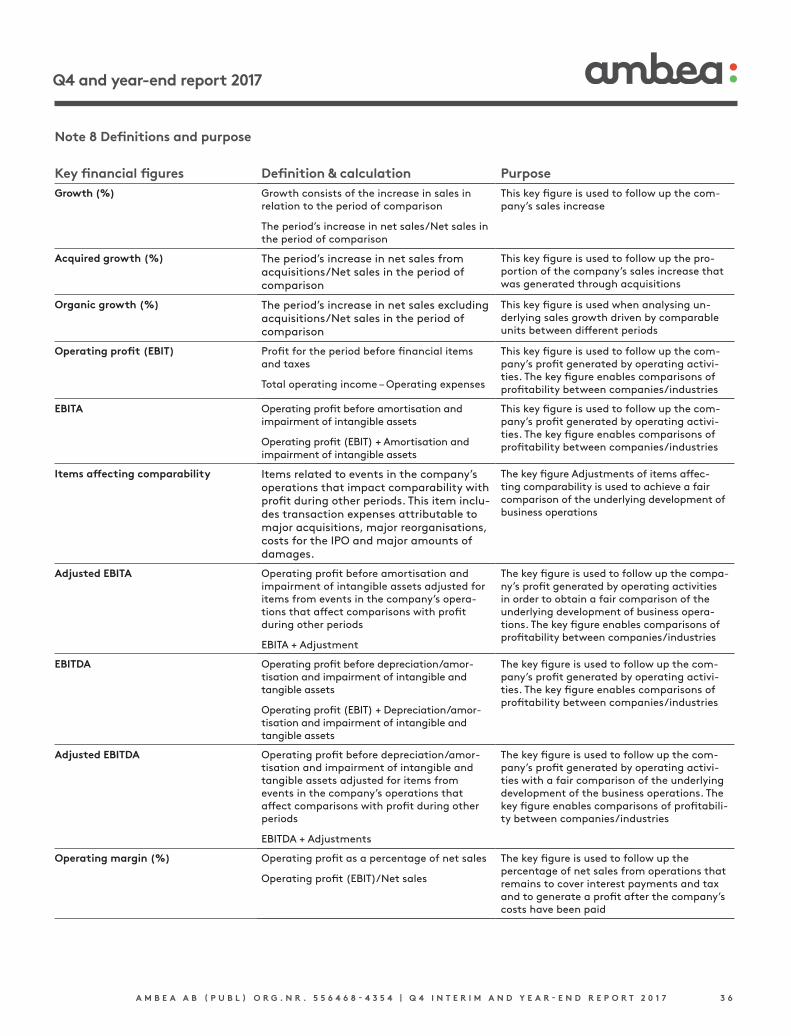
Key financial figures Definition & calculation PurposeGrowth (%) Growth consists of the increase in sales in
relation to the period of comparison
The period’s increase in net sales/Net sales in the period of comparison
This key figure is used to follow up the com-pany’s sales increase
Acquired growth (%) The period’s increase in net sales from acquisitions/Net sales in the period of comparison
This key figure is used to follow up the pro-portion of the company’s sales increase that was generated through acquisitions
Organic growth (%) The period’s increase in net sales excluding acquisitions/Net sales in the period of comparison
This key figure is used when analysing un-derlying sales growth driven by comparable units between different periods
Operating profit (EBIT) Profit for the period before financial items and taxes
Total operating income – Operating expenses
This key figure is used to follow up the com-pany’s profit generated by operating activi-ties. The key figure enables comparisons of profitability between companies/industries
EBITA Operating profit before amortisation and impairment of intangible assets
Operating profit (EBIT) + Amortisation and impairment of intangible assets
This key figure is used to follow up the com-pany’s profit generated by operating activi-ties. The key figure enables comparisons of profitability between companies/industries
Items affecting comparability Items related to events in the company’s operations that impact comparability with profit during other periods. This item inclu-des transaction expenses attributable to major acquisitions, major reorganisations, costs for the IPO and major amounts of damages.
The key figure Adjustments of items affec-ting comparability is used to achieve a fair comparison of the underlying development of business operations
Adjusted EBITA Operating profit before amortisation and impairment of intangible assets adjusted for items from events in the company’s opera-tions that affect comparisons with profit during other periods
EBITA + Adjustment
The key figure is used to follow up the compa-ny’s profit generated by operating activities in order to obtain a fair comparison of the underlying development of business opera-tions. The key figure enables comparisons of profitability between companies/industries
EBITDA Operating profit before depreciation/amor-tisation and impairment of intangible and tangible assets
Operating profit (EBIT) + Depreciation/amor-tisation and impairment of intangible and tangible assets
The key figure is used to follow up the com-pany’s profit generated by operating activi-ties. The key figure enables comparisons of profitability between companies/industries
Adjusted EBITDA Operating profit before depreciation/amor-tisation and impairment of intangible and tangible assets adjusted for items from events in the company’s operations that affect comparisons with profit during other periods
EBITDA + Adjustments
The key figure is used to follow up the com-pany’s profit generated by operating activi-ties with a fair comparison of the underlying development of the business operations. The key figure enables comparisons of profitabili-ty between companies/industries
Operating margin (%) Operating profit as a percentage of net sales
Operating profit (EBIT)/Net sales
The key figure is used to follow up the percen tage of net sales from operations that remains to cover interest payments and tax and to generate a profit after the company’s costs have been paid
Note 8 Definitions and purpose
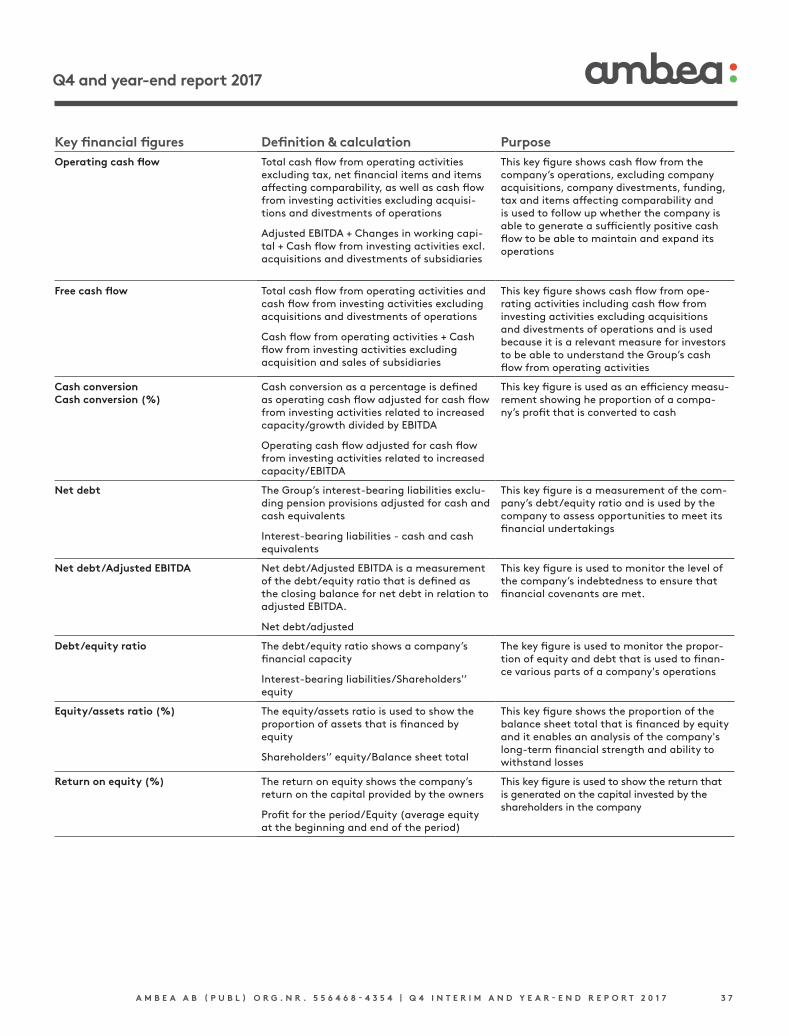
A M B E A A B ( P U B L ) O R G . N R . 5 5 6 4 6 8 - 4 3 5 4 | Q 4 I N T E R I M A N D Y E A R - E N D R E P O R T 2 0 1 7 3 7
Q4 and year-end report 2017
Key financial figures Definition & calculation PurposeOperating cash flow Total cash flow from operating activities
excluding tax, net financial items and items affecting comparability, as well as cash flow from investing activities excluding acquisi-tions and divestments of operations
Adjusted EBITDA + Changes in working capi-tal + Cash flow from investing activities excl. acquisitions and divestments of subsidiaries
This key figure shows cash flow from the company’s operations, excluding company acquisitions, company divestments, funding, tax and items affecting comparability and is used to follow up whether the company is able to generate a sufficiently positive cash flow to be able to maintain and expand its operations
Free cash flow Total cash flow from operating activities and cash flow from investing activities excluding acquisitions and divestments of operations
Cash flow from operating activities + Cash flow from investing activities excluding acquisition and sales of subsidiaries
This key figure shows cash flow from ope-rating activities including cash flow from investing activities excluding acquisitions and divestments of operations and is used because it is a relevant measure for investors to be able to understand the Group’s cash flow from operating activities
Cash conversion Cash conversion (%)
Cash conversion as a percentage is defined as operating cash flow adjusted for cash flow from investing activities related to increased capacity/growth divided by EBITDA
Operating cash flow adjusted for cash flow from investing activities related to increased capacity/EBITDA
This key figure is used as an efficiency measu-rement showing he proportion of a compa-ny’s profit that is converted to cash
Net debt The Group’s interest-bearing liabilities exclu-ding pension provisions adjusted for cash and cash equivalents
Interest-bearing liabilities - cash and cash equivalents
This key figure is a measurement of the com-pany’s debt/equity ratio and is used by the company to assess opportunities to meet its financial undertakings
Net debt/Adjusted EBITDA Net debt/Adjusted EBITDA is a measurement of the debt/equity ratio that is defined as the closing balance for net debt in relation to adjusted EBITDA.
Net debt/adjusted
This key figure is used to monitor the level of the company’s indebtedness to ensure that financial covenants are met.
Debt/equity ratio The debt/equity ratio shows a company’s financial capacity
Interest-bearing liabilities/Shareholders'’ equity
The key figure is used to monitor the propor-tion of equity and debt that is used to finan-ce various parts of a company's operations
Equity/assets ratio (%) The equity/assets ratio is used to show the proportion of assets that is financed by equity
Shareholders'’ equity/Balance sheet total
This key figure shows the proportion of the balance sheet total that is financed by equity and it enables an analysis of the company's long-term financial strength and ability to withstand losses
Return on equity (%) The return on equity shows the company’s return on the capital provided by the owners
Profit for the period/Equity (average equity at the beginning and end of the period)
This key figure is used to show the return that is generated on the capital invested by the shareholders in the company
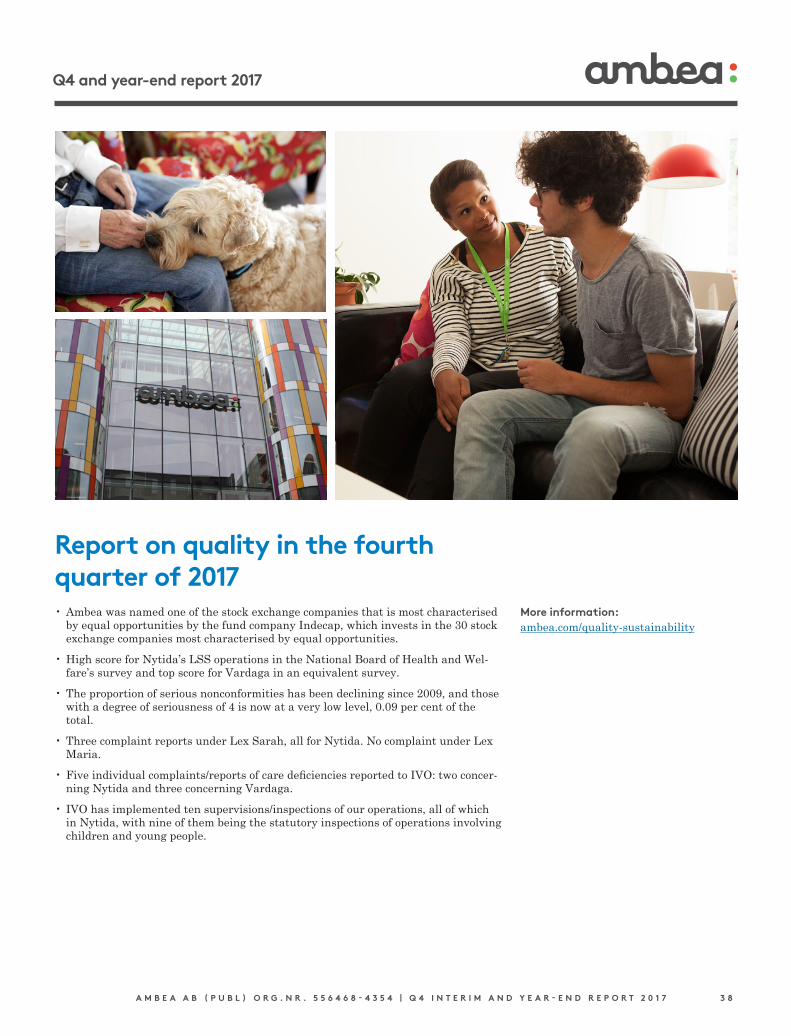
A M B E A A B ( P U B L ) O R G . N R . 5 5 6 4 6 8 - 4 3 5 4 | Q 4 I N T E R I M A N D Y E A R - E N D R E P O R T 2 0 1 7 3 8
Q4 and year-end report 2017
Report on quality in the fourth quarter of 2017• Ambea was named one of the stock exchange companies that is most characterised
by equal opportunities by the fund company Indecap, which invests in the 30 stock exchange companies most characterised by equal opportunities.
• High score for Nytida’s LSS operations in the National Board of Health and Welfare’s survey and top score for Vardaga in an equivalent survey.
• The proportion of serious nonconformities has been declining since 2009, and those with a degree of seriousness of 4 is now at a very low level, 0.09 per cent of the total.
• Three complaint reports under Lex Sarah, all for Nytida. No complaint under Lex Maria.
• Five individual complaints/reports of care deficiencies reported to IVO: two concerning Nytida and three concerning Vardaga.
• IVO has implemented ten supervisions/inspections of our operations, all of which in Nytida, with nine of them being the statutory inspections of operations involving children and young people.
More information:ambea.com/qualitysustainability