Embed Size (px)
Citation preview
American Institute of Aeronautics and Astronautics
1
Expansion Tunnel Radiation Experiments to Support
Hayabusa Re-entry Observations
David Buttsworth1
University of Southern Queensland, Toowoomba, Queensland, 4350, Australia
Mary D’Souza2, Daniel Potter
3, Troy Eichmann
4,
The University of Queensland, Brisbane, Queensland, 4072, Australia
Neil Mudford5
University of New South Wales, Australian Defence Force Academy, Canberra, ACT 2600, Australia
and
Matthew McGilvray6, Timothy J. McIntyre
7, Peter Jacobs
8, Richard Morgan
9
The University of Queensland, Brisbane, Queensland, 4072, Australia
The Hayabusa sample return capsule is scheduled for re-entry near Woomera, Australia
in June 2010 and expansion tube experiments are being performed to support the planned
re-entry observation campaign. Initial experiments using a 1/10th scale model of the
Hayabusa forebody have been performed in the X2 expansion tunnel facility at The
University of Queensland to simulate aerothermal elements of the anticipated re-entry.
Experiments have been performed at an effective flight speed of around 9.8 km/s using steel
models, and steel models coated with a layer of epoxy to simulate pyrolysis gases associated
with heat shield ablation. Spectral emissions from the stagnation region of the capsule have
been acquired using a spectrograph system. Two dimensional maps of the luminous
emissions from the shock heated flow have also been acquired using a high speed camera.
Deduction of flow conditions generated in the X2 expansion tunnel is achieved using quasi-
one-dimensional simulations coupled to an axisymmetric simulation of the flow through the
expansion tunnel nozzle. The effects of the ablative epoxy material are observed in the data
from both the spectrograph system and the high speed camera. Both systems register strong
emissions in the ablative layer, and the strength of the spectral peaks associated with CN
emissions are shown to be enhanced by the presence of the epoxy. Further measurement
and analysis is required to confidently define the flow conditions produced by the expansion
tunnel, and to quantify results from the spectrograph and high speed camera measurements.
I. Introduction
IRBORNE observation of the re-entry of JAXA’s Hayabusa sample return capsule is currently being planned.
Hayabusa is scheduled for re-entry into the Earth’s atmosphere in June 2010 with a nominal speed of around
12.2 km/s, the fastest atmospheric entry event for an object of human origin since the Stardust sample return capsule
1 Associate Dean (Research), Faculty of Engineering and Surveying, Senior Member AIAA.
2 Graduate Research Student, Centre for Hypersonics.
3 Graduate Research Student, Centre for Hypersonics.
4 Graduate Research Student, Centre for Hypersonics.
5 Deputy Head of School (Administration), School of Engineering and Information Technology.
6 Post-Doctoral Research Fellow, Department of Engineering Science, Oxford University, England, OX1 3PJ.
7 Academic, School of Mathematics and Physics.
8 Academic, Centre for Hypersonics.
9 Director, Centre for Hypersonics.
A
American Institute of Aeronautics and Astronautics
2
in January 2006. The airborne observation of the Stardust capsule, which re-entered with a nominal speed of around
12.8 km/s, was very successful and has set a challenging precedent for observers with the Hayabusa campaign.
Hayabusa observers interested in the capsule shock layer and heat shield may face additional challenges because the
main bus is expected be trailing the capsule into the atmosphere by only a couple of kilometers.
Opportunities to acquire super-orbital re-entry flight data are rare, making the Hayabusa flight data an extremely
valuable asset for calibration and refinement of modeling tools. Ground testing can also be performed in shock and
expansion tubes to simulate the critical aspects of the shock layer and ablative aerothermal environments
experienced during re-entry1,2
. Ground testing offers the important advantage of significantly lower cost relative to
flight testing; it also affords the opportunity to explore the performance of configurations in regimes for which flight
testing cannot be contemplated. By developing a ground testing program with supporting numerical simulations
which targets re-entry conditions for which flight data should become available, it will be possible to refine and
prove techniques which can then be confidently used for the physical simulation of other relevant atmospheric entry
conditions. Furthermore, the data and experience gained from the ground-based testing ahead of the Hayabusa re-
entry should assist the planning for the observation campaign.
In this paper we present some results from our initial experiments on the detection of emissions from the shock
layer and ablative region on a 1/10th
scale model of the Hayabusa capsule in the X2 expansion tunnel.
II. Hardware
A. Scale Models
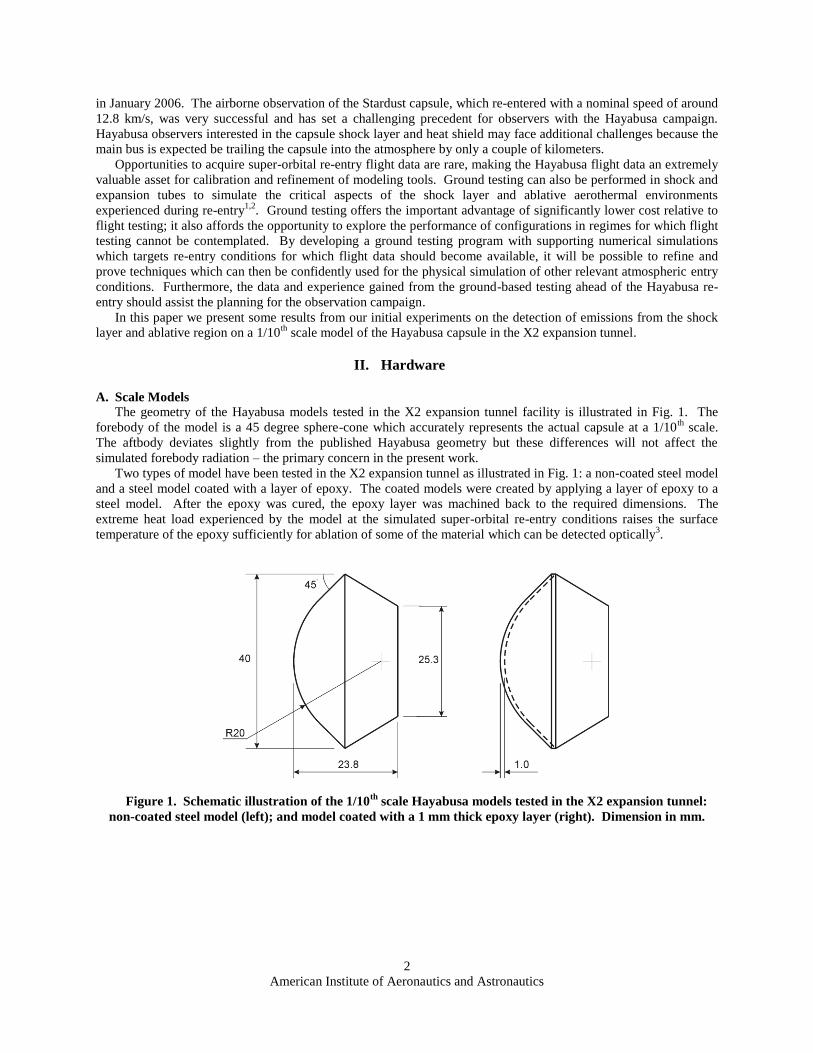
The geometry of the Hayabusa models tested in the X2 expansion tunnel facility is illustrated in Fig. 1. The
forebody of the model is a 45 degree sphere-cone which accurately represents the actual capsule at a 1/10th
scale.
The aftbody deviates slightly from the published Hayabusa geometry but these differences will not affect the
simulated forebody radiation – the primary concern in the present work.
Two types of model have been tested in the X2 expansion tunnel as illustrated in Fig. 1: a non-coated steel model
and a steel model coated with a layer of epoxy. The coated models were created by applying a layer of epoxy to a
steel model. After the epoxy was cured, the epoxy layer was machined back to the required dimensions. The
extreme heat load experienced by the model at the simulated super-orbital re-entry conditions raises the surface
temperature of the epoxy sufficiently for ablation of some of the material which can be detected optically3.
Figure 1. Schematic illustration of the 1/10th
scale Hayabusa models tested in the X2 expansion tunnel:
non-coated steel model (left); and model coated with a 1 mm thick epoxy layer (right). Dimension in mm.
American Institute of Aeronautics and Astronautics
3
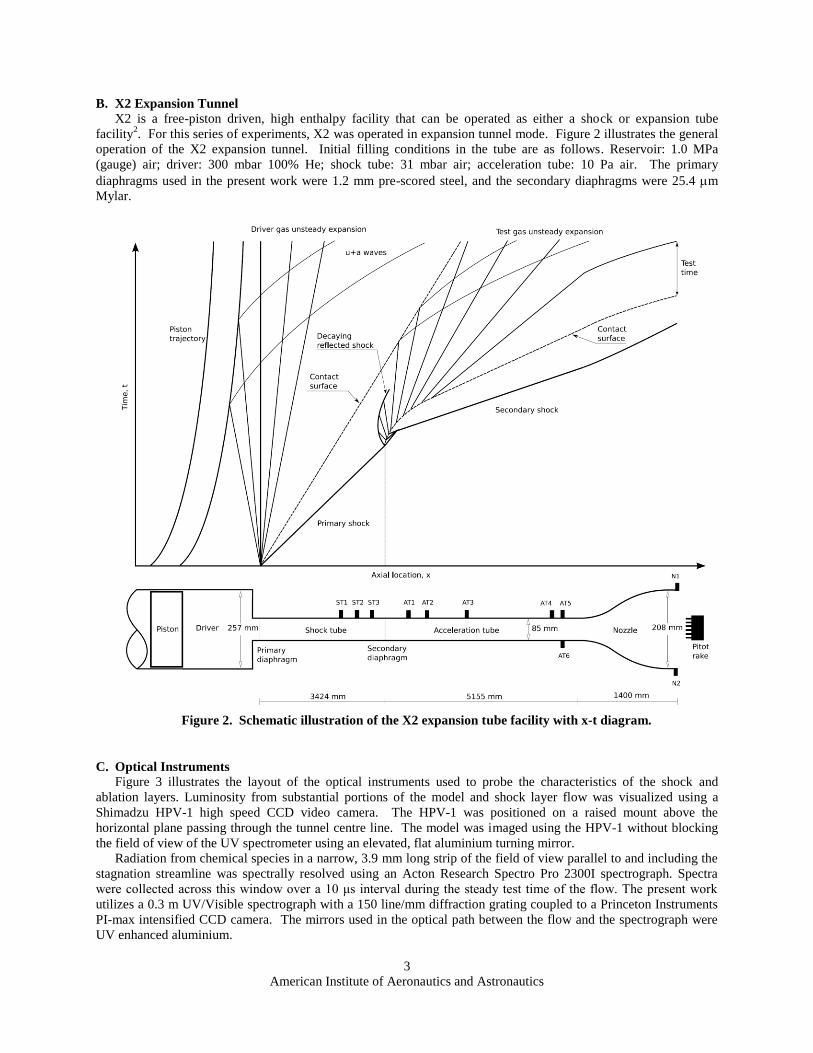
B. X2 Expansion Tunnel
X2 is a free-piston driven, high enthalpy facility that can be operated as either a shock or expansion tube
facility2. For this series of experiments, X2 was operated in expansion tunnel mode. Figure 2 illustrates the general
operation of the X2 expansion tunnel. Initial filling conditions in the tube are as follows. Reservoir: 1.0 MPa
(gauge) air; driver: 300 mbar 100% He; shock tube: 31 mbar air; acceleration tube: 10 Pa air. The primary
diaphragms used in the present work were 1.2 mm pre-scored steel, and the secondary diaphragms were 25.4 m
Mylar.
Figure 2. Schematic illustration of the X2 expansion tube facility with x-t diagram.
C. Optical Instruments
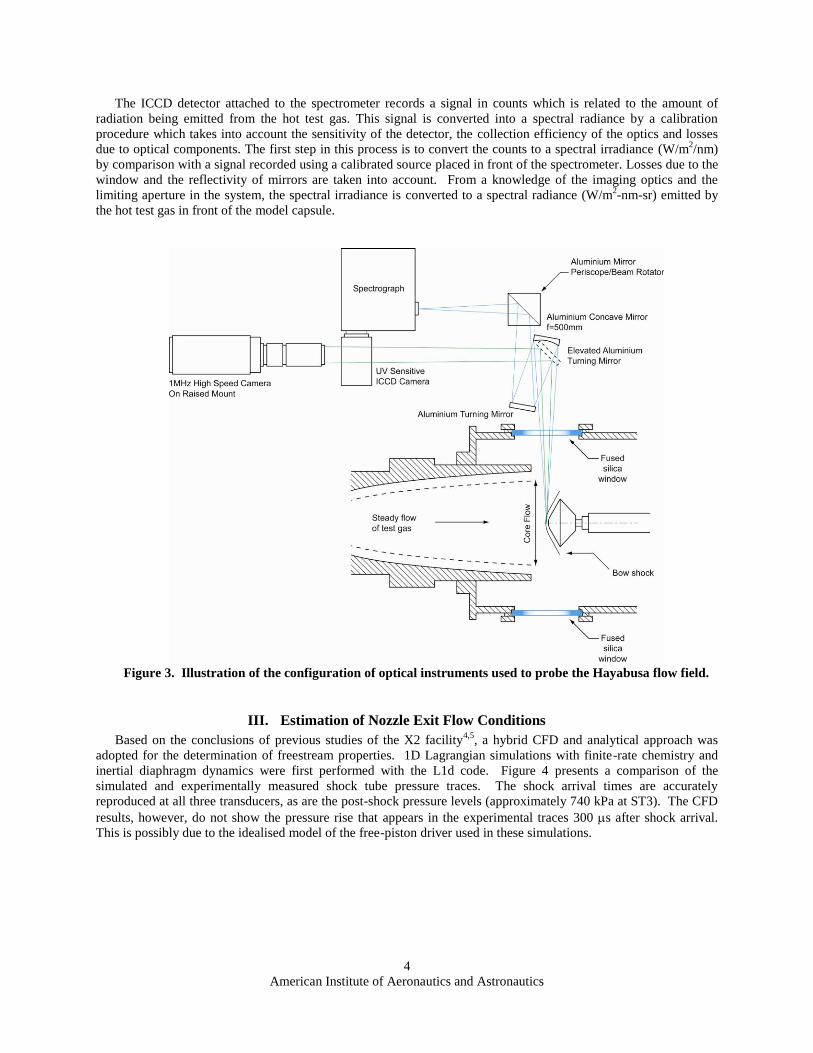
Figure 3 illustrates the layout of the optical instruments used to probe the characteristics of the shock and
ablation layers. Luminosity from substantial portions of the model and shock layer flow was visualized using a
Shimadzu HPV-1 high speed CCD video camera. The HPV-1 was positioned on a raised mount above the
horizontal plane passing through the tunnel centre line. The model was imaged using the HPV-1 without blocking
the field of view of the UV spectrometer using an elevated, flat aluminium turning mirror.
Radiation from chemical species in a narrow, 3.9 mm long strip of the field of view parallel to and including the
stagnation streamline was spectrally resolved using an Acton Research Spectro Pro 2300I spectrograph. Spectra
were collected across this window over a 10 μs interval during the steady test time of the flow. The present work
utilizes a 0.3 m UV/Visible spectrograph with a 150 line/mm diffraction grating coupled to a Princeton Instruments
PI-max intensified CCD camera. The mirrors used in the optical path between the flow and the spectrograph were
UV enhanced aluminium.
American Institute of Aeronautics and Astronautics
4
The ICCD detector attached to the spectrometer records a signal in counts which is related to the amount of
radiation being emitted from the hot test gas. This signal is converted into a spectral radiance by a calibration
procedure which takes into account the sensitivity of the detector, the collection efficiency of the optics and losses
due to optical components. The first step in this process is to convert the counts to a spectral irradiance (W/m2/nm)
by comparison with a signal recorded using a calibrated source placed in front of the spectrometer. Losses due to the
window and the reflectivity of mirrors are taken into account. From a knowledge of the imaging optics and the
limiting aperture in the system, the spectral irradiance is converted to a spectral radiance (W/m2-nm-sr) emitted by
the hot test gas in front of the model capsule.
Figure 3. Illustration of the configuration of optical instruments used to probe the Hayabusa flow field.
III. Estimation of Nozzle Exit Flow Conditions
Based on the conclusions of previous studies of the X2 facility4,5
, a hybrid CFD and analytical approach was
adopted for the determination of freestream properties. 1D Lagrangian simulations with finite-rate chemistry and
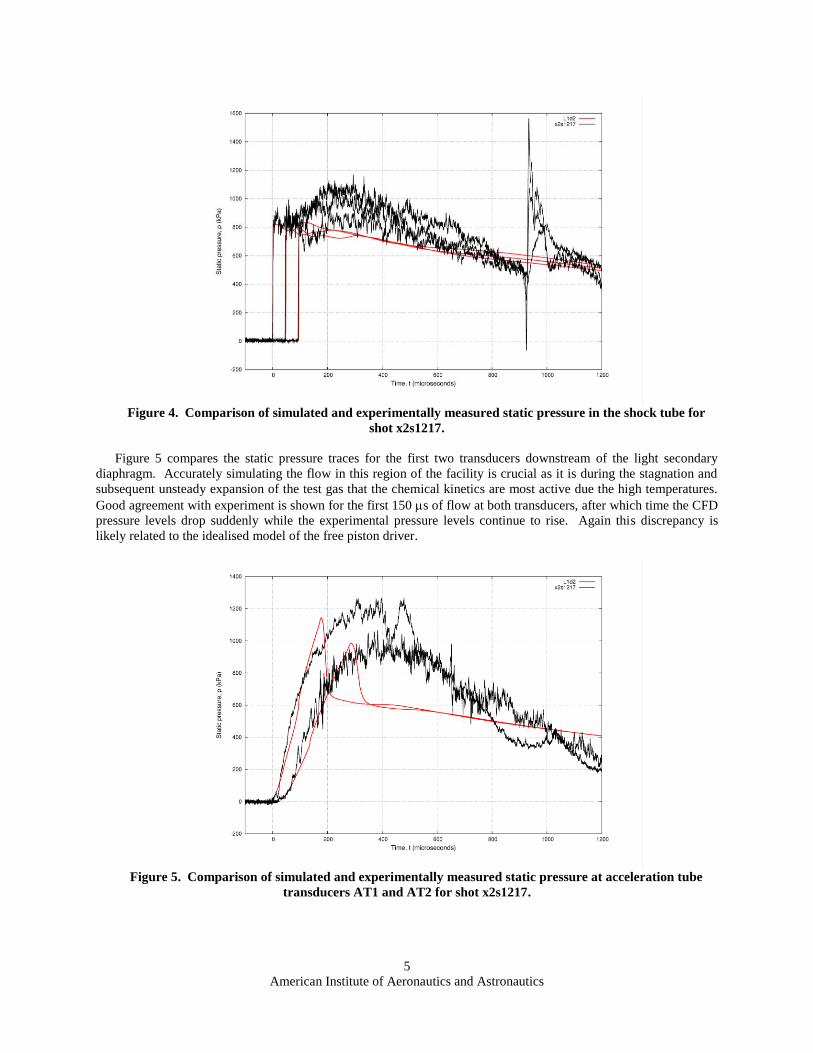
inertial diaphragm dynamics were first performed with the L1d code. Figure 4 presents a comparison of the
simulated and experimentally measured shock tube pressure traces. The shock arrival times are accurately
reproduced at all three transducers, as are the post-shock pressure levels (approximately 740 kPa at ST3). The CFD
results, however, do not show the pressure rise that appears in the experimental traces 300 s after shock arrival.
This is possibly due to the idealised model of the free-piston driver used in these simulations.
American Institute of Aeronautics and Astronautics
5
Figure 4. Comparison of simulated and experimentally measured static pressure in the shock tube for
shot x2s1217.
Figure 5 compares the static pressure traces for the first two transducers downstream of the light secondary
diaphragm. Accurately simulating the flow in this region of the facility is crucial as it is during the stagnation and
subsequent unsteady expansion of the test gas that the chemical kinetics are most active due the high temperatures.
Good agreement with experiment is shown for the first 150 s of flow at both transducers, after which time the CFD
pressure levels drop suddenly while the experimental pressure levels continue to rise. Again this discrepancy is
likely related to the idealised model of the free piston driver.
Figure 5. Comparison of simulated and experimentally measured static pressure at acceleration tube
transducers AT1 and AT2 for shot x2s1217.

American Institute of Aeronautics and Astronautics
6
Figure 6 presents the temperature and mass-fraction history for a volume of test-gas that originates just upstream
of the secondary diaphragm. The initial spike in temperature corresponds to the arrival of the primary shock
momentarily stagnating against the secondary diaphragm. The N2 and O2 mass-fractions subsequently drop to their
post-shock levels, followed by some increase in concentration as dissociated species then attempt to recombine as
the temperature falls through the unsteady expansion. N2 is shown to almost completely recombine to the initial
75.5% by mass present in the test gas, while O2 recombination is almost negligible due to its much lower
dissociation energy.
Figure 6. Temperature and mass-fraction histories for a volume of test-gas originating adjacent to the
secondary diaphragm considering N2 (top) and O2 (bottom).
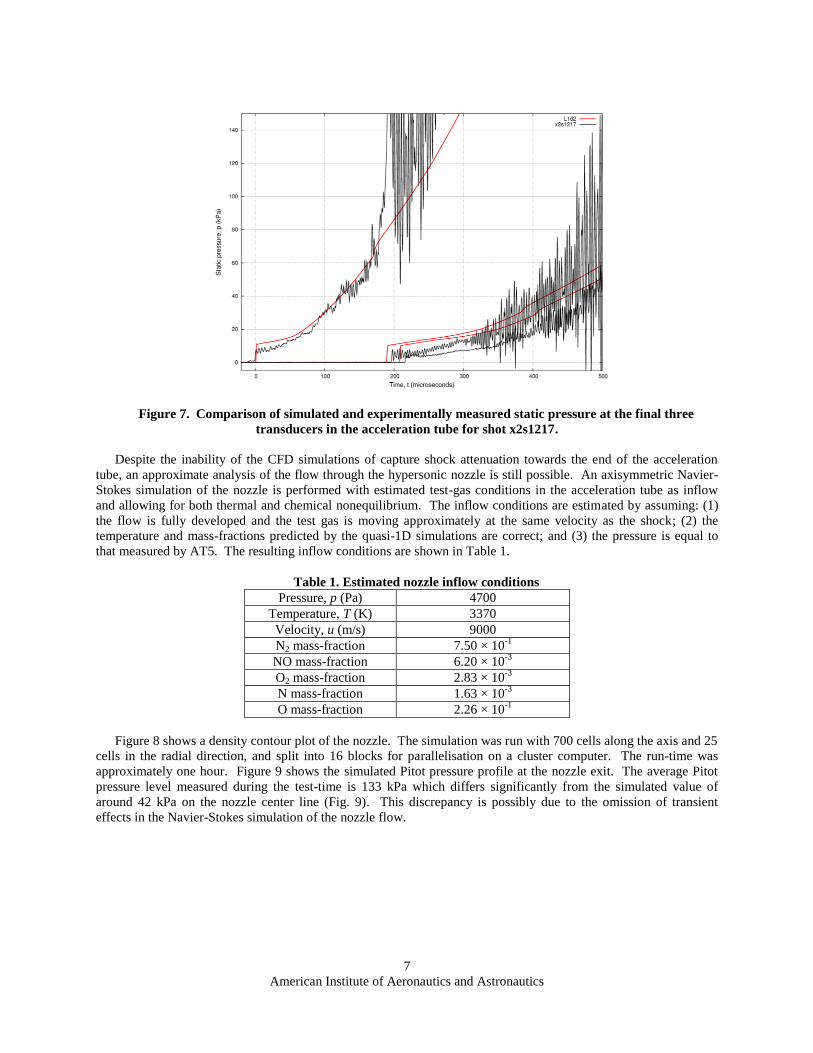
Figure 7 compares the static pressure traces for the final three transducers in the low pressure acceleration tube.
Although the qualitative trend of the traces is similar, the post-shock level predicted by the quasi-1D CFD
simulations becomes progressively higher than experiment as the shock progresses down the tube. Furthermore the
shock speed is 10% faster than measured in the experiments. This may be attributed to mass-loss through boundary
layer growth which is expected to be substantial at such a low pressure, high enthalpy condition. Axisymmetric
simulations are required to validate this hypothesis.
American Institute of Aeronautics and Astronautics
7
Figure 7. Comparison of simulated and experimentally measured static pressure at the final three
transducers in the acceleration tube for shot x2s1217.
Despite the inability of the CFD simulations of capture shock attenuation towards the end of the acceleration
tube, an approximate analysis of the flow through the hypersonic nozzle is still possible. An axisymmetric Navier-
Stokes simulation of the nozzle is performed with estimated test-gas conditions in the acceleration tube as inflow
and allowing for both thermal and chemical nonequilibrium. The inflow conditions are estimated by assuming: (1)
the flow is fully developed and the test gas is moving approximately at the same velocity as the shock; (2) the
temperature and mass-fractions predicted by the quasi-1D simulations are correct; and (3) the pressure is equal to
that measured by AT5. The resulting inflow conditions are shown in Table 1.
Table 1. Estimated nozzle inflow conditions
Pressure, p (Pa) 4700
Temperature, T (K) 3370
Velocity, u (m/s) 9000
N2 mass-fraction 7.50 × 10⁻¹
NO mass-fraction 6.20 × 10⁻³
O2 mass-fraction 2.83 × 10⁻³
N mass-fraction 1.63 × 10⁻³
O mass-fraction 2.26 × 10⁻¹
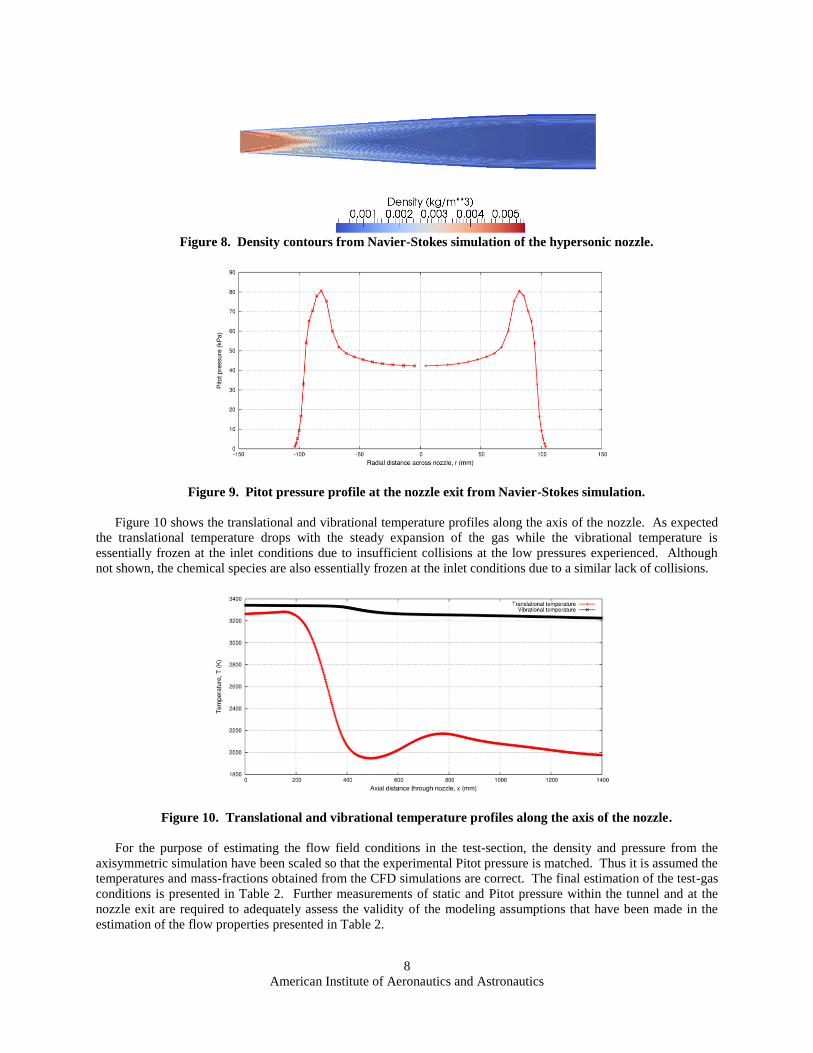
Figure 8 shows a density contour plot of the nozzle. The simulation was run with 700 cells along the axis and 25
cells in the radial direction, and split into 16 blocks for parallelisation on a cluster computer. The run-time was
approximately one hour. Figure 9 shows the simulated Pitot pressure profile at the nozzle exit. The average Pitot
pressure level measured during the test-time is 133 kPa which differs significantly from the simulated value of
around 42 kPa on the nozzle center line (Fig. 9). This discrepancy is possibly due to the omission of transient
effects in the Navier-Stokes simulation of the nozzle flow.
American Institute of Aeronautics and Astronautics
8
Figure 8. Density contours from Navier-Stokes simulation of the hypersonic nozzle.
Figure 9. Pitot pressure profile at the nozzle exit from Navier-Stokes simulation.
Figure 10 shows the translational and vibrational temperature profiles along the axis of the nozzle. As expected
the translational temperature drops with the steady expansion of the gas while the vibrational temperature is
essentially frozen at the inlet conditions due to insufficient collisions at the low pressures experienced. Although
not shown, the chemical species are also essentially frozen at the inlet conditions due to a similar lack of collisions.
Figure 10. Translational and vibrational temperature profiles along the axis of the nozzle.
For the purpose of estimating the flow field conditions in the test-section, the density and pressure from the
axisymmetric simulation have been scaled so that the experimental Pitot pressure is matched. Thus it is assumed the
temperatures and mass-fractions obtained from the CFD simulations are correct. The final estimation of the test-gas
conditions is presented in Table 2. Further measurements of static and Pitot pressure within the tunnel and at the
nozzle exit are required to adequately assess the validity of the modeling assumptions that have been made in the
estimation of the flow properties presented in Table 2.
American Institute of Aeronautics and Astronautics
9
Table 2. Estimated free stream conditions
Pressure, p (Pa) 1126
Density, (kg/m3) 1.69 × 10
-3
Translational temperature, T (K) 1977
Vibrational temperature, T (K) 3224
Velocity, u (m/s) 9230
Mach number, M 9.73
Total enthalpy, H (MJ/kg) 47.9
Effective flight velocity (m/s) 9790
N2 mass-fraction 7.60 × 10⁻¹
NO mass-fraction 6.20 × 10⁻³
O2 mass-fraction 4.16 × 10⁻²
N mass-fraction 1.31 × 10⁻⁵
O mass-fraction 1.95 × 10⁻¹
IV. Results
A. Steady Test Flow
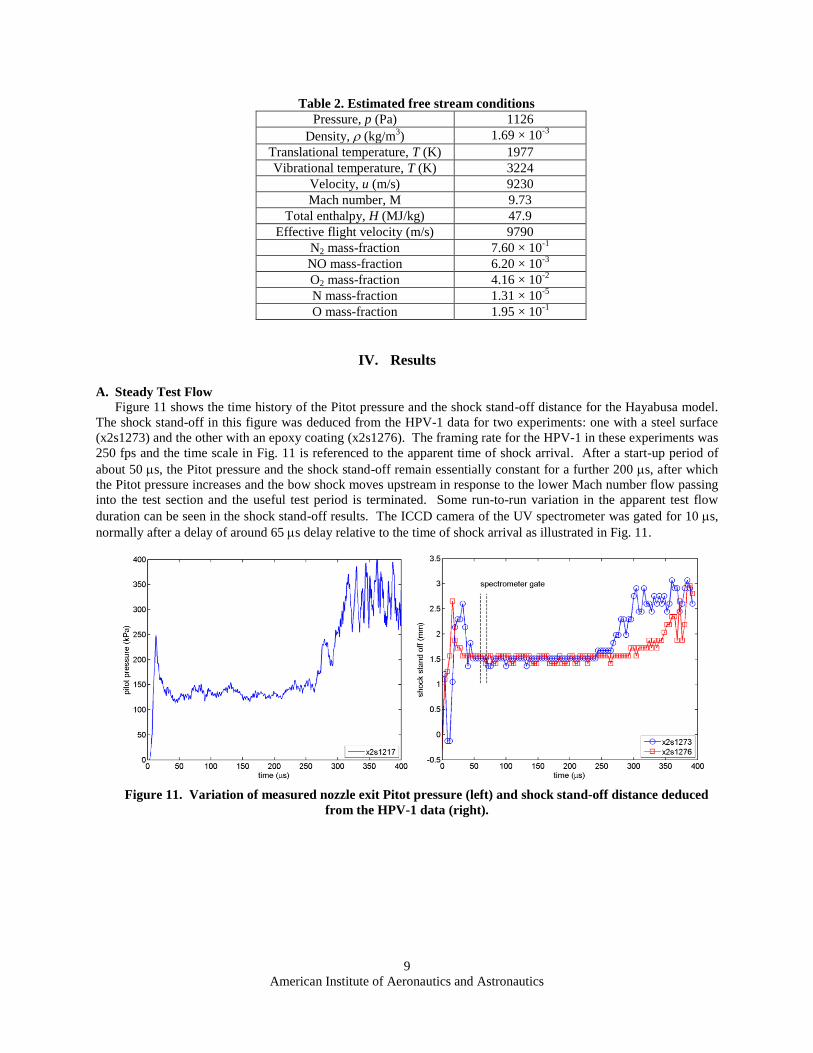
Figure 11 shows the time history of the Pitot pressure and the shock stand-off distance for the Hayabusa model.
The shock stand-off in this figure was deduced from the HPV-1 data for two experiments: one with a steel surface
(x2s1273) and the other with an epoxy coating (x2s1276). The framing rate for the HPV-1 in these experiments was
250 fps and the time scale in Fig. 11 is referenced to the apparent time of shock arrival. After a start-up period of
about 50 s, the Pitot pressure and the shock stand-off remain essentially constant for a further 200 s, after which
the Pitot pressure increases and the bow shock moves upstream in response to the lower Mach number flow passing
into the test section and the useful test period is terminated. Some run-to-run variation in the apparent test flow
duration can be seen in the shock stand-off results. The ICCD camera of the UV spectrometer was gated for 10 s,
normally after a delay of around 65 s delay relative to the time of shock arrival as illustrated in Fig. 11.
Figure 11. Variation of measured nozzle exit Pitot pressure (left) and shock stand-off distance deduced
from the HPV-1 data (right).
American Institute of Aeronautics and Astronautics
10
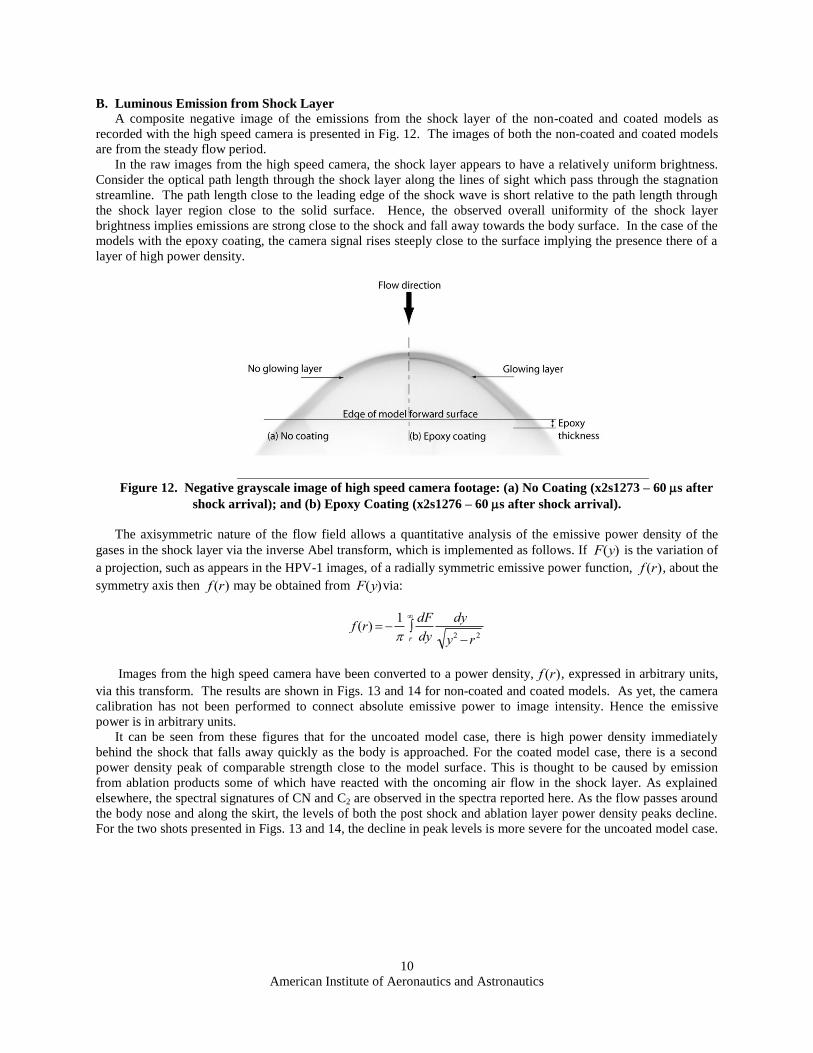
B. Luminous Emission from Shock Layer
A composite negative image of the emissions from the shock layer of the non-coated and coated models as
recorded with the high speed camera is presented in Fig. 12. The images of both the non-coated and coated models
are from the steady flow period.
In the raw images from the high speed camera, the shock layer appears to have a relatively uniform brightness.
Consider the optical path length through the shock layer along the lines of sight which pass through the stagnation
streamline. The path length close to the leading edge of the shock wave is short relative to the path length through
the shock layer region close to the solid surface. Hence, the observed overall uniformity of the shock layer
brightness implies emissions are strong close to the shock and fall away towards the body surface. In the case of the
models with the epoxy coating, the camera signal rises steeply close to the surface implying the presence there of a
layer of high power density.
Figure 12. Negative grayscale image of high speed camera footage: (a) No Coating (x2s1273 – 60 s after
shock arrival); and (b) Epoxy Coating (x2s1276 – 60 s after shock arrival).
The axisymmetric nature of the flow field allows a quantitative analysis of the emissive power density of the
gases in the shock layer via the inverse Abel transform, which is implemented as follows. If
F(y) is the variation of
a projection, such as appears in the HPV-1 images, of a radially symmetric emissive power function,
f (r), about the
symmetry axis then
f (r) may be obtained from
F(y)via:
f (r) 1
dF
dyr
dy
y2 r 2
Images from the high speed camera have been converted to a power density,
f (r), expressed in arbitrary units,
via this transform. The results are shown in Figs. 13 and 14 for non-coated and coated models. As yet, the camera
calibration has not been performed to connect absolute emissive power to image intensity. Hence the emissive
power is in arbitrary units.
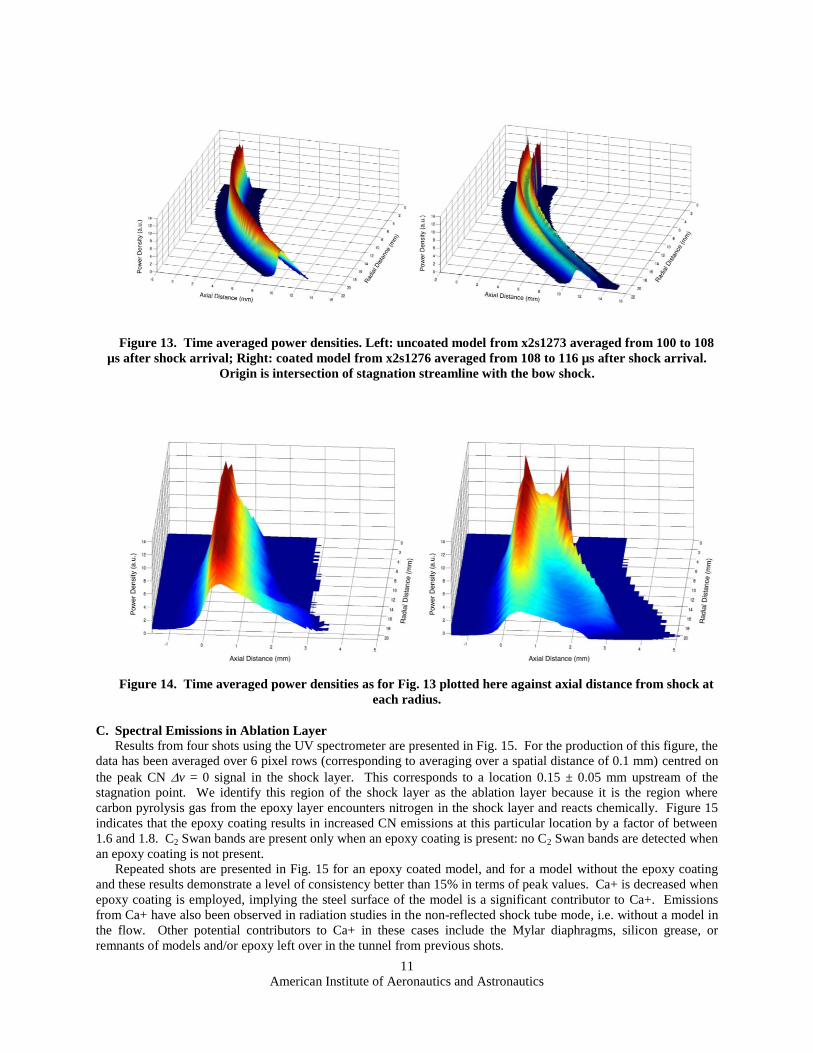
It can be seen from these figures that for the uncoated model case, there is high power density immediately
behind the shock that falls away quickly as the body is approached. For the coated model case, there is a second
power density peak of comparable strength close to the model surface. This is thought to be caused by emission
from ablation products some of which have reacted with the oncoming air flow in the shock layer. As explained
elsewhere, the spectral signatures of CN and C2 are observed in the spectra reported here. As the flow passes around
the body nose and along the skirt, the levels of both the post shock and ablation layer power density peaks decline.
For the two shots presented in Figs. 13 and 14, the decline in peak levels is more severe for the uncoated model case.
American Institute of Aeronautics and Astronautics
11
Figure 13. Time averaged power densities. Left: uncoated model from x2s1273 averaged from 100 to 108
µs after shock arrival; Right: coated model from x2s1276 averaged from 108 to 116 µs after shock arrival.
Origin is intersection of stagnation streamline with the bow shock.
Figure 14. Time averaged power densities as for Fig. 13 plotted here against axial distance from shock at
each radius.
C. Spectral Emissions in Ablation Layer
Results from four shots using the UV spectrometer are presented in Fig. 15. For the production of this figure, the
data has been averaged over 6 pixel rows (corresponding to averaging over a spatial distance of 0.1 mm) centred on
the peak CN v = 0 signal in the shock layer. This corresponds to a location 0.15 ± 0.05 mm upstream of the
stagnation point. We identify this region of the shock layer as the ablation layer because it is the region where
carbon pyrolysis gas from the epoxy layer encounters nitrogen in the shock layer and reacts chemically. Figure 15
indicates that the epoxy coating results in increased CN emissions at this particular location by a factor of between
1.6 and 1.8. C2 Swan bands are present only when an epoxy coating is present: no C2 Swan bands are detected when
an epoxy coating is not present.
Repeated shots are presented in Fig. 15 for an epoxy coated model, and for a model without the epoxy coating
and these results demonstrate a level of consistency better than 15% in terms of peak values. Ca+ is decreased when
epoxy coating is employed, implying the steel surface of the model is a significant contributor to Ca+. Emissions
from Ca+ have also been observed in radiation studies in the non-reflected shock tube mode, i.e. without a model in
the flow. Other potential contributors to Ca+ in these cases include the Mylar diaphragms, silicon grease, or
remnants of models and/or epoxy left over in the tunnel from previous shots.

American Institute of Aeronautics and Astronautics
12
Figure 15. Spectral radiance in ablation layer measured on centre line, 0.15 ± 0.05 mm upstream of
stagnation point with UV spectrometer using 150 line/mm grating. Spectrometer gated for the following
times relative to shock arrival: x2s1263 for 60 – 70 s; x2s1264 for 52 – 62 s; x2s1258 for 56 – 66 s; and
x2s1259 for 56 – 66 s.
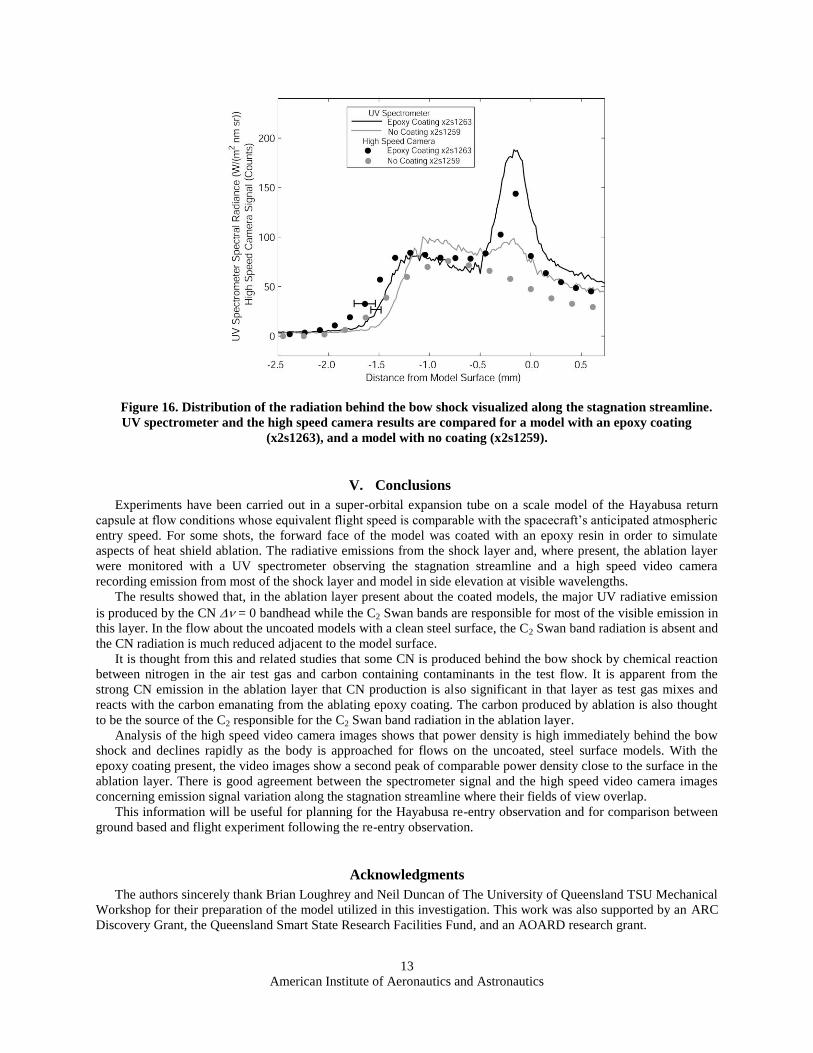
D. Comparison of Results from Spectrometer and High Speed Camera
Signal strength results from the spectrometer and the high speed camera (HPV-1) along the stagnation stream
line are compared in Fig. 16. The HPV-1 signals have been averaged along a single pixel row along the stagnation
streamline over of the images taken during the period in which the ICCD of the spectrometer was gated open: 56 –
66 μs from shock arrival for x2s1259 and 60 – 70 μs from shock arrival for x2s1263. The spectrographic data has
been averaged over 374 – 388 nm (corresponding to the CN v = 0 bandhead) as this is significantly more luminous
than any other part of the UV spectrum. The HPV-1 has a spectral response that is most sensitive to wavelengths
between 400 and 700 nm, but it does have some sensitivity to wavelengths between 350 and 400 nm. Therefore, it
is likely that the HPV-1 signal strength was affected by the emissions in the CN v = 0 bandhead since this is the
dominant feature in the emissions spectrum.
Approximately the same spatial variation is observed from the spectrometer and HPV-1 signals. The signal
peaks just behind the shock and decreases gradually towards model surface. In the case of the model with an epoxy
coating, the signal peaks again within the ablation layer and falls away towards the model surface. Uncertainties in
defining the spatial features in the data amount to ± 0.08 mm for the HPV-1 data, and ± 0.05 mm in UV
spectrometer data.
There are a number of differences between the signals from the two devices. The uncoated model case has a
small peak in the spectrometer signal near the model surface that is not present in the HPV-1 data and the ablation
peak for the coated model case is proportionally higher in the spectrometer signal. One factor contributing to
differences is that the averages are taken over different spectral ranges in this preliminary analysis.
The spectrometer data also imply that the shock standoff distance is approximately 10% greater for the coated
model case. The HPV-1 data is too coarsely resolved to discern whether or not it supports this result.
American Institute of Aeronautics and Astronautics
13
Figure 16. Distribution of the radiation behind the bow shock visualized along the stagnation streamline.
UV spectrometer and the high speed camera results are compared for a model with an epoxy coating
(x2s1263), and a model with no coating (x2s1259).
V. Conclusions
Experiments have been carried out in a super-orbital expansion tube on a scale model of the Hayabusa return
capsule at flow conditions whose equivalent flight speed is comparable with the spacecraft’s anticipated atmospheric
entry speed. For some shots, the forward face of the model was coated with an epoxy resin in order to simulate
aspects of heat shield ablation. The radiative emissions from the shock layer and, where present, the ablation layer
were monitored with a UV spectrometer observing the stagnation streamline and a high speed video camera
recording emission from most of the shock layer and model in side elevation at visible wavelengths.
The results showed that, in the ablation layer present about the coated models, the major UV radiative emission
is produced by the CN = 0 bandhead while the C2 Swan bands are responsible for most of the visible emission in
this layer. In the flow about the uncoated models with a clean steel surface, the C2 Swan band radiation is absent and
the CN radiation is much reduced adjacent to the model surface.
It is thought from this and related studies that some CN is produced behind the bow shock by chemical reaction
between nitrogen in the air test gas and carbon containing contaminants in the test flow. It is apparent from the
strong CN emission in the ablation layer that CN production is also significant in that layer as test gas mixes and
reacts with the carbon emanating from the ablating epoxy coating. The carbon produced by ablation is also thought
to be the source of the C2 responsible for the C2 Swan band radiation in the ablation layer.
Analysis of the high speed video camera images shows that power density is high immediately behind the bow
shock and declines rapidly as the body is approached for flows on the uncoated, steel surface models. With the
epoxy coating present, the video images show a second peak of comparable power density close to the surface in the
ablation layer. There is good agreement between the spectrometer signal and the high speed video camera images
concerning emission signal variation along the stagnation streamline where their fields of view overlap.
This information will be useful for planning for the Hayabusa re-entry observation and for comparison between
ground based and flight experiment following the re-entry observation.
Acknowledgments
The authors sincerely thank Brian Loughrey and Neil Duncan of The University of Queensland TSU Mechanical
Workshop for their preparation of the model utilized in this investigation. This work was also supported by an ARC
Discovery Grant, the Queensland Smart State Research Facilities Fund, and an AOARD research grant.
American Institute of Aeronautics and Astronautics
14
References 1Morgan, R. G., McIntyre, T. J., Buttsworth, D. R., Jacobs, P. A., Potter, D. F., Brandis, A. M, Gollan, R. J., Jacobs, C. M.,
Capra, B. R., McGilvray, M., Eichmann, T., “Impulse Facilities for the Simulation of Hypersonic Radiating Flows”, 38th fluid
Dynamics Conference and Exhibit, Seattle, Washington, 2008, AIAA-2008-4270. 2Morgan, R. G., McIntyre, T. J., Jacobs, P. A., Buttsworth, D. R., Macrossan, M. N., Gollan, R. J., Capra, B. R., Brandis, A.
M., Potter, D. F., Eichmann, T. N., Jacobs, C. M., McGilvray, M., Van Diem, D., Scott, M. P., “Impulse Facility Simulation of
Hypervelocity Radiating Flows”, in 2nd International Workshop on Radiation of High Temperature Gases in Atmospheric Entry,
Rome, 2006. 3D’Souza, M. G., Eichmann, T. N., Mudford, N. R., Potter, D. F., Morgan, R. G., McIntyre, T. J., Jacobs, P. A., “Observation
of an Ablating Surface in Expansion Tunnel Flow”, Submitted to AIAA Journal, 2009. 4Potter, D. F., Gollan, R. J., Eichmann, T., McIntyre, T. J., Morgan, R. G., Jacobs, P. A., “Simulation of CO2-N2 expansion
tunnel flows for the study of radiating shock layers”, 46th AIAA Aerospace Sciences Meeting and Exhibit, 2008, AIAA-2008-
1280. 5Potter, D. F., Eichmann, T., Brandis, A. M., Morgan, R. G., Jacobs, P. A., McIntyre, T. J., “Simulation of radiating CO2-N2
shock layer experiments at hyperbolic entry conditions” 40th Thermophysics Conference, Seattle, Washington, 2008, AIAA-
2008-3933.