Embed Size (px)
Citation preview

7/30/2019 expectations bulletin pack (5).pdf
http://slidepdf.com/reader/full/expectations-bulletin-pack-5pdf 1/31
Consumer
expectationsInflation & unemploymentexpectation chart pack.
January 2013

7/30/2019 expectations bulletin pack (5).pdf
http://slidepdf.com/reader/full/expectations-bulletin-pack-5pdf 2/31
Inflation expectations trending below 2%yr
4
5
6
7
4
5
6
7% ann% ann
trend median
0
1
2
3
0
1
2
3
Jan-97 Jan-01 Jan-05 Jan-09 Jan-13
2

7/30/2019 expectations bulletin pack (5).pdf
http://slidepdf.com/reader/full/expectations-bulletin-pack-5pdf 3/31
Carbon price boost small & temporary
4
56
7
4
56
7% ann% ann
CPI
professionals trendconsumers trend
Spike higher pre GST
introduction
A real inflation spike
Carbon price boost very
small
-1
0
1
2
3
-1
0
1
2
3
Jan-98 Jan-01 Jan-04 Jan-07 Jan-10 Jan-13
Sources: ABS, West ac Economics, Melbourne Institute
3

7/30/2019 expectations bulletin pack (5).pdf
http://slidepdf.com/reader/full/expectations-bulletin-pack-5pdf 4/31
There are less household expecting price rises
4
5
6
7
80
90
100
% ann%
CPI (rhs)
net balance (lhs)
Net balance average since
95
The net balance is the share of those who
think prices are rising less the share of those
thinking prices are falling.
-1
0
1
2
3
40
50
60
70
Jan-98 Jan-01 Jan-04 Jan-07 Jan-10 Jan-13
Sources: ABS, Westpac Economics, Melbourne Institute
4
7/30/2019 expectations bulletin pack (5).pdf
http://slidepdf.com/reader/full/expectations-bulletin-pack-5pdf 5/31
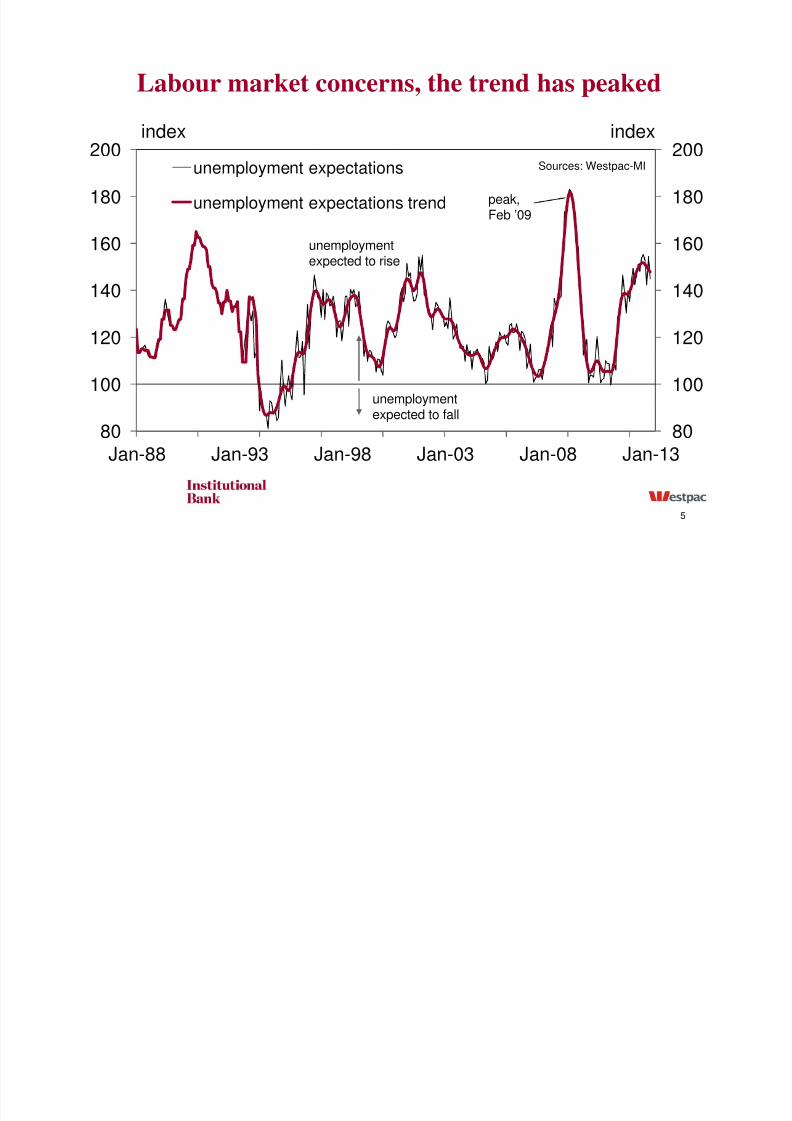
Labour market concerns, the trend has peaked
160
180
200
160
180
200indexindex
unemployment expectations
unemployment expectations trend
Sources: Westpac-MI
unemploymentexpected to rise
peak,Feb ’09
80
100
120
140
80
100
120
140
Jan-88 Jan-93 Jan-98 Jan-03 Jan-08 Jan-13
unemploymentexpected to fall
5

7/30/2019 expectations bulletin pack (5).pdf
http://slidepdf.com/reader/full/expectations-bulletin-pack-5pdf 6/31
…and point to a rising unemployment rate.
160
180
200
200
300
400
index
annual change in unemployment rate smoothed (lhs)
unemployment expectations trend (rhs)
bps
unemploymentrising
80
100
120
140
-200
-100
0
100
Jan-88 Jan-93 Jan-98 Jan-03 Jan-08 Jan-13
Sources: Westpac-MI
unemploymentfalling
6

7/30/2019 expectations bulletin pack (5).pdf
http://slidepdf.com/reader/full/expectations-bulletin-pack-5pdf 7/31
Unemploy. expect map lack of real jobs strength
100
150
200
250-60
-40
-20
bps tty
unemploy. expectations (lhs leading 4mths)
change in employ/pop ratio (rhs)
% long run averageSources: Westpac-MI, ABS
-150
-100
-50
0
500
20
40
Jan-95 Jan-99 Jan-03 Jan-07 Jan-11
7

7/30/2019 expectations bulletin pack (5).pdf
http://slidepdf.com/reader/full/expectations-bulletin-pack-5pdf 8/31
Unemp. exp. improving in a trend sense ...
0.5
1.0
1.5
2.0-30
-20
-10
0
% 3mth% invertedSources: Westpac-MI, ABS
*trend represented as deviation from 10 year average
-1.5
-1.0
-0.5
0.010
20
30
40
50Jan-99 Jan-03 Jan-07 Jan-11
unemploy. exp* (lhs leading 2mths)
trend full-time employ (rhs)
full-time employ(rhs)
8

7/30/2019 expectations bulletin pack (5).pdf
http://slidepdf.com/reader/full/expectations-bulletin-pack-5pdf 9/31
...suggesting the jobs market is still precarious.
1.0
1.5-40
-30
-20
-10
% 3mth% deviationSources: Westpac-MI, ABS* represented as deviation from full history average
-1.0
-0.5
0.0
.
10
20
30
40
50Jan-99 Jan-03 Jan-07 Jan-11
unemployment expectations trend* (lhsleading 2mths)
trend total employment (rhs)
total employment (rhs)
9

7/30/2019 expectations bulletin pack (5).pdf
http://slidepdf.com/reader/full/expectations-bulletin-pack-5pdf 10/31
Unemployment expect. track hours worked...
3.0
5.0
-50
-30
-10
% yr% long run averageSources: Westpac-MI, ABS
-5.0
-3.0
-1.0
.
10
30
50
Jan-95 Jan-99 Jan-03 Jan-07 Jan-11
unemploy. expectations (lhs leading 4mths)
hours worked %yr (rhs)
10

7/30/2019 expectations bulletin pack (5).pdf
http://slidepdf.com/reader/full/expectations-bulletin-pack-5pdf 11/31
...pointing to further near term weakness.
0.5
1.0
1.5-50
-40
-30
-20
-10
% 3mth% long run averageSources: Westpac-MI, ABS
-1.5
-1.0
-0.5
0.0010
20
30
40
50Jan-95 Jan-99 Jan-03 Jan-07 Jan-11
unemploy. expectations* (lhs leading 1mth)
trend hours worked (rhs)
11

7/30/2019 expectations bulletin pack (5).pdf
http://slidepdf.com/reader/full/expectations-bulletin-pack-5pdf 12/31
Job sentiment weakest in those working
120
130
140
150
120
130
140
150indexindex
working
unemploy/retired/not working
Long run average = 100
60
70
80
90
100
60
70
80
90
100
Jan-00 Jan-03 Jan-06 Jan-09 Jan-12
Sources: Westpac-MI
12

7/30/2019 expectations bulletin pack (5).pdf
http://slidepdf.com/reader/full/expectations-bulletin-pack-5pdf 13/31
Managers & professionals most worried
120
130
140
150
160
120
130
140
150
160indexindex
manager/prof
labourer/operator
paraprof/trades
sales/clerical
Unemployment expectations by occupation LR ave = 100
60
70
80
90
100110
60
70
80
90
100110
Jan-00 Jan-03 Jan-06 Jan-09 Jan-12
Sources: Westpac-MI
13

7/30/2019 expectations bulletin pack (5).pdf
http://slidepdf.com/reader/full/expectations-bulletin-pack-5pdf 14/31
Expectations now similar by sector
120
130
140
150
120
130
140
150indexindex
Primary Tertiary
Secondary Trade
Unemployment expectations by occupation LR ave = 100
60
70
80
90
100
60
70
80
90
100
Jan-00 Jan-03 Jan-06 Jan-09 Jan-12
Sources: Westpac-MI
14

7/30/2019 expectations bulletin pack (5).pdf
http://slidepdf.com/reader/full/expectations-bulletin-pack-5pdf 15/31
Males a touch more nervous than females
120
130
140
150
160
120
130
140
150
160indexindex
Male Female
Unemployment expectations by occupation LR ave = 100
60
70
80
90
100110
60
70
80
90
100110
Jan-00 Jan-03 Jan-06 Jan-09 Jan-12
Sources: Westpac-MI
15
7/30/2019 expectations bulletin pack (5).pdf
http://slidepdf.com/reader/full/expectations-bulletin-pack-5pdf 16/31
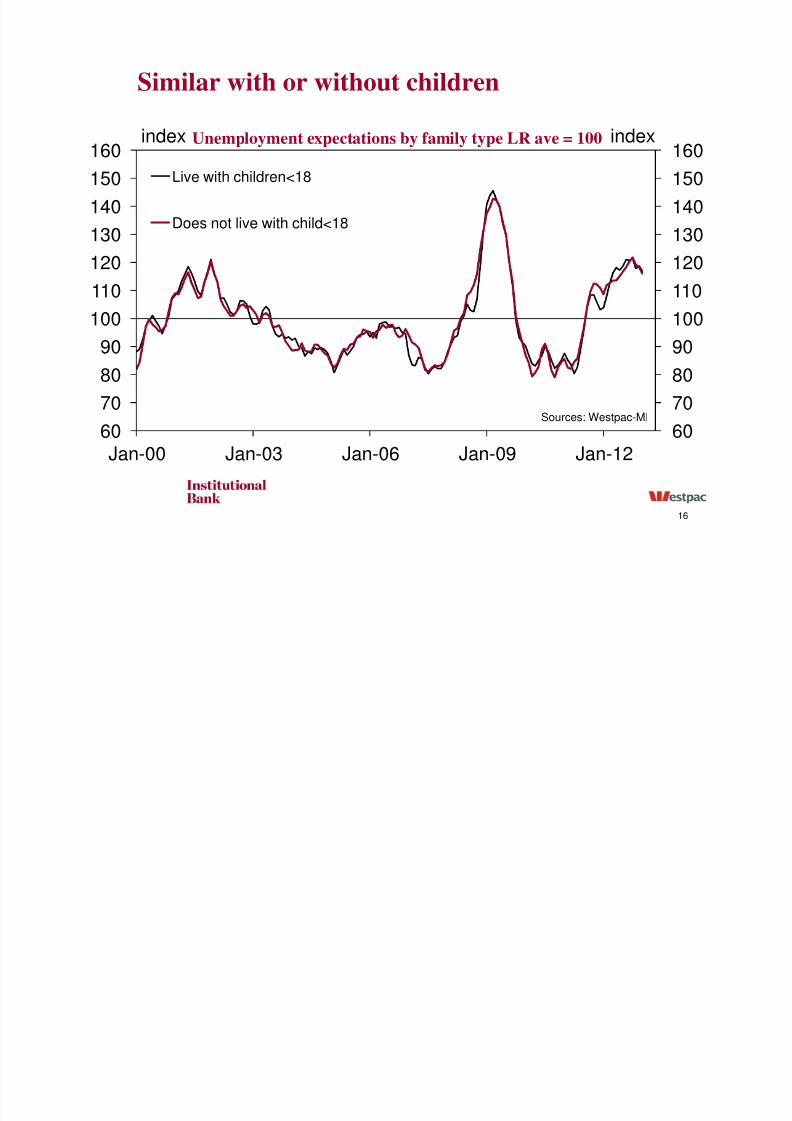
Similar with or without children
120
130
140
150
160
120
130
140
150
160indexindex
Live with children<18
Does not live with child<18
Unemployment expectations by family type LR ave = 100
60
70
80
90
100110
60
70
80
90
100110
Jan-00 Jan-03 Jan-06 Jan-09 Jan-12
Sources: Westpac-MI
16

7/30/2019 expectations bulletin pack (5).pdf
http://slidepdf.com/reader/full/expectations-bulletin-pack-5pdf 17/31
Tenants are now the most nervous
120
130
140
150
160
120
130
140
150
160indexindex
Tenant
Mortgagor
Owned
Unemployment expect by household type LR ave = 100
60
70
80
90
100110
60
70
80
90
100110
Jan-00 Jan-03 Jan-06 Jan-09 Jan-12
Sources: Westpac-MI
17

7/30/2019 expectations bulletin pack (5).pdf
http://slidepdf.com/reader/full/expectations-bulletin-pack-5pdf 18/31
As other cities deteriorate, Sydney improves…
120
130
140
150
160
120
130
140
150
160indexindex
Sydney
Melbourne
Remaining cities
Unemployment expectations by state LR ave = 100
60
70
80
90
100110
60
70
80
90
100110
Jan-00 Jan-03 Jan-06 Jan-09 Jan-12
Sources: Westpac-MI
18

7/30/2019 expectations bulletin pack (5).pdf
http://slidepdf.com/reader/full/expectations-bulletin-pack-5pdf 19/31
…as the labour market in WA unravels.
140
160
140
160
indexindex
NSW WA
Vic Qld
Unemployment expectations by state LR ave = 100
60
80
100
60
80
100
Jan-00 Jan-03 Jan-06 Jan-09 Jan-12
Sources: Westpac-MI
19

7/30/2019 expectations bulletin pack (5).pdf
http://slidepdf.com/reader/full/expectations-bulletin-pack-5pdf 20/31
No division between the city or country
120
130
140
150
120
130
140
150indexindex
Urban
Rural
Unemployment expectations by state LR ave = 100
60
70
80
90
100
60
70
80
90
100
Jan-00 Jan-03 Jan-06 Jan-09 Jan-12
Sources: Westpac-MI
20

7/30/2019 expectations bulletin pack (5).pdf
http://slidepdf.com/reader/full/expectations-bulletin-pack-5pdf 21/31
Level of job worries = an ongoing easing cycle
80
100
1200
100
200
300Index invert.bps
When unemployment expectations improve, theRBA tightens monetary policy
140
160
180
-500
-400
-300
-200-100
Dec-00 Dec-03 Dec-06 Dec-09 Dec-12
annual change in RBA cash rate (lhs)
forecasts
unemployment expectations trend (rhs)Source: Westpac-MI
When unemploymentexpectation deteriorate, theRBA eases monetary policy
21

7/30/2019 expectations bulletin pack (5).pdf
http://slidepdf.com/reader/full/expectations-bulletin-pack-5pdf 22/31
…as does the pace of change in expectations.
-48
-32
-16
00
100
200
300%yrbps
When unemployment expectationsimprove, the RBA tightens monetary policy
1632
48
64
80-500
-400
-300
-200-100
Dec-00 Dec-03 Dec-06 Dec-09 Dec-12
annual change in RBA cash rate (lhs)
forecasts
change in expectations (rhs)Source: Westpac-MI
When unemploymentexpectation deteriorate, the
RBA eases monetary policy
22

7/30/2019 expectations bulletin pack (5).pdf
http://slidepdf.com/reader/full/expectations-bulletin-pack-5pdf 23/31
Westpac Institutional Bank is a division of Westpac Banking Corporation ABN 33 007 457 141.Information current as at date above. This information has been prepared without taking account of your
objectives, financial situation or needs. Because of this you should, before acting on this information,
consider its appropriateness, having regard to your objectives, financial situation or needs. Westpac’sfinancial services guide can be obtained by calling 132 032, visiting www.westpac.com.au or visiting anyWestpac Branch. The information may contain material provided directly by third parties, and while suchmaterial is published with permission, Westpac accepts no responsibility for the accuracy orcompleteness of any such material. Except where contrary to law, Westpac intends by this notice toexclude liability for the information. The information is subject to change without notice and Westpac is
DisclaimerDisclaimer
later date. Westpac Banking Corporation is registered in England as a branch (branch number
BR000106) and is authorised and regulated by The Financial Services Authority. Westpac EuropeLimited is a company registered in England (number 05660023) and is authorised and regulated by TheFinancial Services Authority. If you wish to be removed from our e-mail, fax or mailing list please send ane-mail to [email protected] or fax us on +61 2 8254 6934 or write to Westpac Economics atLevel 2, 275 Kent Street, Sydney NSW 2000. Please state your full name, telephone/fax number and
company details on all correspondence. © 2011 Westpac Banking Corporation. Past performance is not areliable indicator of future performance. The forecasts given in this document are predictive in character.
Whilst every effort has been taken to ensure that the assumptions on which the forecasts are based arereasonable, the forecasts may be affected by incorrect assumptions or by known or unknown risks anduncertainties. The ultimate outcomes may differ substantially from these forecasts.
23

7/30/2019 expectations bulletin pack (5).pdf
http://slidepdf.com/reader/full/expectations-bulletin-pack-5pdf 24/31

7/30/2019 expectations bulletin pack (5).pdf
http://slidepdf.com/reader/full/expectations-bulletin-pack-5pdf 25/31
NSW full-time stronger than expectations
1.0
2.0-50
-40
-30
-20
-10
% 3mth% invertedSources: Westpac-MI, ABS
-2.0
-1.0
0.0010
20
30
40
50Dec-94 Dec-98 Dec-02 Dec-06 Dec-10
unemploy. exp* (lhs)
trend full-time employ (rhs)
*trend represented as deviation
from 10 year average
25

7/30/2019 expectations bulletin pack (5).pdf
http://slidepdf.com/reader/full/expectations-bulletin-pack-5pdf 26/31
NSW hours worked still quite weak
2.0
3.0
4.0
5.0
6.0-50
-40
-30
-20
-10
% yrunemploy. exp* (lhs leading 2 mths)
trend hours worked (rhs)
% invertedSources: Westpac-MI, ABS
-4.0
-3.0
-2.0
-1.0
0.01.00
10
20
30
40
50Nov-96 Nov-00 Nov-04 Nov-08 Nov-12
*trend represented as deviationfrom 10 year average
26

7/30/2019 expectations bulletin pack (5).pdf
http://slidepdf.com/reader/full/expectations-bulletin-pack-5pdf 27/31
Vic expectations now diverging from employ
1.0
2.0-50
-40
-30
-20
-10
% 3mth% invertedSources: Westpac-MI, ABS
*trend represented as deviationfrom 10 year average
-2.0
-1.0
0.0010
20
30
40
50Oct-97 Oct-01 Oct-05 Oct-09
unemploy. exp* (lhs leading 2 mths)
trend full-time employ (rhs)
27

7/30/2019 expectations bulletin pack (5).pdf
http://slidepdf.com/reader/full/expectations-bulletin-pack-5pdf 28/31
Vic hours weaker than expectations
3.0
4.0
5.0
6.0-50
-40
-30
-20
-10
% yr% invertedSources: Westpac-MI, ABS
*trend represented as deviationfrom 10 year average
-3.0
-2.0
-1.0
0.0
1.0
.
010
20
30
40
50Nov-96 Nov-00 Nov-04 Nov-08 Nov-12
unemploy. exp* (lhs leading 2 mths)
trend hours worked (rhs)
28

7/30/2019 expectations bulletin pack (5).pdf
http://slidepdf.com/reader/full/expectations-bulletin-pack-5pdf 29/31
Qld expectations still very weak
2.0
3.0-50
-40
-30
-20
-10
% 3mth% invertedSources: Westpac-MI, ABS
-1.0
0.0
1.0010
20
30
40
50Oct-98 Oct-02 Oct-06 Oct-10
unemploy. exp* (lhs leading 2 mths)
trend full-time employ (rhs)*trend represented as deviationfrom 10 year average
29

7/30/2019 expectations bulletin pack (5).pdf
http://slidepdf.com/reader/full/expectations-bulletin-pack-5pdf 30/31
Qld expectations still very weak
4.0
6.0
8.0-50
-40
-30
-20
-10
% yr
unemploy. exp* (lhs leading 3 mths)
trend hours worked (rhs)
% inverted
-4.0
-2.0
0.0
2.0010
20
30
40
50Dec-94 Dec-98 Dec-02 Dec-06 Dec-10
Sources: Westpac-MI, ABS
*trend represented as deviationfrom 10 year average
30

7/30/2019 expectations bulletin pack (5).pdf
http://slidepdf.com/reader/full/expectations-bulletin-pack-5pdf 31/31
WA expectations much weaker than jobs
1.0
2.0
3.0-50
-40
-30-20
-10
% 3mth% invertedSources: Westpac-MI, ABS
-3.0
-2.0
-1.0
0.01020
30
40
50
60Jul-98 Jul-02 Jul-06 Jul-10
unemploy. exp* (lhs leading 2 mths)
trend full-time employ (rhs)*trend represented as deviationfrom 10 year average
31