Embed Size (px)
Citation preview

Total commercial real estate returns expected to slowPAGE 58
Secondary and tertiary markets should become more attractive to investorsPAGE 54
Cap rate compression likely to reverse course
PAGE 33
Economy expected to grow in 2017
PAGE 15
E X P E C T A T I O N S & M A R K E T R E A L I T I E S I N R E A L E S T A T E 2 0 1 7
INTERSECTION OF GLOBAL CHANGE
Embracing a New Era

Expectations & Market Realities in Real Estate 2017— Intersection of Global Change: Embracing a New Era
© 2017 | Situs, RERC LLC, Deloitte Development LLC, NATIONAL ASSOCIATION OF REALTORS®. All Rights Reserved.
No part of this publication may be reproduced in any form electronically, by xerography, microfilm, or otherwise, or incorporated into any database or infor-mation retrieval system, without the written permission of the copyright owners.
Expectations & Market Realities in Real Estate 2017 is published by:
Situs5065 Westheimer RoadSuite 700EHouston, TX 77056
RERC LLC99 E. Bremer AvenueWaverly, IA 50677
Deloitte111 S. Wacker DriveChicago, IL 60606
NATIONAL ASSOCIATION OF REALTORS®430 North Michigan AvenueChicago, IL 60611
Disclaimer: This report is designed to provide general information in regard to the subject matter covered. It is sold with the understanding that the authors of this report are not engaged in rendering legal or accounting services. This report does not constitute an offer to sell or a solicitation of an offer to buy any securities, and the authors of this report advise that no statement in this report is to be construed as a recommendation to make any real estate investment or to buy or sell any security or as investment advice. The examples contained in the report are intended for use as background on the real estate industry as a whole, not as support for any particular real estate investment or security. Neither Situs, RERC LLC, Deloitte, nor NATIONAL ASSOCIATION OF REALTORS®(NAR), nor any of their respective directors, officers, and employees warrant as to the accuracy of or assume any liability for the information contained herein.
As used in this document, “Deloitte” refers to one or more of Deloitte Touche Tohmatsu Limited, a UK private company limited by guarantee, and its network of member firms, each of which is a legally separate and independent entity. Please see www.deloitte.com/about for a detailed description of the legal structure of Deloitte Touche Tohmatsu Limited and its member firms. Please see www.deloitte.com/us/about for a detailed description of the legal structure of Deloitte LLP and its subsidiaries. Certain services may not be available to attest clients under the rules and regulations of public accounting.

E X P E C T A T I O N S & M A R K E T R E A L I T I E S I N R E A L E S T A T E 2 0 1 7
INTERSECTION OF GLOBAL CHANGE: EMBRACING A NEW ERAD E LO I T T E | N AT I O N A L A S S O C I AT I O N O F R E A LTO R S ® | S I T U S R E R C ®

EXPECTATIONS & MARKET REALITIES IN REAL ESTATE 2017 | Intersection of Global Change: Embracing a New Era
4 | ©2017 Situs RERC®, Deloitte Development LLC, National Association of REALTORS®. All Rights Reserved.
SPONSORING FIRMS
Situs RERC®
Situs is the premier global provider of strategic business solutions for the finance and commercial real estate industries, trusted to evaluate, optimize, and manage critical assets and securities; from commercial and residen-tial real estate, to small and medium enterprise and consumer lending. Since 1985, Situs has set the standard in financial services for service, quality and execution. Based in Houston, TX, Situs has offices across the US, Europe and Asia and has been involved in more than $1 trillion of real estate debt and equity deals. A rated servicer with Moody’s, Fitch and Morningstar Credit Ratings, Situs has more than $160 billion of assets under management and is ranked a top 20 servicer in multiple categories by the Mortgage Bankers Association. In 2016, Situs received a second consecutive “Advisor of the Year” award by Real Estate Finance & Investment magazine, and the “Capital Advisor Firm of the Year” award by Property Investor Europe. In 2017, the firm won the “Industry Contributor of the Year” award from Real Estate Finance & Investment magazine.
Deloitte
Deloitte* is a recognized leader in providing audit, tax, consulting, and financial advisory services to the real estate industry. Our clients include top REITs, private equity investors, developers, property managers, lenders, bro-kerage firms, investment managers, pension funds, and leading homebuilding and engineering & construction companies. Deloitte Real Estate provides an integrated approach to assisting clients enhance property, portfolio, and enterprise value. We customize our services in ways to fit the specific needs of each player in a real estate transaction, from owners to investment advisors, from property management and leasing operators to insurance companies. Our multi-disciplinary approach allows us to provide regional, national and global services to our clients. Our real estate practice is recognized for bringing together teams with diverse experience and knowledge to provide customized solutions for all clients. Deloitte Real Estate in the United States comprises over 1,600 profes-sionals supporting real estate clients out of offices in 50 cities; key locations include Atlanta, Boston, Chicago, Dal-las, Denver, Houston, Los Angeles, Miami, New York, San Francisco, and Washington, D.C. Deloitte’s global Real Estate Services industry sector includes over 10,000 professionals located in excess of 50 countries.
NATIONAL ASSOCIATION OF REALTORS®
The NATIONAL ASSOCIATION of REALTORS®, “The Voice for Real Estate,” is America’s largest trade asso-ciation, rep- resenting over 1.2 million members involved in all aspects of the residential and commer-cial real estate industries. NAR membership includes brokers, salespeople, property managers, apprais-ers, counselors and others. Approximately 80,000 REALTORS® and Institute Affiliate members specialize in commercial brokerage and related services, and an additional 232,000 members offer commercial real estate services as a secondary business. The term REALTOR® is a registered collective membership mark that identifies a real estate professional who is a member of the NATIONAL ASSOCIATION of REALTORS® and subscribes to its strict Code of Ethics. Working for America’s property owners, the National Association provides a facility for professional development, research and exchange of information among its members and to the public and government for the purpose of preserving the free enterprise system and the right to own real property.
®
*As used in this document, “Deloitte” refers to one or more of Deloitte Touche Tohmatsu Limited, a UK private company limited by guarantee, and its network of member firms, each of which is a legally separate and independent entity. Please see www.deloitte.com/about for a detailed description of the legal structure of Deloitte Touche Tohmatsu Limited and its member firms. Please see www.deloitte.com/us/about for a detailed description of the legal structure of Deloitte LLP and its subsidiaries. Certain services may not be available to attest clients under the rules and regulations of public accounting.

EXPECTATIONS & MARKET REALITIES IN REAL ESTATE 2017 | Intersection of Global Change: Embracing a New Era
©2017 Situs RERC®, Deloitte Development LLC, National Association of REALTORS®. All Rights Reserved. | 5
FOREWORD
February 2017
Dear Readers,
Situs RERC, Deloitte, and the National Association of REALTORS® have once again partnered together to provide you with insight into the commercial real estate market. The year 2016 was certainly filled with surprises, but commercial real estate was able to withstand the external pressures and offer solid risk-adjusted returns. As many investors continue to take a more risk-averse approach, commercial real estate is expected to continue to provide a safe haven for investment in 2017.
The economy grew at a sluggish to moderate pace in 2016, and commercial real estate retreated from the active pace set in 2015. Transaction volumes were weak in the beginning of 2016, but gained momentum as the year progressed. Fundamentals were strong in 2016; increased demand for most property types led to low vacancy rates and rising rent growth. In 2017, commercial real estate growth is expected to be more moderate and even flat for some property types. According to Situs RERC institu-tional investment survey respondents, the market is fully-priced and a correction is looming. However, because of President Trump’s expected positive influence on economic growth, the correction is likely to be staved off for a couple more years.
As 2017 gets underway, it is increasingly evident that global uncertainty is the new normal. The implementation and execu-tion of Brexit, acts of terrorism and uncertainties surrounding the policies of the new presidential administration will keep investors on their toes in 2017. Navigating these waters will be a difficult task, but with this edition of Expectations & Market Realities in Real Estate 2017 – Intersection of Global Change: Embracing a New Era, we will provide you with analysis and insight to help you steer ahead.
We would like to extend our gratitude to all who contributed to this report. This includes the data providers, survey respon-dents, economists, researchers and analysts, and reviewers and business colleagues, without whom this report would not have been possible. We also would like to thank our clients, subscribers and consultants for their continued support of this annual publication.
Best wishes for a prosperous 2017.
Sincerely,
Lawrence Yun, PhD.Sr. Vice President, Chief Economist
NATIONAL ASSOCIATION OF REALTORS®
Matthew G. Kimmel, CRE, FRICS, MAIPrincipal & US Real Estate Services Leader
Deloitte Transactions and Business Analytics LLP
Kenneth P. Riggs, Jr., CFA, CRE, MAI, FRICSPresidentSitus RERC

EXPECTATIONS & MARKET REALITIES IN REAL ESTATE 2017 | Intersection of Global Change: Embracing a New Era
6 | ©2017 Situs RERC®, Deloitte Development LLC, National Association of REALTORS®. All Rights Reserved.
ACKNOWLEDGEMENTS
SPONSORING FIRMS & CHAIRS
Matthew G. Kimmel, CRE , FRICS, MAI Principal, Deloitte Transactions and Business Analytics LLPKenneth P. Riggs, Jr., CFA, CRE, MAI, FRICS President of Situs RERCLawrence Yun, PhD Chief Economist, NATIONAL ASSOCIATION OF REALTORS®
CONTRIBUTING AUTHORS
Todd J. Dunlap, MAI, MRICS, Senior Manager Deloitte Transactions and Business Analytics LLPJacey Heuer, Assistant Vice President Situs RERCKenneth W. Kapecki, CRE, FRICS, MAI, Director Deloitte Transactions and Business Analytics LLPSurabhi Kejriwal, Research Leader, Real Estate Deloitte Support Services India Pvt. Ltd.Lindsey Kuhlmann, Analyst Situs RERCMatt Lamers, Senior Consultant Deloitte Transactions and Business Analytics LLPSaurabh Mahajan, Research Leader, Real Estate Deloitte Support Services India Pvt. Ltd.Andy J. Miller, Senior Manager Deloitte Transactions and Business Analytics LLPJen Rasmussen, PhD, Assistant Vice President, Editor-in-Chief Situs RERCGeorge Ratiu, Director NATIONAL ASSOCIATION OF REALTORS®Ye Thway, CAIA, Senior CRE Financial Analyst Situs RERCNellie Tiggelaar, Consultant Deloitte Transactions and Business Analytics LLPMorgan Westpfahl, Director Situs RERC
DESIGN & LAYOUT
Justin Brewer, Associate SitusJeff Carr, Associate Situs RERC
OTHER DISTINGUISHED CONTRIBUTORS
Jeffrey Havsy CBRE Econometric AdvisorsRonald Johnsey Axiometrics, Inc.Robert Mandelbaum CBRE Hotels’ Americas ResearchRobert M. White Real Capital AnalyticsR. Mark Woodworth CBRE Hotels’ Americas Research

EXPECTATIONS & MARKET REALITIES IN REAL ESTATE 2017 | Intersection of Global Change: Embracing a New Era
©2017 Situs RERC®, Deloitte Development LLC, National Association of REALTORS®. All Rights Reserved. | 7
CONTENTS
1 | INTRODUCTION
Intersection of Global Change: Embracing a New Era...........................................................................................................................8
2 | THE ECONOMY
Likely to Pick Up Speed ...........................................................................................................................................................................14
3 | THE CAPITAL MARKETS
Anticipating Regulatory Change ............................................................................................................................................................22
4 | THE PROPERTY MARKETS
Cap Rates Expected to Stabilize .............................................................................................................................................................32
5 | SUMMARY & OUTLOOK
Changes Abound for Commercial Real Estate......................................................................................................................................52
SPONSORING FIRMS
................................................................................................................................................................................................................... 63

EXPECTATIONS & MARKET REALITIES IN REAL ESTATE 2017 | Intersection of Global Change: Embracing a New Era
8 | ©2017 Situs RERC®, Deloitte Development LLC, National Association of REALTORS®. All Rights Reserved.
1 INTRODUCTIONINTERSECTION OF GLOBAL CHANGE: EMBRACING A NEW ERA

EXPECTATIONS & MARKET REALITIES IN REAL ESTATE 2017 | Intersection of Global Change: Embracing a New Era
©2017 Situs RERC®, Deloitte Development LLC, National Association of REALTORS®. All Rights Reserved. | 9
INTERSECTION OF GLOBAL CHANGE: EMBRACING A NEW ERA
The year 2016 will be remembered as a year of surprises. When Situs RERC, Deloitte, and the National Association of REALTORS® (NAR) began to assemble this year’s issue of Expectations & Mar-ket Realities in Real Estate – Intersec-tion of Global Change: Embracing a New Era in the summer of 2016, global investors were still reeling from the U.K.’s vote to leave the European Union (EU) and the U.S. was in the midst of a contentious presidential election. Look-ing back at 2016, domestic and global shocks have played a profound role in the U.S. economy and the commercial real estate market.
Once the U.K. voted to leave the EU (commonly referred to as Brexit), there was initial panic in the financial and capital markets. However, in the months since then, panic has been replaced by a wait-and-see attitude by the major-ity of investors. Europe has become a debt-fueled economy due to low interest rates, inflation, and the continent’s con-siderable dependence on central banks’ stimulus for growth.
Other countries, including Japan and Switzerland, have adopted nega-tive interest rate policies to help spur growth. Meanwhile, China’s economic growth has moderated over the past year, but foreign investment in U.S. commercial real estate, including that from China, remains at high levels. President Trump’s plans for tax cuts, deregulation and big spending on infra-structure are expected to increase cash flow to the U.S. and allow companies to free up money for investment.
In the seventh year of the post-recession expansion, the U.S. economy contin-ued on an upward path of employment growth leading to additional income and increased confidence, which in turn boosted consumer spending. Pay-roll employment recorded a net increase of 2.0 million new positions during
the January to November 2016 period, according to the Bureau of Labor Statis-tics (BLS). Average weekly earnings of private employees rose by 2.0 percent by the third quarter of the year, compared to a year earlier. The unemployment rate remained flat at 4.9 percent in the first three quarters, and declined to 4.6 percent by November 2016, the lowest it had been since August 2007. In addi-tion, the housing market maintained momentum leading into the latter half of the year.
U.S. gross domestic product (GDP) growth started off the year slowly, but accelerated to an annual growth rate of 3.5 percent in third quarter 2016, though it slowed to 1.9 percent in fourth quarter, according to the Bureau of Economic Analysis (BEA). In February of 2016, the Dow Jones Industrial Average (DJIA) Index was down more than 10 percent for the year, and oil futures fell to $26.21 a barrel. However, by year end, the DJIA
Index had recovered all it had lost ear-lier in the year and was approaching the 20,000-point mark (according to data from the New York Stock Exchange) and oil was trading at more than $50 a barrel, per the U.S. Energy Information Administration.
As we look ahead to 2017, we expect global social, economic, political, and technological changes to continue to play an integral role in shaping invest-ment strategies. The symbiotic relation-ship between U.S. and foreign entities due to globalization will likely have a profound effect on investment for the foreseeable future. The current popu-list sentiment is expected to continue to shake up the political arena in the U.S. and abroad. Technology will play an ever more vital role in our day-to-day lives. The millennials now comprise the largest generation in the workforce, and their needs and desires will continue to greatly shape the way people live,

EXPECTATIONS & MARKET REALITIES IN REAL ESTATE 2017 | Intersection of Global Change: Embracing a New Era
10 | ©2017 Situs RERC®, Deloitte Development LLC, National Association of REALTORS®. All Rights Reserved.
work and play, now and in the future. All of these coalescing factors result in an investment environment that is very different from the cycles of the past.
In these turbulent times, it is impor-tant to remember that change can bring challenges, but it also affords new opportunities. Investors will need to be cognizant of the global changes ahead, and utilize research and insights, such as those presented in this report, as they embrace this new era. Our 2017 predictions for the economy, the capital markets and commercial real estate are presented in detail in Chapter 5 of this report.
Looking Ahead to 2017
A year ago, we forecasted that 2016 would be an “interesting” period for investors. In particular, we speculated that we would enter a new phase of the cycle where commercial real estate was fully-priced and where the asset class was considered mature. It was expected that
commercial real estate values, prices and returns would flatten. According to Real Capital Analytics, prices for most property types have reached or surpassed their pre credit-crisis highs. Although pricing remains a concern for institutional investors, Situs RERC’s value vs. price ratings remained stable through the first three quarters of 2016, with most experts believing that valu-ation levels support the existing prices in the market. Quarterly commercial real estate returns have been steadily declining since first quarter 2015, and annual returns were negative for the first three quarters of 2016, according to the National Council of Real Estate Investment Fiduciaries (NCREIF). Vol-umes also declined across all property sectors in 2016 compared to the previ-ous year, according to Real Capital Ana-lytics. However, given the large number of transactions in 2015, the pace of the drop in volumes in 2016 was expected.
Looking ahead to 2017, the commercial real estate market will likely continue to
offer solid risk-adjusted returns (please see Chapter 5 for an in-depth analy-sis of our forecasts). It is expected that the commercial real estate market will maintain strong fundamentals in 2017, and that commercial real estate values will continue to support prices. How-ever, the market is fully-priced and commercial real estate growth will be more measured than it was in 2016 and could be flat for certain property sec-tors. Commercial real estate will likely serve as a hedge against rising inflation because inflation can be passed along to tenants in the form of higher rents. However, investors should be cau-tious about rising interest rates while locked into long-term leases. The extent to which interest rate increases have already been priced into assets will determine how well future increases are tolerated. It is highly unlikely that investment in 2017 will be the same as in 2016, given the election of Donald Trump as president and the Federal Reserve’s indication it will continue to raise interest rates. These developments

EXPECTATIONS & MARKET REALITIES IN REAL ESTATE 2017 | Intersection of Global Change: Embracing a New Era
©2017 Situs RERC®, Deloitte Development LLC, National Association of REALTORS®. All Rights Reserved. | 11
are unleashing powerful forces which are expected to impact commercial real estate, along with the rest of the world and the global economy. This year’s report, Expectations & Market Reali-ties in Real Estate – Intersection of Global Change: Embracing a New Era, aims to help make sense of the turbu-lent political and economic climate.
In Chapter 2 of this report, we provide a look into the U.S. and global economies. We discuss primary components of the U.S. economy, trade statistics, employ-ment and demographic trends, and monetary policy.
While the U.S. economy grew at a tepid rate in the first half of 2016, third quarter GDP growth rebounded at an annual rate of 3.5 percent, although it slowed to 1.9 percent in fourth quar-ter, per the BEA. U.S. economic growth has been a bright spot among the global economies as the uncertainty caused by Brexit resulted in subdued growth for the U.K. and other developed eurozone
economies. Meanwhile, Asian econ-omies performed relatively well, although growth in China was more modest compared to previous years.
The U.S. economy benefitted in 2016 from employment and wage growth, increased consumer confidence and increased consumer spending. U.S. exports and federal government expen-ditures, which helped to boost the economy and corporate profits, began to accelerate in third quarter 2016 after a weak beginning of the year. Economic growth was due in large part to a gain of 2.0 million new jobs in 2016, and record post-recession wage growth, accord-ing to the BLS. The BLS reported that at approximately 2.0 percent, year-over-year (YOY) wage growth fueled demand in the residential real estate market; however, lack of supply in both new and existing housing resulted in large price increases. The price appreciation evi-dent in the residential real estate mar-ket has created affordability issues that are expected to continue into 2017.
Inflation remained below the Fed-eral Reserve’s target rate but moved upwards in 2016. Core inflation, which excludes food and energy, ranged between 2.1 percent and 2.3 percent throughout the year, per the BLS. With rising inflation, the Federal Reserve’s December 2016 interest rate increase of 0.25 percent was expected, and it is anticipated that 2017 will bring addi-tional rate increases.
In Chapter 3 of this report, we provide insight into the capital market environ-ment. Equity markets repeatedly set new record highs in 2016, the 10-year Treasury saw major swings, interest rates increased, the commercial mort-gage-backed securities (CMBS) market cooled off, and commercial real estate prices plateaued. Situs RERC’s analysis showed that the investment market for quality commercial real estate in the U.S. was roughly $3.75 trillion for debt-based institutional investment proper-ties and $2.85 trillion for equity-based institutional investment properties.

EXPECTATIONS & MARKET REALITIES IN REAL ESTATE 2017 | Intersection of Global Change: Embracing a New Era
12 | ©2017 Situs RERC®, Deloitte Development LLC, National Association of REALTORS®. All Rights Reserved.
The year 2016 proved to be a challeng-ing one for the CMBS market with activ-ity down and new risk retention rules causing a shake-up in the market. The outlook for 2017 is a bit foggy as con-cerns persist regarding the manner in which over $100 billion in matur-ing CMBS loans (according to Trepp) will be refinanced under the new risk retention rules. A bit of optimism was found in a handful of CMBS issuances that adopted the risk retention rules early, and the consensus is that these early CMBS issuances, which met the risk retention guidelines, were well accepted.
As we transition from 2016 to 2017, many investors and market participants are contemplating the actions the new presidential administration will take in its first year. As President Trump has indicated, a focus of the new admin-istration will be deregulation, which includes revamping the Dodd-Frank Act. Although a full-scale removal of the act is unlikely, President Trump has already ordered a review of the act, and it is likely that parts of the act will be reworked in an effort to reduce regulations. If deregulation continues to be a focus of the new administra-tion, it is likely that the newly-enacted
risk retention rules will be affected and high-volatility commercial real estate will be impacted. Additionally, the Financial Accounting Standards Board (FASB) has developed new guidelines geared toward revenue recognition, and the Protecting Americans from Tax Hike (PATH) Act saw many tax incen-tives extended into 2017 and beyond.
The lending environment continued to improve in 2016. Loan-to-value (LTV) ratios decreased to roughly 64 percent for the retail, industrial, hotel, and office sectors and to roughly 65 per-cent for the apartment sector, accord-ing to Real Capital Analytics. Situs RERC’s institutional investment sur-vey respondents indicated that under-writing standards and the availability of capital increased throughout 2016. In general, there is consensus that the trends seen in 2016 will continue into 2017. However, with a new Congress and new president in office, there are many unknowns as to how the lend-ing environment will react to any new changes levied by the government.
Chapter 3 also discusses in greater detail the expected outcomes of the new presidential administration, capital origination performance, the
lending environment, CMBS perfor-mance, actions initiated by the Fed-eral Open Market Committee (FOMC), and the effects of regulation through 2017.
Chapter 4 includes our highlights and expectations for the five major property sectors— office, industrial, retail, apart-ment, and hotel. Our analysis examines volume, pricing, transaction-based capitalization rates, vacancy/occu-pancy rates, absorption and comple-tions, and rental rates/revenues for the various property types.
According to Real Capital Analytics, the office sector endured a 7-percent YOY decline in the first nine months of 2016, with a major driver in office transac-tions being the absence of portfolio and entity-level sales in 2016. Investors and equity funds were the most active buy-ers in the office sector, per Real Capital Analytics. Commercial real estate was less active in 2016 than in 2015; how-ever, solid demand across most prop-erty types resulted in lower vacancies and rising rents.
The apartment sector experienced the most investment activity among the property sectors in 2016, according to

EXPECTATIONS & MARKET REALITIES IN REAL ESTATE 2017 | Intersection of Global Change: Embracing a New Era
©2017 Situs RERC®, Deloitte Development LLC, National Association of REALTORS®. All Rights Reserved. | 13
Real Capital Analytics. While the apart-ment sector recorded gains in deal vol-ume in the first nine months of 2016, the other property sectors posted declines in sales volume throughout 2016, rang-ing from a 7-percent YOY decrease for office sector transactions to a 41-percent YOY drop in hotel sector sales, per Real Capital Analytics. Despite the declines in sales, office fundamentals improved, leading to rising rents and expectations of stronger cash flow.
New technological and social trends continue to disrupt how people shop, although construction in the retail sec-tor continues to increase. Investors and developers should continue to be wary of where we are in the commercial real estate cycle.
Finally, in Chapter 5, we offer a sum-mary of the highlights of the report and our collective outlook for 2017. Although the full outlook can be found in Chapter 5, our major expectations for commercial real estate in 2017 are:
� Commercial real estate prices are expected to continue to plateau, particularly in larger markets.
� Commercial real estate volume is expected to slow moderately, par-ticularly in larger markets.
� Prices of commercial real estate in smaller markets are expected to continue to improve due to high demand and weak supply.
� Fundamentals are expected to continue to be positive and to improve for some property types, such as the office sector, which will help keep demand up.
� Foreign investment in commercial real estate will likely continue to rise.
� Many commercial real estate investors will continue their search for yield, moving into
infrastructure and niche assets, such as parking garages.
� Commercial real estate capitaliza-tion rates are expected to stabilize and to begin to rise, but spreads will likely remain healthy.
Last year in our annual Expectations & Market Realities in Real Estate 2016 – Navigating Through The Crosscur-rents, we predicted:
� Economic growth at a slow, but steady, pace.
� Employment growth, low gas prices, and increased consumer spending would lead the Federal Reserve to raise the federal funds rate.
� Major geopolitical events would rattle the investment environment.
� Commercial real estate would remain on solid footing.
As 2016 came to a close, these pre-dictions proved accurate. Although commercial real estate transactions and returns were lower than the his-torically high levels set in 2015, growth remained strong, with YOY returns of 9.22 percent as of third quarter 2016, according to the National Council of Real Estate Investment Fiduciaries Property Index (NPI), and rents were stable or increased across all property types. Using this as a backdrop to our 2017 report, let us dive into what lies ahead over the coming year.

EXPECTATIONS & MARKET REALITIES IN REAL ESTATE 2017 | Intersection of Global Change: Embracing a New Era
14 | ©2017 Situs RERC®, Deloitte Development LLC, National Association of REALTORS®. All Rights Reserved.
2 THE ECONOMYLIKELY TO PICK UP SPEED

EXPECTATIONS & MARKET REALITIES IN REAL ESTATE 2017 | Intersection of Global Change: Embracing a New Era
©2017 Situs RERC®, Deloitte Development LLC, National Association of REALTORS®. All Rights Reserved. | 15
LIKELY TO PICK UP SPEED
Global Perspectives
Global economies labored under clouds of uncertainty and moderate expectations during 2016 (see compar-ison of 2016 GDP by region in Exhibit 2-1)1. The first half of the year provided weak momentum to global economic growth, and the third quarter data resulted in further downgrades to expectations for the year. According to the International Monetary Fund (IMF), global growth was expected to post a 3.1-percent gain in 2016, mostly on the strength of Asian economies. Economic drag came from several quarters, including low commod-ity prices which hampered exporters around the world, the unexpected out-come of the U.K.’s referendum to leave the EU, as well as regional political and economic uncertainties.
Europe marked the year with slow economic growth, as most countries posted yearly advances in GDP of below 2.0 percent. The U.K. referendum deci-sion added further uncertainty, as the government and Parliament argued before the U.K. Supreme Court over procedural issues in regards to invok-ing Article 50 of the Lisbon Treaty. In turn, the U.K.’s GDP, which had grown at an annual rate of 1.8 percent in first quarter 2016, slowed to 0.5 percent by the third quarter, and was poised to close 2016 with a 2.3-percent annual gain, based on data from the Office for National Statistics.
Other developed eurozone econo-mies—Germany, France, Switzerland, and Italy—displayed modest eco-nomic conditions, with annual GDP growth confined in the 1.0-percent to 1.7-percent range. In a sign of underly-ing weakness, central banks engaged in further monetary easing, pushing short-term interest rates into negative
territory in Switzerland, Denmark and Sweden. The central monetary authori-ties in several additional EU countries kept rates at near zero.
Economic growth in the EU came mostly from peripheral countries dur-ing 2016. Spain’s GDP increased during the year, and was projected to close at an annual rate of 3.2 percent, despite an unemployment rate approaching 20.0 percent. Ireland’s GDP was estimated to record an annual rate of growth of 6.9 percent, with Poland’s economy projected to notch a 2.5-percent gain in GDP, and expectations for the Nether-lands GDP to reach a 2.4-percent rise.
Asian economies displayed com-paratively stronger economic activ-ity, although China’s transition into a more moderate growth pattern left an imprint in the region. As monetary pol-icy in China continued an accommo-dative stance, GDP growth remained on an upward trend and was expected
to grow at a 6.7-percent annual rate in 2016. India experienced favorable con-ditions during the year, even with the government’s sudden move to can-cel 500- and 1,000-rupee banknotes. While short-term currency liquidity proved a concern, GDP was expected to advance at 7.3 percent. Japan experi-enced slower growth, as evidenced by the Bank of Japan’s decision to resort to negative interest rates. Other Asian economies—Bangladesh, Philippines, Thailand, Indonesia, and South Korea among them—mirrored the relative strength of their largest neighbors, with GDP growth in a higher range: 2.6 percent through 7.1 percent.
In the Americas, economic trends were mixed. Canada and Mexico—linked through trade agreements with the U.S.—registered moderately positive economic growth. Brazil’s economic woes deepened into a recession, mir-rored by similar trends in Argentina and Venezuela. The economies of
0
1
2
3
4
5
6
7
8
MexicoIndia
Spain
Germany
France
Euro Area
Canada
Britain
JapanChina
United
States
Perc
ent
Exhibit 2-1. 2016 GDP Growth by Region
Sources: The Economist Intelligence Unit, 3Q 2016.
1 GDP growth estimates come from The Economist Intelligence Unit.

EXPECTATIONS & MARKET REALITIES IN REAL ESTATE 2017 | Intersection of Global Change: Embracing a New Era
16 | ©2017 Situs RERC®, Deloitte Development LLC, National Association of REALTORS®. All Rights Reserved.
Colombia and Chile remained slightly positive, at sub-2.0 percent GDP rates growth.
With the global perspective mired in uncertainty, modest U.S. economic growth reflected a silver lining. In the seventh year of the post-recession expansion, the U.S. economy contin-ued on a virtuous cycle of employment growth leading to additional income and increased confidence for many, which in turn boosted consumer spending. In addition, the housing market maintained momentum lead-ing into the latter half of the year. While commercial real estate investments in gateway metropolitan areas and large capitalization transactions faltered, transaction volume in secondary and tertiary markets accelerated, fueled by strengthening regional economies and property fundamentals. Absorp-tion remained positive, leading to declining vacancies and rising rents. However, from a broader perspective, investors were concerned about the current real estate cycle’s timing and duration.2
The U.S. Economy
While a cold winter hampered a strong start to 2016, the U.S. economy rebounded over the ensuing quarters. Based on data from the BEA, real GDP rose at an annual rate of 0.8 percent and 1.4 percent in the first and second quarters, respectively. Third quarter GDP accelerated, with a 3.2-percent rate of growth, a stronger pace than initially expected (see Exhibit 2-2).
The uptick in economic activity in 2016 was driven by continued increases in consumer spending, a double-digit jump in exports in the third quarter, and higher federal government expen-ditures. Improved optimism encour-aged personal consumption, and con-sumers increased their spending on automobiles, recreational vehicles and
goods, food and beverages in grocery stores, as well as transportation, hotel stays and restaurant meals.
As the consumer outlook became more upbeat throughout the year and resulted in higher spending, many corporations reported positive quar-terly earnings. After a dip in the first part of the year, real corporate prof-its after taxes reached $1.6 trillion by the third quarter of 2016, based on data from the BEA. However, compa-nies remained cautious, as evidenced by weak nonresidential fixed invest-ment. Businesses cut back on invest-ments in equipment in 2016, especially industrial and transportation equip-ment. According to the BEA, Invest-ment in commercial real estate picked up noticeably during the year, from a negligible 0.09-percent increase in the first quarter to a 10.1-percent jump by third quarter 2016, as property devel-opers took advantage of low costs and higher availability of capital. Spending on intellectual property products such as software and research and devel-opment (R&D), increased throughout
-10
-8
-6
-4
-2
0
2
4
6
3Q 2016
3Q 2015
3Q 2014
3Q 2013
3Q 2012
3Q 2011
3Q 2010
3Q 2009
3Q 2008
3Q 2007
Perc
ent
Exhibit 2-2. Quarterly GDP Growth in U.S.
Source: BEA, 3Q 2016.
2 Conclusions in this paragraph based on data from: BEA, BLS, The Conference Board, Real Capital Analytics, and CBRE Econometric Advisors.

EXPECTATIONS & MARKET REALITIES IN REAL ESTATE 2017 | Intersection of Global Change: Embracing a New Era
©2017 Situs RERC®, Deloitte Development LLC, National Association of REALTORS®. All Rights Reserved. | 17
the year. Investments in residential real estate started off with a 7.8-per-cent increase in first quarter 2016, but declined in subsequent quarters, per the BEA.
Adding wind to the economic sails, international trade accelerated in 2016. Exports increased in the second and third quarters, buoyed by manufactur-ing. With a double-digit rate of growth in third quarter 2016, exports outpaced import advances, supporting a positive trade balance.
As a significant contributor to GDP, government spending rose during most of 2016, as the federal govern-ment increased non-defense spending in each of the first three quarters. In addition, defense spending increased in third quarter, providing a slight boost to GDP. However, many state and local governments cut back spend-ing due to declines in infrastructure investments.
Employment Trends
Employment trends underscored the economic rebound, as evidenced by quarterly advances throughout the year. Payroll employment recorded a net increase of 2.0 million new posi-tions during the January 2016 to November period, according to the BLS, and average weekly earnings of private employees rose by 2.0 percent by the third quarter of the year com-pared to a year earlier.
Employment in private service-pro-viding industries remained the growth engine for jobs, with 1.8 million net new jobs in the first 11 months of 2016, based on data from the BLS. Within the service industries, the education and health sectors posted the highest number of net new jobs (518,000), fol-lowed closely by net new jobs in profes-sional and business services (511,000). With financial services having added 145,000 new positions, demand for office space remained on an upward
curve. In addition, as consumers gained confidence and opened their wallets a little wider, the retail trade added 216,000 net new positions. Rein-forced by gains in travel, leisure and hospitality, companies increased their payrolls by 258,000 new positions. With positive demand for industrial warehouses, transportation and ware-housing employment gained 44,100 new positions, while wholesale trade employment rose by 48,400 jobs.
The positive growth in service indus-tries outshone the employment land-scape for goods-producing industries, which posted a modest 32,000 net new jobs by the end of November 2016, according to the BLS. The employment gains of 107,000 new jobs in construc-tion companies were outpaced by the 139,000 jobs lost in manufacturing, mining and logging.
The unemployment rate remained flat at 4.9 percent in the first three quar-ters, and declined to 4.6 percent by November 2016, the lowest level since August 2007, per the BLS. The average duration of unemployment declined from 29 weeks in January 2016 to 26
weeks in November2016. In addition, the labor force participation (LFP) rate stayed mostly flat during 2016, despite slight monthly shifts at 62.7 percent, according to the BLS (see Exhibit 2-3). The LFP rate has been steadily declin-ing from its high of 67.1 percent during 1998 through 2000. Before the Great Recession, the LFP rate was 65.9 per-cent. As of November 2016, there were 95.1 million Americans out of the labor
4
5
6
7
8
9
10
11
20162015
20142013
20122011
20102009
20082007
Perc
ent
Exhibit 2-3. Historical Unemployment Rates
Source: BLS, November 2016.

EXPECTATIONS & MARKET REALITIES IN REAL ESTATE 2017 | Intersection of Global Change: Embracing a New Era
18 | ©2017 Situs RERC®, Deloitte Development LLC, National Association of REALTORS®. All Rights Reserved.
force. Changing demographics such as the rising wave of retiring Baby Boomers, coupled with the 2.5 million marginally-attached and discouraged workers, are expected to lower the LFP rate and add drag to long-term eco-nomic growth. For a historical look at unemployment and LFP, see Exhibits 2-3 and 2-4, respectively.
The upward momentum in employ-ment was echoed by the consumer confidence figures during 2016. By November, the Conference Board’s Index advanced to 107.1, its highest value since second quarter 2007. Sepa-rately, the Consumer Sentiment Index compiled by the University of Michi-gan rebounded from 91.6 in first quar-ter 2016 to 93.8 in November.
Housing
Residential real estate was character-ized by tight inventory in 2016, with the supply of both new and existing homes
in a narrow range. The historical sup-ply equilibrium of existing homes aver-aged about 6 to 7 months, according to the National Association of REAL-TORS®. In comparison, during 2016, the months’ supply has been in the four- to five-month range for the nation (see
Exhibit 2-5); supply has been less than three months for several metro areas.
Weak housing starts, which averaged an annual rate of about 780,000 in the first 10 months of 2016, according to the Census Bureau, have certainly
2
4
6
8
10
12
14
20162015
20142013
20122011
20102009
20082007
Mon
ths
Exhibit 2-5. Total Supply of Existing Homes (Months)
Source: National Association of REALTORS®, October 2016.
62
63
64
65
66
67
68
20162015
20142013
20122011
20102009
20082007
20062005
20042003
20022001
2000
Perc
ent
Exhibit 2-4. Historical Labor Force Participation Rate
Source: BLS, November 2016.

EXPECTATIONS & MARKET REALITIES IN REAL ESTATE 2017 | Intersection of Global Change: Embracing a New Era
©2017 Situs RERC®, Deloitte Development LLC, National Association of REALTORS®. All Rights Reserved. | 19
contributed to the housing short-age. New home sales averaged a pal-try 560,000 homes during the first 10 months of 2016 and household formation—a key driver of housing demand—returned to its long-run average of 1.3 million new households during 2016, boosted by employment gains, based on data from the Census Bureau.
New home sales reached an annual rate of 592,000 in 2016 (see Exhibit 2-6) while existing home sales reached an annual rate of 5.6 million by Octo-ber of 2016, according to the National Association of REALTORS® (see Exhibit 2-7). The gap between rising demand and low supply has led to noticeable increases in home prices. The median price of existing homes reached
$232,200 in October 2016 (see Exhibit 2-8), per the National Association of REALTORS®, a 6.0-percent increase YOY.
Compounded by the 5.7-percent and 6.8-percent advances in 2014 and 2015, respectively, the price appreciation
has led to decreased affordability in a growing number of markets, according to the National Association of REAL-TORS®. With wages rising at a rate slightly above 2.0 percent, the afford-ability squeeze is expected to continue in 2017, with the number of first-time buyers again near historic lows.
200
300
400
500
600
700
800
900
1000
20162015
20142013
20122011
20102009
20082007
Sale
s (T
hous
ands
)
Exhibit 2-6. New Single Family Home Sales
Source: U.S. Census Bureau, December 2016.
3.0
3.5
4.0
4.5
5.0
5.5
6.0
20162015
20142013
20122011
20102009
20082007
Sale
s (M
illio
ns)
Exhibit 2-7. Existing Home Sales
Source: National Association of REALTORS®, December 2016.

EXPECTATIONS & MARKET REALITIES IN REAL ESTATE 2017 | Intersection of Global Change: Embracing a New Era
20 | ©2017 Situs RERC®, Deloitte Development LLC, National Association of REALTORS®. All Rights Reserved.
Inflation and Monetary Policy
Inflation showed signs of upward movement during 2016 (see Exhibit 2-9). The headline inflation figure remained below the Federal Reserve’s 2.0-percent target, but increased, espe-cially in the latter half of the year. Core inflation—which excludes food and energy—spent most of the year, in a narrow range of 2.1 percent to 2.3 per-cent based on data from the BLS. The cost of housing (both rent and own-ers’ equivalent rent) comprises about a third of the Consumer Price Index (CPI), the main measure of inflation.
With housing costs on a solid upswing in 2016, the pressure on inflation has built up through the year.
With employment figures improv-ing and inflation moving upward, the Federal Reserve’s decision to raise the
federal funds target rate by 0.25 per-cent at the FOMC’s meeting did not come as a surprise (see Exhibit 2-10). It was the second rate hike in a decade, and reflected the Federal Reserve’s increased confidence in the economic outlook. Chairwoman Janet Yellen
-3
-2
-1
0
1
2
3
4
5
6
20162015
20142013
20122011
20102009
20082007
Perc
ent
CPI All Items
Core CPI
Exhibit 2-9. Upward Movement in Inflation
Source: Federal Reserve Board, December 2016.
150
160
170
180
190
200
210
220
230
240
250
20162015
20142013
20122011
20102009
20082007
Pric
e ($
Tho
usan
ds)
Exhibit 2-8. Existing Home Prices
Source: National Association of REALTORS®, December 2016.

EXPECTATIONS & MARKET REALITIES IN REAL ESTATE 2017 | Intersection of Global Change: Embracing a New Era
©2017 Situs RERC®, Deloitte Development LLC, National Association of REALTORS®. All Rights Reserved. | 21
had signaled the move during preced-ing FOMC meetings in 2016, using the forward guidance approach to inform markets. In addition, the FOMC also noted in their December meeting their intention to further raise the rate sev-eral times in 2017.
Longer-dated bond yields rose after the presidential election on the markets’ expectations of positive regulatory changes in 2017. The FOMC’s Decem-ber decision added additional fuel to the yield’s upward march. The 10-year Treasury yield is expected to close in on 3.0 percent in 2017, and to an even higher figure in 2018, based on a fore-cast from the National Association of REALTORS®. 0
1
2
3
4
5
6
20162015
20142013
20122011
20102009
20082007
Perc
ent
10-Year Treasury Yield
Federal Funds Target Rate
Exhibit 2-10. 10-Year Treasury Note Yield and Federal Funds Rate Comparison
Source: Federal Reserve Board, December 2016.

EXPECTATIONS & MARKET REALITIES IN REAL ESTATE 2017 | Intersection of Global Change: Embracing a New Era
22 | ©2017 Situs RERC®, Deloitte Development LLC, National Association of REALTORS®. All Rights Reserved.
3 THE CAPITAL MARKETSANTICIPATING REGULATORY CHANGE

EXPECTATIONS & MARKET REALITIES IN REAL ESTATE 2017 | Intersection of Global Change: Embracing a New Era
©2017 Situs RERC®, Deloitte Development LLC, National Association of REALTORS®. All Rights Reserved. | 23
ANTICIPATING REGULATORY CHANGE
The year 2016 was a year of uncer-tainty and transition in the capital and financial markets. Like an unpredict-able roller coaster ride, major events like the U.K.’s Brexit decision and the U.S. presidential election sent ripples through the financial world. Investors witnessed ups when they expected downs, and experienced downs when an up market may have been more understandable.
The initial panic following Brexit resulted in large sell-offs in the equity markets, but as time passed, markets realized the initial impact of Brexit was not as dire as first expected. Even now, months after the populist vote to leave the EU, details of the transi-tion are still unknown. The U.K. faces some obstacles in enacting Article 50 of the Lisbon Treaty and officially begin-ning the process of separation from the rest of the EU. The U.K.’s Supreme Court recently decided that Parliament must give approval in order for Article 50 to be triggered. However, the bill is expected to pass both houses of Parlia-ment and negotiations are expected to begin in March 2017.
The U.S. presidential election gener-ated some short-lived chaos in the equity markets as well, but since the election, equity markets have been on a tear as markets continue to set new record highs. Expectations that the Trump administration will pursue pro-growth policies have been a catalyst for the run in the equity markets since Election Day, and the DJIA Index sur-passed the 20,000-mark shortly after President Trump was inaugurated. The S&P 500 and Nasdaq also recorded new highs. Although the exact details of many of President Trump’s policies are uncertain, many companies in the construction, banking and phar-maceutical industries have seen sig-nificant positive movements in value as speculation on some of the initial
policy proposals have been discussed. Increased infrastructure spending, reduced regulation and reduced taxa-tion have been indicated as potential areas of focus as the new administra-tion begins to implement its policies.
These expected changes contributed to higher 10-year Treasury rates, which jumped to over 2.0 percent directly after the presidential election, per the U.S. Treasury Department. Although rates reached record lows of less than 1.4 percent following the Brexit refer-endum in June, rates began trending upward during the months following Brexit.
Through this uncertainty, commer-cial real estate has proven itself as a solid performer. While many factors influence the performance of com-mercial real estate, it is the tangible nature of this asset class, along with its relative stability and the ability of rents to adapt to changes in inflation, that make this asset class attractive. Concerns about the commercial real estate market reaching a tipping point
have been present throughout 2016. The Moody’s/RCA CPPI Index showed that major property types saw YOY price growth throughout 2016, with prices rising above their pre-reces-sion peaks and setting new records in many cases. The apartment, retail and industrial property sectors averaged YOY price growth of 12.20 percent, 9.24 percent and 5.57 percent, respec-tively, in 2016.
According to transaction volume data provided by Real Capital Analytics, total transaction volumes pulled back in 2016 after record levels were reached during fourth quarter 2015. Trans-action volume in the industrial and apartment sectors peaked at $27 bil-lion and $52.8 billion, respectively, in fourth quarter 2015, according to Real Capital Analytics, while total transac-tion volume was down approximately 2 percent YOY during third quarter 2016. However, apartment sector volume increased approximately 7 percent YOY to $36.8 billion in third quarter 2016. Since the end of 2015, transaction volumes have generally plateaued with

EXPECTATIONS & MARKET REALITIES IN REAL ESTATE 2017 | Intersection of Global Change: Embracing a New Era
24 | ©2017 Situs RERC®, Deloitte Development LLC, National Association of REALTORS®. All Rights Reserved.
the exception of the apartment sector. With the plateau in transaction vol-umes, value and price may be reaching equilibrium.
Situs RERC’s third quarter 2016 insti-tutional investment survey respon-dents gave commercial real estate overall a value vs. price rating of 4.9 on a scale of 1 to 10, with 5 indicating value equals price, and 10 indicating value greatly outweighs price. With ratings just below 5.0 throughout all of 2016, respondents considered values nearly equal to prices. Additionally, according to Situs RERC’s third quarter 2016 institutional investment survey results, investors continued to prefer commercial real estate over alterna-tive investments. Survey respondents gave commercial real estate a rating of 6.4 on a scale of 1 to 10, with 10 being excellent, in third quarter 2016 (see Exhibit 3-1). While stocks remained the second-best investment option at 5.3, cash, with a rating of 4.8, was not too far behind. With a rating of 3.3, bonds were considered the least attractive investment option. Commercial real estate has consistently been rated as the best investment option since the beginning of 2010.
However, with the current pickup in the equity markets and the spike in the 10-year Treasury rate brought on by a sell-off in the bond market, invest-ment allocations will likely be a point of focus in 2017 as investors decide between the stability of commercial real estate and the more risk-on nature of the equity markets. The Urban Land
Institute (ULI) Real Estate Consensus Forecast survey indicates that inves-tors feel commercial real estate mar-kets will continue to cool off over the next couple years, and reach a turning point sometime in 2018 or 2019. Trans-action volumes are expected to decline through 2017, reaching $428 billion in 2018. Total returns across all property types are expected to fall to approxi-mately 6 percent by 2018, and prices are forecasted to grow at a declining pace through 2017, ultimately reaching 2.5-percent price growth in 2018.
Foreign investment in the U.S. com-mercial real estate market was $66 billion as of November 2016, down roughly 22 percent YOY, per Real Capi-tal Analytics. This is consistent with the slowdown seen in transaction vol-umes across all property sectors. In 2016, China, Canada and Germany were the top countries investing in the U.S., and the majority of investment, based on transaction volumes, went to the New York City, Los Angeles and San Francisco markets. There was an increase in foreign investment in U.S. commercial real estate following the Brexit decision, but it is unknown how
3
4
5
6
7
8
3Q 2016
1Q 2016
3Q 2015
1Q 2015
3Q 2014
1Q 2014
3Q 2013
1Q 2013
3Q 2012
1Q 2012
3Q 2011
1Q 2011
3Q 2010
1Q 2010
3Q 2009
1Q 2009
3Q 2008
Ratin
g
Stocks
Bonds
Commercial Real Estate
Cash
Exhibit 3-1. Situs RERC Historical Ratings of Investment Alternatives
Source: Situs RERC, 3Q 2016.
EXPECTATIONS & MARKET REALITIES IN REAL ESTATE 2017 | Intersection of Global Change: Embracing a New Era
©2017 Situs RERC®, Deloitte Development LLC, National Association of REALTORS®. All Rights Reserved. | 25
much of this can be directly attribut-able to Brexit.
According to Real Capital Analytics, the 2017 outlook for foreign invest-ment is mixed. The U.S. will likely still be considered a safe haven for invest-ment as global economic and geopolit-ical concerns persist in 2017. However, if the dollar continues to strengthen and interest rates rise, the high cost of investing in the U.S. will likely place downward pressure on foreign investment.
Capital Originations
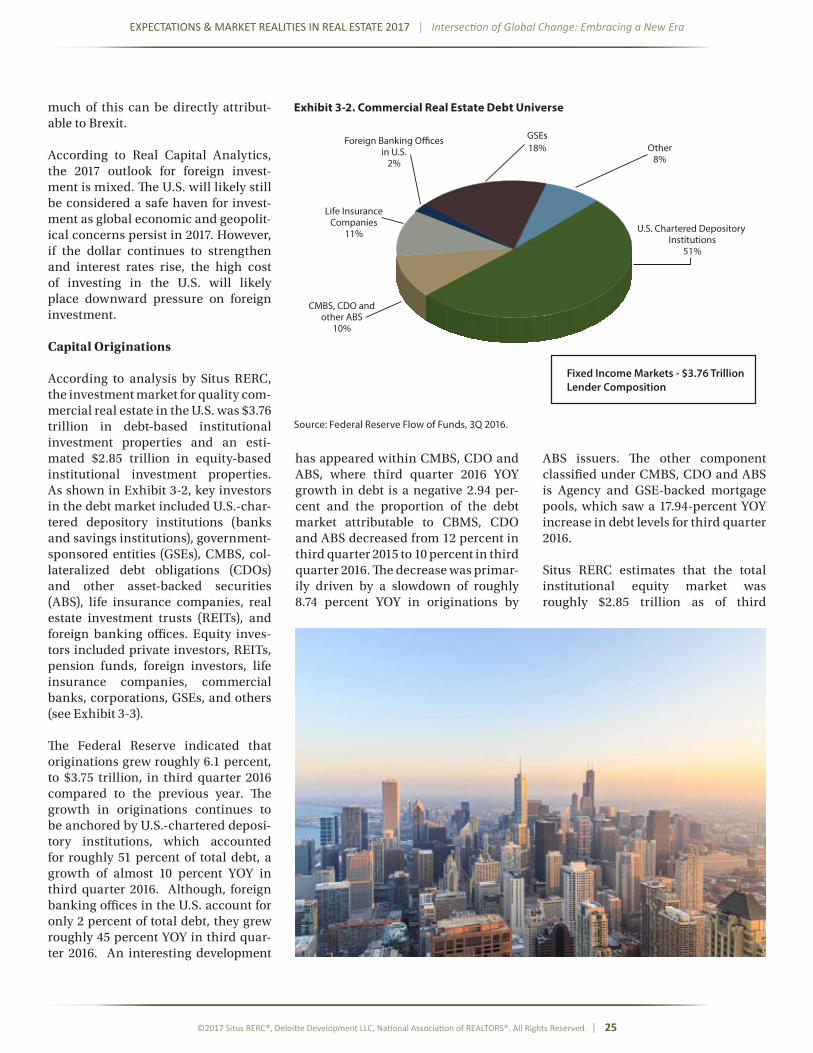
According to analysis by Situs RERC, the investment market for quality com-mercial real estate in the U.S. was $3.76 trillion in debt-based institutional investment properties and an esti-mated $2.85 trillion in equity-based institutional investment properties. As shown in Exhibit 3-2, key investors in the debt market included U.S.-char-tered depository institutions (banks and savings institutions), government-sponsored entities (GSEs), CMBS, col-lateralized debt obligations (CDOs) and other asset-backed securities (ABS), life insurance companies, real estate investment trusts (REITs), and foreign banking offices. Equity inves-tors included private investors, REITs, pension funds, foreign investors, life insurance companies, commercial banks, corporations, GSEs, and others (see Exhibit 3-3).
The Federal Reserve indicated that originations grew roughly 6.1 percent, to $3.75 trillion, in third quarter 2016 compared to the previous year. The growth in originations continues to be anchored by U.S.-chartered deposi-tory institutions, which accounted for roughly 51 percent of total debt, a growth of almost 10 percent YOY in third quarter 2016. Although, foreign banking offices in the U.S. account for only 2 percent of total debt, they grew roughly 45 percent YOY in third quar-ter 2016. An interesting development
has appeared within CMBS, CDO and ABS, where third quarter 2016 YOY growth in debt is a negative 2.94 per-cent and the proportion of the debt market attributable to CBMS, CDO and ABS decreased from 12 percent in third quarter 2015 to 10 percent in third quarter 2016. The decrease was primar-ily driven by a slowdown of roughly 8.74 percent YOY in originations by
ABS issuers. The other component classified under CMBS, CDO and ABS is Agency and GSE-backed mortgage pools, which saw a 17.94-percent YOY increase in debt levels for third quarter 2016.
Situs RERC estimates that the total institutional equity market was roughly $2.85 trillion as of third
U.S. Chartered Depository Institutions
51%
CMBS, CDO andother ABS
10%
Life InsuranceCompanies
11%
Foreign Banking O�cesin U.S.
2%
GSEs18% Other
8%
Fixed Income Markets - $3.76 TrillionLender Composition
Exhibit 3-2. Commercial Real Estate Debt Universe
Source: Federal Reserve Flow of Funds, 3Q 2016.

EXPECTATIONS & MARKET REALITIES IN REAL ESTATE 2017 | Intersection of Global Change: Embracing a New Era
26 | ©2017 Situs RERC®, Deloitte Development LLC, National Association of REALTORS®. All Rights Reserved.
quarter 2016. This was approximately 8-percent more than 2015 estimates. At 55 percent, private equity continued to hold the majority of equity-based commercial real estate. REIT invest-ment accounted for the next largest piece of the pie at roughly 31 percent of total equity, slightly less than amount of equity held by REITs in 2015. The remaining equity investment was held by pension funds (5 percent), corpora-tions (3 percent), life insurers (2 per-cent), foreign investors (2 percent), commercial banks (1 percent), and government, GSEs and others (less than 1 percent).
KEY CONSIDERATIONS FOR 2017
New Presidential Administration
As mentioned throughout this chap-ter, the impact of the new presidential administration is yet to be determined. There is much speculation regarding the policies that President Trump will put forth. If the new administration is able to work with Congress to enact fis-cal stimulus, expectations are that the economy could see a pickup in growth to 2.2 percent in 2017 and to 2.3 percent in 2018, according to The Wall Street Journal Economic Survey.
However, even if expected fiscal stim-ulus is enacted, many other possible economic pitfalls remain. President Trump’s anti-immigration policies have the potential to cause a detrimen-tal reduction in the workforce, which could result in a drag on GDP. President Trump’s proposed international trade policies have also generated some con-cerns among investors. Reuters reports that President Trump’s policies pose a major challenge for the global econ-omy, which has historically relied on cross-border trade and migration flows for growth.
However, aside from the uncertainty surrounding policy, equity markets appear poised for positive move-ment in 2017, primarily driven by the
possibility of fiscal stimulus. Commer-cial real estate sentiment suggests that the new administration will be sympa-thetic to the interests of the industry, given President Trump’s background. However, considering the long-term nature of commercial real estate investment, many experts believe that any actions taken by the new adminis-tration in 2017 will not have an imme-diate impact on the industry.
Regulations
Given President Trump’s stance on deregulation, many believe that revamping the Dodd-Frank Act will be a key concern of the new administra-tion. While the complete dismantling of the Dodd-Frank Act is unlikely, there are certain aspects of the Act that may be restructured to meet the adminis-tration’s goals. President Trump has cited the cost of compliance for banks as a hindrance toward economic growth.
In late December 2016, a component of the Dodd-Frank rules known as “risk retention” went into effect. Risk
retention rules require any sponsor of asset-backed securities to have “skin in the game” by retaining a 5-percent slice of each deal for five years, per the U.S. Securities and Exchange Com-mission (SEC). Throughout 2016, there were mounting concerns by investors and market participants that this addi-tional requirement would put further pressure on a shrinking CMBS mar-ket. The hope of many banks is that the Trump administration will work to modify or repeal this requirement.
However, in light of concerns sur-rounding the risk retention rules, there were a handful of early conduit CMBS transactions created to test the waters. In general, the reception was positive for these early conduits where the underlying securities consisted of high-quality assets. However, 2017 is expected to be the litmus test for the viability of these transactions, and the manner in which issuers are able to find sustainable ways to bring these CMBS deals to the market will play a vital role in the CMBS market through 2017.
Private Equity55%
REITs31%
Pension Funds5%
Equity Investor Composition - $2.85 Trillion
Life Insurance Cos.2%
Commercial Banks1% Corporations
3%
Foreign Investors2%
Gov’t, GSEs & Others1%
Exhibit 3-3. Institutional Commercial Real Estate Equity Investments
Sources: Situs RERC Estimate based on data from NAREIT, NCREIF, Real Capital Analytics, PREA, and Pensions & Invest-ments, 3Q 2016.

EXPECTATIONS & MARKET REALITIES IN REAL ESTATE 2017 | Intersection of Global Change: Embracing a New Era
©2017 Situs RERC®, Deloitte Development LLC, National Association of REALTORS®. All Rights Reserved. | 27
Other notable regulation reforms include the modification of some of the more stringent capital requirements for high-volatility commercial real estate (HVCRE). These high-value loans can affect commercial real estate acquisi-tion, development and construction, according to Deloitte’s 2017 Commer-cial Real Estate Outlook report.
Also, the Financial Accounting Stan-dards Board (FASB) established a new lease accounting standard, ASU 2016-02, in February 2016. The new standard is centered on revenue recognition and lease accounting, and a primary fea-ture of the new standard is the require-ment that management’s judgement must be utilized in accounting for revenue. The change will take effect for most companies in 2018. Potential operational challenges to implement-ing the standard include the limita-tions of existing data management systems and increased scrutiny from auditors and regulators, per Deloitte’s Lease Accounting and Implementation Considerations for ASU 2016-02. The consensus is that the new standard will increase compliance and administra-tion costs for REITs.
The end of 2015 saw the establishment of the Protecting Americans from Tax Hike (PATH) Act. Components of this act helped to ease REIT tax provisions and potentially generate greater inter-est in investing in startups for R&D. The PATH Act allows for businesses who engage in certain R&D activities to receive tax credits for their invest-ment. Some of the tax incentives under this act were modified, while many others were extended for up to five years, according to the Internal Rev-enue Service (IRS). The extension of many of these tax incentives makes it easier to accurately reflect costs on any budget baseline. Companies will now have clear guidance as to whether these activities should be applied ret-roactively for the past or prospectively for the coming year.
Fed Decisions
Although interest rate hikes by the FOMC were expected in 2016, uncer-tain economic growth expecta-tions stemming from Brexit, the U.S. presidential election, terrorism, and other events kept rate hikes at bay until December. The Federal Reserve
increased short-term interest rates by a quarter of a percentage point in their December 2016 meeting, setting the federal funds rate range to 0.50 percent to 0.75 percent. The December rate hike was a result of the unemployment rate declining to 4.6 percent in Novem-ber, the possibility of tax cuts and fiscal spending under the new presidential administration, a rise of oil prices, and other positive economic signals.
The Federal Reserve stated that it antic-ipates two to three rate increases in 2017, and an additional three increases in both 2018 and 2019. However, Fed officials maintain that they will take a wait-and-see approach on the timing of these rate hikes. The general sentiment is that since rates are still at historic lows, a quarter of a percentage point increase will have minimal impact on markets through 2017.
The Federal Reserve reported that the 10-year break even rate, the yield premium investors demand to hold 10-year Treasury notes relative to 10-year Treasury Inflation Protected Securities (TIPS), broke above 2 per-cent, indicating that investors believe
EXPECTATIONS & MARKET REALITIES IN REAL ESTATE 2017 | Intersection of Global Change: Embracing a New Era
28 | ©2017 Situs RERC®, Deloitte Development LLC, National Association of REALTORS®. All Rights Reserved.
inflation will be above 2 percent over the next 10 years. According to the BLS, inflation rose to 2.5 percent in January 2017 and is forecasted to be at 2.35 per-cent by the end of the year, according to The Wall Street Journal Economic Forecasting Survey.
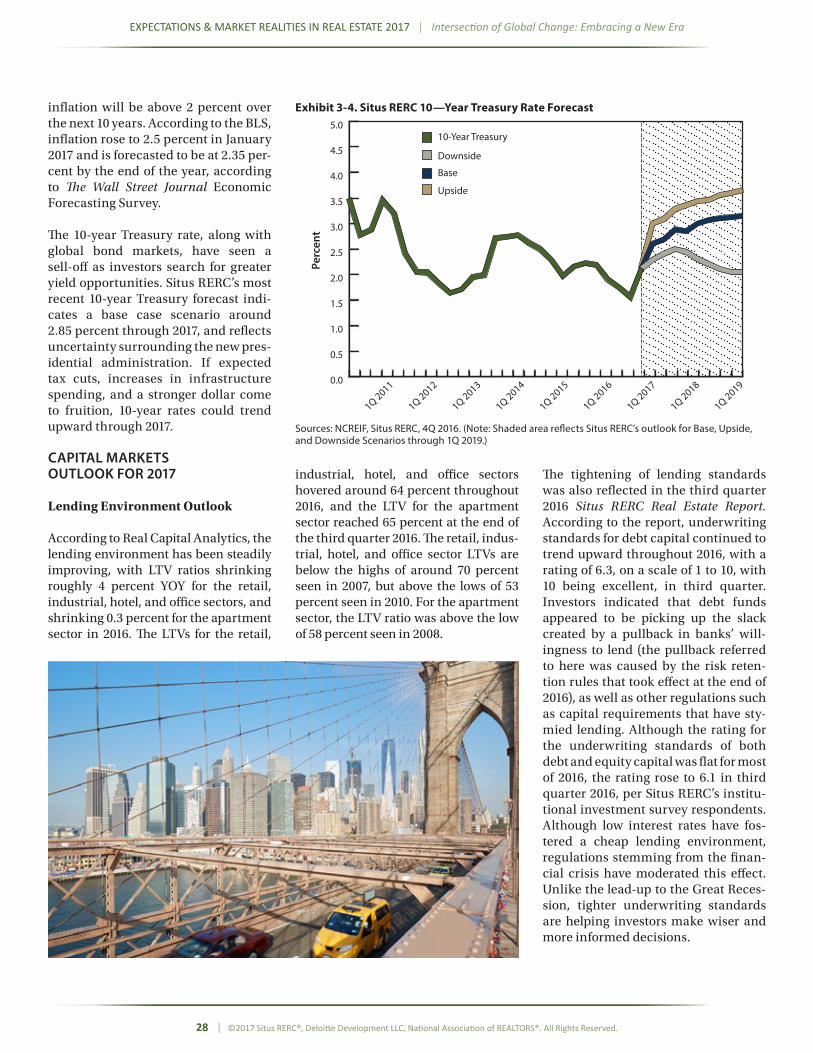
The 10-year Treasury rate, along with global bond markets, have seen a sell-off as investors search for greater yield opportunities. Situs RERC’s most recent 10-year Treasury forecast indi-cates a base case scenario around 2.85 percent through 2017, and reflects uncertainty surrounding the new pres-idential administration. If expected tax cuts, increases in infrastructure spending, and a stronger dollar come to fruition, 10-year rates could trend upward through 2017.
CAPITAL MARKETS OUTLOOK FOR 2017
Lending Environment Outlook
According to Real Capital Analytics, the lending environment has been steadily improving, with LTV ratios shrinking roughly 4 percent YOY for the retail, industrial, hotel, and office sectors, and shrinking 0.3 percent for the apartment sector in 2016. The LTVs for the retail,
industrial, hotel, and office sectors hovered around 64 percent throughout 2016, and the LTV for the apartment sector reached 65 percent at the end of the third quarter 2016. The retail, indus-trial, hotel, and office sector LTVs are below the highs of around 70 percent seen in 2007, but above the lows of 53 percent seen in 2010. For the apartment sector, the LTV ratio was above the low of 58 percent seen in 2008.
The tightening of lending standards was also reflected in the third quarter 2016 Situs RERC Real Estate Report. According to the report, underwriting standards for debt capital continued to trend upward throughout 2016, with a rating of 6.3, on a scale of 1 to 10, with 10 being excellent, in third quarter. Investors indicated that debt funds appeared to be picking up the slack created by a pullback in banks’ will-ingness to lend (the pullback referred to here was caused by the risk reten-tion rules that took effect at the end of 2016), as well as other regulations such as capital requirements that have sty-mied lending. Although the rating for the underwriting standards of both debt and equity capital was flat for most of 2016, the rating rose to 6.1 in third quarter 2016, per Situs RERC’s institu-tional investment survey respondents. Although low interest rates have fos-tered a cheap lending environment, regulations stemming from the finan-cial crisis have moderated this effect. Unlike the lead-up to the Great Reces-sion, tighter underwriting standards are helping investors make wiser and more informed decisions.
0.0
0.5
1.0
1.5
2.0
2.5
3.0
3.5
4.0
4.5
5.0
1Q 2019
1Q 2018
1Q 2017
1Q 2016
1Q 2015
1Q 2014
1Q 2013
1Q 2012
1Q 2011
Perc
ent
10-Year Treasury
Downside
Base
Upside
Exhibit 3-4. Situs RERC 10—Year Treasury Rate Forecast
Sources: NCREIF, Situs RERC, 4Q 2016. (Note: Shaded area reflects Situs RERC’s outlook for Base, Upside, and Downside Scenarios through 1Q 2019.)

EXPECTATIONS & MARKET REALITIES IN REAL ESTATE 2017 | Intersection of Global Change: Embracing a New Era
©2017 Situs RERC®, Deloitte Development LLC, National Association of REALTORS®. All Rights Reserved. | 29
Data on debt yields was provided by Real Capital Analytics. Debt yields have steadily risen throughout 2016 for the retail, industrial, hotel, and office sectors, reaching 11.5 percent, which was a 7.6-percent YOY increase in third quarter 2016. Debt yields for the apart-ment sector floated around 8.8 percent throughout 2016. However, debt yields were below the high of 14 percent in 2010 for the retail, industrial, hotel, and office sectors, and 10 percent for the apartment sector seen in 2004. Higher debt yields were generally posi-tive for lenders due to the assumption that these investments carried less risk. With commercial real estate price growth expected to slow through 2017, rises in debt yields may be tested by the resilience of increases in net operating income (NOI).
Real Capital Analytics also provided trends analysis regarding the debt ser-vice coverage ratio (DSCR). Of note is the movement in the DSCR, which as of third quarter 2016, was up 2.6 percent YOY for the retail, industrial, hotel, and office sectors, and up 13 percent YOY for the apartment sector. The DSCR was on a decreasing trend early in 2016, but
saw a slight reversal towards the end of 2016 for the retail, industrial, hotel, and office sectors. The DSCR for the apart-ment sector has been steadily increas-ing over the past year. Although DSCR levels seem to be growing, indicating improving cash flows for investors, there may be some headwinds for 2017 DSCR levels due to anticipated inter-est rate hikes and the new presidential administration settling into office.
With increasing regulations and banks not as willing to lend in 2016, “shadow banks” have stepped in to provide an alternative source of capital for inves-tors. Bloomberg reported that private funds sought north of $30 billion in commercial property debt in 2016. A potential source of this debt is coming from buyout firms, REITs, and hedge funds looking to expand lending. These companies are generally more nimble than traditional lenders and can move more quickly on large loans that may have been too risky for banks. These companies fall outside of the debt industry’s traditional oversight, which allows these companies to take on greater risk. Assuming that regula-tions continue to remain tight in 2017,
it is expected that shadow banking will take a more prominent role in the lend-ing sphere.
The CMBS market was rocky in 2016, and the outlook for 2017 is mixed. The focus is on how the new risk reten-tion rules will impact the market and the manner in which the remaining roughly $100 billion in CMBS loans, set to mature by the end of 2017, will be refinanced. Trepp predicts that the risk retention rules will negatively impact the CMBS market in 2017 by poten-tially cutting the expected volume of CMBS in half and by increasing costs for CMBS borrowers by 25 basis points to 50 basis points. The CMBS market closed out 2016 with approximately $75 billion in CMBS deals, roughly $25 bil-lion less than 2015, according to Com-mercial Mortgage Alert (CMA).
Of particular interest in the area of refi-nancing these loans is the proportion of outstanding maturities attributable to office and retail properties. Office and retail properties accounted for over $50 billion of outstanding maturities in November 2016, according to Trepp. Trepp also indicates that the office and

EXPECTATIONS & MARKET REALITIES IN REAL ESTATE 2017 | Intersection of Global Change: Embracing a New Era
30 | ©2017 Situs RERC®, Deloitte Development LLC, National Association of REALTORS®. All Rights Reserved.
retail sectors contain loans with LTV ratios of 88 percent and 80 percent, respectively. Unlike the pre-recession lending environment, which was more accepting of these high LTV ratios and more lax on lending regulations, the current environment has generally been stricter with regards to LTV ratios and other lending requirements. If these borrowers have difficulty in refi-nancing, there will potentially be less loan volume available for lenders to repackage into the CMBS market and thus less CMBS issuance activity.
While the decline in the CMBS market immediately following the financial crisis was driven by a struggling com-mercial real estate market, dampened CMBS lending conditions throughout 2016 were brought about by an increase in the yields demanded by investors. Spreads have narrowed and were more competitive at the tail-end of 2016 com-pared to the beginning of 2016. Accord-ing to CMA, spreads on AAA conduits were S+107 as of mid-December 2016, which is down from the previous week’s spread of S+111 and the 52-week average of 125. Spreads on BBB- con-duits were S+552 as of mid-December, lower than both the week prior (S+561) and the 52-week average of 626.
Equity Market Outlook
While the details of the policies that President Trump and his adminis-tration will pursue in 2017 are still uncertain, many investors are pay-ing particular attention to tax reform, deregulation and fiscal policy. Equity markets have already benefitted from the president’s expected pro-growth agenda. The strong end-of-year equity performance of the banking indus-try points to the potential benefits of deregulation and tax reform, and the construction industry received a boost from the suggestion that infrastructure spending would be a primary effort early in President Trump’s term.
Not all industries and companies are seeing gains, however. President Trump has clearly expressed his disap-proval of current international trade agreements, including withdrawing from the Trans-Pacific-Partnership (TPP). Companies that manufacture products overseas face price pressures if barriers to trade are implemented. Roughly $354 billion in commer-cial real estate acquisitions occurred through the first three quarters of 2016, according to Real Capital Analytics. However, this is less than the roughly $379 billion in acquisitions during the same time period in 2015. Private inves-tors and foreign capital contributed roughly $31 billion of net capital flows (acquisitions less dispositions), while publicly-listed companies and REITs contributed to the bulk of the decrease with a negative $28 billion in net capi-tal flows for the first three quarters of 2016, as shown in Exhibit 3-5. The YOY decrease did not come as a surprise, since most market participants did not expect to reach the record-high transaction volumes seen in 2015. It is expected that capital flow growth will continue to slow in 2017 as the market
plateaus. Many factors, such as the continued unfolding of Brexit and the manner in which U.S. markets adapt to new policies and political leader-ship, will dictate how equity capital is affected throughout 2017.
In 2017, we expect that the attractive-ness of commercial real estate will continue to be strong compared to other investment alternatives because of the robust risk-adjusted returns this asset class typically offers. According to third quarter 2016 Situs RERC insti-tutional investment survey results, commercial real estate continues to be the best investment compared to the alternatives of stocks, bonds and cash (see Exhibit 3-1). There has been a slight downward trend over the past two years in investor preference for commercial real estate, and the spread between commercial real estate and the other investment alternatives has narrowed. Even so, the appeal of com-mercial real estate to Situs RERC’s institutional investment survey respondents has remained strong, and commercial real estate is expected to continue to be the preferred alterna-tive in 2017. However, investors need to
0
50
100
150
200
250
300
350
400
20162015
$ Bi
llion
s
Cross-Border
Private
Inst’l/Eq Fund
User/other
Listed/REITs
Unknown
Exhibit 3-5. Commercial Real Estate Acquisitions
Source: Real Capital Analytics, 4Q 2016.

EXPECTATIONS & MARKET REALITIES IN REAL ESTATE 2017 | Intersection of Global Change: Embracing a New Era
©2017 Situs RERC®, Deloitte Development LLC, National Association of REALTORS®. All Rights Reserved. | 31
remember that we are late in the cycle and they should be prepared for when the correction occurs.
The strength of commercial real estate is also evidenced in the spread between commercial real estate yields as reported by Situs RERC and 10-year Treasury rates, which at 6.2 percentage points at the end of the third quarter 2016 was 50 basis points greater than the spread seen in third quarter 2015 (see Exhibit 3-6). However, with the unexpected results of the presidential election and the subsequent upward spike of the 10-year Treasury to a two-year high of 2.60 percent in mid-December, the expectation is that this spread will narrow in 2017, especially considering that the Federal Reserve will likely raise interest rates several times during the year. It is expected that cap rates for overall commer-cial real estate will level off and begin to rise for certain property types,
including the office sector and hotel sector. For an in-depth discussion of the 10-year Treasury rate and Situs
RERC’s Treasury rate forecast, please see Chapter 5 of this report.
-650
-500
-350
-200
-50
100
250
400
550
700
850
3Q 2016
3Q 2014
3Q 2012
3Q 2010
3Q 2008
3Q 2006
3Q 2004
3Q 2002
3Q 2000
3Q 1998
3Q 1996
3Q 1994
3Q 1992
3Q 1990
3Q 1988
3Q 1986
3Q 1984
3Q 1982
3Q 1980
Spre
ad B
asis
Poi
nts
IRR vs. 10-Yr
Going-in vs. 10-Yr
Exhibit 3-6. Spread Between Commercial Real Estate Yields or Going-in Cap Rates and 10-Year Treasury
Sources: Situs RERC, Federal Reserve, 3Q 2016.

EXPECTATIONS & MARKET REALITIES IN REAL ESTATE 2017 | Intersection of Global Change: Embracing a New Era
32 | ©2017 Situs RERC®, Deloitte Development LLC, National Association of REALTORS®. All Rights Reserved.
0
50
100
150
200
250
300
350
400
20162015
$ Bi
llion
s
Cross-Border
Private
Inst’l/Eq Fund
User/other
Listed/REITs
Unknown
Exhibit 3-5. Acquisitions by Sector (2015 & 2016 1Q-3Q)
Source: Real Capital Analytics, 3q 2016.
4 THE PROPERTY MARKETSCAP RATES EXPECTED TO STABILIZE

EXPECTATIONS & MARKET REALITIES IN REAL ESTATE 2017 | Intersection of Global Change: Embracing a New Era
©2017 Situs RERC®, Deloitte Development LLC, National Association of REALTORS®. All Rights Reserved. | 33
CAP RATES EXPECTED TO STABILIZE
Within the framework of moderate macroeconomic growth, commercial real estate took a step back in 2016 from the active pace set in 2015. Fundamen-tals remained on an upward trajectory, with solid demand across most prop-erty types leading to lower vacancies and rising rents. However, investment volume got off to a rocky start early in 2016, regaining its footing as the year wore on.
Sales of major properties (priced at over $2.5 million) totaled $219.2 billion in the first half of 2016, a 16-percent YOY decline, based on data from Real Capi-tal Analytics3. The slide was precipi-tated by an 18-percent drop during the first quarter, due to the financial mar-kets’ volatility and global uncertainty. In addition, the 2016 markets lacked the very large portfolio and entity-level transactions which boosted deal vol-ume in 2015. The third quarter 2016 saw an additional $114.8 billion in transac-tions, bringing the total volume to the end of September to $343.1 billion, a 9.1 percent-decline compared with the prior year (see Exhibit 4-1).
The apartment sector took the title for the most active investment target in 2016, with $111.5 billion in transactions over the first nine months, according to Real Capital Analytics. Apartments were also the only property type to record gains in deal volume in 2016, with an 11-percent yearly advance. The other property types posted declines in sales volume during the period, rang-ing from a 7-percent slide for office transactions to a 41-percent drop in hotel sales. The office sector was the second most active, with investment sales totaling $99.5 billion, which accounted for 29 percent of all deal vol-ume in the first three quarters of 2016. Retail and industrial deals comprised 17 percent and 12 percent of total
volume, respectively, with a combined transaction volume of $98.1 billion.
As investors’ preferences shifted toward less risk, market activity re-centered in primary and secondary markets. At the midpoint of 2016, only eight markets of the top 40 by sales vol-ume registered positive YOY growth. Manhattan, Los Angeles and Chicago retained their respective top-three sta-tus, although Los Angeles was the only one with gains in transaction activ-ity—10 percent higher than in 2015. The metros with the strongest advances in deal volume were Las Vegas (up 78 per-cent), Ft. Lauderdale (up 48 percent) and Denver (up 38 percent). Investors also found attractive opportunities in San Francisco’s East Bay, Philadelphia, Boston and Tampa, all of which posted double-digit volume growth compared with the prior year, per Real Capital Analytics.
$0
$25
$50
$75
$100
$125
$150
$175
3Q 2016
1Q 2016
3Q 2015
1Q 2015
3Q 2014
1Q 2014
3Q 2013
1Q 2013
3Q 2012
1Q 2012
3Q 2011
1Q 2011
3Q 2010
1Q 2010
3Q 2009
1Q 2009
3Q 2008
1Q 2008
3Q 2007
1Q 2007
3Q 2006
1Q 2006
$ B
illio
ns
RetailO�ceIndustrialHotelApartment
Exhibit 4-1. Commercial Property Volume
Source: Real Capital Analytics, 3Q 2016.
3 Unless otherwise noted, the source for the data in this section is Real Capital Analytics.

EXPECTATIONS & MARKET REALITIES IN REAL ESTATE 2017 | Intersection of Global Change: Embracing a New Era
34 | ©2017 Situs RERC®, Deloitte Development LLC, National Association of REALTORS®. All Rights Reserved.
Commercial property prices registered modest growth in the first three quar-ters of 2016 compared with the prior year, according to Moody’s/Real Capi-tal Analytics Commercial Property Price Index (CPPI). Reflecting the dom-inant position in volume (see Exhibit 4-2), based on Moody’s/Real Capital Analytics CPPI, prices for apartment properties posted the strongest gains at 12.7 percent YOY, as of November 2016. Growth in industrial property prices was a respectable 12.3 percent annually as of November 2016, according to the CPPI. Retail and office property price growth was more modest, at 3.4 percent and 8.8 percent, respectively. The aver-age price for hotel properties was 1.4 percent higher in the first nine months of 2016 compared with the same period in 2015.
Cap rates flattened out in the first nine months of 2016, but they declined 9 basis points from the same period in 2015 (see Exhibit 4-3). In keeping with investor interest, apartments posted the steepest cap rate decline, with a 37-basis point contraction, and the low-est values, reaching an average of 5.4 percent by the end of September 2016,
per Real Capital Analytics. Office trans-actions averaged cap rates of 6.5 per-cent in the first three quarters of 2016, 25 basis points lower on a yearly basis. Retail assets tied with office spaces for the second-lowest average cap rates, at 6.5 percent. Industrial transactions
registered virtually unchanged rates, at 6.8 percent, a mere 6 basis points lower than 2015. Hotels experienced a 32-basis point hike in cap rates, to an average 8.5 percent over the January to September 2016 period. As inves-tors monitored the Federal Reserve’s
75
100
125
150
175
200
225
250
275
300
Nov 2016
Nov 2015
Nov 2014
Nov 2013
Nov 2012
Nov 2011
Nov 2010
Nov 2009
Nov 2008
Nov 2007
Nov 2006
Nov 2005
Nov 2004
Nov 2003
Nov 2002
Nov 2001
IndustrialApartmentRetailO�ce
Inde
x
Exhibit 4-2. Moody’s/Real Capital Analytics CPPI
Sources: Moody’s Investors Service, Real Capital Analytics (Moody’s/RCA CPPI), November 2016.

EXPECTATIONS & MARKET REALITIES IN REAL ESTATE 2017 | Intersection of Global Change: Embracing a New Era
©2017 Situs RERC®, Deloitte Development LLC, National Association of REALTORS®. All Rights Reserved. | 35
forward guidance on interest rates, spreads between cap rates and long-term government bonds remained in a comfortable range.
The funding picture for commercial transactions was in step with inves-tors’ changing preferences toward less risk. Institutional managers and equity funds were the only sources of capital to increase their investments during the first half of 2016, with an 11-per-cent advance over 2015, according to Real Capital Analytics. Private inves-tors, which generally comprise the bulk of investment volume, retrenched by 7 percent during the period. Cross-border capital—which posted triple-digit inflows into U.S. commercial markets in 2015—registered a 47-per-cent decline in investment activity by the midpoint of 2016. REITs posted the largest decline in activity, with a 64-percent drop in the first half of the year, influenced by early declines in share values during the first quarter.
Global economic uncertainties, cou-pled with financial volatility and
anticipation of interest rate hikes by the Federal Reserve, tamped the pace of investment in commercial real estate during 2016. However, the
foundation of market fundamentals remained solid, as higher demand and lower vacancies boosted proper-ties’ cash flow.
5
6
7
8
9
3Q 2016
1Q 2016
3Q 2015
1Q 2015
3Q 2014
1Q 2014
3Q 2013
1Q 2013
3Q 2012
1Q 2012
3Q 2011
1Q 2011
3Q 2010
1Q 2010
3Q 2009
1Q 2009
3Q 2008
1Q 2008
3Q 2007
1Q 2007
3Q 2006
1Q 2006
RetailO�ceIndustrialApartment
Perc
ent
Exhibit 4-3. Commercial Property Cap Rates
Source: Real Capital Analytics, 3Q 2016.

EXPECTATIONS & MARKET REALITIES IN REAL ESTATE 2017 | Intersection of Global Change: Embracing a New Era
36 | ©2017 Situs RERC®, Deloitte Development LLC, National Association of REALTORS®. All Rights Reserved.
THE OFFICE MARKET4
Market Overview
Employment in professional and busi-ness services—the main occupiers of office spaces—proved to be the engine of growth during 2016 and boosted advances in office property funda-mentals. However, mirroring broader market trends, investment sales of office properties totaled $63.4 billion in the first half of 2016, a 12-percent YOY decline from the previous year, according to Real Capital Analytics. The third quarter added an additional $33.9 billion in transactions, bring-ing the nine-month total in 2016 to $99.5 billion, as shown in Exhibit 4-A1. Central business district (CBD) office properties—which tend to garner a significant concentration of capital—had a weak first quarter. Sales of CBD office assets were outpaced by those for suburban office spaces at the end of September 2016—$46.0 billion versus $54.3 billion, respectively. Sales of CBD office buildings slid 2 percent in the first three quarters of 2016 compared with the same period in 2015, while sales of suburban properties declined 10 percent on a yearly basis in the first nine months of 2016.
A major driver in the decline of office transactions in 2016 was the absence of portfolio and entity-level sales. While portfolio and entity-level sales volume accounted for 31 percent of all office sales in the first three quarters of 2015, it comprised only 20 percent of all office sales during the same period in 2016, based on data from Real Capital Analytics. Major metropolitan areas attracted most of the office investment, comprising $59.1 billion in transac-tions during the first nine months of 2016. Secondary markets accounted for $34.8 billion in sales during the first nine months of 2016, while tertiary markets garnered $5.2 billion.
Volu
me
in $
Bill
ions Average $/Sq. Ft.
$0
$5
$10
$15
$20
$25
$30
$35
$40
$45
Volume
3Q 2016
1Q 2016
3Q 2015
1Q 2015
3Q 2014
1Q 2014
3Q 2013
1Q 2013
3Q 2012
1Q 2012
3Q 2011
1Q 2011$100
$150
$200
$250
$300
$350
Price $/SF
Exhibit 4-A1. Office Property Volume and Pricing
Source: Real Capital Analytics, 3Q 2016.
4 Unless otherwise noted, the source for the data in this section is Real Capital Analytics.

EXPECTATIONS & MARKET REALITIES IN REAL ESTATE 2017 | Intersection of Global Change: Embracing a New Era
©2017 Situs RERC®, Deloitte Development LLC, National Association of REALTORS®. All Rights Reserved. | 37
Despite declines in sales, office fun-damentals improved, leading to rising rents and expectations of stronger cash flow. While average prices for office properties had a modest 4-percent gain on a yearly basis in the first three quar-ters of 2016, CBD properties posted a 7-percent yearly appreciation rate, averaging $327 per square foot at the end of September, according to Real Capital Analytics. Prices for suburban office buildings ticked up by 1 percent to an average of $195 per square foot.
Cap rate compression continued for CBD properties, declining 50 basis points from January to September 2016, to an average of 5.5 percent, per Real Capital Analytics. Suburban office transactions posted a 10-basis-point slide in cap rates, averaging 6.8 percent at the end of the third quarter 2016. As shown in Exhibit 4-A2, the average cap rate for the overall office sector fell to 6.4 percent during third quarter 2016.
Investor Composition
Institutional investors and equity funds were the most active buyers in the market during most of 2016. Private buyers and cross-border investors took a step back during the year, reversing their 2015 activity.
Manhattan retained the top spot for office investment, with $14.3 billion in sales during the first half of 2016, which was 10 percent higher on a yearly basis than 2015 sales, based on data from Real Capital Analytics. Los Angeles and Boston rounded out the top three metros, posting solid YOY volume gains of 81 percent and 35 percent, respectively. San Francisco ranked fourth in sales volume, with $3.1 billion in closed transactions, a 14-percent yearly decline. Seattle moved up in the rankings, from the number seven spot in 2015 to number five in 2016, despite a 10-percent decline in transactions. As investors shifted toward safety, the highest yearly growth metros were Stamford (up 192 percent), San
6.0
6.5
7.0
7.5
8.0
Avg. Cap Rate
3Q 2016
1Q 2016
3Q 2015
1Q 2015
3Q 2014
1Q 2014
3Q 2013
1Q 2013
3Q 2012
1Q 2012
3Q 2011
1Q 2011
Perc
ent
Exhibit 4-A2. Average Office Property Capitalization Rate
Source: Real Capital Analytics, 3Q 2016.
EXPECTATIONS & MARKET REALITIES IN REAL ESTATE 2017 | Intersection of Global Change: Embracing a New Era
38 | ©2017 Situs RERC®, Deloitte Development LLC, National Association of REALTORS®. All Rights Reserved.
Francisco’s East Bay (up 100 percent), Washington, D.C. suburbs (up 88 per-cent), Miami (up 63 percent), Charlotte (up 47 percent), and San Diego (up 44 percent).
Market Fundamentals
Office fundamentals continued on a positive trend line during 2016, as expanding office-using employment drove demand. Vacancies continued to decline over the first three quarters of the year, as suburban office space across the major metros registered noticeable gains in absorption. Based on data from CBRE, national vacan-cies declined from 13.9 percent in the first quarter of 2015 to 13.1 percent in the first quarter of 2016. Office vacan-cies remained flat in the ensuing two quarters, registering 13.0 percent in the second quarter and 13.0 percent in the third one. The top markets in terms of absorption were Dallas/Ft. Worth, Phoenix, Los Angeles, and Seattle.
Office net absorption totaled 26.9 mil-lion square feet over the first nine months of the year. New completions added 27.4 million square feet of space to the market, with a large portion of the new space coming on the market pre-leased.
With tightening fundamentals, land-lords found more leverage when ask-ing for higher rental rates. The national average office rent rose 6.2 percent by mid-2016, and third quarter rents increased an additional 1.7 percent, according to CBRE, with 86 percent of tracked markets posting rent increases.
Outlook
The outlook for the office sector remains cautiously positive. With employment in professional and business services among the sectors leading job growth in 2016, net absorption is projected to advance. Based on CBRE’s forecast, net absorption is estimated to total 39.9
million square feet by the end of 2016, accompanied by 36.1 million square feet in 2017. However, supply of new office space is also expected to pick up by 42.8 million square feet in 2016 and 50.5 million square feet in 2017. With demand slowing in comparison to sup-ply, office vacancy is expected to stay flat at 13.0 percent at the end of 2016 and increase to 13.3 percent by the end of 2017.
On the investment front, given the global low-yield environment, as well as the comparative strength of U.S. assets, the office sector will likely con-tinue to provide safety and attractive yields. Although the spreads between cap rates and 10-year U.S. Treasurys tightened during the last couple of months of 2016, they remain generous and provide investors some cushion-ing, even while heading into a rising interest rate landscape.

EXPECTATIONS & MARKET REALITIES IN REAL ESTATE 2017 | Intersection of Global Change: Embracing a New Era
©2017 Situs RERC®, Deloitte Development LLC, National Association of REALTORS®. All Rights Reserved. | 39
THE INDUSTRIAL MARKET
Market Overview
Favorable conditions, includ-ing increased consumer spending through e-commerce, the opening of the expanded Panama Canal locks, and growing numbers of communica-tions and technology data centers led to increased demand for industrial properties in 2016. Some of these posi-tive developments were not reflected in the volume of investment sales, which totaled $25.7 billion in the first half of the year, a 31-percent decline from the same period in 2015, according to Real Capital Analytics5. An additional $14.2 billion in sales volume was added in third quarter, as shown in Exhibit 4-B1. What the headline figures obscure is the fact that 2015 was marked by a sig-nificant spike in portfolio and entity-level transactions for industrial assets, which were mostly absent in 2016, as illustrated by the 61-percent drop in the first half of the year. However, under-pinning the strength of the sector, sin-gle-asset sales totaled $29.6 billion in the first nine months of 2016, which was 8 percent higher than single-asset sales in 2015. The performance of industrial assets by type diverged, with flex space recording 15-percent gains in sales in the first three quarters of 2016, while warehouse buildings posted a 29-per-cent decline in investments during the same period.
While deal volume declined 19 per-cent in the first three quarters, pricing proved more resilient. After a 4-percent decline in the first quarter, prices for industrial properties rebounded in the second and third quarters, netting a 7-percent gain in the first nine months of 2016, based on data from Real Capi-tal Analytics. The national average price of industrial space reached $80 per square foot by the end of September 2016. Both flex and warehouse proper-ties posted gains in prices during the
first nine months, of 3 percent and 7 percent, respectively. Flex space traded at an average of $128 per square foot at the end of the third quarter, while ware-house properties exchanged hands for $71 per square foot.
The industrial sector average cap rate rose sharply during first quarter 2016. However, rates steadily declined over the next two quarters in 2016, falling to 6.5 percent during third quarter 2016 (see Exhibit 4-B2). Industrial cap rates
Volu
me
in $
Bill
ions Average $/Sq. Ft.
$0
$5
$10
$15
$20
$25
$30
Volume
3Q 2016
1Q 2016
3Q 2015
1Q 2015
3Q 2014
1Q 2014
3Q 2013
1Q 2013
3Q 2012
1Q 2012
3Q 2011
1Q 2011$40
$60
$80
$100
Price $/SF
Exhibit 4-B1. Industrial Property Volume and Pricing
Source: Real Capital Analytics, 3Q 2016.
6.0
6.5
7.0
7.5
8.0
8.5
9.0
9.5
Avg. Cap Rate
3Q 2016
1Q 2016
3Q 2015
1Q 2015
3Q 2014
1Q 2014
3Q 2013
1Q 2013
3Q 2012
1Q 2012
3Q 2011
1Q 2011
Perc
ent
Exhibit 4-B2. Average Industrial Property Cap Rate
Source: Real Capital Analytics, 3q 2016.
5 Unless otherwise noted, the source for the data in this section is Real Capital Analytics.

EXPECTATIONS & MARKET REALITIES IN REAL ESTATE 2017 | Intersection of Global Change: Embracing a New Era
40 | ©2017 Situs RERC®, Deloitte Development LLC, National Association of REALTORS®. All Rights Reserved.
posting rent gains, the highest rent growth was recorded in the Inland Empire, Albuquerque and Austin.
Outlook
The near-term outlook for the indus-trial sector remains positive, with conditions nearing full recovery. Net absorption is projected to reach 244.9 million square feet in 2016 and 136.2 million square feet in 2017, based on CBRE data. Supply is expected to con-tinue rising, with industrial comple-tions adding 184.2 million square feet of new space by the end of 2016 and an additional 191.6 million square feet in 2017.
Despite the decline in sales volume during the first three quarters of 2016, investments in industrial properties are projected to rebound, driven by rising demand and solid cash flows. With global yields probing new lows, industrial assets are expected to con-tinue to provide attractive returns.
averaged 6.8 percent throughout the first three quarters of 2016, accord-ing to Real Capital Analytics. Over the same period, warehouse cap rates reflected stronger investor demand, averaging 6.7 percent, while flex space cap rates averaged 7.0 percent.
Investor Composition
While cross-border investors domi-nated the news in 2015 with large portfolio transactions and unprece-dented forays into secondary and even tertiary markets, they pulled back during 2016. Private investors also retrenched during the year. However, institutional investors and equity funds remained active in the markets, and closed deals for industrial proper-ties were 76 percent higher in the first half of 2016 compared to 2015, based on data from Real Capital Analytics.
The underlying current in investor activity in 2016 was a pull-back from tertiary industrial markets, reflect-ing decreased risk appetite. Of the top 25 industrial markets tracked by Real Capital Analytics, only six met-ros posted YOY gains in volume by the midpoint of 2016: Boston (up 135 percent), Washington, D.C. suburbs (up 65 percent), San Jose (up 35 per-cent), New York City boroughs (up 30 percent), central California (up 6 per-cent), and Philadelphia (up 1 percent). These markets also posted solid gains in the rankings, with San Jose, Bos-ton and the New York City boroughs moving into the top five. Los Angeles retained its leading spot in the list of top metros in terms of investment activity, with $1.9 billion in transac-tions during the first half of 2016, fol-lowed by Chicago, with $1.5 billion in closed sales.
Market Fundamentals
Industrial fundamentals continued on an unabated upward trend dur-ing 2016. Based on data from CBRE Econometric Advisors, demand for
industrial space rose in the first nine months of 2016, marking 26 consecu-tive quarters of positive net absorp-tion. The first three quarters totaled 204.3 million square feet of net absorp-tion, as shown in Exhibit 4-B3. All industrial markets tracked by CBRE except four posted gains in demand at the midpoint of the year, under-scoring broad-based strengthening. Construction of industrial space fell short of demand, with 134.0 million square feet completed in the first nine months of 2016, per CBRE Economet-ric Advisors. Availability for the indus-trial sector declined, with the national rate averaging 8.4 percent at the end of September 2016, 80-basis-points lower YOY. Strong markets, such as San Francisco, Oakland, Orange County, and Los Angeles, posted vacancy rates below 4 percent.
Nationally, average industrial rents rose 1.7 percent and 1.8 percent, respectively, in the first and second quarters of the year. At the end of Sep-tember, industrial spaces were renting for an average $6.50 per square foot, 6.6 percent higher YOY, according to CBRE Econometric Advisors. With 81 percent of the U.S. industrial markets
Avai
labi
lity
Rate
(%)
Absorption/Com
pletions (Millions SF)
7
8
9
10
11
12
13
14
15
3Q 2016
3Q 2015
3Q 2014
3Q 2013
3Q 2012
3Q 2011
3Q 2010
3Q 2009
3Q 2008
3Q 2007 -100
-80
-60
-40
-20
0
20
40
60
80
100
Absorption
Availability Rate
Completions
Exhibit 4-B3. Industrial Property Availability, Absorption, and Completions
Source: CBRE Econometric Advisors, 3Q 2016.

EXPECTATIONS & MARKET REALITIES IN REAL ESTATE 2017 | Intersection of Global Change: Embracing a New Era
©2017 Situs RERC®, Deloitte Development LLC, National Association of REALTORS®. All Rights Reserved. | 41
THE RETAIL MARKET
Market Overview
In September 2016, the U.S. Census Bureau reported that annual median household income grew to $56,516 from $53,718 in the prior year. This growth of approximately 5.2 percent was the first increase in this statistic since 2007, and was a rather sizeable increase at that. However, along with this increase in personal income, the prices of everyday items such as gaso-line and groceries decreased, result-ing in less money being spent on these goods than in previous years.
Although an individual’s ability to purchase may have risen with the increase in household income, inves-tors in the retail market remain cau-tious due to several lingering disrup-tive factors in the economy. According to a September 2016 MarketWatch article titled, “Retail Sales, Like the Economy, Still in the Slow Lane,” the recent social trend of people work-ing remotely or from the comfort of their homes has led to only a weak increase in sales at bars and restau-rants, as people working at home tend to not purchase lunch during the work week. In addition, the growth in sales of more than 6 percent that the auto-mobile industry experienced in 2014 and 2015 has slowed, with automobile sales growing at a rate of only 2.5 per-cent in the first nine months of 2016, according to economic research pro-vided by the Federal Reserve Bank of St. Louis.
Many online retailers continue to succeed in the current economy, as e-commerce sales grew more than 15 percent on a YOY basis in third quar-ter 2016, according to the U.S. Cen-sus Bureau. E-commerce sales are expected to increase to over 10 per-cent of total sales by 2020, according to TechNavio’s Online Fashion Retail Market in the US 2016-2020 report. The U.S. Census Bureau’s August 2016
release regarding e-commerce shows that this growth is already occurring, as e-commerce sales in second quar-ter 2016 accounted for 7.5 percent of total retail sales. To compete with online sales, increasing numbers of traditional stores are offering free or discounted expedited shipping. In addition, more consumers are seeking customization of products and real-time information about their products and where they are purchasing them, according to RetailNext’s Retail Trends of 2016. While those desires were pre-viously met primarily by online retail-ers, technology advancements now allow many brick-and-mortar stores to also satisfy those requirements. Traditional retailers have also found ways to boost sales in their brick-and-mortar stores by leveraging shoppers’ attraction to social media and online shopping (think: “Like us on Facebook and receive 10% off in stores!” ads). Perhaps the bargain hunters of Amer-ica will assist traditional retailers and online retailers in their ability to keep both platforms growing and viable.
Numerous reports of struggling malls and mall retailers emphasize the strain that the popular e-commerce trend has put on the industry. Accord-ing to experts quoted in a June 2016 Time article titled, “12 Major Retail-ers Closing Stores Like Crazy,” almost one-third of all malls in the U.S. will be closing in the years to come, in part
because of the major anchor stores shuttering their doors. To combat this trend, some retailers with large num-bers of store closings are focusing on improving their online and mobile-friendly shopping experience.
With many brick-and-mortar retail stores clearly struggling and retail property sales falling nearly 20 per-cent YOY, based on a September 2016 NREI Retail Real Estate Research arti-cle, an interesting occurrence sug-gests that mall owners are not ready to watch their historic asset class die. In fact, according to an article in The Wall Street Journal, after a well-known apparel and accessory provider filed for Chapter 11 bankruptcy in May 2016, the company was up for sale. In September 2016, a consortium of retail real estate companies and retailers purchased the brand, stating job and brand preservation as major benefits, according to Business Wire. While not likely to continue as a trend, this was an unprecedented move to main-tain occupancy and earn a return on investment relative to the low bid price at the bankruptcy auction.
It should be noted that the retail prop-erty market is vast and contains many subtypes and quality classes which are each impacted differently by mar-ket events. The themes and events discussed herein set the stage for the retail market in general. However,

EXPECTATIONS & MARKET REALITIES IN REAL ESTATE 2017 | Intersection of Global Change: Embracing a New Era
42 | ©2017 Situs RERC®, Deloitte Development LLC, National Association of REALTORS®. All Rights Reserved.
Class A regional and super-regional malls should have the best chance of managing through the issues impact-ing the industry. These types of cen-ters sometimes serve as entertain-ment destinations, contain a critical mass of retailers, and are most favor-able to consumers. Retail (Mall and Strip Center) Property Volume and Pricing
According to Real Capital Analytics, the volume of retail property sales totaled approximately $57.1 billion as of third quarter 2016, which is a 13.7-percent decrease compared to third quarter 2015 sales of $66.2 bil-lion. Year-to-date transactions of retail shops reached $17.5 billion as of third quarter 2016, which was 20.2 percent lower than the $22.0 billion in transactions during the same period in 2015, as shown in Exhibit 4-C1. Further, when comparing the same time periods, transactions of retail centers decreased by 10.5 percent year-to-date, reaching $39.6 billion as of third quarter 2016, compared to $44.2 billion in third quarter 2015. While general retail space seems to be struggling, according to both leas-ing and sales statistics, center space consisting of multi-tenant retail space that is 30,000 square feet or larger has been impacted to a lesser degree. This may come as a surprise to those who believe that malls and shopping cen-ters are doomed and that single-ten-ant shop space is less risky.
Average Retail Property Cap Rates
According to Real Capital Analytics, average capitalization rates for the retail sector have decreased yet again, although ever so slightly. Shops, centers, and general retail properties saw mini-mal cap rate compressions from third quarter 2015 to the present, reporting average cap rates of 5.9 percent, 7.0 per-cent, and 6.4 percent, respectively (see Exhibit 4-C2). The shops and general retail categories reported their lowest
average cap rates in the last five years, with centers coming close, following a 6.9-percent cap rate reported in fourth quarter 2015. Nevertheless, each prop-erty type has shown impressive recov-ery from their high marks in late 2009 and early 2010 of 8.0 percent for shops,
8.8 percent for centers, and 8.1 percent for general retail properties.
Investor Composition
The lender pool of the retail prop-erty market has leveled out, with no
Exhibit 4-C2. Average Retail Property Cap Rate
5.5
6.0
6.5
7.0
7.5
8.0
8.5
9.0
3Q 2016
1Q 2016
3Q 2015
1Q 2015
3Q 2014
1Q 2014
3Q 2013
1Q 2013
3Q 2012
1Q 2012
3Q 2011
1Q 2011
Perc
ent
Shops Avg. Cap Rate
Centers Avg. Cap Rate
Source: Real Capital Analytics, 3Q 2016.
Volu
me
in $
Bill
ions Average $/Sq. Ft.
$0
$2
$4
$6
$8
$10
$12
$14
$16
$18
$20
3Q 2016
1Q 2016
3Q 2015
1Q 2015
3Q 2014
1Q 2014
3Q 2013
1Q 2013
3Q 2012
1Q 2012
3Q 2011
1Q 2011 $100
$150
$200
$250
$300
$350
$400
$450
Centers Volume
Shops Volume
Shops Price $/SFCenters Price $/SF
Exhibit 4-C1. Retail (Mall and Strip Center) Property Volume and Pricing
Source: Real Capital Analytics, 3Q 2016.

EXPECTATIONS & MARKET REALITIES IN REAL ESTATE 2017 | Intersection of Global Change: Embracing a New Era
©2017 Situs RERC®, Deloitte Development LLC, National Association of REALTORS®. All Rights Reserved. | 43
lender type making up a clear major-ity of the pool. According to the Real Capital Analytics’ U.S. Capital Trends report for August 2016, national banks made up 25 percent of the lender pool, closely followed by regional/local banks at 23 percent, and CMBS and insurance lenders each holding 16 percent of market share. International banks, financial agencies, and private investors comprised the remaining 20 percent of the lender pool. Further, national banks and regional/local banks had a strong presence in the lender pools for retail property sub-types. National banks had the larg-est market share for strip centers (29 percent), anchored shopping centers (34 percent), and retail portfolios (46 percent), while regional/local banks trumped the lender pool for unan-chored shopping centers (50 percent), single-tenant retail (50 percent), and individual retail sales (29 percent), according to Real Capital Analytics.
The buyer pool of the retail market saw minor shifts in 2016 compared to 2015. The clear majority of buyer composition continued to be private investors, which made up 50 per-cent of the buyer pool, according to the Real Capital Analytics U.S. Capi-tal Trends report for October 2016. Institutional/fund investors made up 26 percent of the pool in the first 10 months of 2016, increasing from a low mark of 15 percent in 2014, and 19 percent in 2015. Conversely, listed and REIT investors’ percentage of the pool shrank since its high mark of 32 percent in 2014, down to 19 percent in 2015 and only 10 percent in 2016, which was equal to the percentage of cross-border investors.
Retail Property Fundamentals
According to CBRE Econometric Advi-sors, vacancy rates decreased again in third quarter 2016, reaching 10.4 per-cent. Rates have decreased continu-ously since the high point of 13.2 per-cent in second quarter 2011, and are
expected to further drop to a low point of 9.7 percent and to remain below 10.5 percent for the next three years, as depicted in Exhibit 4-C3. Strong consumer confidence and increased household spending are expected to lead to increased demand in the retail sector, leading to low vacancy rates, per CBRE Econometric Advisors.
Positive absorption was approxi-mately 9.0 million square feet as of third quarter 2016, reaching 23.5 mil-lion square feet year-to-date. This was a sizable positive change of 8.1 million square feet over prior year-to-date absorption. In addition, CBRE Econo-metric Advisors expects that the retail market will finish 2016 with 31.9 mil-lion square feet of positive net absorp-tion, a significant improvement over the 23.8 million square feet of positive net absorption seen in 2015. Absorp-tion is forecasted to trickle off at that point, with 31.1 million, 23.2 million, and 12.1 million square feet of posi-tive absorption forecasted in 2017, 2018, and 2019, respectively. Accord-ing to CBRE Econometric Advisors, as new construction comes online in 2017, net absorption is expected to decrease.
Net asking rents for neighborhood, community and strip shopping cen-ters averaged $15.65 per square foot as of third quarter 2016, according to CBRE Econometric Advisors. This indicates an expected rental growth of approximately 4.7 percent between 2017 and 2020.
Outlook
Retailers may want to err on the side of caution in regards to how the mar-ket will react in the years to come. New technological and social trends continue to disrupt how people shop and go about their day-to-day lives. With the planned closure of malls and the inevitable disappearance of some beloved shopping center ten-ants, online and mobile shopping in the U.S. will likely continue its increasing market share as a mode of purchasing items from new jeans to a television and even a gallon of milk. Although the industry seems to have rebounded from the impact of the Great Recession, and although retail construction continues to increase, investors and developers should con-tinue to be wary of where we are in the real estate economic cycle.
Vaca
ncy
Rate
(%)
Absorption (M
illions SF)
7
8
9
10
11
12
13
14
3Q 2021
3Q 2020
3Q 2019
3Q 2018
3Q 2017
3Q 2016
3Q 2015
3Q 2014
3Q 2013
3Q 2012
3Q 2011
3Q 2010
3Q 2009
3Q 2008
3Q 2007
3Q 2006 -30
-20
-10
0
10
20
30
Absorption
Vacancy Rate
Completions
Exhibit 4-C3. Retail Property Vacancy and Absorption/Completions
Sources: CBRE Econometric Advisors, 3Q 2016.

EXPECTATIONS & MARKET REALITIES IN REAL ESTATE 2017 | Intersection of Global Change: Embracing a New Era
44 | ©2017 Situs RERC®, Deloitte Development LLC, National Association of REALTORS®. All Rights Reserved.
THE APARTMENT MARKET
Market Overview
The apartment market continued to be the strongest performer among the major property types in third quarter 2016, continuing its dominant streak since the beginning of the recovery from the Great Recession. A number of factors have contributed to the con-tinued success of this sector, including changes to the U.S. economy, housing affordability, employment trends, and changes in the views of many towards homeownership.
U.S. apartment volume has increased every year since 2009, though 2016 vol-ume is expected to fall short of the 2015 total, based on data from Real Capital Analytics (see Exhibit 4-D1)6. A total of $111.5 billion of significant apartment properties were sold in the first three quarters of 2016, representing a YOY increase of 11 percent. While this is lower than the 27-percent increase in volume over the same timeframe in the prior year, it is noteworthy that apart-ments are the only major property type to have a positive YOY volume increase, let alone at a double-digit rate. Sales volume for single-asset sales in the first three quarters of 2016 outpaced portfo-lio sales volume by more than 3 to 1. Rel-ative to 2015, portfolio sales have been much less prominent overall in 2016.
Among apartment types, garden-style apartment properties observed the highest growth, accounting for nearly 70 percent of the total sales volume in the first three quarters of 2016. Investors are continuing to seek opportunities for higher yields outside of the major urban areas, with YOY sales volume growth of 14 percent and 25 percent for second-ary and tertiary markets, respectively, compared to just 6 percent growth for major metro markets. The data appear to indicate that opportunities for rea-sonable yields in urban mid/high-rise
apartments have diminished in recent years in favor of higher-yielding oppor-tunities in garden-style apartments in non-core markets.
Based on the CPPI, pricing for apart-ment properties has increased nation-ally by approximately 14 percent YOY
through August 2016, and is now at a staggering 50 percent above previous peak levels from late 2007. The aver-age price per unit (PPU) has increased, averaging $142,564 in 2016 compared to $131,075 in the first three quarters of the prior year, per Real Capital Analytics.
Volu
me
in $
Bill
ions
Average in Thousands $/Unit
$0
$10
$20
$30
$40
$50
$60
Volume
3Q 2016
1Q 2016
3Q 2015
1Q 2015
3Q 2014
1Q 2014
3Q 2013
1Q 2013
3Q 2012
1Q 2012
3Q 2011
1Q 2011 $80
$100
$120
$140
$160Price $/Unit
Exhibit 4-D1. Apartment Property Volume and Pricing
Source: Real Capital Analytics, 3Q 2016.
6 Unless otherwise noted, the source for the data in this section is Real Capital Analytics.

EXPECTATIONS & MARKET REALITIES IN REAL ESTATE 2017 | Intersection of Global Change: Embracing a New Era
©2017 Situs RERC®, Deloitte Development LLC, National Association of REALTORS®. All Rights Reserved. | 45
As presented in Exhibit 4-D2, average cap rates for the apartment sector have compressed significantly over the last year, decreasing to 5.4 percent in the third quarter of 2016. This represents a 55-basis point decrease from the third quarter of 2015, based on Real Capital Analytics data. Cap rates for mid/high-rise properties averaged 4.8 percent, while rates for garden properties dropped to an aver-age of 5.8 percent, according to Real Capital Analytics. In both cases, the rates were well below historical levels, reflecting the availability of capital, low mortgage rates, and the high demand for this property type. With the poten-tial for rising interest rates and a greater proportion of transactions occurring in secondary and tertiary markets due to investors seeking opportunities for higher yields, it is possible that overall average cap rates may start to change course in 2017.
Investor Composition
Competition for multi-family prod-uct by private investors, REITs, funds and institutions continued in 2016. As was the case in 2015, private investors overwhelmingly dominated the mar-ket in 2016, representing 62 percent of all transaction activity based on Real Capital Analytics data. The second larg-est group of buyers was institutions/funds at 26 percent. Real Capital Ana-lytics noted that REITs continued to be net sellers of apartment assets in an attempt to shed lower quality assets to boost share price.
Starwood Capital Group, which acquired Sam Zell’s Equity Residen-tial (23,000 units) in the first quarter of 2016 for nearly $5.4 billion, was the most active buyer through third quarter 2016 (in terms of investment volume) by a large margin, according to Real Capital Analytics. Other notable buyers were Harrison Street RE Capital and Greystar RE Partners. Notably, two foreign inves-tors, GIC (Government of Singapore)
and CPP Investment Board, rounded out the top five buyers. After Equity Residential, Fairfield Residential, Land-mark ATA, and Campus Crest were the top sellers during the period. Through the first three quarters of 2016, the leading geographic areas (in terms of transaction sales volume) for apartment properties include the
major markets of New York City, Dallas, Atlanta, and Denver, according to Real Capital Analytics. However, markets exhibiting the biggest YOY increases include Las Vegas, Washington, D.C., the Broward market (in South Florida), and Northern New Jersey.
Strong sector fundamentals and intense competition has led to a significant
5.0
5.5
6.0
6.5
7.0
Avg. Cap Rate
3Q 2016
1Q 2016
3Q 2015
1Q 2015
3Q 2014
1Q 2014
3Q 2013
1Q 2013
3Q 2012
1Q 2012
3Q 2011
1Q 2011
Perc
ent
Exhibit 4-D2. Average Apartment Property Cap Rate
Source: Real Capital Analytics, 3Q 2016.

EXPECTATIONS & MARKET REALITIES IN REAL ESTATE 2017 | Intersection of Global Change: Embracing a New Era
46 | ©2017 Situs RERC®, Deloitte Development LLC, National Association of REALTORS®. All Rights Reserved.
pipeline of new apartment projects, as developers look to capitalize on the tight market conditions. According to Axiometrics, 380,032 apartment units are expected to be delivered in 2016, followed by 320,627 and 289,765 more units in 2017 and 2018, respectively. These figures are significant compared to the average new supply of just 132,632 units built annually in 2010 through 2012. New supply is projected to peak in 2016. The total apartment stock as of third quarter 2016 was approximately 25 million units.
Apartment Property Fundamentals
While apartment cap rates are at his-toric lows, property fundamentals have started to show signs of moderating. Though anticipated by many market participants, it appears supply may have finally started to catch up with demand in the sector. According to Axiometrics, Inc., annual effective rent growth was 3.8 percent in third quarter 2016, a decline from 4.9 percent during the same period in the prior year. Rent growth is forecasted to decline further over the next two years to an average of less than 3 percent.
Since the apartment recovery began in second quarter 2010, the vacancy rate fell in 25 consecutive quarters from 7.7 percent to 4.9 percent in second quar-ter 2016 (see Exhibit 4-D3). However, in third quarter 2016, the vacancy rate began to inch up slightly to 5 percent, a trend which is expected to continue up to 5.5 percent in early 2018, per Axiomet-rics, Inc.
A number of markets may continue to outperform the U.S. average in terms of cumulative potential rental revenue growth (i.e., the combined change in effective rental rates and occupancy) from 2017 to 2019. According to forecast information from Axiometrics, Inc., sev-eral of the top 20 markets are expected to outperform the U.S. average over the specified period, with San Francisco, Los Angeles, Houston, Phoenix, and San Diego leading in performance. The lower performing markets are expected to be Tampa, Las Vegas and Washington, D.C.
Outlook
Though the fundamentals suggest that the apartment sector may have begun to moderate, the strong transaction vol-ume, price increases, and continued
cap rate compression indicate that many investors continue to favor this category of commercial real estate. One of the driving forces behind the strength of the apartment market in the current real estate cycle has been the continued reduction in the homeownership rate. According to the U.S. Census Bureau, the homeownership rate stands at just 63.5 percent as of third quarter 2016 (down from nearly 69 percent in 2006). It is noted that the decline in homeown-ership has been most heavily impacted by households under age 35 (the millen-nials), where the rate has fallen to nearly 35 percent (this is down from 43.6 per-cent just over 10 years ago). It remains to be seen if the trend in the number of households either choosing to rent ver-sus own or those individuals lacking the financial means to buy a home will continue. However, with the supply of apartment units projected to remain at a high level over the next several years, any shift on the demand side (with rent-ers becoming homebuyers) could have a major impact on this sector. Given these considerations, the apartment sector appears to be well-poised to pos-sibly experience another year of solid growth in 2017, albeit at a slightly more moderate pace than the previous year.
Vaca
ncy
Rate
(%)
Rental Grow
th (%)
2
4
6
8
10
Vacancy Rate
4Q 2019
4Q 2018
4Q 2017
4Q 2016
4Q 2015
4Q 2014
4Q 2013
4Q 2012
4Q 2011
4Q 2010
4Q 2009
4Q 2008
4Q 2007
4Q 2006
4Q 2005
4Q 2004
4Q 2003
4Q 2002
4Q 2001 -10
-5
0
5
10E�ective Rent Growth
Exhibit 4-D3. Apartment Market Vacancy and Effective Rental Rate Growth
Source: Axiometrics, Inc., 3Q 2016.

EXPECTATIONS & MARKET REALITIES IN REAL ESTATE 2017 | Intersection of Global Change: Embracing a New Era
©2017 Situs RERC®, Deloitte Development LLC, National Association of REALTORS®. All Rights Reserved. | 47
THE HOTEL MARKET
The hotel market continued its ascent over the past six years, and has been hovering near record territory. How-ever, despite recent gains in perfor-mance and large-scale transactions, demand growth is struggling to keep pace with supply growth, and deal vol-ume is declining. As investors analyze comparative cyclical trends, questions linger regarding whether there will be a wholesale correction or whether the sector has merely shifted into neutral for the moment. With recent metric changes, including interest rate hikes and supply additions in select mar-kets, cap rates are rising and pricing is down.
Transaction Trends
The current market cycle for hotel investment has been slowing both in breadth and depth. As of third quar-ter 2016, the year-to-date (YTD) trans-action volume for all hotels was $30.9 billion, according to Real Capital Ana-lytics (see Exhibit 4-E1). In compari-son, the same YTD 2015 transaction volume was $38.2 billion, or 19 percent higher, than where the market is now. However, it is important to note that the largest transactions in YTD 2016 were the Chinese Life Insurance Co. purchase of 280 hotels from Starwood Capital and Anbang’s purchase of the Strategic Hotel portfolio from Black-stone. Without these deals, transaction volume would have fallen by 42 percent YTD 2016 and 38 percent in October 2016, comparable to the same period in 2015. Transaction volume continues to lag previous highs recorded in 2006.
The focal point in the current cycle continues to be in the top six metro areas of New York City, Los Ange-les, Chicago, Boston, Washington, D.C., and San Francisco. As such, hotel transaction volume has slowed recently, particularly in the non-top six metro markets. So while transac-tion volume continues to lag previous
highs, the focused attention from investors on a smaller subset of areas compared to the previous cycle has pushed up the PPU for full-service hotels beyond its peak set in Decem-ber 2015. However, since fourth quar-ter 2015, the 12-month trailing PPU for full-service hotels in the top six metro areas decreased by 4 percent through third quarter 2016 to $355,288. Follow-ing a similar trend, the PPU in non-top six metro areas decreased by 9 percent
to $151,375, according to Real Capital Analytics.
Although full-service hotel deals domi-nated transaction volume in both mar-kets, the non-top six metro markets were more dominant in limited-ser-vice deal volume. Contrary to the rela-tively flat deal volume for full-service hotels, transaction volume for non-top metro limited-service hotels was down by approximately 35 percent since the
Volu
me
in $
Bill
ions Average $k/U
nit
$0
$10
$20
$30
$40
$50
$60
$70
$80
$90
3Q 2016
3Q 2015
3Q 2014
3Q 2013
3Q 2012
3Q 2011
3Q 2010
3Q 2009
3Q 2008
3Q 2007$50
$100
$150
$200
$250
$300
Limited Service PPU
Full-Service PPU
Full Service Volume
Limited Service Volume
Exhibit 4-E1. Hotel Property Volume and Pricing
Source: Real Capital Analytics, 3Q 2016.

EXPECTATIONS & MARKET REALITIES IN REAL ESTATE 2017 | Intersection of Global Change: Embracing a New Era
48 | ©2017 Situs RERC®, Deloitte Development LLC, National Association of REALTORS®. All Rights Reserved.
fourth quarter 2015. PPU for non-top six metro limited-service hotels was $73,535, relatively flat but up slightly by approximately 5 percent from the previous peak recorded in the fourth quarter 2007, per Real Capital Analyt-ics. The subsector is working through supply additions that have disrupted current and future projected returns. While it is too early to say for sure if the limited-service hotels sector will con-tinue its sluggish performance, many investors continue to proceed with caution.
These data are well-reflected in Real Capital Analytics’ transaction-based cap rate trends, as shown in Exhibit 4-E2. Although hotel fundamentals are generally stable, but near record lev-els, and the industry is dealing with a supply glut in most major metro areas, hotel cap rates continue the ascent that they began in first quarter 2015. After a meaningful increase in both full-service and limited-service hotel cap rates at year-end 2015 and into the first quarter 2016, the trend slowed over the second and third quarters in 2016. Comparatively, full-service and limited-service hotel cap rates were 40 basis points and 32 basis points higher, respectively, in third quarter 2016 from same period last year. For both sub-types, the cause may be directly related to slowing demand growth, new supply and interest rate pressure.
Contrary to the trends in most com-mercial real estate sectors, foreign cap-ital investment in the hotel sector has accelerated. With approximately $13 billion in acquisitions on a 12-month trailing basis, December 2016 data from Real Capital Analytics shows that cross-border investors completed 41 percent of total hotel acquisitions. Cross-border investors had already surpassed their acquisitions from the previous cycle recorded during the 12 months ending December 2015, and acquisitions since then are 63 percent higher, per Real Capital Analytics. These purchases, however, are targeted
at large, high-quality hotel portfolios. For example, China Life Insurance Co. purchased 280 hotels from Star-wood Capital for approximately $2 billion in October 2016, and Anbang purchased 15 hotels for approximately $5.6 billion from Strategic Hotel Capi-tal/Blackstone in September 2016. The only other significant purchase was
the Hyatt Regency Honolulu by Mirae (South Korea) for $780 million in Sep-tember 2016, according to Real Capital Analytics.
The change in acquisition composi-tion has been dominated by cross-border and other corporate/govern-ment investors. During the trailing 12
6.5
7.0
7.5
8.0
8.5
9.0
9.5
10.0
10.5
3Q 2016
3Q 2015
3Q 2014
3Q 2013
3Q 2012
3Q 2011
3Q 2010
3Q 2009
3Q 2008
3Q 2007
Perc
ent
All Hotel
Full-Service
Limited-Service
Exhibit 4-E2. Average Cap Rates for Hotel Sector
Source: Real Capital Analytics, 3Q 2016.

EXPECTATIONS & MARKET REALITIES IN REAL ESTATE 2017 | Intersection of Global Change: Embracing a New Era
©2017 Situs RERC®, Deloitte Development LLC, National Association of REALTORS®. All Rights Reserved. | 49
months, cross-border and equity fund investors acquired $20 billion, or 64 percent of total hotel sales, per Real Capital Analytics. Although the recent large-scale transactions were unique, prices have improved enough to allow a clean exit for many of those who had purchased properties during previous cycles. As of third quarter 2016, insti-tutional investors have sold $12 billion, or 38 percent, of hotel dispositions dur-ing the past 12 months, as shown in Exhibit 4-E3.
Hotel Property Fundamentals
With hotel occupancy at all-time highs, the average daily rate (ADR) will play a significant part in maintaining fun-damentals in the near term. Despite relatively low supply additions on average, and strengthening demand since 2007, occupancy levels continue their record run. However, occupancy rate increases are expected to fade by the end of 2016 and, at least for the moment, ADR increases have filled the gap resulting in an increase in revenue per available room (RevPAR), overall. There continues to be a lack of
demand in the corporate sector and group demand growth has tapered off. Despite high occupancy related to the transient sector, ADR growth remains tepid.
According to CBRE Hotels’ Ameri-cas Research, occupancy remained
flat near all-time highs through the first three quarters of 2016, with ADR increasing slightly above 3 percent during the same period. New supply additions are expected to grow in 2017 and surpass the long-term average in 2018 through 2020, diluting any mean-ingful increase in occupancies in the
0
5
10
15
20
25
30
D 3Q 2016
A 3Q 2016
D 3Q 2015
A 3Q 2015
D 4Q 2007
A 4Q 2007
($) B
illio
ns
Cross-Border
Inst’l/Eq Fund
Listed/REITs
Private
User/other
Exhibit 4-E3. Composition of Hotel Acquisitions and Dispositions
Source: Real Capital Analytics, 3Q 2016.

EXPECTATIONS & MARKET REALITIES IN REAL ESTATE 2017 | Intersection of Global Change: Embracing a New Era
50 | ©2017 Situs RERC®, Deloitte Development LLC, National Association of REALTORS®. All Rights Reserved.
near term. Occupancy levels are still expected to remain above the long-run average of 62 percent, per CBRE Hotels’ Americas Research. Overall, hotel fundamentals are expected to remain stable, with less volatility, offering hotel operators time to balance occu-pancy and ADR with profitability expectations.
Since the new supply low point recorded in May 2011, new con-struction has been climbing but still remains below the previous peak recorded in December 2007. Approxi-mately 170,200 rooms were under construction in 2016, reflecting an increase of 29 percent over 2015. During 2016, CBRE Hotels’ Americas Research expected hotel supply to increase to 1.6 percent of the existing hotel room base, while demand was expected to increase by a soft 1.4 per-cent of the existing hotel room base. In previous years, demand growth dominated, reflecting net differences in excess of 3.5 percent in some years. In 2015 and into 2016, the difference in growth flipped to new supply dom-inance, as hotel developers seized the perceived unsatisfied demand built up in previous years. New sup-ply is projected to be 2.1 percent to 2.2 percent in 2018, 2019 and 2020 on an annual basis, as shown in Exhibit 4-E5.
The U.S. hotel industry experienced a record year in 2015, with all-time records posted for occupancy, ADR, RevPAR, supply, demand, and room revenue. Through the first three quar-ters of 2016, all metrics increased with the exception of occupancy, which had a negative change. CBRE Hotels’ Americas Research reports that ADR is likely to increase by 3.3 percent in 2016 YOY, down from 4.5 percent in the previous year. This profit growth for hotel owners should continue in 2017, however at a more measured pace. As occupancy slowly returns to long-term averages, it is expected that ADR will continue its expansion,
assuming occupancy remains sta-ble and near long-term averages. At some point, a correction may occur if ADR gains fail to cover declines in occupancy.
In general, the outlook appears to be good for hotels, despite slowing trans-action activity and rising cap rates. Strength and stability in profitabil-ity forecasts should balance a slight
momentary lapse in growth and dis-ruption from new supply.
Outlook
The U.S. lodging industry is forecasted to achieve a 3.2-percent increase in RevPAR in 2016, much less than the 6.2-percent mark posted in 2015. The primary cause for the slowdown is the projected 0.1-percent decline in
0
1
2
3
4
5
2017F2016F
20152014
20132012
2011
YoY
Gro
wth
Rat
e (%
)
Annual Supply Growth
Annual Demand Growth
Exhibit 4-E5. Hotel Supply vs. Demand Growth
Source: CBRE Hotels’ Americas Research, STR, 3Q 2016.
Occ
upan
cy (%
)
Average Daily Rate ($)
52
54
56
58
60
62
64
66
68
2017F2016F
20152014
20132012
2011 0
20
40
60
80
100
120
140ADR
Occupancy
Exhibit 4-E4. Hotel ADR and Occupancy
Source: CBRE Hotels’ Americas Research, STR, 3Q 2016.

EXPECTATIONS & MARKET REALITIES IN REAL ESTATE 2017 | Intersection of Global Change: Embracing a New Era
©2017 Situs RERC®, Deloitte Development LLC, National Association of REALTORS®. All Rights Reserved. | 51
occupancy. After five years of supply growth at or below 1.0 percent, the number of new available hotel rooms is expected to increase by 1.6 percent in 2016. Concurrently, the demand for accommodations is expected to grow by just 1.4 percent, according to CBRE Hotels’ Americas Research. This would be the first time since 2007 that positive demand growth was exceeded by an increase in supply.
Growth in supply is expected to continue to influence the perfor-mance of the U.S. lodging industry. In 2017, supply growth is expected to exceed demand growth and result in a 0.4-percent decline in occupancy. Fortunately, a second consecutive year of a 3.3-percent rise in ADR is expected to result in a 2.9-percent
increase in RevPAR. RevPAR growth in 2017 is expected to vary by chain-scale segment. Hotels in the luxury and upscale segments will likely see the greatest increases in competitors, and thus experience the least gains in RevPAR. Development activity will likely be lowest in the economy and midscale segments. Hotels in these categories are expected to achieve RevPAR gains in excess of 2.4 percent. The popularity of upper-midscale hotels among consumers and devel-opers is expected to contribute to rel-atively strong increases in supply (2.8 percent), demand (2.7 percent), and ADR (3.3 percent) in this category, per CBRE Hotels’ Americas Research. Occupancy growth is believed to have peaked and ADR gains are decel-erating. Considering the projected
performance, CBRE Hotels’ Ameri-cas Research is forecasting contin-ued, less volatile revenue and profit increases for the foreseeable future. This combination may provide clarity to decisions as the next round of sup-ply hits the market.
Cap rates for the hotel sector overall are likely to increase in the long term; however, cap rates for properties in the top six top metro areas may lag due to strong cross-border interest. Rising interest rates will certainly slow the tightening of the equity spread and accelerate pressure on additional cap rate increases. In this circumstance, a temporary slowdown in transaction volume can be expected, as investors realign risk and return assumptions.

EXPECTATIONS & MARKET REALITIES IN REAL ESTATE 2017 | Intersection of Global Change: Embracing a New Era
52 | ©2017 Situs RERC®, Deloitte Development LLC, National Association of REALTORS®. All Rights Reserved.
5 SUMMARY & OUTLOOKCHANGES ABOUND FOR COMMERCIAL REAL ESTATE

EXPECTATIONS & MARKET REALITIES IN REAL ESTATE 2017 | Intersection of Global Change: Embracing a New Era
©2017 Situs RERC®, Deloitte Development LLC, National Association of REALTORS®. All Rights Reserved. | 53
As 2017 gets further underway, we are standing at a nexus. Phenomena that have been brewing for years are finally converging into an intersection of change, not only domestically but also globally. Technology, demographics and geopolitical events are expected to fundamentally change the face of com-mercial real estate. Millennial prefer-ences in living spaces and work spaces are taking over the marketplace. Indus-tries in the sharing economy (think Uber, Airbnb and WeWork), which did not even exist a decade ago, are chang-ing the way that people use and lease space. E-commerce is driving demand for industrial space and forcing many retailers to rethink their strategies for competing in a digital world where “bricks and sticks” are being replaced by “point and clicks.” Mall anchors are becoming obsolete, and are being replaced by pop-up stores that have flexible leases. Virtual reality and 3-D printing are allowing investors, ten-ants and landlords to visualize projects in new and exciting ways. In addition, all of these factors are occurring in the midst of radical geopolitical changes in the U.S. and abroad.
Even the lines separating property types are blurring, as millennial demand for rental properties has resulted in home-builders producing more rental units, according to Deloitte’s 2017 Commer-cial Real Estate Outlook. Commercial real estate financing is also moving into new territories as regulatory burdens shift lending from traditional banks to private funds, shadow banks and even crowdsourcing platforms.
It is expected that investors will con-tinue to generally exhibit risk-off ten-dencies in 2017 due to geopolitical and regulatory uncertainty. However, because Treasury rates will likely con-tinue to be at historic lows throughout 2017 despite predicted increases, many investors will likely take on more risk
in the quest for yield than in 2016. This makes overall commercial real estate – and its solid risk-adjusted returns – continue to be an attractive investment option compared to other alternatives. Commercial real estate investment can serve as a buffer against most potential downturns or correction because of the income component.
These changes bring innovation and opportunities for commercial real estate investment, but there will be win-ners and losers in this new era. In this chapter, we present our outlook for the economy and commercial real estate in 2017.
Commercial Real Estate Outlook for 2017 – Transactions and Prices Expected to Moderate
We begin our 2017 outlook with an anal-ysis of commercial real estate transac-tions, prices and values. The year 2015 was a record year for commercial real estate transaction volumes, primarily due to large portfolio and entity-level transactions, which resulted in a YOY decline for transaction volumes in 2016, per Real Capital Analytics. While this
downward trend, combined with high property prices, presents headwinds for transaction volume in 2017, tailwinds for the commercial real estate market include the anticipated economic boost from the new presidential adminis-tration and a continuation of strong property fundamentals. It should also be noted that while the “Trump effect” is expected to boost commercial real estate investment due to decreases in regulations and to other pro-business policies, President Trump’s hasty policy directives are likely to unnerve inves-tors. With a confluence of positive and negative factors expected in 2017, trans-action volume is likely to be similar, or perhaps a little more muted, than 2016 levels.
While overall transaction volumes were down in 2016, some deals were made (although somewhat hard-fought) with prices comparable to those seen in 2015. Notable deals during 2016 included:
� Seattle’s 50-story Safeco Plaza was purchased by GLL Real Estate Partners GmbH (a Munich-based asset manager) for $387 million in July 2016, according to the Seattle
CHANGES ABOUND FOR COMMERCIAL REAL ESTATE
EXPECTATIONS & MARKET REALITIES IN REAL ESTATE 2017 | Intersection of Global Change: Embracing a New Era
54 | ©2017 Situs RERC®, Deloitte Development LLC, National Association of REALTORS®. All Rights Reserved.
Times. Foreign buyers have been snagging trophy assets as many investors view Seattle as a top-tier investment target.
� The Borgata Hotel Casino and Spa in Atlantic City was purchased by MGM Resorts International for $1.8 billion, according to Real Capital Analytics. This hotel trans-action was the largest in 2016 by a wide margin.
� According to the Denver Business Journal, Pensam Residential, BH Equities LLC, and Wafra Capital Partners purchased the 1,523-unit Denver apartment complex known as Breakers Resort from The Bas-com Group and Denver’s Koelbel & Co. With a purchase price of $350 million, this was the biggest apart-ment trade in Colorado’s history.
� In August 2016, Chinese investor HNA EcoTech Group acquired the property at 123 Mission St. in San Francisco, according to the San Francisco Star. The 346,000-square foot office tower was purchased for $255 million, a 42-percent gain over the $179 million that the seller Great Eagle Holdings paid in 2013.
� The New York Business Daily reported that 80 Park Plaza, one of the largest office towers in Newark, was sold to Nightingale Properties in October 2016. The 973,000-square foot Class A office property was purchased for $174.5 million.
Transaction volume growth in 2017 is likely to be uneven across all markets. We expect that transaction volumes in the primary markets will decrease, as exceptionally high prices usually put a damper on yields and deter new buy-ers from entering the market. In addi-tion, high prices in primary markets mean that institutional investors are most likely to hold Class A assets in pri-mary locations. Therefore, the greatest
increase in transaction volumes is likely to be in the secondary and tertiary mar-kets, or in alternative assets such as self-storage or parking facilities.
While overall commercial property prices registered only modest growth in the first three quarters of 2016 com-pared to the prior year, according to the Moody’s/Real Capital Analytics CPPI, commercial real estate prices have exceeded pre-crisis levels for most prop-erty types. Situs RERC’s institutional investment survey respondents also expressed concern about commercial property prices. While current value vs. price ratings reflect that commercial real estate values were nearly equal to price in third quarter 2016, ratings have decreased compared to three years ago, indicating less value compared to price, and have been trending towards levels similar to those before the Great Recession. Survey respondents felt that valuation levels supported the pricing in the market, but many respondents also felt that prices had peaked for most sectors in most markets. These results suggest that the market is fully-priced and a market correction is near. It is expected that commercial real estate
prices will plateau in 2017 for core mar-kets, but may increase in the secondary and tertiary markets as investors look for higher yields.
In addition to having the highest volume (see Exhibit 4-2), apartment properties posted the strongest price gain at 12.7 percent YOY as of November 2016, per Moody’s/Real Capital Analytics CPPI. Growth in industrial property prices was a respectable 12.3 percent annually as of November 2016, according to the CPPI. Retail and office property price growth was more modest, at 3.4 percent and 8.8 percent, respectively. The aver-age price for hotel properties was 1.4 percent higher in the first nine months of 2016 compared with the same period in 2015.
Situs RERC’s value vs. price ratings for the industrial and apartment sectors increased in third quarter 2016 com-pared to a year earlier. The retail sector rating was unchanged compared to a year ago, but still offered slightly greater value compared to price. The office sec-tor was pricier in third quarter 2016 com-pared to the previous year, with the rat-ing indicating that price outpaced value.

EXPECTATIONS & MARKET REALITIES IN REAL ESTATE 2017 | Intersection of Global Change: Embracing a New Era
©2017 Situs RERC®, Deloitte Development LLC, National Association of REALTORS®. All Rights Reserved. | 55
Situs RERC’s 10-Year Treasury Forecast
While the Federal Reserve has indi-cated that they will increase short-term interest rates in 2017, it is important to note that interest rates have been at his-toric lows for an abnormally long time. According to the U.S. Treasury Depart-ment, the 10-year Treasury rate has stayed below 3 percent since July 2011, which is an anomaly considering that the long-term average at 6.30 percent is more than twice the current rate. These low rates have fundamentally changed portfolio capital allocation as investors searching for yield move from bonds to other alternatives. Not only has com-mercial real estate had the luxury of inexpensive capital (at least for well-qualified buyers), but the relative safety of the commercial real estate market compared to the volatility of the stock market has offered investors a solid place to park their cash.
January’s economic forecast by The Wall Street Journal indicated that the 10-year Treasury would likely rise to 2.65 per-cent by June and to 2.89 percent by the end of 2017. Additionally, the January forecast from The Wall Street Journal indicates that inflation was likely to increase to roughly 2.35 percent by the end of 2017 and to roughly 2.5 percent by the end of 2018. This is higher than the FOMC’s long-run inflation target of 2 percent.
According to Situs RERC, base case expectations for the 10-year Treasury yield rate are 2.69 percent in six months, 2.85 percent by the end of 2017, and 3.12 percent by the end of 2018 (see Exhibit 5-1, a duplicate of Exhibit 3-4). With the 10-year Treasury yield rate at 2.43 per-cent in January 2017, according to the Federal Reserve, all scenarios point to an increase in rates in the first three quarters of 2017, but the scenarios diverge beyond that point. The base case scenario has rates increasing to a high of 2.88 percent in third quarter 2017, dipping slightly to 2.85 percent in fourth
quarter 2017, but continuing an upward trajectory to 3.15 percent in first quarter 2019. The base case assumes that infla-tion remains under control, that the FOMC raises rates two to three times in 2017, and that the economy continues a steady march toward improvement.
The upside scenario sees the 10-year Treasury rate increasing throughout 2017 to approximately 3.40 percent in fourth quarter 2017. In the upside
scenario, the 10-year Treasury rate con-tinues to increase in 2018, reaching 3.65 percent in first quarter 2019. The upside scenario assumes a larger inflation increase, that the U.S. dollar continues to appreciate, that the pace of interest rate increases rises, and that infrastruc-ture spending increases soon.
In the downside scenario, the 10-year Treasury yield rate increases slightly in the first three quarters of 2017 to a
0.0
0.5
1.0
1.5
2.0
2.5
3.0
3.5
4.0
4.5
5.0
1Q 2019
1Q 2018
1Q 2017
1Q 2016
1Q 2015
1Q 2014
1Q 2013
1Q 2012
1Q 2011
Perc
ent
10-Year Treasury
Downside
Base
Upside
Exhibit 5-1. Situs RERC 10-Year Treasury Forecast
Sources: NCREIF, Situs RERC, 4Q 2016. Note: Shaded area reflects Situs RERC’s outlook for Base, Upside, and Downside Scenarios through 1Q 2019. This exhibit is a duplicate of Exhibit 3-4 found on page 28 of this report.

EXPECTATIONS & MARKET REALITIES IN REAL ESTATE 2017 | Intersection of Global Change: Embracing a New Era
56 | ©2017 Situs RERC®, Deloitte Development LLC, National Association of REALTORS®. All Rights Reserved.
high of 2.50 percent, dips slightly to 2.45 percent in fourth quarter 2017, and continues its descent throughout 2018 to 2.05 percent in first quarter 2019. The primary driver of this estimate is an environment in which the new admin-istration’s policies do not come to frui-tion, the FOMC holds off any additional rate increases, and the economy slows. Additionally, the downside scenario factors in greater global disruption stemming from Brexit and increased uncertainty in global markets.
SITUS RERC’S NCREIF NPI TOTAL RETURN FORECAST
Total returns are derived from a com-bination of income components and capital components. Situs RERC’s fore-casts for different measurements of the income component and capital com-ponent of total returns are discussed below. Each of these indicators provides a slightly different view of the factors affecting total commercial real estate returns. For the income component, we present forecasts for NOI, cash flow, and capitalization rates. For the capi-tal component, we present forecasts of commercial real estate price changes and capital appreciation. The price change forecast incorporates both capi-tal returns and capital expenditures, while the capital appreciation forecast examines trends in capital appreciation only. At the end of this section, we pres-ent the Situs RERC total return forecast for the NCREIF Property Index (NPI).
All forecasts incorporate data from the NCREIF NPI and are for unlever-aged, institutional-grade properties. Although we provide individual fore-casts for these components, it is impor-tant to note that Situs RERC’s forecast for NCREIF NPI returns assumes inter-dependency among these and other metrics. Therefore, any changes in one metric would affect the other forecasts as well. In addition, all the returns are projected out in three possible scenar-ios – base case, downside, and upside.
The Income Component of Total Returns: NOI NCREIF defines NOI as, “Gross rental income plus any other income less operating expenses - utilities, mainte-nance, taxes, property management, insurance, etc.,” and NOI growth is based on the assumption that NOI is received at the end of each month dur-ing the quarter.
According to NCREIF, historical NOI growth has been relatively steady over its 38-year history, with 3.01-percent growth since inception. However, growth has accelerated in recent years, with 1-year, 3-year, and 5-year annual growth at 5.38 percent, 5.76 percent, and 5.06 percent, respectively, due largely to record-breaking prices, low Treasury rates, and the general positive performance of the commercial real estate industry.
Situs RERC’s forecast for the base case scenario conveys that NOI growth will be relatively stronger at 5.87 per-cent annually in 2017 than in 2016 (see Exhibit 5-2). The downside scenario is
a bit lower, albeit aligned with the long-term average, at 4.57 percent annually. The upside scenario depicts a much brighter viewpoint at 6.92 percent, as fundamentals are expected to be even stronger in 2017 with higher occupancy and rent growth.
The Income Component of Total Returns: FCFY Forecast
Per NCREIF, the free cash flow yield (FCFY) is the quarterly NOI minus ordinary or routine capital expenses, divided by the beginning market value in the quarter, and focuses on quarterly net cash flow from operations includ-ing accounting for ordinary or routine capital expenditures. This measure is comparable to stock dividend yield after capital expenditures have been paid, providing investors with an estimate of the additional income they can expect to receive from investing in the proper-ties at a particular point in time.
Historical FCFY has been perform-ing consistently at 4.90 percent since NCREIF’s inception. However, the yield has been steadying over the recent year,
0
1
2
3
4
5
6
7
8
20182017
20162015
20142013
20122011
2010
Perc
ent
Exhibit 5-2. Situs RERC NCREIF NPI NOI Growth Forecast
Sources: NCREIF, Situs RERC, 4Q 2016. (Note: Shaded area reflects Situs RERC’s outlook for the Base Case Scenario for 2017 and 2018.)
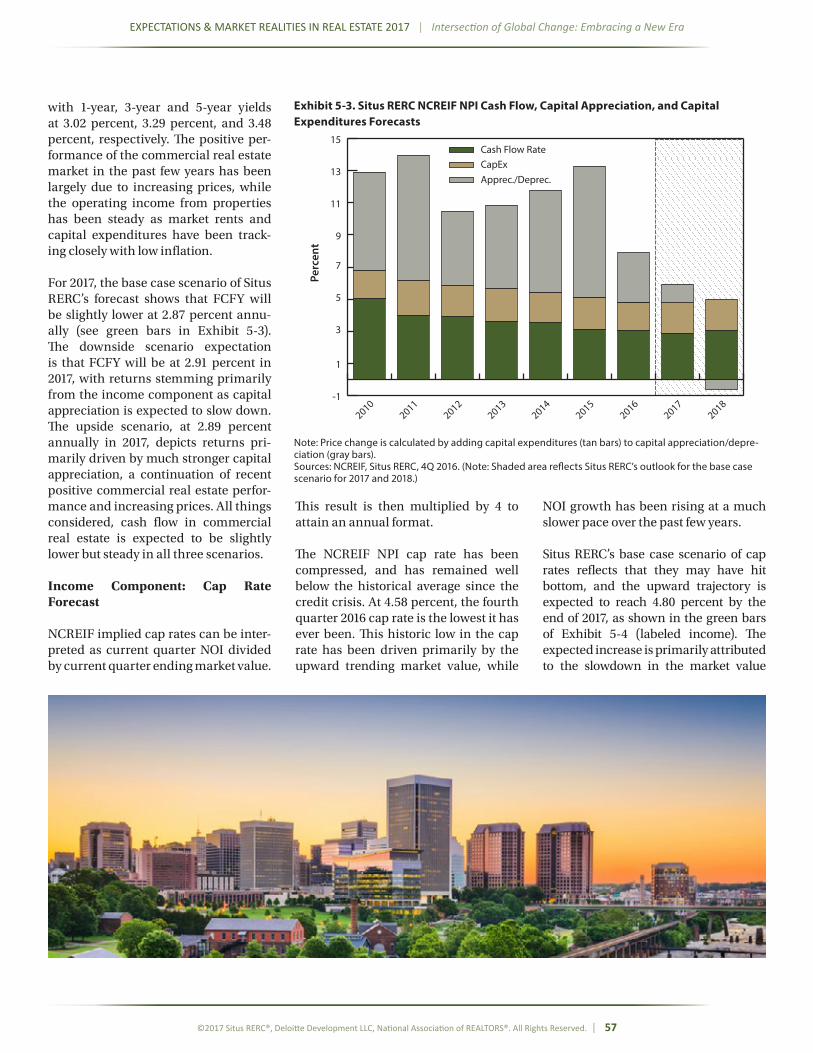
EXPECTATIONS & MARKET REALITIES IN REAL ESTATE 2017 | Intersection of Global Change: Embracing a New Era
©2017 Situs RERC®, Deloitte Development LLC, National Association of REALTORS®. All Rights Reserved. | 57
with 1-year, 3-year and 5-year yields at 3.02 percent, 3.29 percent, and 3.48 percent, respectively. The positive per-formance of the commercial real estate market in the past few years has been largely due to increasing prices, while the operating income from properties has been steady as market rents and capital expenditures have been track-ing closely with low inflation.
For 2017, the base case scenario of Situs RERC’s forecast shows that FCFY will be slightly lower at 2.87 percent annu-ally (see green bars in Exhibit 5-3). The downside scenario expectation is that FCFY will be at 2.91 percent in 2017, with returns stemming primarily from the income component as capital appreciation is expected to slow down. The upside scenario, at 2.89 percent annually in 2017, depicts returns pri-marily driven by much stronger capital appreciation, a continuation of recent positive commercial real estate perfor-mance and increasing prices. All things considered, cash flow in commercial real estate is expected to be slightly lower but steady in all three scenarios.
Income Component: Cap Rate Forecast
NCREIF implied cap rates can be inter-preted as current quarter NOI divided by current quarter ending market value.
This result is then multiplied by 4 to attain an annual format.
The NCREIF NPI cap rate has been compressed, and has remained well below the historical average since the credit crisis. At 4.58 percent, the fourth quarter 2016 cap rate is the lowest it has ever been. This historic low in the cap rate has been driven primarily by the upward trending market value, while
NOI growth has been rising at a much slower pace over the past few years.
Situs RERC’s base case scenario of cap rates reflects that they may have hit bottom, and the upward trajectory is expected to reach 4.80 percent by the end of 2017, as shown in the green bars of Exhibit 5-4 (labeled income). The expected increase is primarily attributed to the slowdown in the market value
-1
1
3
5
7
9
11
13
15
20182017
20162015
20142013
20122011
2010
Perc
ent
Cash Flow RateCapExApprec./Deprec.
Exhibit 5-3. Situs RERC NCREIF NPI Cash Flow, Capital Appreciation, and Capital Expenditures Forecasts
Note: Price change is calculated by adding capital expenditures (tan bars) to capital appreciation/depre-ciation (gray bars).Sources: NCREIF, Situs RERC, 4Q 2016. (Note: Shaded area reflects Situs RERC’s outlook for the base case scenario for 2017 and 2018.)

EXPECTATIONS & MARKET REALITIES IN REAL ESTATE 2017 | Intersection of Global Change: Embracing a New Era
58 | ©2017 Situs RERC®, Deloitte Development LLC, National Association of REALTORS®. All Rights Reserved.
trend. The downside scenario shows the cap rate rising higher at 5.00 per-cent, taking investors back to 2014 lev-els. However, the upside scenario states that the upward trending market value will continue, resulting in the continued compression of cap rates at 4.65 percent.
The Income Component of Total Returns: Conclusions
Situs RERC’s income component out-look for 2017 is relatively stable and is expected to be the primary driver for total real estate yields as the market value growth slows, and cash flow and NOI stabilize with cap rates stopping further compression.
The Capital Component of Total Returns: Price and Capital Apprecia-tion Forecasts
Commercial real estate value can be described in terms of price changes, which combine capital expenditures and capital returns, or from a capital appreciation perspective only. Situs RERC’s capital appreciation forecast provides an alternative way to examine prices, since a significant portion of the run-up in commercial real estate prices is due to capital improvement projects (including leasing activity).
Situs RERC’s analysis revealed that from the 2008 price peak through the 2009 trough, commercial real estate prices declined 29.3 percent but they have made a remarkable recovery since then, increasing 68.6 percent. Cur-rently, commercial real estate prices are 19.2 percent higher than the first quarter 2008 peak. Situs RERC’s out-look for prices in 2017 is still positive, but the outlook wanes in the base case scenario, where the annual growth in prices is expected to be just 2.2 percent by third quarter 2017 (refer to the com-bined tan and gray bars in Exhibit 5-3 for the price change forecast).
Capital appreciation dropped 31.7 per-cent in the wake of the Great Recession,
per Situs RERC’s analysis. Today, value has increased 9.9 percent, and is now 2.4 percent higher than its previous peak in first quarter 2008.
Situs RERC’s outlook for capital appre-ciation in the coming years is a bit less favorable than in previous years (see gray bars in Exhibit 5-3 for the capital appreciation forecast). Capital appre-ciation is expected to slow over the next several quarters until it becomes close to zero by the end of 2017 and negative for 2018 as the cycle matures and the chance of a correction increases. How-ever, a continuing positive for commer-cial real estate is the continuing stable income from strong fundamentals and the relatively low interest rate environ-ment (in spite of recent interest rate increases) created by global pressures.
The Capital Component of Total Returns: Conclusions
The price change forecast shows a significant increase since the Great Recession, but it should not be inter-preted as true appreciation, as much of the increase was driven by capital
expenditures. When considering com-mercial real estate from a capital appre-ciation return perspective only, the relative increase is not so dramatic. Although prices have increased dra-matically since the Great Recession, capital appreciation is only slightly higher than the prior peak, after factor-ing in all capital expenditures incurred over the period.
NCREIF NPI Total Return Forecast
Historical total return, a combination of income and capital components, has been on a solid, albeit slightly down-ward, trajectory in the past few years with 1-year, 3-year, and 5-year total returns at 7.99 percent, 11.13 percent and 11.01 percent, respectively, per NCREIF. Both record-breaking prices and stable cash flow contributed to commercial real estate being one of the highest-rated investments alternatives, and this status as a top investment will likely continue into 2017.
Situs RERC’s forecast for the base case scenario shows that total return will be steady around 5.99 percent annually in
-1
1
3
5
7
9
11
13
15
20182017
20162015
20142013
20122011
2010
Perc
ent
IncomeAppreciation
Exhibit 5-4. Situs RERC NCREIF NPI Cap Rate and Total Return Forecast
Note: The income component in this chart refers to capitalization (cap) rates. The income component and the capital appreciation component are combined to produce total returns.Sources: NCREIF, Situs RERC, 4Q 2016. (Note: Shaded area reflects Situs RERC’s outlook for the base case scenario for 2017 and 2018.)

EXPECTATIONS & MARKET REALITIES IN REAL ESTATE 2017 | Intersection of Global Change: Embracing a New Era
©2017 Situs RERC®, Deloitte Development LLC, National Association of REALTORS®. All Rights Reserved. | 59
2017 (the combination of green and tan bars in Exhibit 5-4 combine to represent total returns). As demonstrated, the income component will be the major contributor to total return as a strong appreciation cycle witnessed over the past five years has come to an end. The forecast for the downside scenario is negative, at -0.61 percent annually, with the income component almost offset-ting the negative capital appreciation given the interest rate and fiscal uncer-tainties. At 10.4 percent, the upside sce-nario portrays a much more positive viewpoint, reversing the downward trending returns in 2016 to higher than 10 percent.
Total Return Forecast - Conclusions
The Situs RERC institutional unlever-aged commercial real estate return forecast is relatively favorable but will continue at a slower pace in 2017 as commercial real estate has entered a new stage of the cycle. Fundamen-tals are still solid, which in turn drive NOI to be marginally better than 2016. Although NOI growth is expected to be steady, cap rates may have already
hit the bottom and an upward trend is anticipated in 2017, primarily driven by decelerating market value growth. Cash flow is expected to operate around the 20-year average in 2017, as market values begin to stabilize, although low energy prices and tame inflation will likely keep capital expenditures at bay. Consequently, NCREIF total returns are expected to be fairly subdued but steady around the 10-year average with the majority of the return coming from the income component as appreciation slows. In general, this means that com-mercial real estate is still in a favorable position to offer investors a decent risk-adjusted return in 2017.
ECONOMIC AND COMMERCIAL REAL ESTATE INVESTMENT SCENARIOS FOR 2017
To summarize our collective 2017 pre-dictions for the economy and for com-mercial real estate, we provide a sum-mary of different scenarios (see Exhibit 5-5). While it is impossible to predict the future with absolute certainty, our base case presents the most likely scenario based on our statistical analysis and
industry insight. Despite various uncer-tain elements, expectations are gener-ally positive.
As we enter the eighth year of economic expansion, GDP growth has been steady, but lackluster. We anticipate that GDP growth will remain between 2 percent and 3 percent in 2017 as the economy continues to improve. A stron-ger economy can create a foundation of solid fundamental growth for commer-cial real estate. With regard to inflation, it remained below the Federal Reserve’s target rate in 2016, but we expect that with a stronger economy, inflation will increase. In addition, home prices continue to rise, driven by increases in wage growth and lack of supply, which can be a boon for the economy. How-ever, as previously mentioned, this is not likely to impact commercial real estate because inflation can be passed along to tenants.
With the economy picking up steam towards the latter part of 2016, the Fed-eral Reserve felt confident enough to increase interest rates in 2016. They also indicated that they intend to increase

EXPECTATIONS & MARKET REALITIES IN REAL ESTATE 2017 | Intersection of Global Change: Embracing a New Era
60 | ©2017 Situs RERC®, Deloitte Development LLC, National Association of REALTORS®. All Rights Reserved.
rates multiple times throughout 2017 and we expect them to follow through with this. Commercial real estate should not be significantly impacted by these increases, as the rate increases are likely to be small, with the Federal Reserve forewarning investors before each increase.
The private equity sphere is expected to have modest gains in 2017 due to solid valuations and strong foreign invest-ment. However, growing inflation, and resultant interest rate increases, are a potential concern for the public equity markets. On the private debt side, aggressive pricing will likely create more favorable spreads for lenders in 2017, and expected reductions in regu-lations from the Trump administration will likely ease the burden on local and regional banks leading to increased capital flow. For public debt, the high yields demanded by CMBS investors in 2016 are expected to become more rea-sonable as decreases in CMBS origina-tions are expected to continue in 2017. This will likely result in more competi-tive CMBS yield spreads in 2017, lead-ing the CMBS market to gain back some
of its lending market share from other lenders.
Risk-adjusted returns for commercial real estate are expected to remain solid in 2017, although the pace of return growth is expected to moderate. Total returns will be primarily driven by the income component; given that NOI and capital expenditures are expected to remain stable in 2017, cap rate com-pression is expected to slow or reverse as capital appreciation decreases. We forecast that total expected returns will be between 5 percent and 7 percent for institutional unleveraged proper-ties. Since the market is fully-priced, commercial real estate growth is likely to be slow and steady in 2017 as prices are expected to level off. Values are expected to continue to support prices. While transaction volumes fell in 2016 after peaking in 2015, we predict that volumes are likely to stabilize in 2017, though foreign capital flow will likely continue at a solid pace. As such, cap rates might stabilize and begin increas-ing. It should be noted that despite inherent risks in the secondary and tertiary markets, many investors will
increase their appetite for deals in these locations in 2017 due to the exorbitant prices (and decreased yields) for Class A properties in prime locations.
In 2017, the intersection of change will result in specific property types per-forming better than others. Among the strong winners is the industrial sec-tor, particularly industrial warehouse properties. The boom in e-commerce will likely stoke demand for warehouse space, which will outstrip supply, and cap rates will likely continue to com-press as a bidding war for space drives up prices. In addition, President Trump is expected to support policies that support the creation of manufactur-ing jobs. Should such policies come to fruition, demand for industrial space will surge. The apartment sector is also expected to experience growth in 2017 as demand remains high, par-ticularly among the millennial genera-tion. While new supply is coming on the market in 2017, more people are expected to choose to rent rather than purchase a home, keeping demand strong. This trend, combined with solid employment and wage growth, will

EXPECTATIONS & MARKET REALITIES IN REAL ESTATE 2017 | Intersection of Global Change: Embracing a New Era
©2017 Situs RERC®, Deloitte Development LLC, National Association of REALTORS®. All Rights Reserved. | 61
help buoy rent growth for awhile longer. For the office sector, solid employment figures are expected to lead to a steady increase in demand for office space in 2017, but new supply is expected to meet and exceed this demand, result-ing in flattening cap rates.
While slight rental growth is fore-casted for the retail sector, cap rates are expected to flatten as prices have peaked relative to demand. It should be noted that the retail sector is expe-riencing fundamental changes and any major disruption will likely have a neg-ative impact on retail sector growth. Some property subtypes, such as Class B and Class C malls, are becoming obsolete, so while good deals still exist in the retail market, investors should be cautious. Lastly, the hotel sector is expected to experience a slowdown compared to last year, due in part to a strong U.S. dollar and new supply coming online. Occupancy rates have peaked, and ADR is expected to decel-erate, resulting in increased cap rates for the sector.
AT THE INTERSECTION IN 2017: ALL ROADS POINT TO CHANGE
The current commercial real estate environment is filled with opportuni-ties and challenges as political, demo-graphic and technological changes collide to transform the way people use space. While the Trump administra-tion is expected to bring tax cuts (both personal and business), an increase in infrastructure and military spending, and pro-business policies, many inves-tors are becoming anxious about what steps President Trump will take, espe-cially in relation to free-trade agree-ments and additional controls on immi-gration and foreign work visas. Yet, the U.S. is still considered a safe investment destination compared to other markets, and foreign investment is likely to con-tinue at a solid pace in 2017.
While the commercial real estate mar-ket is expected to continue to grow in 2017, it is important for investors to remain cautious as we near the end of the cycle. The pace of growth in the
market is expected to slow in 2017, but we do not expect a market correction to occur yet. In 2017, prices will likely continue to be supported by valua-tions as fundamentals remain strong. The commercial real estate market has been in recovery for seven years, driven by low interest rates and solid returns, and prices have returned to pre-crisis levels.
Commercial real estate, at this intersec-tion of change, is expected to continue to offer investors a safe haven. During times of uncertainty, real assets such as commercial real estate are attrac-tive because of their predictable cash flow. Historically low interest rates, despite future expected rate hikes in 2017, have stimulated and will continue to stimulate investment in this market. Although many challenges await us in 2017, whether from political uncer-tainty, new technology or social trends, there are also many opportunities to embrace in this new era. Investors should expect the unexpected in 2017, and be cognizant of the changes ahead.

EXPECTATIONS & MARKET REALITIES IN REAL ESTATE 2017 | Intersection of Global Change: Embracing a New Era
62 | ©2017 Situs RERC®, Deloitte Development LLC, National Association of REALTORS®. All Rights Reserved.
NOTE: These are not the only scenarios that are possible. There will usually be differences between the forecasted and actual results because events and circumstances frequently do not occur as expected, and those differences may be material.Sources: BLS, BEA, The Conference Board, RCA, NCREIF, NAR, Situs RERC, Deloitte, January 2017.
Exhibit 5-5. Alternative Economic Scenarios for 2017
Lower Case Scenario: Decelerating Growth
Baseline Case Scenario: Continued Slow Growth
Higher Case Scenario: Better Growth
U.S. GDP Real Growth Less than 2.0 percent 2.0 percent to 3.0 percent 3.0 - 4.0 percent or greater
Probability Slightly Likely Most Likely Reasonably Likely
Employment
Job growth slows as demand for labor decreases and dis-
couraged job seekers leave the workforce or take jobs for
which they are overqualified. Long-term unemployment and
wage stagnation increase as the labor participation rate flat-
tens or declines moderately.
Unemployment continues below 5 percent at full employ-
ment and averages 180,000 new jobs per month. The labor
participation rate remains around 60.0 percent. A stable and
improving labor market steadily causes wage growth to in-
crease moderately.
Average job growth is 280,000 or more new jobs per month,
and unemployment drops to less than 4.5 percent, led by
manufacturing. Overqualified workers matriculate to respec-
tive fields, and discouraged workers re-enter the workforce,
creating about 4-percent wage growth.
Housing Market
The increase in mortgage rates, led by the increase in inter-
est rates and high home prices, makes prospective buyers
unwilling or unable to finance a home. The housing recov-
ery stagnates, and home prices start to spiral downward.
Foreclosure risks increase due to anemic demand and higher
financing costs.
Existing home sales stabilize around 5.5 million units annu-
ally and new home sales remain above 500,000 annualized.
Top markets stabilize as new construction hits the market,
while bottom markets make traction towards pre-recession-
era highs. The housing market causes the residential invest-
ment component of GDP to grow by 8 percent. Pricing con-
tinues to be a concern and first-time home buyers are priced
out of the market.
With a stronger job market and increasing wage growth,
home buyers have enough accumulated wealth to purchase
homes and the housing market accelerates. Millennials find
secure jobs outside major metropolitan areas, begin to form
their own households, and purchase homes. Although new
construction increases, supply is unable to meet demand,
pushing prices higher and further increasing new home
starts.
Consumer Spending
Consumers retrench as personal and disposable incomes
flatten or fall due to stagnating wage growth and increas-
ing interest rates. Purchasing power falls as inflation causes
prices to increase. Large durable goods sales are hurt the
most, but all product sales suffer. Demand for cheaper im-
ported goods increases.
Consumer confidence continues to improve and stabilizes
above 100. Personal consumption expenditures continue
to grow above 3.0 percent. Consumers continue increasing
spending in line with higher incomes from wage growth, tax
cuts and low energy costs. This creates a further positive
feedback loop for inflation.
Consumers feel more secure in their jobs, and with signifi-
cant wage growth, begin to spend freely. Personal saving
falls below 5 percent as consumer confidence stays above
110. Major purchases and upgrades to durables goods
occur.
Business Spending
Businesses struggle to keep up with increasing interest rates,
and expenses are cut. New hiring ceases and wage growth
stays flat. Potential layoffs commence in search of efficiency
and profit margin.
Business profits expand and spending increases, as businesses
gain more confidence in positive/stable economic growth and
low/stable fuel costs. Business investment grows at a rate of
3 percent.
Business spending increases, especially in infrastructure,
due to pro-growth policies. Competition drives investment
in intellectual property like software or R&D. The search for
new investment spurs start-ups and venture capital growth.
Government Spending
Increases in government spending via substantial tax cuts
and infrastructure spending hurts the economy, leading to
inflation. Federal Reserve increases short-term interest rates
to tackle growing inflation.
Potential tax cuts and infrastructure spending cause the
federal deficit to increase, but they do not hurt growth. The
increase in consumer spending fills the gap from the federal
deficit; revenue increases due to stable economy.
Federal debt starts to decrease due to increased revenue, but
government still operates at a deficit due to cost of public sec-
tor growth. Congress and president work together on a budget
and to reduce cost of government programs.
Trade Balance
Dollar further appreciates with interest rates and inflation.
Trade balance negatively affected due to global economic
slowdown, especially in Europe and China, plus tariffs and
other trade restrictions hinder exports, adding about $500
billion to trade deficit.
Despite uncertainties, trade deficit remains steady or slightly
lower as economy strengthens, trading partners continue to
recover, and imports increase. Global GDP performs above 3
percent. Appreciation of the dollar slows; president takes a
more neutral stance on trade.
Trade deficit narrows as Europe's and other major trad-
ing partners' economies strengthen. The dollar turns, and
becomes cheaper due to improving global economies and
stabilizing geopolitical issues. President implements U.S.-
centric trade deals, and exports increase.
InflationPrices, including those for energy/oil, rise as a result of an
inflationary environment.
Energy prices stabilize, and inflation is driven by fiscal stimu-
lus and low unemployment. However, inflation remains near
the FOMC's 2.0-percent target.
Inflation approaches 3.0 percent , and we see the first price
increases in durable goods in more than 3 years.
Interest Rates
The 10-year Treasury yield rate increases to mid to upper
3-percent level, helping to prevent excessive fiscal spending
in an inflationary environment.
With strong economic growth, FOMC raises rates several
times in 2017, as planned. The 10-year Treasury yield rate
rises gradually to roughly 2.4 percent to 2.5 percent.
The U.S. economy accelerates more than expected. FOMC
raises interest rates more than expected, which further stim-
ulates growth. Ten-year Treasury yield rate ranges from 2.8
percent to 3 percent for the first time in five years.
Commercial Real Estate
Debt and equity markets quickly respond to the changes in
the Treasury rate. Financing becomes challenging and de-
faults rise at faster pace. Sales volume and property prices
drop, and cap rates increase at a faster pace. The retail sector
suffers due to drop in consumer spending and changes in
demographic and technological trends. The 10-year wave
of debt maturities, generated from loose lending in 2006
and 2007, hits the markets, but investors have a difficult
time paying them off given rising interest rates and falling
prices; delinquencies increase to 6.0 percent to 7.0 percent.
Vacancy rates level off, with vacancy increasing in the office
sector (particularly oil-producing areas).
Commercial real estate prices level off and volume declines
moderately,especially in larger markets. Prices in smaller
markets continue to improve due to high demand and weak
supply. Fundamentals remain positive and improve for some
property types, like the office sector, due to increased de-
mand. Foreign investment continues to increase. Investors
move into infrastructure and niche assets (i.e., parking ga-
rages) in search of yield. Cap rates stabilize and begin an
upward trajectory, but spreads remain healthy. According
to Situs RERC's value outlook, total expected returns are
approximately 5.0 percent to 7.0 percent for institutional
properties on an unleveraged basis.
Fundamentals increase moderately for all property types.
Niche assets start to get competitive. More old and outdated
property types, particularly suburban office and small- to
medium-sized malls, are updated and become more desir-
able. Volume sets a new record. Pricing surpasses the highs
of 2016, increasing moderately for all property types and
markets. Prices in secondary and tertiary markets reach
or surpass pre-recession era highs. Cap rates continue to
compress. Debt maturities are almost all refinanced due to
increased property performance and capital appreciation.
CMBS issuance continues over $150 billion, with minimal
impact on loan quality. Although unlikely, the risk of another
CRE bubble increases.

EXPECTATIONS & MARKET REALITIES IN REAL ESTATE 2017 | Intersection of Global Change: Embracing a New Era
©2017 Situs RERC®, Deloitte Development LLC, National Association of REALTORS®. All Rights Reserved. | 63
SPONSORING FIRM
Leadership
Steven J. PowelSitus CEO713.328.4403 | [email protected]
Nick RudenstineSitus President and COO212.294.1316 | [email protected]
Kenneth Riggs, Jr.CFA, CRE, MAI, FRICSSitus RERC President312.587.1900 | [email protected]
Brian VelkyCFA, CREManaging Director515.309.7600 | [email protected]
Del KendallCRE, MAI, FRICSManaging Director713.661.8880 | [email protected]
Taco BrinkCRE, MAI, MRICSManaging Director | Head of Europe+44 (0) 207 220 1874 | [email protected]
Andrew PhillipsManaging Director212.294.1340 | [email protected]
Situs713.328.4400www.situs.com
®
Situs RERC®
When it comes to commercial real estate valuation advisory services, Situs RERC does it all. From conducting basic appraisals on individual properties, to deliver-ing valuation consulting services on sophisticated portfolios for all layers of the capital stack, to providing expert witness testimony for the most complex litigation cases—investors increasingly use Situs RERC as their one-stop valuation advisory service provider.
Valuation Advisory Services Expertise
Situs RERC’s valuation advisory services clients include retirement funds, banks and lending institutions, REITs, insurance companies, accounting firms, CMBS investors, corporations, foreign investors, and many other private, public, and gov-ernmental agencies.
� Our client portfolios in aggregate exceed $100 billion
� We are committed to valuation best practices for commercial real estate.
� Our experts have MAI, CFA, CRE, FRICS, MRICS, CCIM designations.
� We have appraisal licenses in the majority of states and are AMC-licensed in many states.
� We are an SEC-registered investment advisor.
Valuation Management
Appraisal & Consulting
Data Analytics & Research
� Independent Fiduciary Services � Fairness Opinions � Fair Valuing Debt and Equity � Debt Valuation
� Daily Mark-to-Market Valuation � Portfolio Analysis and Valuation � Web-based Valuation Management
Systems
� Statistical Analysis � Cash Flow Modeling � Econometric Modeling � Quantitative Forecasting
� Risk Analysis � Survey-based Research Publica-
tions, including Situs RERC Real Estate Report
� Appraisals � Market Studies � Appraisal Reviews � Due Diligence
� Litigation Support � Financial Portfolio Valuation � Expert Witness Services

EXPECTATIONS & MARKET REALITIES IN REAL ESTATE 2017 | Intersection of Global Change: Embracing a New Era
64 | ©2017 Situs RERC®, Deloitte Development LLC, National Association of REALTORS®. All Rights Reserved.
SPONSORING FIRM
ContactsRobert O’BrienPartnerGlobal and U.S. Real Estate LeaderDeloitte & Touche [email protected]
Jim BerryPartnerReal EstateDeloitte & Touche [email protected]
Matt KimmelPrincipalReal EstateDeloitte Transactions and Business Analytics [email protected]
Ken MeyerPrincipalReal EstateDeloitte Consulting [email protected]
Jim BrockPartner Real EstateDeloitte Tax LLP [email protected]
To learn more, visit:www.deloitte.com/us/realestate
Deloitte
In today’s competitive environment, it is critical to stay ahead of industry trends and respond dynamically to market opportunities.
As a recognized leader in providing audit, tax, consulting and financial advisory services to the real estate industry, Deloitte’s clients include top REITs, private equity investors, developers, property managers, lenders, brokerage firms, investment managers, pen-sion funds, and leading homebuilding and engineering & construction companies.
Our multi-disciplinary approach allows us to provide regional, national and global ser-vices to our clients. Our real estate practice is recognized for bringing together teams with diverse experience and knowledge to provide customized solutions for all clients. Deloitte Real Estate in the United States comprises over 1,600 professionals supporting real estate clients out of offices in 50 cities; key locations include Atlanta, Boston, Chi-cago, Dallas, Denver, Houston, Los Angeles, Miami, New York, San Francisco, and Wash-ington, D.C. Deloitte’s global Real Estate industry sector includes over 10,000 profession-als located in excess of 50 countries.
Key Real Estate Advisory services include:
Deloitte Real Estate serves:
Sources: NAREIT (May 2015), Fortune 2015, The Stanger Report 2015.
*Investment banking products and services within the United States are offered exclusively through Deloitte Corporate Finance LLC (“DCF”), an SEC registered broker-dealer and member FINRA and SIPC, and an indirect wholly-owned subsidiary of Deloitte Financial Advisory Services LLP and affiliate of Deloitte Transactions and Business Analytics LLP.
As used in this document, “Deloitte” refers to one or more of Deloitte Touche Tohmatsu Limited, a UK private company limited by guarantee, and its network of member firms, each of which is a legally separate and independent entity. Please see www.deloitte.com/about for a detailed description of the legal structure of Deloitte Touche Tohmatsu Limited and its member firms. Please see www.deloitte.com/us/about for a detailed description of the legal structure of Deloitte LLP and its subsidiaries. Certain services may not be available to attest clients under the rules and regulations of public accounting.
� 7 of the top 10 REITs based on equity market capital
� 6 of the top 10 apartment REITs based on equity market capital
� 6 of the top 10 shopping centers/regional mall (retail) REITS by market capitalization
� 18 of the top 25 REITs based on equity market capital
� All four real estate companies listed on 2015 Fortune 500 list based on revenue
� Analysis of Distressed Real Estate, Debt and Equity
� Real Estate Due Diligence � Real Estate Corporate Finance* � Real Estate Valuations and Appraisals
� Regulatory Capital Markets � Lease Advisory � Real Estate Market Studies � Fairness Opinions

EXPECTATIONS & MARKET REALITIES IN REAL ESTATE 2017 | Intersection of Global Change: Embracing a New Era
©2017 Situs RERC®, Deloitte Development LLC, National Association of REALTORS®. All Rights Reserved. | 65
SPONSORING FIRM
NATIONAL ASSOCIATION OF REALTORS® RESEARCH DIVISION
The Mission of the NATIONAL ASSOCIATION OF REALTORS® Research Division is to collect and disseminate timely, accurate and comprehensive real estate data and to conduct economic analysis in order to inform and engage members, con-sumers, and policymakers and the media in a professional and accessible manner.
The Research Division monitors and analyzes economic indicators, including gross domestic product, retail sales, industrial production, producer price index, and employment data that impact commercial markets over time. Additionally, NAR Research examines how changes in the economy affect the commercial real estate business, and evaluates regulatory and legislative policy proposals for their impact on REALTORS®, their clients and America’s property owners.
The Research Division provides several products covering commercial real estate including:
� Commercial Real Estate Outlook: The Research Division’s quarterly assess-ment of market fundamentals, the report covers macroeconomic conditions underpinning commercial core property sectors, while providing a forward- looking outlook of supply and demand.
� Commercial Real Estate Quarterly Market Trends: Based on NAR’s national commercial members’ activity, the report covers trends in commercial mar-kets. Each report provides an analysis of market performance, sales and rental transactions, cap rates, and business challenges.
� Commercial Real Estate Lending Trends: The annual report details liquidity conditions, funding sources and the impact of capital markets on commercial members’ practice.
� Commercial Member Profile: The annual report details the business, trans- action and demographic characteristics of commercial members.
� Business Creation Index: This quarterly report monitors local economic con-ditions from the perspective of NAR’s commercial members, offering insight into whether businesses are opening or closing by industry, population den-sity, and sub-region.
To find out about other products from NAR’s Research Division, visit www.REAL-TOR.org/research-and-statistics.
ContactsLawrence Yun, PhDSr. Vice President, Chief [email protected]
George RatiuDirector, Quantitative & Commercial [email protected]
NATIONAL ASSOCIATION OF REALTORS®
Headquarters:430 North Michigan Ave.Chicago, IL 60611
DC Office:500 New Jersey Ave., NWWashington, DC 20001
800-874-6500www.realtor.org

EXPEC TATIONS & MARKET REALITIES IN REAL ESTATE 2017D E L O I T T E | N AT I O N A L A S S O C I AT I O N O F R E A LT O R S ® | S I T U S R E R C ®