Embed Size (px)
Citation preview

Co. Name Co. Name Co. Name Co. Name
3I Infotech Entertainment Network (India) Microse India Shree Rama Multi-Tech
A2Z Infra Engineering Essar Oil MM Forgings Shree Surgovind Tradelink
Aadhaar Ventures India Essar Shipping Morarjee Textiles Shree Tulsi Online.Com
ABB India Everest Kanto Cylinder Motherson Sumi Systems Soma Textiles & Industries
Abbott India Explicit Finance Mukat Pipes Span Diagnostics
Acrysil Florence Investech Nagreeka Capital & Infrastructure Speciality Restaurants
Aditya Birla Nuvo Galaxy Agrico Exports Nagreeka Exports Spectra Industries
Advance Multitech GK Consultants National Aluminium Company Spice Mobility
Advance Petrochemicals Goa Carbon Neelkanth Technologies SRF
Advani Hotels & Resorts (India) Golden Carpets Nesco SRM Energy
Allied Computers International (Asia) Golkonda Engineering Enterprises Nicco Parks & Resorts Superb Papers
AMD Industries GRM Overseas NRB Industrial Bearings Suryakrupa Finance
Anjani Portland Cement GS Auto International Oasis Securities Suven Life Sciences
Anka India GSS Infotech Olympic Cards Swastik Safe Deposit & Investments
ANS Industries GTN Industries Onesource Ideas Venture Tamilnadu Steel Tubes
Arman Holdings Gujarat Sidhee Cement Orosil Smiths India Tavernier Resources
Ashok Alco-Chem Haldyn Glass Parenteral Drugs (India) TGB Banquets And Hotels
Asia Pack Haryana Leather Chemicals Parker Agrochem Exports Thambbi Modern Spinning Mills
Asian Hotels (North) Hazoor Multi Projects Pranavaditya Spinning Mills Tokyo Finance
Asian Star Company HB Portfolio Precision Wires India Tokyo Plast International
Atharv Enterprises Hexaware Technologies Pritish Nandy Communications TRF
Bhagawati Oxygen Hindustan Organic Chemicals PSL Trijal Industries
Bhagwandas Metals ICVL Chemicals Punit Commercials Triveni Turbine
Bhagwati Autocast IG Petrochemicals Radford Global Ugar Sugar Works
BPL IKAB Securities & Investment Radico Khaitan United Bank of India
BSL Indo Count Industries Rasoya Proteins United Credit
Cadila Healthcare Integra Telecommunication And Software Raunaq International Uttam Value Steels
Cals Refineries Inventure Growth & Securities Real Realty Management Company Vapi Enterprise
Capital First IZMO Reliance Chemotex Industries Victoria Mills
Chambal Breweries & Distilleries Jain Irrigation Systems Rishi Laser Viji Finance
Chase Bright Steel Jaiprakash Associates Rishi Techtex Vinaditya Trading Company
Chemfab Alkalis JK Paper Royal Cushion Vinyl Products Vintage Securities
Citi Port Financial Services JSL Industries RSWM Vipul
Creative Eye KEI Industries Sai Baba Invest & Commercial Enter Virtual Global Education
Credit Analysis And Research Kesar Petroproducts Sakuma Exports Wallfort Financial Services
Deepak Spinners Keshav Cements Sanghi Industries Winsome Breweries
Dhampur Sugar Mills Keynote Corporate Services Sanghvi Movers Yantra Natural Resources
Dharamsi Morarji Chemical Co KZ Leasing & Finance Sanguine Media Zenith Health Care
Dhunseri Petrochem Maestros Electronics & Telecomm. Systems Santosh Fine-Fab Zicom Electronic Security Systems
Eduexel Infotainment Maha Rashtra Apex Corporation Sharda Motor Industries Zuari Global
Ekam Leasing & Finance Co Mandhana Industries Shentracon Chemicals
Exp
ecte
d R
esu
lts
on
10
Feb
ruar
y 20
15
Expected Results on 10 February 2015

Co_Name Year Equity N.Sale O.O.I T. Exp O.I PBIDT Int. Dep. PBT T.Tax PAT A.PAT EPS Div (%)
3I Infotech 201312 571.94 344.11 312.82 56.70 87.99 94.44 65.21 -71.66 4.61 -76.27 -76.37 -1.42 0 C
3I Infotech 201403 572.64 334.70 323.18 12.78 24.30 68.50 75.79 -119.99 -17.86 -102.13 -102.42 -1.87 0 C
3I Infotech 201406 576.34 363.68 337.06 1.35 27.97 60.63 64.71 -97.37 5.09 -102.46 -102.72 -1.88 0 C
3I Infotech 201409 580.68 355.47 321.54 1.58 35.51 52.89 52.79 -166.26 11.33 -177.59 -177.87 -3.15 0 C
A2Z Infra Engineering 201312 74.18 75.29 0.76 100.79 3.02 -21.72 18.95 1.80 -40.89 -3.72 -37.17 -37.17 -5.01 0 C
A2Z Infra Engineering 201403 74.18 78.03 118.43 1.36 -39.03 24.85 1.73 -65.37 8.15 -73.52 -73.52 -9.91 0 C
A2Z Infra Engineering 201406 74.18 56.23 0.96 61.72 2.98 -1.55 27.92 2.62 -29.48 -77.60 48.12 48.12 6.49 0 C
A2Z Infra Engineering 201409 74.18 43.50 0.19 68.25 2.48 -22.08 29.45 2.61 -52.20 -17.30 -34.90 -34.90 -4.70 0 C
Aadhaar Ventures India 201312 157.10 3.34 3.31 0.03 0.00 0.02 0.02 0.02 0 S
Aadhaar Ventures India 201403 157.10 4.55 5.00 0.76 0.31 0.00 0.04 0.27 0.10 0.17 0.17 0 S
Aadhaar Ventures India 201406 157.10 4.68 4.61 0.07 0.01 0.06 0.02 0.04 0.04 0 S
Aadhaar Ventures India 201409 157.10 5.11 0.02 4.95 0.19 0.01 0.01 0.17 0.17 0.17 0 S
ABB India 201312 42.38 2174.91 28.96 2054.41 0.69 150.15 28.79 27.00 94.36 35.77 58.59 58.59 2.76 150 S
ABB India 201403 42.38 1809.98 17.73 1701.99 1.13 126.85 22.07 27.41 77.37 25.69 51.68 51.68 2.44 150 S
ABB India 201406 42.38 1794.40 27.78 1696.37 0.41 126.22 25.36 27.86 73.00 25.31 47.69 47.69 2.25 150 S
ABB India 201409 42.38 1821.38 23.59 1720.84 1.05 125.18 27.54 28.34 69.30 24.32 44.98 44.98 2.12 150 S
Abbott India 201312 21.25 471.81 14.66 422.30 18.79 82.96 0.02 4.18 78.76 25.30 53.46 53.46 25.16 230 S
Abbott India 201403 21.25 478.55 15.20 443.44 9.39 59.70 0.01 3.48 56.21 17.81 38.40 38.40 18.07 230 S
Abbott India 201406 21.25 516.91 10.34 457.16 9.60 79.69 0.01 3.49 76.19 25.26 50.93 50.93 23.97 230 S
Abbott India 201409 21.25 577.42 11.29 500.70 12.21 100.22 0.01 4.43 95.78 32.04 63.74 63.74 30.00 230 S
Acrysil 201312 4.46 25.28 21.26 0.43 4.46 0.79 1.06 2.61 0.56 2.05 2.05 4.60 40 C
Acrysil 201403 4.51 26.04 22.19 0.06 3.91 1.14 1.16 1.60 0.60 1.01 1.01 2.25 40 C
Acrysil 201406 4.61 32.50 26.73 0.26 6.03 0.92 0.76 4.35 1.05 3.30 3.30 7.25 40 C
Acrysil 201409 4.66 31.60 0.05 25.91 0.22 5.95 1.08 0.87 4.01 1.16 2.85 2.85 6.23 40 C
Aditya Birla Nuvo 201312 130.08 6467.55 77.25 5320.82 72.53 1296.51 355.71 407.13 533.67 157.73 375.94 345.27 27.40 70 C
Aditya Birla Nuvo 201403 130.08 7049.92 61.91 5944.69 96.17 1263.31 471.80 429.94 343.03 160.13 182.90 176.13 13.54 70 C
Aditya Birla Nuvo 201406 130.08 6126.56 80.57 5008.97 74.60 1272.76 408.79 404.99 445.65 167.60 278.05 263.70 20.27 70 C
Aditya Birla Nuvo 201409 130.12 6493.76 103.49 5187.76 107.00 1516.49 419.95 381.82 714.72 236.94 477.78 452.05 34.75 70 C
Advance Multitech 201312 4.03 2.22 0.01 1.82 0.41 0.14 0.26 0.01 0.01 0.01 0 S
Advance Multitech 201403 4.03 2.31 -0.01 1.81 0.04 0.53 0.23 0.13 0.18 0.06 0.12 0.12 0 S
Advance Multitech 201406 4.03 3.29 2.90 0.39 0.18 0.13 0.08 0.08 0.08 0.02 0 S
Advance Multitech 201409 4.03 2.33 0.01 1.98 0.36 0.21 0.13 0.02 0.02 0.02 0 S
Advance Petrochemicals 201312 0.90 3.09 0.16 3.06 0.18 0.09 0.04 0.06 0.06 0.06 0.06 0 S
Advance Petrochemicals 201403 0.90 2.60 -0.02 2.33 -0.01 0.24 0.14 0.03 0.07 0.07 0.00 0.00 0 S
Advance Petrochemicals 201406 0.90 2.64 2.50 0.14 0.09 0.03 0.02 0.02 0.02 0.02 0 S
Advance Petrochemicals 201409 0.90 3.37 3.22 0.01 0.16 0.10 0.03 0.03 0.03 0.03 0.03 0 S
Exp
ecte
d R
esu
lts
on
10
Feb
ruar
y 20
15

Co_Name Year Equity N.Sale O.O.I T. Exp O.I PBIDT Int. Dep. PBT T.Tax PAT A.PAT EPS Div (%)
Exp
ecte
d R
esu
lts
on
10
Feb
ruar
y 20
15
Advani Hotels & Resorts (India) 201312 9.24 11.11 0.84 8.54 0.66 4.07 0.73 0.84 2.49 2.49 2.49 0.54 12 S
Advani Hotels & Resorts (India) 201403 9.24 14.64 1.16 8.58 0.54 7.75 0.54 0.85 6.36 0.70 5.66 5.66 1.22 12 S
Advani Hotels & Resorts (India) 201406 9.24 9.26 1.03 8.78 0.21 1.73 0.46 1.00 0.27 0.09 0.18 0.18 0.04 12 S
Advani Hotels & Resorts (India) 201409 9.24 7.98 1.06 9.82 0.05 -0.73 0.45 1.10 -2.28 -0.08 -2.20 -2.20 -0.48 12 S
Allied Computers International (Asia)201312 119.11 0.14 0.15 -0.01 -0.01 -0.01 -0.01 0 S
Allied Computers International (Asia)201403 119.01 0.24 0.09 0.21 0.13 0.00 0.11 0.03 0.09 0.09 0.01 0 S
Allied Computers International (Asia)201406 119.01 0.10 0.11 -0.02 -0.02 -0.02 -0.02 0 S
Allied Computers International (Asia)201409 119.01 0.15 0.02 0.13 0.04 0.04 0.04 0.04 0 S
AMD Industries 201312 19.17 24.89 0.87 25.72 0.15 0.19 2.56 2.00 -4.38 0.18 -4.56 -4.56 -2.38 9 C
AMD Industries 201403 19.17 57.57 1.26 47.56 0.16 11.43 2.64 2.37 6.42 2.48 3.94 3.94 2.06 9 C
AMD Industries 201406 19.17 63.15 1.20 51.63 0.01 12.74 2.43 3.18 7.13 0.45 6.68 6.68 3.49 9 C
AMD Industries 201409 19.17 32.31 1.06 29.07 0.05 4.34 2.22 2.41 0.10 0.12 -0.01 -0.01 -0.01 9 C
Anjani Portland Cement 201312 18.39 80.37 1.12 69.47 0.21 12.24 10.25 4.41 -2.42 0.36 -2.78 -2.69 -1.47 0 S
Anjani Portland Cement 201403 18.39 73.03 2.02 83.74 1.38 -7.31 9.54 3.69 -20.53 -6.43 -14.11 -14.11 -7.67 0 S
Anjani Portland Cement 201406 18.39 49.52 0.38 49.48 0.50 0.92 7.81 2.66 -9.55 0.11 -9.66 -9.66 -5.25 0 S
Anjani Portland Cement 201409 18.39 62.90 0.17 49.93 0.23 13.37 7.77 2.73 2.87 -0.01 2.88 2.88 1.57 0 S
Anka India 201312 2.09 0.05 -0.05 -0.05 -0.05 -0.05 0 S
Anka India 201403 2.09 0.01 0.01 0.00 0.00 0.00 0.00 0 S
Anka India 201406 2.09 0.02 -0.02 -0.02 -0.02 -0.02 0 S
Anka India 201409 2.09 0.03 -0.03 0.00 -0.03 -0.03 -0.03 0 S
ANS Industries 201312 9.26 2.16 1.72 0.44 0.12 0.32 0.32 0.32 0.03 0 S
ANS Industries 201403 9.26 0.89 0.48 0.41 0.12 0.29 0.29 0.29 0.31 0 S
ANS Industries 201406 9.26 0.13 0.31 -0.18 0.08 0.09 -0.35 -0.35 -0.35 0 S
ANS Industries 201409 9.26 0.34 0.57 -0.23 0.08 0.10 -0.41 -0.41 -0.41 0 S
Arman Holdings 201312 0.25 0.11 0.11 0.00 0.00 0.00 0.00 0.07 0 S
Arman Holdings 201403 5.21 0.12 0.16 0.04 0.00 0.00 0.00 0.00 0.00 0.00 0 S
Arman Holdings 201406 5.21 0.11 0.18 0.03 -0.04 -0.04 -0.04 -0.04 -0.08 0 S
Arman Holdings 201409 5.21 0.11 0.14 0.03 0.00 0.00 0.00 0.00 0 S
Ashok Alco-Chem 201312 3.78 34.19 0.10 33.46 0.83 0.12 0.26 0.45 0.02 0.43 0.43 1.14 0 S
Ashok Alco-Chem 201403 4.15 36.75 0.66 36.75 0.66 0.09 0.28 0.24 0.72 -0.48 -0.48 -1.27 0 S
Ashok Alco-Chem 201406 4.15 76.60 0.05 72.51 4.14 0.05 0.22 3.88 1.26 2.62 2.62 6.31 0 S
Ashok Alco-Chem 201409 4.15 92.70 1.30 87.70 6.30 0.15 0.23 5.92 2.04 3.88 3.88 9.36 0 S
Asia Pack 201312 2.64 0.07 0.05 -0.01 0.03 -0.05 -0.05 -0.05 -0.18 0 S
Asia Pack 201403 2.64 0.07 0.02 -0.05 0.04 -0.08 0.01 -0.08 -0.09 -0.30 0 S
Asia Pack 201406 2.64 8.40 8.39 0.03 0.04 0.04 0.34 0.34 0.34 1.29 0 S
Asia Pack 201409 2.64 2.82 0.01 2.87 0.02 -0.03 0.06 -0.09 -0.09 -0.09 -0.35 0 S
Exp
ecte
d R
esu
lts
on
10
Feb
ruar
y 20
15

Co_Name Year Equity N.Sale O.O.I T. Exp O.I PBIDT Int. Dep. PBT T.Tax PAT A.PAT EPS Div (%)
Exp
ecte
d R
esu
lts
on
10
Feb
ruar
y 20
15
Asian Hotels (North) 201312 19.45 63.75 55.34 16.45 24.86 11.87 2.82 10.17 4.20 4.14 5.97 2.13 10 C
Asian Hotels (North) 201403 19.45 64.27 43.48 37.16 57.95 17.65 2.98 37.32 12.60 21.23 24.72 10.91 10 C
Asian Hotels (North) 201406 19.45 47.62 40.17 17.13 24.58 18.36 5.93 0.28 -0.77 1.05 1.05 0.54 10 C
Asian Hotels (North) 201409 19.45 54.02 50.57 9.65 13.10 24.29 7.53 -18.79 -6.55 -13.78 -12.24 -7.08 10 C
Asian Star Company 201312 16.01 992.12 952.78 -0.28 39.05 5.64 2.43 30.98 4.13 26.85 26.85 16.77 15 C
Asian Star Company 201403 16.01 986.55 943.82 0.38 43.11 6.67 2.46 33.96 7.80 26.16 26.16 14.59 15 C
Asian Star Company 201406 16.01 853.87 820.33 0.14 33.69 6.24 2.79 24.66 4.99 19.67 19.67 12.29 15 C
Asian Star Company 201409 16.01 786.16 753.99 0.17 32.34 6.94 5.11 20.29 3.51 16.79 16.79 10.65 15 C
Atharv Enterprises 201312 8.50 1.18 1.36 0.34 0.15 0.00 0.01 0.14 0.05 0.09 0.09 0.11 0 S
Atharv Enterprises 201403 8.50 0.95 1.19 0.43 0.19 0.00 0.11 0.08 0.07 0.01 0.01 0.02 0 S
Atharv Enterprises 201406 8.50 1.09 1.31 0.36 0.14 0.00 0.01 0.12 0.04 0.08 0.08 0.10 0 S
Atharv Enterprises 201409 8.50 1.25 1.11 0.14 0.00 0.01 0.12 0.04 0.09 0.09 0.10 0 S
Bhagawati Oxygen 201312 2.31 3.61 3.40 0.04 0.25 0.00 0.11 0.15 0.04 0.11 0.11 0.47 0 S
Bhagawati Oxygen 201403 2.31 4.10 -0.11 3.91 0.33 0.41 0.00 0.11 0.30 -0.03 0.33 0.33 1.43 0 S
Bhagawati Oxygen 201406 2.31 2.74 2.64 0.07 0.17 0.09 0.09 0.01 0.08 0.08 0.34 0 S
Bhagawati Oxygen 201409 2.31 3.00 2.76 0.04 0.28 0.00 0.09 0.19 0.03 0.16 0.16 0.70 0 S
Bhagwandas Metals 201312 3.64 17.84 0.03 17.87 0.00 0.06 0.01 -0.07 -0.03 -0.04 -0.04 -0.11 0 S
Bhagwandas Metals 201403 3.64 12.03 0.08 11.89 0.22 0.10 0.01 0.11 0.04 0.07 0.07 0.19 0 S
Bhagwandas Metals 201406 3.64 10.59 0.03 10.47 0.15 0.08 0.01 0.06 0.02 0.04 0.04 0.11 0 S
Bhagwandas Metals 201409 3.64 10.63 0.06 10.56 0.13 0.14 -0.01 -0.01 -0.01 -0.03 0 S
Bhagwati Autocast 201312 2.88 21.67 19.95 0.01 1.73 0.31 0.53 0.89 0.22 0.67 0.67 2.32 9 S
Bhagwati Autocast 201403 2.88 18.28 16.44 0.02 1.86 0.16 0.35 1.34 0.61 0.83 0.74 2.89 9 S
Bhagwati Autocast 201406 2.88 17.95 18.04 0.02 -0.06 0.21 0.84 -1.12 -0.15 -0.97 -0.97 -3.37 9 S
Bhagwati Autocast 201409 2.88 19.92 19.77 0.01 0.15 0.20 0.87 -0.92 -0.15 -0.77 -0.77 -2.67 9 S
BPL 201312 48.89 5.05 0.38 5.59 -0.15 0.01 0.25 -0.42 130.56 -130.97 -130.97 -26.79 0 C
BPL 201403 48.89 4.74 0.67 5.68 0.00 -0.26 0.01 0.19 -0.46 0.00 -0.46 -0.46 -0.09 0 C
BPL 201406 48.89 5.56 0.44 5.29 0.71 0.01 0.22 0.48 0.48 0.48 0.01 0 C
BPL 201409 48.89 7.64 5.05 7.45 5.25 0.01 1.13 4.11 4.11 4.11 0.84 0 C
BSL 201312 10.29 99.99 91.23 0.61 9.37 4.14 3.62 1.61 0.38 1.23 1.23 1.20 10 S
BSL 201403 10.29 83.47 75.10 0.23 8.60 4.36 3.75 0.49 0.17 0.32 0.32 0.31 10 S
BSL 201406 10.29 92.00 82.68 1.06 10.38 3.66 6.37 0.35 0.14 0.21 0.21 0.20 10 S
BSL 201409 10.29 100.79 89.24 0.27 11.82 3.58 5.97 2.27 -0.22 2.49 2.49 2.42 10 S
Cadila Healthcare 201312 102.37 1838.04 33.65 1576.43 12.78 308.04 18.98 49.57 236.02 40.83 195.19 185.97 9.08 180 C
Cadila Healthcare 201403 102.37 1916.33 52.17 1609.95 13.13 371.68 24.04 52.78 281.18 34.76 246.42 239.19 11.68 180 C
Cadila Healthcare 201406 102.37 2020.38 29.74 1674.01 10.41 386.52 18.08 67.70 299.56 52.44 247.12 240.21 11.73 180 C
Cadila Healthcare 201409 102.37 2063.53 44.47 1687.01 14.61 435.60 17.26 73.29 345.28 57.13 288.15 278.09 13.58 180 C

Co_Name Year Equity N.Sale O.O.I T. Exp O.I PBIDT Int. Dep. PBT T.Tax PAT A.PAT EPS Div (%)
Exp
ecte
d R
esu
lts
on
10
Feb
ruar
y 20
15
Cals Refineries 201312 829.40 0.05 -0.05 0.21 0.00 -0.21 -0.21 -0.21 0 S
Cals Refineries 201403 829.40 0.26 0.38 0.12 2.05 0.01 -1.94 -1.94 -1.94 0 S
Cals Refineries 201406 829.40 0.25 -0.25 2.05 0.01 -26.97 -26.97 -26.97 -0.01 0 S
Cals Refineries 201409 829.40 0.52 -0.52 2.05 0.01 -2.58 -2.58 -2.58 -0.04 0 S
Capital First 201312 71.02 276.27 91.10 0.13 185.29 166.76 1.59 16.94 6.82 10.12 10.12 1.42 20 C
Capital First 201403 82.63 285.88 1.84 90.91 1.20 198.00 173.25 1.53 23.23 -6.60 29.83 29.83 4.17 20 C
Capital First 201406 82.82 315.96 11.04 109.30 6.67 224.37 189.52 2.39 32.47 11.61 20.85 20.85 2.52 20 C
Capital First 201409 83.01 345.39 2.19 110.78 0.06 236.86 192.80 2.36 41.70 14.65 27.05 27.05 3.26 20 C
Chambal Breweries & Distilleries201312 7.49 1.45 1.44 0.02 0.00 0.02 0.02 0.02 0.02 0 S
Chambal Breweries & Distilleries201403 7.49 1.33 1.66 0.04 -0.29 0.00 -0.29 -0.29 -0.29 0 S
Chambal Breweries & Distilleries201406 7.49 0.18 0.20 0.02 0.01 0.00 0.00 0.00 0.00 0.01 0 S
Chambal Breweries & Distilleries201409 7.49 0.04 0.04 0.00 0.00 0.00 0.00 0.00 0 S
Chase Bright Steel 201312 1.68 7.26 0.01 7.15 0.11 0.28 0.06 -0.23 -0.23 -0.23 -1.37 0 S
Chase Bright Steel 201403 1.68 8.24 0.04 7.95 0.19 0.52 0.29 0.06 0.17 -0.17 0.33 0.33 2.00 0 S
Chase Bright Steel 201406 1.68 9.26 8.89 0.00 0.38 0.22 0.05 0.11 0.11 0.11 0.63 0 S
Chase Bright Steel 201409 1.68 9.09 8.65 0.05 0.49 0.33 0.05 0.11 0.11 0.11 0.66 0 S
Chemfab Alkalis 201312 4.59 30.50 0.10 23.00 1.97 9.57 0.32 1.55 7.70 2.32 5.38 5.38 5.86 25 S
Chemfab Alkalis 201403 4.59 24.42 0.09 20.56 1.16 5.11 0.33 1.73 3.05 1.57 1.48 1.48 1.61 25 S
Chemfab Alkalis 201406 4.59 30.88 0.05 24.16 0.54 7.31 0.14 2.40 4.77 1.52 3.25 3.25 3.55 25 S
Chemfab Alkalis 201409 4.59 25.55 0.13 21.03 2.01 6.66 0.19 3.24 3.23 1.12 2.11 2.11 2.29 25 S
Citi Port Financial Services 201312 3.10 0.04 0.04 0.01 0.01 0.00 0.00 0.00 0.01 0 S
Citi Port Financial Services 201403 3.10 0.04 0.04 0.00 0.00 0.00 0.00 0.00 0.01 0 S
Citi Port Financial Services 201406 3.10 0.04 0.04 0.00 0.00 0.00 0.00 0.00 0 S
Citi Port Financial Services 201409 3.10 0.04 0.04 0 S
Creative Eye 201312 10.03 3.93 3.76 0.35 0.52 0.02 0.15 0.35 0.35 0.35 0.17 0 S
Creative Eye 201403 10.03 4.68 5.14 0.40 -0.06 0.05 0.15 -0.26 0.27 -0.53 -0.53 -0.27 0 S
Creative Eye 201406 10.03 0.89 1.98 0.36 -0.73 0.09 0.07 -0.89 -0.89 -0.89 -0.44 0 S
Creative Eye 201409 10.03 3.15 4.98 0.55 -1.28 0.05 0.07 -1.40 -1.40 -1.40 -0.70 0 S
Credit Analysis And Research 201312 29.00 53.84 21.37 6.71 39.18 0.72 38.46 10.44 28.02 28.02 9.66 280 C
Credit Analysis And Research 201403 29.00 75.67 24.41 7.89 59.15 0.85 58.29 16.99 41.30 41.30 14.24 280 C
Credit Analysis And Research 201406 29.00 42.68 22.59 14.84 34.92 1.41 33.52 6.93 26.58 26.58 9.17 280 C
Credit Analysis And Research 201409 29.00 74.26 22.73 22.69 74.22 0.19 1.27 72.76 20.35 52.41 52.41 18.07 280 C
Deepak Spinners 201312 7.20 101.34 0.79 89.62 0.73 13.24 3.18 2.90 7.16 2.90 4.26 4.26 5.93 0 S
Deepak Spinners 201403 7.20 96.85 0.33 91.54 1.33 6.97 3.63 2.92 0.42 1.91 -1.49 -1.49 -2.08 0 S
Deepak Spinners 201406 7.20 111.16 0.41 102.00 0.68 10.25 3.81 3.47 2.97 1.25 1.72 1.72 2.39 0 S
Deepak Spinners 201409 7.20 111.54 0.43 103.48 0.37 8.86 4.27 3.61 0.98 0.39 0.59 0.59 0.82 0 S

Co_Name Year Equity N.Sale O.O.I T. Exp O.I PBIDT Int. Dep. PBT T.Tax PAT A.PAT EPS Div (%)
Exp
ecte
d R
esu
lts
on
10
Feb
ruar
y 20
15
Dhampur Sugar Mills 201312 57.22 434.46 0.00 464.64 0.50 -29.68 27.02 18.02 -74.72 -74.72 -74.72 -13.13 0 C
Dhampur Sugar Mills 201403 57.22 431.78 2.58 336.24 3.88 102.00 28.03 23.49 50.47 50.47 50.47 8.74 0 C
Dhampur Sugar Mills 201406 57.22 385.03 3.85 347.62 2.54 43.81 40.81 12.42 -9.42 -9.42 -9.42 -1.73 0 C
Dhampur Sugar Mills 201409 57.22 362.32 3.41 378.31 0.29 -12.29 36.88 10.25 -59.41 -59.41 -59.41 -10.46 0 C
Dharamsi Morarji Chemical Company201312 21.26 23.47 0.06 19.95 0.01 3.58 0.64 0.74 2.20 2.20 2.20 0.96 0 S
Dharamsi Morarji Chemical Company201403 21.26 25.20 0.09 22.79 0.06 2.57 0.45 1.23 0.90 0.90 0.90 0.35 0 S
Dharamsi Morarji Chemical Company201406 21.26 32.02 0.02 26.84 0.01 5.21 0.55 0.59 4.07 4.07 4.07 1.84 0 S
Dharamsi Morarji Chemical Company201409 21.26 28.26 24.72 0.11 3.64 0.43 0.60 2.62 2.62 2.62 1.15 0 S
Dhunseri Petrochem 201312 35.03 1054.28 38.15 1042.55 12.72 62.60 19.16 12.44 31.00 8.78 22.22 22.22 6.34 45 C
Dhunseri Petrochem 201403 35.03 958.50 20.39 980.59 30.52 28.82 14.86 12.08 1.88 -0.35 2.23 2.23 0.64 45 C
Dhunseri Petrochem 201406 35.03 765.49 11.39 721.16 12.16 67.88 16.13 11.20 40.55 15.39 25.16 25.16 7.18 45 C
Dhunseri Petrochem 201409 35.03 714.10 20.50 713.82 8.59 29.37 13.32 9.15 6.90 6.26 0.64 0.64 0.18 45 C
Eduexel Infotainment 201312 8.46 0.03 0.03 0.00 0.00 0.00 0.00 0.00 0.00 0 S
Eduexel Infotainment 201403 8.46 0.03 0.03 0.00 0.00 0.00 0.00 0.00 0.00 0 S
Eduexel Infotainment 201406 8.46 0.03 0.03 0.00 0.00 0.00 0.00 0.00 0 S
Eduexel Infotainment 201409 8.42 0.03 0.04 -0.01 0.00 -0.01 -0.01 -0.01 -0.01 0 S
Ekam Leasing & Finance Company201312 3.00 0.14 0.03 0.07 0.18 0.09 0.10 0.10 0.10 0.33 0 S
Ekam Leasing & Finance Company201403 3.00 0.23 0.02 0.07 0.28 0.08 0.01 0.20 0.07 0.12 0.12 0.41 0 S
Ekam Leasing & Finance Company201406 3.00 0.23 0.12 0.12 0.00 0.11 0.11 0.11 0.38 0 S
Ekam Leasing & Finance Company201409 3.00 0.13 0.02 0.09 0.20 0.15 0.00 0.04 0.04 0.04 0.14 0 S
Entertainment Network (India) 201312 46.77 98.21 0.31 60.32 5.67 43.87 0.01 8.09 35.78 9.90 25.88 25.88 5.43 10 C
Entertainment Network (India) 201403 47.67 111.98 2.53 82.93 5.98 37.55 0.03 7.95 29.57 8.28 21.29 21.29 10 C
Entertainment Network (India) 201406 47.67 91.79 1.46 58.38 7.22 42.09 0.02 8.20 33.88 9.53 24.35 24.35 5.11 10 C
Entertainment Network (India) 201409 47.67 104.03 0.35 72.74 7.89 39.53 0.01 8.16 31.36 8.06 23.30 23.30 4.89 10 C
Essar Oil 201312 1450.00 25089.00 42.00 24299.00 370.00 1202.00 812.00 338.00 52.00 0.00 52.00 52.00 0.38 0 C
Essar Oil 201403 1450.00 25211.00 63.00 23741.00 519.00 2052.00 694.00 347.00 1011.00 3.00 1008.00 1008.00 6.95 0 C
Essar Oil 201406 1450.00 24811.00 44.00 23514.00 232.00 1573.00 647.00 242.00 684.00 684.00 684.00 4.72 0 C
Essar Oil 201409 1450.00 22371.00 77.00 21709.00 286.00 1025.00 556.00 243.00 226.00 0.00 226.00 226.00 1.56 0 C
Essar Shipping 201312 205.23 418.75 1.21 307.23 32.81 145.54 117.49 107.97 -79.92 6.32 -86.24 -86.24 -4.20 0 C
Essar Shipping 201403 205.23 479.00 0.83 428.80 39.75 90.78 94.89 155.62 -159.73 6.01 -165.74 -165.69 -8.07 0 C
Essar Shipping 201406 205.23 495.47 1.00 487.24 62.79 72.02 98.81 107.36 -134.15 5.98 -140.13 -140.16 -6.83 0 C
Essar Shipping 201409 205.23 501.60 1.25 451.07 114.26 166.04 89.22 111.28 -34.46 9.46 -43.92 -43.93 -2.14 0 C
Everest Kanto Cylinder 201312 21.43 105.62 0.95 103.49 3.73 6.81 14.13 17.91 -25.23 -0.01 -25.22 -25.22 -2.35 0 C
Everest Kanto Cylinder 201403 21.43 129.23 1.36 132.91 1.94 -0.38 13.76 17.42 -31.56 -0.04 -31.52 -31.52 -2.94 0 C
Everest Kanto Cylinder 201406 21.43 99.50 1.16 101.11 1.90 1.45 13.66 18.25 -30.21 -0.59 -29.62 -29.62 -2.76 0 C
Everest Kanto Cylinder 201409 21.43 127.66 1.22 122.80 1.21 7.29 15.33 17.77 -25.27 -0.05 -25.22 -25.22 -2.36 0 C

Co_Name Year Equity N.Sale O.O.I T. Exp O.I PBIDT Int. Dep. PBT T.Tax PAT A.PAT EPS Div (%)
Exp
ecte
d R
esu
lts
on
10
Feb
ruar
y 20
15
Explicit Finance 201312 9.27 2.91 0.10 2.80 0.21 0.21 0.21 0.21 0.23 0 S
Explicit Finance 201403 9.27 2.09 1.83 0.26 0.00 0.26 0.00 0.26 0.26 0.28 0 S
Explicit Finance 201406 9.27 1.70 0.16 1.61 0.25 0.00 0.25 0.25 0.25 0.27 0 S
Explicit Finance 201409 9.27 2.08 0.16 2.09 0.16 0.00 0.15 0.15 0.15 0.16 0 S
Florence Investech 201312 3.33 0.19 0.03 0.16 0.16 0.16 0.16 0.49 15 S
Florence Investech 201403 3.33 0.15 0.19 -0.05 -0.05 0.06 -0.11 -0.11 -0.31 15 S
Florence Investech 201406 3.33 0.18 0.02 0.16 0.00 0.15 0.15 0.15 0.46 15 S
Florence Investech 201409 3.33 6.61 0.12 6.49 0.00 6.49 6.49 6.49 19.50 15 S
Galaxy Agrico Exports 201312 2.73 0.41 0.60 0.94 0.07 0.10 0.10 -0.13 -0.13 -0.13 -0.49 0 C
Galaxy Agrico Exports 201403 2.73 1.04 0.94 1.85 0.13 0.10 0.11 -0.09 -0.09 -0.09 -0.32 0 C
Galaxy Agrico Exports 201406 2.73 1.18 0.05 1.17 0.06 0.09 0.10 -0.13 -0.13 -0.13 -0.44 0 C
Galaxy Agrico Exports 201409 2.73 0.86 0.74 1.42 0.17 0.05 0.10 0.02 0.02 0.02 0.08 0 C
GK Consultants 201312 5.31 7.77 0.07 7.83 0.00 0.01 0.00 0.00 0.01 0.00 0.01 0.01 0.02 0 S
GK Consultants 201403 5.31 8.68 0.17 8.66 0.18 0.00 0.18 0.06 0.12 0.12 0.23 0 S
GK Consultants 201406 5.31 9.55 0.09 9.55 0.09 0.09 0.09 0.09 0.17 0 S
GK Consultants 201409 5.31 9.05 0.10 9.04 0.10 0.00 0.10 0.10 0.10 0.18 0 S
Goa Carbon 201312 9.15 72.28 0.05 72.73 3.32 2.92 1.80 0.56 0.56 0.00 0.56 0.56 0.61 10 C
Goa Carbon 201403 9.15 84.89 0.02 83.59 8.99 10.30 1.58 0.55 8.17 0.13 8.04 8.04 8.78 10 C
Goa Carbon 201406 9.15 69.49 0.05 65.52 2.67 6.70 0.97 0.42 5.31 1.74 3.57 3.57 3.90 10 C
Goa Carbon 201409 9.15 39.81 0.38 41.82 1.61 -0.02 0.83 0.42 -1.27 -0.42 -0.85 -0.85 -0.94 10 C
Golden Carpets 201312 6.49 0.05 0.11 0.16 0.00 0.19 -0.19 -0.19 -0.19 -3.37 0 S
Golden Carpets 201403 6.49 0.26 0.04 0.24 0.06 0.23 -0.17 -0.17 -0.17 -2.55 0 S
Golden Carpets 201406 6.49 0.14 0.08 0.20 0.02 0.20 -0.18 -0.18 -0.18 -3.78 0 S
Golden Carpets 201409 6.49 0.21 0.08 0.21 0.07 0.20 -0.13 -0.13 -0.13 -0.20 0 S
Golkonda Engineering Enterprises201312 4.14 25.84 0.05 24.60 1.28 1.06 0.22 0.22 0.22 0.54 0 S
Golkonda Engineering Enterprises201403 4.14 21.81 -0.17 20.89 0.76 -0.17 1.26 -0.33 -0.10 -0.22 -0.22 -0.54 0 S
Golkonda Engineering Enterprises201406 4.14 6.95 0.07 6.61 0.03 0.44 0.10 0.21 0.13 0.07 0.06 0.06 0.14 0 S
Golkonda Engineering Enterprises201409 4.14 11.52 11.12 0.00 0.41 0.07 0.21 0.13 0.04 0.09 0.09 0.22 0 S
GRM Overseas 201312 3.69 82.36 79.80 2.56 0.90 0.34 1.32 0.40 0.92 0.92 2.50 20 S
GRM Overseas 201403 3.69 122.13 114.30 7.83 5.31 0.29 2.23 0.87 1.36 1.36 3.69 20 S
GRM Overseas 201406 3.69 100.16 96.44 3.71 1.52 0.38 1.82 0.60 1.21 1.21 3.29 20 S
GRM Overseas 201409 3.69 133.77 129.17 4.60 2.01 0.41 2.18 0.67 1.51 1.51 4.10 20 S
GS Auto International 201312 6.00 30.62 0.04 29.16 0.19 1.69 1.24 0.79 -0.34 0.24 -0.58 -0.58 -0.49 0 S
GS Auto International 201403 7.26 38.55 0.02 36.58 0.27 2.26 2.20 1.27 -1.21 -0.18 -1.03 -1.03 -0.64 0 S
GS Auto International 201406 7.26 36.42 0.02 35.15 0.12 1.41 1.55 1.15 -1.29 -0.29 -1.00 -1.00 -0.69 0 S
GS Auto International 201409 7.26 36.30 0.08 36.12 0.05 0.31 1.49 0.98 -2.16 -0.11 -2.05 -2.05 -1.41 0 S

Co_Name Year Equity N.Sale O.O.I T. Exp O.I PBIDT Int. Dep. PBT T.Tax PAT A.PAT EPS Div (%)
Exp
ecte
d R
esu
lts
on
10
Feb
ruar
y 20
15
GSS Infotech 201312 14.14 67.21 64.97 0.06 2.30 1.10 0.52 0.69 0.51 0.18 0.18 0.13 0 C
GSS Infotech 201403 14.14 60.50 70.55 1.74 -8.31 1.01 0.37 -9.69 -5.03 -4.66 -4.66 -3.30 0 C
GSS Infotech 201406 14.14 77.10 73.18 0.01 3.93 1.52 0.35 2.06 0.65 1.41 1.41 1.00 0 C
GSS Infotech 201409 16.94 57.66 55.46 1.19 3.39 0.71 0.36 2.33 0.14 2.19 2.19 1.29 0 C
GTN Industries 201312 17.55 149.99 8.30 149.38 0.43 9.34 5.32 3.77 0.25 0.25 0.25 0.09 0 S
GTN Industries 201403 17.55 131.51 9.13 130.39 0.74 10.99 6.90 3.66 0.43 -3.38 3.81 3.81 2.12 0 S
GTN Industries 201406 17.55 111.38 7.19 112.40 0.18 6.35 6.09 2.34 -2.08 -2.08 -2.08 -1.32 0 S
GTN Industries 201409 17.55 109.27 6.95 114.02 0.66 2.86 6.15 2.28 -4.87 -4.87 -4.87 -2.91 0 S
Gujarat Sidhee Cement 201312 36.21 94.36 0.38 112.81 1.39 -16.69 0.82 2.24 -19.74 -5.84 -13.90 -13.90 -3.84 0 C
Gujarat Sidhee Cement 201403 36.21 131.46 1.09 111.60 3.95 24.90 0.81 2.07 22.02 6.99 15.03 15.03 4.16 0 C
Gujarat Sidhee Cement 201406 41.21 130.00 0.25 115.02 1.14 16.37 0.42 3.20 12.75 4.39 8.35 8.35 2.03 0 C
Gujarat Sidhee Cement 201409 42.41 130.07 0.51 144.57 1.92 -12.07 0.26 2.21 -14.54 -4.70 -9.84 -9.84 -2.37 0 C
Haldyn Glass 201312 5.38 42.59 0.55 34.71 0.65 9.09 0.18 1.89 7.01 1.95 5.06 5.06 0.94 75 S
Haldyn Glass 201403 5.38 36.13 0.13 29.84 1.15 7.57 0.17 1.51 5.89 2.16 3.73 3.73 0.69 75 S
Haldyn Glass 201406 5.38 35.25 0.46 28.65 0.65 7.72 0.13 1.29 6.30 2.07 4.24 4.24 0.79 75 S
Haldyn Glass 201409 5.38 42.04 0.80 36.20 0.53 7.16 0.09 1.42 5.65 1.55 4.10 4.10 0.78 75 S
Haryana Leather Chemicals 201312 4.91 12.06 11.07 0.20 1.20 0.04 0.21 0.95 0.30 0.65 0.65 1.32 7 S
Haryana Leather Chemicals 201403 4.91 10.52 9.82 0.18 0.88 0.07 0.22 0.60 0.25 0.35 0.35 4.89 7 S
Haryana Leather Chemicals 201406 4.91 11.25 10.47 0.03 0.80 0.05 0.22 0.54 0.18 0.36 0.36 0.73 7 S
Haryana Leather Chemicals 201409 4.91 10.48 9.80 0.06 0.74 0.04 0.21 0.49 0.15 0.34 0.34 0.69 7 S
Hazoor Multi Projects 201312 10.15 0.02 -0.02 0.00 0.04 -0.06 -0.06 -0.06 -0.02 0 C
Hazoor Multi Projects 201403 10.15 0.28 0.06 0.01 0.24 0.00 0.04 0.19 -0.04 0.24 0.24 0.09 0 C
Hazoor Multi Projects 201406 10.15 0.11 0.04 0.08 0.01 0.07 0.07 0.07 0.03 0 C
Hazoor Multi Projects 201409 10.15 0.06 0.04 0.02 0.01 0.01 0.00 0.01 0.01 0 C
HB Portfolio 201312 12.27 0.88 0.30 0.06 0.64 0.01 0.01 0.63 0.10 0.52 0.52 0.44 15 C
HB Portfolio 201403 12.27 -0.83 0.14 0.30 -0.99 0.21 0.01 -1.21 -0.06 -1.15 -1.15 -0.96 15 C
HB Portfolio 201406 12.27 0.73 0.29 0.43 0.00 0.01 0.42 0.09 0.33 0.33 0.27 15 C
HB Portfolio 201409 12.27 0.73 0.34 0.00 0.39 0.00 0.01 0.38 0.08 0.30 0.30 0.26 15 C
Hexaware Technologies 201312 59.98 620.01 491.39 10.75 139.37 0.16 10.11 129.10 25.87 103.23 103.23 3.44 555 C
Hexaware Technologies 201403 60.05 588.88 489.10 8.53 108.31 0.03 10.79 97.50 27.20 70.30 70.30 2.34 555 C
Hexaware Technologies 201406 60.07 610.38 508.71 8.37 110.04 0.01 10.76 99.27 22.70 76.57 76.57 2.55 555 C
Hexaware Technologies 201409 60.16 670.62 553.28 3.10 120.44 0.65 11.08 108.71 22.69 86.02 86.02 2.86 555 C
Hindustan Organic Chemicals 201312 67.27 36.29 0.25 70.78 1.58 -32.66 8.77 4.91 -47.54 -47.54 -47.54 -7.08 0 S
Hindustan Organic Chemicals 201403 67.27 34.44 0.04 63.61 3.78 -25.35 18.93 3.34 -47.65 0.18 -47.83 -47.83 -7.12 0 S
Hindustan Organic Chemicals 201406 67.27 24.29 0.17 54.24 1.65 -28.13 9.89 2.68 -41.02 -41.02 -41.02 -6.11 0 S
Hindustan Organic Chemicals 201409 67.27 8.64 38.62 3.05 -26.93 10.09 2.63 -40.06 -40.06 -40.06 -5.96 0 S

Co_Name Year Equity N.Sale O.O.I T. Exp O.I PBIDT Int. Dep. PBT T.Tax PAT A.PAT EPS Div (%)
Exp
ecte
d R
esu
lts
on
10
Feb
ruar
y 20
15
ICVL Chemicals 201312 3.25 0.02 0.02 0.00 0.00 0.00 0.00 0 S
ICVL Chemicals 201403 3.25 0.04 0.04 0.01 0.01 0.00 0.01 0.01 0 S
ICVL Chemicals 201406 3.25 0.02 -0.02 0.00 -0.02 -0.02 -0.02 0 S
ICVL Chemicals 201409 4.12 4.08 0.01 4.04 0.05 0.00 0.05 0.05 0.05 0.01 0 S
IG Petrochemicals 201312 30.80 341.10 328.18 2.05 14.97 8.51 5.43 1.18 1.18 1.18 0.38 0 S
IG Petrochemicals 201403 30.80 363.70 336.51 4.86 32.05 12.63 5.98 14.96 0.78 14.18 14.18 4.60 0 S
IG Petrochemicals 201406 30.80 343.39 318.46 2.85 27.79 9.84 4.24 13.70 2.87 10.83 10.83 3.52 0 S
IG Petrochemicals 201409 30.80 303.76 286.41 1.49 18.85 9.59 4.17 5.09 1.07 4.03 4.03 1.31 0 S
IKAB Securities & Investment 201312 3.42 2.08 3.09 0.03 -0.98 0.02 -0.99 -0.99 -0.99 -2.90 0 S
IKAB Securities & Investment 201403 3.42 2.98 0.52 2.35 -0.09 1.06 0.02 1.04 0.08 0.96 0.96 2.80 0 S
IKAB Securities & Investment 201406 3.42 3.17 0.04 3.37 0.01 -0.16 0.18 0.03 -0.36 -0.36 -0.36 -1.06 0 S
IKAB Securities & Investment 201409 3.42 7.64 0.02 6.93 0.03 0.77 0.18 0.03 0.56 0.56 0.56 1.64 0 S
Indo Count Industries 201312 35.48 366.66 7.33 325.56 48.43 11.51 4.70 32.22 -4.36 36.58 36.58 10.31 0 C
Indo Count Industries 201403 35.48 342.61 9.53 304.05 48.09 15.98 4.84 27.27 -1.88 29.15 29.15 8.20 0 C
Indo Count Industries 201406 36.58 303.37 13.01 264.41 51.97 13.90 3.57 34.50 9.59 24.91 24.91 6.80 0 C
Indo Count Industries 201409 36.58 454.56 24.27 398.96 79.87 17.91 3.66 58.30 15.80 42.50 42.50 11.62 0 C
Integra Telecommunication And Software201312 10.56 0.01 0.02 0.02 0.01 0.18 -0.18 -0.02 -0.16 -0.16 -0.15 0 S
Integra Telecommunication And Software201403 10.56 0.32 -0.26 0.29 0.01 -0.22 0.19 -0.41 -0.41 -0.41 -0.39 0 S
Integra Telecommunication And Software201406 10.56 2.56 0.00 2.51 0.00 0.05 0.16 -0.11 -0.11 -0.11 -0.11 0 S
Integra Telecommunication And Software201409 10.56 1.71 0.03 1.73 0.02 0.16 -0.14 -0.14 -0.14 -0.14 0 S
Inventure Growth & Securities 201312 84.00 2.95 3.81 4.11 -0.53 2.12 0.63 0.23 1.26 0.15 1.11 1.11 0.13 0 C
Inventure Growth & Securities 201403 84.00 2.92 0.26 4.62 -0.32 -1.76 0.63 0.24 -2.63 -1.51 -1.12 -1.12 -0.13 0 C
Inventure Growth & Securities 201406 84.00 5.43 2.29 3.83 5.62 9.51 0.71 0.20 11.03 1.00 10.03 10.03 1.19 0 C
Inventure Growth & Securities 201409 84.00 5.18 0.90 3.96 0.70 2.82 1.46 0.31 1.05 0.30 0.75 0.75 0.09 0 C
IZMO 201312 12.10 8.13 7.27 0.21 1.08 0.41 0.16 0.51 0.51 0.51 0.42 0 C
IZMO 201403 12.10 6.79 9.11 34.94 32.61 0.62 5.13 27.89 0.08 27.81 27.81 22.99 0 C
IZMO 201406 12.10 7.21 7.57 0.56 0.20 0.06 1.40 -1.26 -1.26 -1.26 -1.04 0 C
IZMO 201409 12.10 10.32 8.98 0.49 1.83 0.07 1.40 0.35 0.35 0.35 0.29 0 C
Jain Irrigation Systems 201312 90.98 1352.37 22.18 1203.53 17.56 188.58 117.39 51.28 19.53 -6.47 26.00 25.88 0.57 25 C
Jain Irrigation Systems 201403 92.48 1805.76 27.52 1577.08 -1.51 254.69 118.24 55.71 81.96 7.77 74.19 75.34 1.66 25 C
Jain Irrigation Systems 201406 92.48 1530.44 22.93 1352.75 2.29 202.91 118.02 61.39 23.50 3.16 20.34 20.13 0.44 25 C
Jain Irrigation Systems 201409 92.48 1253.16 17.00 1112.94 9.71 166.93 115.17 61.22 -34.87 -11.34 -23.53 -23.59 -0.51 25 C
Jaiprakash Associates 201312 443.82 3137.88 25.65 2418.86 18.28 762.95 751.51 196.84 -185.54 -96.83 -88.71 -88.71 -0.40 4 C
Jaiprakash Associates 201403 443.82 3402.61 63.27 2530.77 27.19 962.30 756.44 186.20 27.42 -73.00 100.42 100.42 0.46 4 C
Jaiprakash Associates 201406 443.82 2993.66 36.74 2238.68 11.16 802.88 789.59 214.59 -201.73 -121.12 -80.61 -80.61 -0.36 4 C
Jaiprakash Associates 201409 486.49 2664.12 27.09 1952.45 45.70 784.46 793.29 190.65 -198.38 -91.90 -106.48 -106.48 -0.45 4 C

Co_Name Year Equity N.Sale O.O.I T. Exp O.I PBIDT Int. Dep. PBT T.Tax PAT A.PAT EPS Div (%)
Exp
ecte
d R
esu
lts
on
10
Feb
ruar
y 20
15
JK Paper 201312 136.62 466.36 0.59 428.28 3.40 42.07 43.29 38.95 -58.26 -18.88 -39.38 -39.38 -2.88 0 C
JK Paper 201403 136.62 500.93 12.20 453.26 1.93 61.80 47.35 36.94 -22.49 -8.14 -14.35 -14.35 -1.05 0 C
JK Paper 201406 136.62 487.34 2.31 449.57 4.50 44.58 49.91 26.77 -32.10 -9.57 -22.53 -22.53 -1.65 0 C
JK Paper 201409 136.62 531.42 2.28 485.90 4.86 52.66 50.66 30.63 -28.63 -8.95 -19.68 -19.68 -1.44 0 C
JSL Industries 201312 1.12 15.12 0.43 13.98 1.57 0.31 0.35 0.91 0.40 0.51 0.51 4.57 0 S
JSL Industries 201403 1.12 12.82 -0.04 12.02 0.32 1.08 0.24 0.33 0.51 0.26 0.25 0.25 2.24 0 S
JSL Industries 201406 1.12 11.89 0.08 11.12 0.02 0.87 0.33 0.34 0.20 0.06 0.14 0.14 1.25 0 S
JSL Industries 201409 1.12 13.90 0.17 12.91 0.53 1.69 0.29 0.34 1.06 0.21 0.85 0.85 7.61 0 S
KEI Industries 201312 14.75 405.96 5.05 369.91 0.13 41.23 27.95 5.24 8.04 3.18 4.86 4.86 0.66 10 S
KEI Industries 201403 14.75 464.65 2.64 423.11 0.38 44.57 31.22 5.42 7.92 3.65 4.27 4.27 0.58 10 S
KEI Industries 201406 15.45 390.54 2.32 354.90 0.65 38.61 26.56 6.30 5.75 2.21 3.55 3.55 0.47 10 S
KEI Industries 201409 15.45 502.34 2.51 456.60 0.80 49.05 29.31 6.13 13.61 4.35 9.26 9.26 1.20 10 S
Kesar Petroproducts 201312 7.27 36.20 34.78 0.09 1.51 0.10 1.42 1.42 1.42 1.95 0 S
Kesar Petroproducts 201403 7.27 40.89 41.45 0.03 -0.54 0.10 -0.64 -0.64 -0.64 0.88 0 S
Kesar Petroproducts 201406 7.27 29.74 27.84 0.05 1.95 0.10 1.85 1.85 1.85 2.55 0 S
Kesar Petroproducts 201409 7.27 25.13 23.14 0.02 2.00 0.10 1.90 1.90 1.90 2.61 0 S
Keshav Cements 201312 5.12 10.98 0.04 8.25 2.78 1.05 0.66 1.08 0.47 0.61 0.61 1.18 0 S
Keshav Cements 201403 5.12 11.35 0.05 8.31 3.08 1.66 0.83 0.59 0.59 0.59 1.16 0 S
Keshav Cements 201406 5.12 10.29 0.03 7.84 2.48 0.92 0.70 0.86 0.86 0.86 1.67 0 S
Keshav Cements 201409 5.12 10.81 0.03 8.29 2.55 0.92 0.70 0.93 0.93 0.93 1.80 0 S
Keynote Corporate Services 201312 7.02 2.65 0.02 1.29 0.22 1.60 0.03 0.11 1.46 0.50 0.96 0.96 1.36 10 C
Keynote Corporate Services 201403 7.02 1.34 0.01 2.33 0.74 -0.24 0.05 -0.29 -0.20 -0.09 -0.09 -0.13 10 C
Keynote Corporate Services 201406 7.02 0.49 0.00 1.15 0.27 -0.38 0.01 0.12 -0.52 -0.02 -0.50 -0.50 -0.70 10 C
Keynote Corporate Services 201409 7.02 0.59 0.00 1.14 0.63 0.09 0.01 0.13 -0.05 0.01 -0.06 -0.06 -0.09 10 C
KZ Leasing & Finance 201312 3.04 0.18 0.06 0.01 0.14 0.01 0.00 0.13 0.13 0.13 0.42 0 S
KZ Leasing & Finance 201403 3.04 0.76 0.19 0.03 0.60 0.01 0.00 0.09 0.06 0.03 0.03 0.11 0 S
KZ Leasing & Finance 201406 3.04 0.12 0.08 0.05 0.10 0.01 0.00 0.08 0.08 0.08 0.28 0 S
KZ Leasing & Finance 201409 3.04 0.08 0.11 0.07 0.11 0.02 0.00 0.09 0.09 0.09 0.30 0 S
Maestros Electronics & Telecommunications Systems201312 3.28 3.01 2.79 0.02 0.24 0.06 0.10 0.08 0.04 0.04 0.04 0.12 0 S
Maestros Electronics & Telecommunications Systems201403 3.28 3.12 2.95 0.10 0.27 0.06 0.10 0.11 0.04 0.07 0.07 0.20 0 S
Maestros Electronics & Telecommunications Systems201406 3.28 1.06 1.49 0.11 -0.33 0.06 0.10 -0.50 -0.50 -0.50 -1.52 0 S
Maestros Electronics & Telecommunications Systems201409 3.28 2.35 1.78 0.04 0.61 0.09 0.09 0.43 0.43 0.43 1.32 0 S
Maha Rashtra Apex Corporation201312 14.11 0.09 0.29 0.22 0.02 0.79 0.06 -0.64 -0.21 -0.64 -0.15 0 C
Maha Rashtra Apex Corporation201403 14.11 0.06 0.24 0.40 0.22 0.64 0.05 -0.56 -0.16 -0.56 -0.11 0 C
Maha Rashtra Apex Corporation201406 14.11 0.04 0.30 0.11 -0.14 0.77 0.05 -1.03 -0.60 -1.03 -0.72 0 C
Maha Rashtra Apex Corporation201409 14.11 0.07 0.24 0.36 0.19 0.58 0.05 -0.54 -0.23 -0.54 -0.16 0 C

Co_Name Year Equity N.Sale O.O.I T. Exp O.I PBIDT Int. Dep. PBT T.Tax PAT A.PAT EPS Div (%)
Exp
ecte
d R
esu
lts
on
10
Feb
ruar
y 20
15
Mandhana Industries 201312 33.12 383.58 330.27 1.33 54.63 21.40 7.14 26.09 19.09 7.00 7.00 2.11 20 S
Mandhana Industries 201403 33.12 443.66 368.78 2.51 77.40 23.27 7.71 46.42 20.54 25.88 25.88 7.81 20 S
Mandhana Industries 201406 33.12 316.33 261.13 2.85 58.04 24.16 9.89 23.99 7.93 16.06 16.06 4.85 20 S
Mandhana Industries 201409 33.12 465.72 391.79 2.11 76.04 24.75 9.02 42.27 15.59 26.68 26.68 8.06 20 S
Microse India 201312 2.16 1.31 1.39 0.00 -0.08 0.00 -0.08 0.00 -0.08 -0.08 0 S
Microse India 201403 2.16 0.91 0.89 0.00 0.02 0.05 -0.03 -0.03 -0.03 0 S
Microse India 201406 2.16 3.30 3.30 0.01 0.00 0.00 0.00 0.00 0.00 0 S
Microse India 201409 2.16 2.19 2.18 0.01 0.01 0.01 0.01 0.01 0.01 0 S
MM Forgings 201312 12.07 100.23 1.90 82.78 0.40 19.74 2.08 8.75 8.92 1.87 7.05 7.05 5.84 20 S
MM Forgings 201403 12.07 107.07 0.40 85.22 0.46 22.71 1.62 9.77 11.32 3.50 7.82 7.82 6.48 20 S
MM Forgings 201406 12.07 121.31 3.26 96.95 0.40 28.02 2.28 9.00 16.74 3.50 13.24 13.24 10.97 20 S
MM Forgings 201409 12.07 122.07 3.38 97.49 0.38 28.33 2.19 9.00 17.14 4.00 13.14 13.14 10.89 20 S
Morarjee Textiles 201312 25.43 97.75 78.54 0.01 19.22 6.53 3.80 8.89 0.00 8.89 8.89 2.30 35 C
Morarjee Textiles 201403 25.43 93.36 76.68 1.21 17.89 5.74 4.60 7.55 6.21 1.34 1.34 0.22 35 C
Morarjee Textiles 201406 25.43 97.37 78.72 0.75 19.40 5.21 2.37 11.82 4.04 7.78 7.78 1.99 35 C
Morarjee Textiles 201409 25.43 94.40 78.63 0.45 16.22 5.51 2.38 8.33 3.01 5.32 5.32 1.31 35 C
Motherson Sumi Systems 201312 88.19 7889.83 98.84 7195.45 4.83 798.05 70.29 217.43 510.33 156.57 353.76 249.60 2.83 250 C
Motherson Sumi Systems 201403 88.19 8289.01 117.73 7540.69 4.28 870.33 81.39 212.91 576.03 114.75 461.28 302.53 3.43 250 C
Motherson Sumi Systems 201406 88.19 8296.43 95.11 7675.41 15.84 731.97 62.05 219.30 404.84 152.37 252.47 163.73 1.86 250 C
Motherson Sumi Systems 201409 88.19 7922.10 94.56 7307.73 4.88 713.81 95.61 236.93 257.00 108.52 148.48 104.44 1.18 250 C
Mukat Pipes 201312 7.83 1.65 1.47 0.15 0.33 0.07 0.23 0.03 0.03 0.03 0.03 0 S
Mukat Pipes 201403 7.83 1.19 1.06 0.09 0.23 0.07 0.26 -0.22 -0.97 -0.22 -1.24 0 S
Mukat Pipes 201406 7.83 1.42 2.13 -0.71 0.08 0.24 -1.03 -1.03 -1.03 -1.32 0 S
Mukat Pipes 201409 7.83 1.37 1.99 0.00 -0.62 0.07 0.24 -1.17 -1.17 -1.17 -1.49 0 S
Nagreeka Capital & Infrastructure201312 6.31 4.53 0.12 4.42 3.31 0.01 1.10 1.10 1.10 0.87 0 S
Nagreeka Capital & Infrastructure201403 6.31 4.78 0.22 4.56 3.43 0.01 1.13 0.00 1.13 1.13 0.90 0 S
Nagreeka Capital & Infrastructure201406 6.31 4.95 0.10 4.85 4.66 0.01 0.18 0.18 0.18 0.15 0 S
Nagreeka Capital & Infrastructure201409 6.31 6.41 0.19 6.22 5.87 0.01 0.35 0.35 0.35 0.27 0 S
Nagreeka Exports 201312 6.26 138.19 131.10 0.11 7.19 2.57 2.57 2.04 2.04 2.04 1.63 10 S
Nagreeka Exports 201403 6.26 190.02 184.60 4.38 9.80 5.73 2.40 1.68 5.22 -3.54 -3.54 -2.83 10 S
Nagreeka Exports 201406 6.26 124.06 113.57 0.04 10.53 6.51 2.56 1.45 1.45 1.45 1.16 10 S
Nagreeka Exports 201409 6.26 91.81 83.98 0.15 7.98 4.85 2.53 0.60 0.60 0.60 0.48 10 S
National Aluminium Company 201312 1288.62 1620.96 22.91 1439.56 120.77 325.08 130.75 194.33 63.30 131.03 131.03 0.51 30 S
National Aluminium Company 201403 1268.62 1781.21 56.99 1528.97 135.39 444.62 140.94 254.31 81.86 172.45 172.45 0.67 30 S
National Aluminium Company 201406 1288.62 1651.29 28.75 1403.55 190.36 466.85 0.00 95.51 371.34 100.35 270.99 270.99 1.05 30 S
National Aluminium Company 201409 1288.62 1955.34 40.18 1521.22 168.61 642.91 0.00 103.76 539.15 197.63 341.52 341.52 1.33 30 S

Co_Name Year Equity N.Sale O.O.I T. Exp O.I PBIDT Int. Dep. PBT T.Tax PAT A.PAT EPS Div (%)
Exp
ecte
d R
esu
lts
on
10
Feb
ruar
y 20
15
Neelkanth Technologies 201312 3.62 0.01 -0.01 0.00 -0.01 -0.01 -0.01 -0.04 0 S
Neelkanth Technologies 201403 3.62 0.00 0.03 -0.03 0.00 -0.03 -0.03 -0.03 -0.08 0 S
Neelkanth Technologies 201406 3.62 0.00 0.00 0.00 -0.01 -0.01 -0.01 -0.02 0 S
Neelkanth Technologies 201409 3.62 0.00 0.00 0.00 -0.01 -0.01 -0.01 -0.01 0 S
Nesco 201312 14.09 46.08 13.78 2.27 34.57 0.03 2.83 31.70 10.20 21.50 21.50 15.26 50 S
Nesco 201403 14.09 51.63 20.25 8.03 39.42 0.02 2.90 36.50 11.97 24.53 24.53 17.41 50 S
Nesco 201406 14.09 37.36 8.52 7.27 36.12 0.01 1.55 34.56 9.55 25.01 25.01 17.74 50 S
Nesco 201409 14.09 46.64 11.27 4.57 39.94 0.08 2.11 37.76 11.20 26.56 26.56 18.85 50 S
Nicco Parks & Resorts 201312 4.68 7.53 2.17 7.81 0.24 2.13 0.13 0.38 1.62 0.54 1.08 1.08 0.23 15 S
Nicco Parks & Resorts 201403 4.68 9.57 2.08 9.27 0.29 2.67 0.11 0.38 2.18 0.72 1.50 1.47 0.32 15 S
Nicco Parks & Resorts 201406 4.68 9.58 1.13 8.39 0.35 2.67 0.11 0.31 2.25 0.75 1.50 1.50 0.32 15 S
Nicco Parks & Resorts 201409 4.68 7.55 0.72 7.76 0.33 0.84 0.10 0.33 0.41 0.13 0.28 0.28 0.06 15 S
NRB Industrial Bearings 201312 4.85 7.74 0.42 13.85 1.30 -4.39 0.95 2.18 -7.52 0.00 -7.52 -7.52 -3.10 0 S
NRB Industrial Bearings 201403 4.85 7.43 0.30 8.33 0.19 -0.41 2.14 1.64 0.35 0.35 0.35 0.14 0 S
NRB Industrial Bearings 201406 4.85 6.48 0.13 8.08 0.19 -1.27 1.99 1.69 -4.95 -4.95 -4.95 -2.04 0 S
NRB Industrial Bearings 201409 4.85 7.37 0.16 9.83 0.48 -1.82 2.34 1.69 -5.85 -5.85 -5.85 -2.42 0 S
Oasis Securities 201312 1.85 11.75 0.05 11.10 0.10 0.80 0.22 0.58 0.58 0.58 3.13 0 S
Oasis Securities 201403 1.85 6.89 0.23 7.66 0.03 -0.51 -0.51 -0.51 -0.51 -2.74 0 S
Oasis Securities 201406 1.85 1.27 0.55 1.06 0.77 0.32 0.45 0.45 0.45 2.45 0 S
Oasis Securities 201409 1.85 2.65 0.02 1.95 0.71 0.37 0.34 0.34 0.34 1.85 0 S
Olympic Cards 201312 16.31 13.89 0.03 12.31 0.35 1.96 0.58 0.20 1.18 0.32 0.74 0.86 0.45 7 S
Olympic Cards 201403 16.31 12.71 0.03 11.31 0.18 1.61 0.78 0.21 0.61 0.24 0.24 0.37 0.15 7 S
Olympic Cards 201406 16.31 13.18 0.03 11.38 0.13 1.96 0.77 0.50 0.69 0.14 0.55 0.55 0.34 7 S
Olympic Cards 201409 16.31 12.60 0.03 11.22 0.12 1.53 0.72 0.53 0.28 0.06 0.22 0.22 0.14 7 S
Onesource Ideas Venture 201312 4.50 0.01 0.01 0.01 0.01 0.01 0.01 0.01 0 S
Onesource Ideas Venture 201403 4.50 -0.16 -0.01 0.16 0.02 0.14 -0.05 0.19 0.19 0.42 0 S
Onesource Ideas Venture 201406 4.50 0.02 -0.02 -0.02 -0.02 -0.02 -0.05 0 S
Onesource Ideas Venture 201409 4.50 0.05 -0.05 -0.05 -0.05 -0.05 -0.10 0 S
Orosil Smiths India 201312 4.13 0.84 0.79 0.05 0.10 0.07 0.09 -0.07 -0.07 -0.07 -0.16 0 S
Orosil Smiths India 201403 4.13 1.51 1.43 0.42 0.51 0.03 0.08 0.40 0.40 0.40 0.26 0 S
Orosil Smiths India 201406 4.13 0.97 0.94 0.02 0.05 0.02 0.10 -0.07 -0.07 -0.07 -0.08 0 S
Orosil Smiths India 201409 4.13 0.95 0.98 0.04 0.01 0.02 0.15 -0.16 -0.16 -0.16 -0.19 0 S
Parenteral Drugs (India) 201312 29.82 60.29 1.66 61.05 0.90 15.59 4.57 -19.26 0.52 -19.78 -19.78 -6.63 0 C
Parenteral Drugs (India) 201403 29.82 58.72 0.48 94.14 -34.94 14.98 4.95 -52.50 9.97 -62.46 -62.46 -20.95 0 C
Parenteral Drugs (India) 201406 29.82 77.11 0.05 74.45 2.71 16.52 5.75 -19.57 0.92 -20.49 -20.49 -6.87 0 C
Parenteral Drugs (India) 201409 29.82 67.68 0.03 64.47 3.24 17.16 5.75 -19.67 0.92 -20.59 -20.59 -6.90 0 C

Co_Name Year Equity N.Sale O.O.I T. Exp O.I PBIDT Int. Dep. PBT T.Tax PAT A.PAT EPS Div (%)
Exp
ecte
d R
esu
lts
on
10
Feb
ruar
y 20
15
Parker Agrochem Exports 201312 4.78 82.97 0.01 83.57 -0.59 0.09 -0.68 -0.68 -0.68 -1.42 0 S
Parker Agrochem Exports 201403 4.78 27.24 0.05 27.09 0.20 0.09 0.11 -0.01 0.12 0.12 0.25 0 S
Parker Agrochem Exports 201406 4.78 19.82 0.01 19.28 0.55 0.09 0.46 0.46 0.46 0.96 0 S
Parker Agrochem Exports 201409 4.78 119.46 0.01 119.46 0.01 0.09 -0.08 -0.08 -0.08 -0.17 0 S
Pranavaditya Spinning Mills 201312 19.24 19.09 0.15 19.02 0.22 0.06 0.12 0.04 0.03 0.01 0.01 0 S
Pranavaditya Spinning Mills 201403 19.24 19.03 0.08 17.56 1.55 0.09 0.14 1.33 0.41 0.91 0.91 0.47 0 S
Pranavaditya Spinning Mills 201406 19.24 17.46 0.13 16.82 0.76 0.09 0.14 0.53 0.17 0.36 0.36 0.19 0 S
Pranavaditya Spinning Mills 201409 19.24 18.02 0.12 17.89 0.25 0.05 0.14 0.06 0.04 0.02 0.02 0.01 0 S
Precision Wires India 201312 11.56 255.40 0.00 245.18 0.15 10.37 0.73 3.13 6.52 2.67 3.85 3.85 3.33 100 S
Precision Wires India 201403 11.56 248.53 0.46 242.28 0.08 6.80 0.58 2.87 3.36 1.81 1.55 1.55 1.34 100 S
Precision Wires India 201406 11.56 238.69 0.92 227.00 0.19 12.80 3.88 4.75 4.17 1.43 2.74 2.74 2.37 100 S
Precision Wires India 201409 11.56 223.83 0.01 209.35 0.62 15.11 4.76 4.86 5.50 2.68 2.82 2.82 2.44 100 S
Pritish Nandy Communications 201312 14.47 0.15 0.73 0.48 -0.10 0.01 0.05 -0.15 0.01 -0.16 -0.16 -0.11 0 C
Pritish Nandy Communications 201403 14.47 37.48 32.55 0.29 5.22 0.02 0.05 5.16 0.50 4.65 4.65 3.22 0 C
Pritish Nandy Communications 201406 14.47 1.14 0.36 -0.78 0.01 0.23 -1.02 -0.06 -0.97 -0.97 -0.67 0 C
Pritish Nandy Communications 201409 14.47 0.02 1.16 0.29 -0.86 0.01 0.06 -0.92 -0.92 -0.92 -0.64 0 C
PSL 201312 53.33 69.69 8.05 123.74 -46.00 2.55 44.68 -93.23 -93.23 -93.23 -17.48 0 C
PSL 201403 53.33 109.93 20.99 118.64 9.56 21.84 15.65 44.76 -48.91 -48.91 -48.91 -9.17 0 C
PSL 201406 53.33 37.63 5.78 61.18 -17.77 5.00 43.44 -66.21 -66.21 -66.21 -12.42 0 C
PSL 201409 53.33 40.49 9.26 61.55 -11.80 22.22 43.45 -77.47 -77.47 -77.47 -14.47 0 C
Punit Commercials 201312 0.24 4.72 0.12 5.08 -0.24 0.00 -0.25 -0.25 -0.25 -10.23 0 S
Punit Commercials 201403 0.24 4.25 0.02 4.15 0.12 0.00 0.01 0.11 0.11 0.11 4.50 0 S
Punit Commercials 201406 0.24 2.78 0.82 2.66 0.94 0.00 0.94 0.94 0.94 39.14 0 S
Punit Commercials 201409 0.24 10.37 -0.09 10.34 -0.06 0.02 -0.07 -0.07 -0.07 -3.10 0 S
Radford Global 201312 14.06 2.54 2.70 0.20 0.04 0.00 0.04 0.01 0.03 0.03 0.01 0 S
Radford Global 201403 14.06 3.35 3.62 0.31 0.04 0.00 0.03 0.01 0.02 0.02 0 S
Radford Global 201406 14.06 1.99 2.03 0.12 0.07 0.00 0.07 0.02 0.05 0.05 0.01 0 S
Radford Global 201409 14.06 5.68 5.69 0.04 0.04 0.00 0.04 0.01 0.03 0.03 0 S
Radico Khaitan 201312 26.59 379.43 11.44 336.91 9.04 63.01 22.20 9.85 30.95 9.43 21.52 21.52 1.62 40 S
Radico Khaitan 201403 26.61 342.66 8.74 310.58 10.12 50.94 22.35 9.75 18.83 8.93 9.90 9.90 0.74 40 S
Radico Khaitan 201406 26.61 360.83 9.09 321.63 9.33 57.62 22.57 10.50 24.55 8.00 16.55 16.55 1.24 40 S
Radico Khaitan 201409 26.61 351.61 10.95 319.66 10.45 53.35 22.69 10.50 20.17 5.25 14.92 14.92 1.12 40 S
Rasoya Proteins 201312 170.89 668.64 4.05 636.43 0.87 37.13 11.53 2.94 22.67 4.43 18.23 18.23 0.11 0 C
Rasoya Proteins 201403 170.89 413.99 8.43 401.94 5.67 26.15 11.22 2.67 12.27 -5.29 17.55 17.55 0.10 0 C
Rasoya Proteins 201406 170.89 373.09 1.90 339.73 0.07 35.32 10.11 2.55 22.66 2.83 19.83 19.83 0.12 0 C
Rasoya Proteins 201409 170.89 120.47 1.74 144.02 0.08 -21.72 13.70 3.12 -38.54 0.36 -38.90 -38.90 -0.23 0 C
Co_Name Year Equity N.Sale O.O.I T. Exp O.I PBIDT Int. Dep. PBT T.Tax PAT A.PAT EPS Div (%)
Exp
ecte
d R
esu
lts
on
10
Feb
ruar
y 20
15
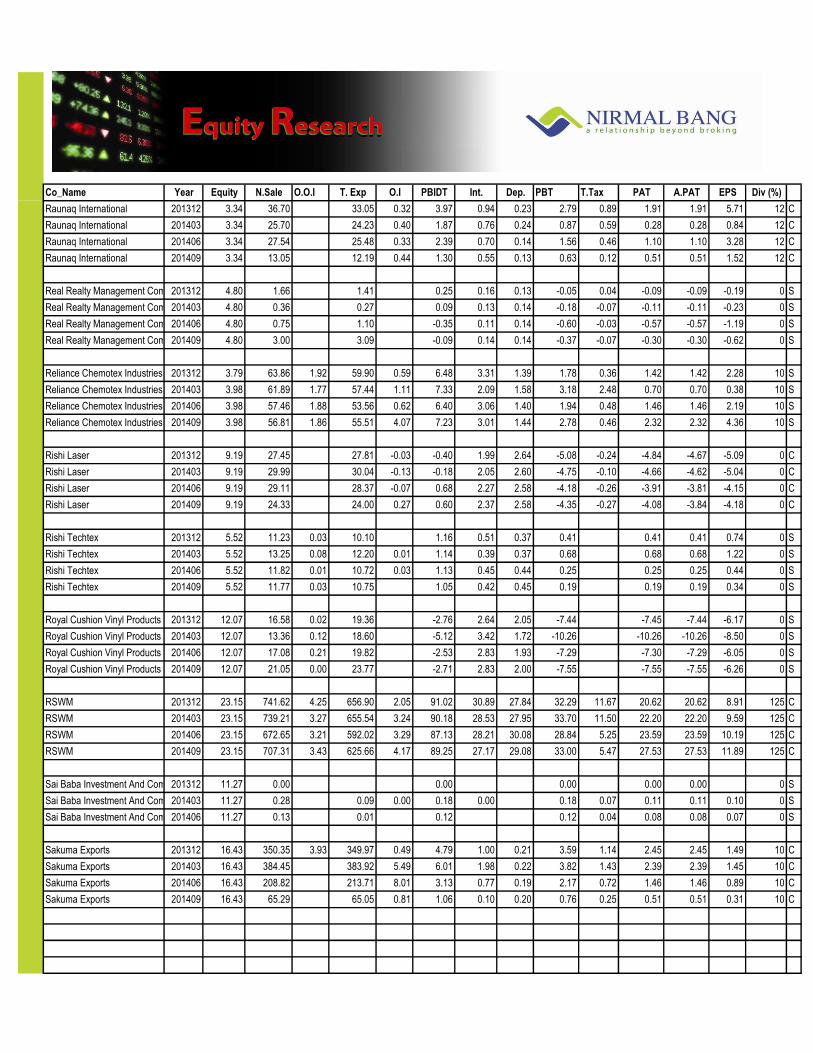
Raunaq International 201312 3.34 36.70 33.05 0.32 3.97 0.94 0.23 2.79 0.89 1.91 1.91 5.71 12 C
Raunaq International 201403 3.34 25.70 24.23 0.40 1.87 0.76 0.24 0.87 0.59 0.28 0.28 0.84 12 C
Raunaq International 201406 3.34 27.54 25.48 0.33 2.39 0.70 0.14 1.56 0.46 1.10 1.10 3.28 12 C
Raunaq International 201409 3.34 13.05 12.19 0.44 1.30 0.55 0.13 0.63 0.12 0.51 0.51 1.52 12 C
Real Realty Management Company201312 4.80 1.66 1.41 0.25 0.16 0.13 -0.05 0.04 -0.09 -0.09 -0.19 0 S
Real Realty Management Company201403 4.80 0.36 0.27 0.09 0.13 0.14 -0.18 -0.07 -0.11 -0.11 -0.23 0 S
Real Realty Management Company201406 4.80 0.75 1.10 -0.35 0.11 0.14 -0.60 -0.03 -0.57 -0.57 -1.19 0 S
Real Realty Management Company201409 4.80 3.00 3.09 -0.09 0.14 0.14 -0.37 -0.07 -0.30 -0.30 -0.62 0 S
Reliance Chemotex Industries 201312 3.79 63.86 1.92 59.90 0.59 6.48 3.31 1.39 1.78 0.36 1.42 1.42 2.28 10 S
Reliance Chemotex Industries 201403 3.98 61.89 1.77 57.44 1.11 7.33 2.09 1.58 3.18 2.48 0.70 0.70 0.38 10 S
Reliance Chemotex Industries 201406 3.98 57.46 1.88 53.56 0.62 6.40 3.06 1.40 1.94 0.48 1.46 1.46 2.19 10 S
Reliance Chemotex Industries 201409 3.98 56.81 1.86 55.51 4.07 7.23 3.01 1.44 2.78 0.46 2.32 2.32 4.36 10 S
Rishi Laser 201312 9.19 27.45 27.81 -0.03 -0.40 1.99 2.64 -5.08 -0.24 -4.84 -4.67 -5.09 0 C
Rishi Laser 201403 9.19 29.99 30.04 -0.13 -0.18 2.05 2.60 -4.75 -0.10 -4.66 -4.62 -5.04 0 C
Rishi Laser 201406 9.19 29.11 28.37 -0.07 0.68 2.27 2.58 -4.18 -0.26 -3.91 -3.81 -4.15 0 C
Rishi Laser 201409 9.19 24.33 24.00 0.27 0.60 2.37 2.58 -4.35 -0.27 -4.08 -3.84 -4.18 0 C
Rishi Techtex 201312 5.52 11.23 0.03 10.10 1.16 0.51 0.37 0.41 0.41 0.41 0.74 0 S
Rishi Techtex 201403 5.52 13.25 0.08 12.20 0.01 1.14 0.39 0.37 0.68 0.68 0.68 1.22 0 S
Rishi Techtex 201406 5.52 11.82 0.01 10.72 0.03 1.13 0.45 0.44 0.25 0.25 0.25 0.44 0 S
Rishi Techtex 201409 5.52 11.77 0.03 10.75 1.05 0.42 0.45 0.19 0.19 0.19 0.34 0 S
Royal Cushion Vinyl Products 201312 12.07 16.58 0.02 19.36 -2.76 2.64 2.05 -7.44 -7.45 -7.44 -6.17 0 S
Royal Cushion Vinyl Products 201403 12.07 13.36 0.12 18.60 -5.12 3.42 1.72 -10.26 -10.26 -10.26 -8.50 0 S
Royal Cushion Vinyl Products 201406 12.07 17.08 0.21 19.82 -2.53 2.83 1.93 -7.29 -7.30 -7.29 -6.05 0 S
Royal Cushion Vinyl Products 201409 12.07 21.05 0.00 23.77 -2.71 2.83 2.00 -7.55 -7.55 -7.55 -6.26 0 S
RSWM 201312 23.15 741.62 4.25 656.90 2.05 91.02 30.89 27.84 32.29 11.67 20.62 20.62 8.91 125 C
RSWM 201403 23.15 739.21 3.27 655.54 3.24 90.18 28.53 27.95 33.70 11.50 22.20 22.20 9.59 125 C
RSWM 201406 23.15 672.65 3.21 592.02 3.29 87.13 28.21 30.08 28.84 5.25 23.59 23.59 10.19 125 C
RSWM 201409 23.15 707.31 3.43 625.66 4.17 89.25 27.17 29.08 33.00 5.47 27.53 27.53 11.89 125 C
Sai Baba Investment And Commercial Enterprises201312 11.27 0.00 0.00 0.00 0.00 0.00 0 S
Sai Baba Investment And Commercial Enterprises201403 11.27 0.28 0.09 0.00 0.18 0.00 0.18 0.07 0.11 0.11 0.10 0 S
Sai Baba Investment And Commercial Enterprises201406 11.27 0.13 0.01 0.12 0.12 0.04 0.08 0.08 0.07 0 S
Sakuma Exports 201312 16.43 350.35 3.93 349.97 0.49 4.79 1.00 0.21 3.59 1.14 2.45 2.45 1.49 10 C
Sakuma Exports 201403 16.43 384.45 383.92 5.49 6.01 1.98 0.22 3.82 1.43 2.39 2.39 1.45 10 C
Sakuma Exports 201406 16.43 208.82 213.71 8.01 3.13 0.77 0.19 2.17 0.72 1.46 1.46 0.89 10 C
Sakuma Exports 201409 16.43 65.29 65.05 0.81 1.06 0.10 0.20 0.76 0.25 0.51 0.51 0.31 10 C

Co_Name Year Equity N.Sale O.O.I T. Exp O.I PBIDT Int. Dep. PBT T.Tax PAT A.PAT EPS Div (%)
Exp
ecte
d R
esu
lts
on
10
Feb
ruar
y 20
15
Sanghi Industries 201312 219.98 284.62 0.90 244.71 2.29 43.10 4.67 36.96 1.47 -6.01 7.48 7.48 0.34 0 S
Sanghi Industries 201403 219.98 328.24 0.44 266.32 3.65 66.01 4.49 36.35 25.17 25.17 25.17 1.14 0 S
Sanghi Industries 201406 219.98 288.24 0.56 219.18 3.56 73.18 37.72 35.46 35.46 35.46 1.61 0 S
Sanghi Industries 201409 219.98 178.96 0.83 146.58 0.97 34.18 3.75 28.59 1.84 1.84 1.84 0.08 0 S
Sanghvi Movers 201312 8.66 55.79 0.31 25.92 1.84 32.02 12.06 29.59 -9.62 -3.12 -6.50 -6.50 -1.50 0 S
Sanghvi Movers 201403 8.66 68.34 0.21 33.44 2.02 37.13 11.10 29.64 -3.61 -2.18 -1.43 -1.43 -0.33 0 S
Sanghvi Movers 201406 8.66 57.16 0.47 28.96 2.97 31.64 10.80 29.98 -9.14 -2.97 -6.18 -6.18 -1.43 0 S
Sanghvi Movers 201409 8.66 54.76 0.82 30.44 3.02 28.16 10.70 30.06 -12.60 -4.09 -8.51 -8.51 -1.97 0 S
Sanguine Media 201312 114.10 2.35 2.31 0.04 0.04 0.04 0.04 0 S
Sanguine Media 201403 114.10 1.31 1.32 0.64 0.64 0.00 0.63 0.01 0.03 -0.02 -0.02 0 S
Sanguine Media 201406 114.10 1.47 1.27 0.20 0.00 0.16 0.04 0.01 0.03 0.03 0 S
Sanguine Media 201409 114.10 2.14 0.01 1.87 0.28 0.01 0.16 0.11 0.11 0.11 0.01 0 S
Santosh Fine-Fab 201312 3.53 6.56 0.23 6.51 0.03 0.32 0.20 0.09 0.03 0.03 0.03 0.08 0 S
Santosh Fine-Fab 201403 3.53 7.11 0.27 7.19 0.07 0.24 0.21 0.09 0.01 0.11 -0.09 -0.09 -0.26 0 S
Santosh Fine-Fab 201406 3.53 10.79 0.64 11.07 0.02 0.38 0.21 0.07 0.10 0.04 0.06 0.07 0.18 0 S
Santosh Fine-Fab 201409 3.53 9.81 0.27 9.64 0.06 0.50 0.21 0.07 0.22 0.08 0.14 0.14 0.40 0 S
Sharda Motor Industries 201312 5.95 195.11 1.35 178.66 3.30 21.10 4.60 11.80 4.70 0.79 3.91 3.91 6.58 100 S
Sharda Motor Industries 201403 5.95 218.67 2.45 199.39 4.29 26.02 4.60 12.57 8.85 10.78 -1.93 -1.93 -3.24 100 S
Sharda Motor Industries 201406 5.95 205.91 1.49 184.20 0.50 23.71 3.94 11.59 8.18 0.99 7.19 7.19 12.09 100 S
Sharda Motor Industries 201409 5.95 209.16 2.96 191.41 5.72 26.43 4.42 12.27 9.74 -1.29 11.03 11.03 18.55 100 S
Shentracon Chemicals 201312 4.44 0.01 0.01 0.01 0.01 0.00 0.00 0.00 0 S
Shentracon Chemicals 201403 4.44 0.01 0.01 0.01 0.01 0.00 0.00 0.00 0.01 0 S
Shentracon Chemicals 201406 4.44 0.00 0.01 0.01 0.01 -0.39 -0.39 -0.39 0 S
Shentracon Chemicals 201409 4.44 0.00 0.02 0.01 -0.01 0.00 0.01 -0.01 0.00 -0.01 -0.01 -0.03 0 S
Shree Rama Multi-Tech 201312 31.76 27.94 0.06 24.80 0.29 3.49 1.89 5.47 -3.44 -0.97 -2.47 -2.47 -0.39 0 S
Shree Rama Multi-Tech 201403 31.76 27.69 0.00 22.87 2.79 7.61 0.50 5.21 48.02 9.37 38.65 38.65 6.09 0 S
Shree Rama Multi-Tech 201406 31.76 29.59 0.05 26.25 0.35 3.74 1.86 5.73 -3.85 -1.45 -2.40 -2.40 -0.38 0 S
Shree Rama Multi-Tech 201409 31.76 28.24 0.05 24.82 0.35 3.82 1.53 9.86 -7.41 -6.93 -0.48 -0.48 -0.08 0 S
Shree Surgovind Tradelink 201312 5.01 16.92 0.38 15.98 0.12 1.45 1.25 0.02 0.18 0.06 0.12 0.12 0.24 0 S
Shree Surgovind Tradelink 201403 5.01 8.36 7.02 0.00 1.34 1.13 0.02 0.19 0.05 0.14 0.14 0.29 0 S
Shree Surgovind Tradelink 201406 5.01 9.01 8.59 0.03 0.45 0.86 0.03 -0.44 0.00 -0.45 -0.45 -0.89 0 S
Shree Surgovind Tradelink 201409 5.01 13.03 13.09 0.41 0.35 0.87 0.03 -0.55 -0.31 -0.24 -0.24 -0.48 0 S
Shree Tulsi Online.Com 201312 23.36 4.33 4.21 0.03 0.15 0.03 0.12 0.12 0.12 0.05 0 S
Shree Tulsi Online.Com 201403 23.36 3.89 4.19 0.03 -0.27 0.03 -0.30 -0.30 -0.30 -0.13 0 S
Shree Tulsi Online.Com 201406 23.36 0.20 0.16 0.03 0.07 0.03 0.04 0.04 0.04 0.02 0 S
Shree Tulsi Online.Com 201409 23.36 0.20 0.17 0.03 0.06 0.03 0.04 0.04 0.04 0.02 0 S

Co_Name Year Equity N.Sale O.O.I T. Exp O.I PBIDT Int. Dep. PBT T.Tax PAT A.PAT EPS Div (%)
Exp
ecte
d R
esu
lts
on
10
Feb
ruar
y 20
15
Soma Textiles & Industries 201312 33.23 58.56 0.03 64.04 0.73 -4.72 5.46 3.10 -14.55 -14.55 -14.55 -4.40 0 S
Soma Textiles & Industries 201403 33.23 69.87 0.02 67.03 0.89 3.75 6.09 2.99 -8.33 -4.35 -3.98 -3.98 -1.20 0 S
Soma Textiles & Industries 201406 33.23 71.24 74.12 1.03 -1.85 6.04 7.74 -15.21 -15.21 -15.21 -4.61 0 S
Soma Textiles & Industries 201409 33.23 68.78 0.28 74.56 0.89 -4.61 5.77 6.26 -14.26 -14.26 -14.26 -4.31 0 S
Span Diagnostics 201312 7.28 37.99 0.27 37.38 0.61 1.49 2.10 2.34 -2.95 -0.30 -2.65 -2.66 -3.66 0 C
Span Diagnostics 201403 7.28 22.21 0.15 20.73 -0.16 1.46 1.26 1.36 -1.17 0.72 -1.88 -1.89 -2.59 0 C
Span Diagnostics 201406 7.28 20.71 0.11 20.59 0.31 0.53 1.20 1.54 -2.21 -0.19 -2.01 -2.01 -2.77 0 C
Span Diagnostics 201409 7.28 26.07 0.14 22.12 0.47 4.56 1.18 1.63 1.75 -0.20 1.95 1.95 2.68 0 C
Speciality Restaurants 201312 46.96 67.18 5.02 61.28 2.75 13.67 0.03 4.72 8.92 2.23 6.69 6.69 1.43 10 S
Speciality Restaurants 201403 46.96 63.29 4.21 60.80 2.63 9.33 0.02 5.48 3.83 0.40 3.43 3.43 0.73 10 S
Speciality Restaurants 201406 46.96 68.29 2.03 64.25 1.82 7.89 0.02 5.55 2.32 0.41 1.91 1.91 0.41 10 S
Speciality Restaurants 201409 46.96 70.88 4.13 68.02 2.11 9.10 0.03 6.08 2.99 0.61 2.38 2.38 0.51 10 S
Spectra Industries 201312 7.08 16.07 0.11 16.29 0.10 -0.01 0.14 0.16 -0.31 -0.31 -0.31 -0.44 0 S
Spectra Industries 201403 7.08 17.60 0.12 17.24 0.13 0.61 0.57 0.05 -0.01 -0.01 -0.01 -0.01 0 S
Spectra Industries 201406 7.08 18.89 0.12 18.59 0.04 0.47 0.27 0.15 0.05 0.05 0.05 0.06 0 S
Spectra Industries 201409 7.08 22.29 0.22 22.37 0.26 0.40 0.18 0.15 0.07 0.07 0.07 0.10 0 S
Spice Mobility 201312 68.36 567.04 1.12 558.34 5.20 15.02 0.21 9.77 2.12 1.04 1.08 1.02 0.04 5 C
Spice Mobility 201403 68.36 468.41 0.58 479.21 2.53 -7.69 0.20 9.70 -17.69 0.52 -18.21 -18.67 -0.81 5 C
Spice Mobility 201406 68.36 541.17 0.09 540.14 3.73 4.85 0.31 6.71 -16.84 1.74 -18.58 -18.62 -0.82 5 C
Spice Mobility 201409 68.36 544.29 0.42 550.71 3.90 -2.10 0.30 6.78 -10.80 2.85 -13.65 -13.32 -0.58 5 C
SRF 201312 57.42 859.44 2.13 716.37 10.53 155.73 15.96 47.89 91.88 19.82 72.06 72.06 12.55 100 C
SRF 201403 57.42 883.67 3.11 780.75 6.54 112.57 11.19 46.21 65.88 12.98 52.90 52.90 9.21 100 C
SRF 201406 57.42 936.25 5.84 771.58 30.44 200.95 23.40 49.11 128.44 28.97 99.47 99.47 17.32 100 C
SRF 201409 57.42 916.87 11.30 744.08 4.57 188.66 27.33 52.15 109.18 32.33 76.85 76.85 13.38 100 C
SRM Energy 201312 9.06 0.00 0.07 0.00 -0.07 0.00 -0.07 0.00 -0.07 -0.07 -0.08 0 C
SRM Energy 201403 9.06 0.29 -0.29 -0.29 -0.29 -0.29 -0.32 0 C
SRM Energy 201406 9.06 0.01 -0.01 -0.01 -0.01 -0.01 -0.14 0 C
SRM Energy 201409 9.06 0.19 -0.19 -0.29 -0.29 -0.29 -0.32 0 C
Superb Papers 201312 5.44 0.01 0.02 -0.01 -0.01 -0.01 -0.01 0 S
Superb Papers 201403 5.44 0.11 0.05 0.06 0.06 0.06 0.06 0.01 0 S
Superb Papers 201406 5.44 0.02 0.01 0.01 0.01 0.01 0.01 0.01 0 S
Superb Papers 201409 5.44 0.02 0.32 -0.31 -0.31 -0.31 -0.31 -0.56 0 S
Suryakrupa Finance 201312 1.00 0.01 0.01 0.00 0.00 0.00 0.00 0 S
Suryakrupa Finance 201403 1.00 0.01 0.01 0.00 0.00 0.00 0.00 0 S
Suryakrupa Finance 201406 1.00 0.02 0.02 0.00 -0.06 -0.06 -0.06 -0.06 0 S
Suryakrupa Finance 201409 1.00 0.01 0.00 0.00 0.00 0.00 0.00 0 S

Co_Name Year Equity N.Sale O.O.I T. Exp O.I PBIDT Int. Dep. PBT T.Tax PAT A.PAT EPS Div (%)
Exp
ecte
d R
esu
lts
on
10
Feb
ruar
y 20
15
Suven Life Sciences 201312 11.68 119.43 64.54 0.85 55.74 2.21 2.25 51.27 14.84 36.43 36.43 3.12 250 S
Suven Life Sciences 201403 11.68 130.80 83.37 1.20 48.64 1.70 2.28 44.67 12.26 32.41 32.41 2.77 250 S
Suven Life Sciences 201406 11.68 141.53 83.65 1.08 58.96 1.16 2.39 51.35 16.61 34.74 34.74 2.97 250 S
Suven Life Sciences 201409 11.68 139.83 101.44 1.42 39.81 1.33 2.48 32.78 7.94 24.84 24.84 2.13 250 S
Swastik Safe Deposit & Investments201312 0.24 0.00 0.00 0.00 0.00 0.00 -0.08 10 S
Swastik Safe Deposit & Investments201403 0.24 0.01 -0.01 -0.01 0.00 -0.02 -0.02 -0.61 10 S
Swastik Safe Deposit & Investments201406 0.24 0.02 -0.02 -0.02 -0.02 -0.02 -0.62 10 S
Swastik Safe Deposit & Investments201409 0.24 3.86 0.07 3.79 1.76 2.03 -0.65 2.68 2.68 111.68 10 S
Tamilnadu Steel Tubes 201312 5.13 21.23 21.83 0.00 -0.60 0.36 0.07 -1.03 -0.32 -0.71 -0.71 -1.38 0 S
Tamilnadu Steel Tubes 201403 5.13 28.62 28.38 0.01 0.26 0.34 0.07 2.42 -0.08 2.51 2.51 4.89 0 S
Tamilnadu Steel Tubes 201406 5.13 29.71 27.67 0.01 2.05 0.39 0.07 1.59 0.44 1.15 1.15 2.24 0 S
Tamilnadu Steel Tubes 201409 5.13 24.59 23.69 0.89 0.36 0.07 0.47 0.20 0.27 0.27 0.53 0 S
Tavernier Resources 201312 5.98 0.18 -1.88 0.45 0.06 -2.09 0.03 -2.12 -2.12 -2.12 -3.55 0 S
Tavernier Resources 201403 5.98 0.66 -1.51 1.09 0.02 -1.93 0.03 -1.96 -0.15 -1.81 -1.81 -3.03 0 S
Tavernier Resources 201406 5.98 0.54 0.45 0.03 0.12 0.03 0.09 0.09 0.09 0.14 0 S
Tavernier Resources 201409 5.98 1.76 3.70 2.09 0.02 3.39 0.00 3.39 0.10 3.29 3.29 5.50 0 S
TGB Banquets And Hotels 201312 29.29 49.99 0.97 34.04 0.52 17.44 7.32 5.44 4.68 1.00 3.68 3.68 1.26 0 C
TGB Banquets And Hotels 201403 29.29 50.22 1.11 45.60 0.16 5.88 4.95 2.35 -1.42 2.64 -4.06 -4.06 0 C
TGB Banquets And Hotels 201406 29.29 29.72 0.81 22.23 0.41 8.70 4.58 2.79 1.33 1.33 1.33 0.45 0 C
TGB Banquets And Hotels 201409 29.29 26.56 0.70 19.27 0.57 8.56 4.55 3.00 1.01 1.01 1.01 0.34 0 C
Thambbi Modern Spinning Mills 201312 5.76 0.75 0.20 1.11 -0.16 0.20 -0.36 -0.36 -0.36 0 S
Thambbi Modern Spinning Mills 201403 5.76 0.75 0.20 1.11 -0.16 0.20 -0.36 -0.36 -0.36 0 S
Thambbi Modern Spinning Mills 201406 5.76 0.30 0.23 0.07 0.10 0.05 -0.08 -0.08 -0.08 0 S
Thambbi Modern Spinning Mills 201409 5.76 0.16 0.38 0.50 0.04 0.08 0.06 -0.10 -0.10 -0.10 0 S
Tokyo Finance 201312 6.94 0.40 0.10 0.30 0.21 0.00 0.09 0.09 0.09 0.13 0 S
Tokyo Finance 201403 6.94 0.39 0.09 0.30 0.20 0.00 0.10 0.03 0.07 0.07 0.10 0 S
Tokyo Finance 201406 6.94 0.42 0.38 0.04 0.22 0.00 -0.18 0.04 -0.22 -0.22 -0.31 0 S
Tokyo Finance 201409 6.94 0.42 0.08 0.34 0.22 0.00 0.12 0.04 0.08 0.08 0.12 0 S
Tokyo Plast International 201312 9.50 13.38 12.35 0.06 1.10 0.62 0.59 -0.11 -0.14 0.03 0.03 0.03 0 C
Tokyo Plast International 201403 9.50 14.45 13.85 -0.19 0.41 0.61 0.53 -0.72 -0.98 0.25 0.25 0.27 0 C
Tokyo Plast International 201406 9.50 15.02 12.42 0.50 3.10 0.69 0.50 1.91 0.35 1.56 1.56 1.64 0 C
Tokyo Plast International 201409 9.50 16.20 13.37 0.50 3.33 0.70 0.58 2.06 0.41 1.65 1.65 1.74 0 C
TRF 201312 11.00 236.89 245.19 8.58 0.28 14.73 3.07 -17.52 -0.13 -17.39 -17.45 -15.86 0 C
TRF 201403 11.00 352.82 343.43 3.43 12.83 14.72 2.98 24.85 0.46 24.40 24.15 21.95 0 C
TRF 201406 11.00 296.03 293.49 2.17 4.72 14.12 3.37 -3.63 1.99 -5.62 -6.19 -5.62 0 C
TRF 201409 11.00 246.46 235.97 0.55 11.03 14.30 3.18 -6.45 2.60 -9.05 -9.28 -8.43 0 C

Co_Name Year Equity N.Sale O.O.I T. Exp O.I PBIDT Int. Dep. PBT T.Tax PAT A.PAT EPS Div (%)
Exp
ecte
d R
esu
lts
on
10
Feb
ruar
y 20
15
Trijal Industries 201312 5.02 0.03 0.02 0.01 0.00 0.00 0.01 0.00 0.00 -0.01 0 S
Trijal Industries 201403 5.02 0.00 0.02 -0.02 0.00 -0.02 0.00 -0.02 -0.02 -0.09 0 S
Trijal Industries 201406 5.02 0.03 0.02 0.01 0.00 0.00 0.00 0.00 0.04 0 S
Trijal Industries 201409 5.02 0.02 -0.02 0.00 -0.02 -0.02 -0.02 -0.45 0 S
Triveni Turbine 201312 32.99 140.75 0.10 109.54 2.16 33.47 0.09 3.24 30.14 9.40 20.74 20.74 0.63 75 C
Triveni Turbine 201403 32.99 130.28 1.04 104.01 5.22 32.53 0.14 3.25 29.14 9.87 19.27 19.27 0.58 75 C
Triveni Turbine 201406 33.00 119.56 1.53 99.07 3.35 25.37 0.12 4.06 21.19 6.97 14.22 14.22 0.43 75 C
Triveni Turbine 201409 33.00 155.61 0.16 120.94 4.56 39.39 0.02 4.00 35.37 11.50 23.87 23.87 0.72 75 C
Ugar Sugar Works 201312 11.25 127.70 130.93 4.65 1.42 7.67 6.27 -12.52 -2.24 -10.28 -10.28 -0.91 0 S
Ugar Sugar Works 201403 11.25 260.55 196.84 2.16 65.87 6.33 6.97 52.56 8.37 44.19 44.19 3.93 0 S
Ugar Sugar Works 201406 11.25 279.49 270.32 0.53 9.70 5.28 5.16 -0.74 0.00 -0.74 -0.74 -0.07 0 S
Ugar Sugar Works 201409 11.25 133.30 137.12 0.40 -3.42 3.16 5.15 -11.73 -0.99 -10.73 -10.73 -0.95 0 S
United Bank of India 201312 554.75 2765.53 436.95 221.27 545.08 2004.77 -1312.75 -74.67 -1238.08 -1238.08 -32.25 0 S
United Bank of India 201403 554.75 2762.04 467.14 311.74 542.95 2063.69 276.25 -193.12 469.37 469.37 8.46 0 S
United Bank of India 201406 632.15 2602.40 424.11 401.85 574.19 2005.95 148.71 82.82 65.89 65.89 0.82 0 S
United Bank of India 201409 716.66 2497.62 439.42 337.74 459.05 1936.89 107.21 63.41 43.80 43.80 0.43 0 S
United Credit 201312 5.49 0.44 0.27 0.01 0.17 0.01 0.16 0.04 0.12 0.12 0.23 0 S
United Credit 201403 5.49 0.51 0.26 0.05 0.30 0.02 0.01 0.28 0.08 0.20 0.20 0.37 0 S
United Credit 201406 5.49 0.46 0.27 0.01 0.20 0.01 0.19 0.15 0.04 0.04 0.07 0 S
United Credit 201409 5.49 0.47 0.32 0.01 0.16 0.01 0.15 0.03 0.13 0.13 0.23 0 S
Uttam Value Steels 201312 1195.84 1531.44 1475.26 9.41 65.59 55.74 37.75 -27.89 -27.89 -27.89 -0.23 0 S
Uttam Value Steels 201403 1195.84 1463.90 1389.99 19.15 93.06 85.40 36.32 -28.66 -28.66 -28.66 -0.24 0 S
Uttam Value Steels 201406 1322.94 1496.41 1410.22 12.79 98.98 75.17 27.97 -4.16 -4.16 -4.16 -0.03 0 S
Uttam Value Steels 201409 1322.94 1206.27 1136.20 21.16 91.23 67.72 28.30 -4.79 -4.79 -4.79 -0.04 0 S
Vapi Enterprise 201312 2.28 0.31 0.00 0.15 0.00 0.16 0.02 0.04 0.11 0.11 0.11 0.48 0 S
Vapi Enterprise 201403 2.28 0.20 0.18 0.01 0.03 0.01 0.04 -0.01 -0.08 -0.01 -0.37 0 S
Vapi Enterprise 201406 2.28 0.49 0.36 0.00 0.14 0.01 0.04 0.09 0.09 0.09 0.41 0 S
Vapi Enterprise 201409 2.28 0.83 0.66 0.00 0.17 0.01 0.04 0.12 0.12 0.12 0.52 0 S
Victoria Mills 201312 0.99 0.08 0.23 -0.15 0.01 -0.17 -0.02 -0.15 -0.15 -15.29 50 C
Victoria Mills 201403 0.99 5.17 0.16 4.47 0.85 0.01 0.84 0.11 0.74 0.74 74.68 50 C
Victoria Mills 201406 0.99 0.34 0.29 0.05 0.05 0.00 0.03 -0.03 -0.03 -2.91 50 C
Victoria Mills 201409 0.99 0.62 0.35 0.27 0.05 0.22 0.08 0.14 0.14 14.45 50 C
Viji Finance 201312 7.50 0.23 0.08 0.00 0.16 0.01 0.01 0.14 0.05 0.09 0.09 0.12 5 S
Viji Finance 201403 7.50 0.66 0.10 0.00 0.56 0.02 0.01 0.53 0.16 0.37 0.37 0.43 5 S
Viji Finance 201406 7.50 0.34 0.05 0.00 0.29 0.01 0.01 0.27 0.08 0.18 0.18 0.25 5 S
Viji Finance 201409 7.50 0.32 0.07 0.25 0.03 0.01 0.20 0.06 0.14 0.14 0.19 5 S

Co_Name Year Equity N.Sale O.O.I T. Exp O.I PBIDT Int. Dep. PBT T.Tax PAT A.PAT EPS Div (%)
Exp
ecte
d R
esu
lts
on
10
Feb
ruar
y 20
15
Vinaditya Trading Company 201312 0.15 0.03 0.03 0.01 0.01 0.01 0.01 0.45 0 S
Vinaditya Trading Company 201403 0.15 0.17 0.09 0.08 0.08 0.03 0.06 0.06 3.66 0 S
Vinaditya Trading Company 201406 0.15 0.05 0.03 0.02 0.02 0.02 0.02 1.00 0 S
Vinaditya Trading Company 201409 0.15 0.01 0.05 0.04 0.04 0.04 0.04 2.35 0 S
Vintage Securities 201312 3.78 0.02 0.01 0.01 0.00 0.01 0.01 0.01 0.02 0 S
Vintage Securities 201403 3.78 0.02 0.01 0.01 0.01 0.00 0.01 0.01 0.01 0.01 0.02 0 S
Vintage Securities 201406 3.78 0.01 0.01 0.01 0.01 0.00 0.01 0.01 0.01 0.02 0 S
Vintage Securities 201409 3.78 0.01 0.01 0.01 0.01 0.00 0.01 0.01 0.01 0.01 0 S
Vipul 201312 12.00 67.03 61.61 0.46 5.88 4.49 0.32 -0.41 0.35 -0.77 -0.77 -0.06 5 C
Vipul 201403 12.00 72.98 70.33 3.80 6.46 4.68 0.29 1.49 -0.61 2.10 2.10 0.18 5 C
Vipul 201406 12.00 74.41 67.73 0.51 7.20 6.24 0.22 0.74 0.20 0.54 0.54 0.05 5 C
Vipul 201409 12.00 64.98 64.33 0.41 1.06 6.51 0.22 -5.67 -1.83 -3.84 -3.84 -0.32 5 C
Virtual Global Education 201312 42.37 2.19 2.15 0.04 0.00 0.03 0.03 0.03 0 S
Virtual Global Education 201403 42.37 2.21 0.34 2.52 0.03 0.00 0.03 0.03 0.03 0 S
Virtual Global Education 201406 42.37 2.61 2.58 0.04 0.00 0.03 0.03 0.03 0 S
Virtual Global Education 201409 42.37 2.75 2.72 0.04 0.00 0.04 0.04 0.04 0 S
Wallfort Financial Services 201312 9.69 0.60 0.28 1.37 -0.49 0.07 0.09 -0.65 -0.65 -0.65 -0.67 0 S
Wallfort Financial Services 201403 9.69 4.19 0.33 1.48 3.03 0.07 0.03 2.93 -0.05 2.97 2.97 3.07 0 S
Wallfort Financial Services 201406 9.69 10.78 0.30 1.22 9.87 0.01 0.08 9.78 1.80 7.98 7.98 8.23 0 S
Wallfort Financial Services 201409 9.69 10.14 0.30 1.70 8.74 0.02 0.08 8.65 1.85 6.80 6.80 7.02 0 S
Winsome Breweries 201312 27.67 10.51 0.23 10.03 0.71 0.07 0.34 0.30 0.30 0.30 0.11 0 S
Winsome Breweries 201403 27.67 15.39 0.30 16.71 1.35 0.33 0.09 0.34 -0.09 0.12 -0.21 -0.21 -0.08 0 S
Winsome Breweries 201406 27.67 22.01 0.47 21.82 0.66 0.06 0.35 0.25 0.08 0.17 0.17 0.06 0 S
Winsome Breweries 201409 27.67 17.16 0.40 16.81 0.01 0.76 0.06 0.35 0.36 0.11 0.25 0.25 0.09 0 S
Yantra Natural Resources 201312 192.26 5.63 5.62 0.01 0.01 0.01 0.01 0 S
Yantra Natural Resources 201403 628.05 4.76 -0.02 4.77 0.37 0.34 0.00 0.11 0.23 0.08 0.15 0.15 0 S
Yantra Natural Resources 201406 628.05 5.09 4.99 0.10 0.03 0.08 0.03 0.05 0.05 0 S
Yantra Natural Resources 201409 628.05 3.86 0.05 3.83 0.08 0.00 0.03 0.05 0.05 0.05 0 S
Zenith Health Care 201312 5.37 0.83 0.01 0.95 0.02 -0.09 0.00 0.05 -0.15 -0.15 -0.15 0 S
Zenith Health Care 201403 5.37 0.67 0.00 0.83 0.04 -0.12 0.06 -0.17 -0.17 -0.17 0 S
Zenith Health Care 201406 5.37 0.91 0.01 0.93 0.01 -0.01 0.06 -0.07 -0.07 -0.07 -0.01 0 S
Zenith Health Care 201409 5.37 0.82 0.01 0.81 0.01 0.02 0.00 0.06 -0.04 -0.04 -0.04 0 S
Zicom Electronic Security Systems201312 17.60 238.17 209.17 0.22 29.22 9.58 6.49 13.14 0.88 12.26 11.57 6.75 12 C
Zicom Electronic Security Systems201403 17.60 305.59 271.24 1.97 36.32 12.19 6.44 13.09 -1.98 15.07 14.07 8.05 12 C
Zicom Electronic Security Systems201406 17.60 220.79 190.82 0.20 30.17 12.03 7.44 10.71 1.52 9.19 8.63 4.90 12 C
Zicom Electronic Security Systems201409 17.60 261.37 228.97 0.31 32.71 9.59 7.68 15.44 1.86 13.58 12.92 7.34 12 C

Co_Name Year Equity N.Sale O.O.I T. Exp O.I PBIDT Int. Dep. PBT T.Tax PAT A.PAT EPS Div (%)
Exp
ecte
d R
esu
lts
on
10
Feb
ruar
y 20
15
Zuari Global 201312 29.44 8.48 0.52 10.05 6.12 5.07 0.24 0.03 4.80 1.49 3.31 3.31 1.12 10 C
Zuari Global 201403 29.44 112.95 4.34 110.46 4.94 11.77 1.26 0.03 -3.28 24.13 -27.41 -27.41 -9.31 10 C
Zuari Global 201406 29.44 39.52 1.32 42.76 5.18 3.26 2.97 0.06 0.23 0.19 0.04 0.04 0.01 10 C
Zuari Global 201409 29.44 0.77 -3.91 19.30 23.98 3.36 0.06 20.56 3.01 17.55 17.55 5.96 10 C
This Document has been prepared by Nirmal Bang Research (A Division of Nirmal Bang Securities Pvt. ). The information, analysis and
estimates contained herein are based on Nirmal Bang Research assessment and have been obtained from sources believed to be reliable. This
document is meant for the use of the intended recipient only. This document, at best, represents Nirmal Bang Research opinion and is meant for
general information only. Nirmal Bang Research, its directors, officers or employees shall not in anyway be responsible for the contents stated
herein. Nirmal Bang Research expressly disclaims any and all liabilities that may arise from information, errors or omissions in this connection.
This document is not to be considered as an offer to sell or a solicitation to buy any securities. Nirmal Bang Research, its affiliates and their
employees may from time to time hold positions in securities referred to herein. Nirmal Bang Research or its affiliates may from time to time
solicit from or perform investment banking or other services for any company mentioned in this document.
Nirmal Bang Research (Division of Nirmal Bang Securities Pvt. )
B-2, 301/302, Marathon Innova,
Opp. Peninsula Corporate Park
Off. Ganpatrao Kadam Marg
Lower Parel (W), Mumbai-400013
Board No. : 91 22 3926 8000/8001
Fax. : 022 3926 8010
Disclaimer: