Embed Size (px)
Citation preview

Expected Value and Variance
Have you ever wondered whether it would be “worth it” tobuy a lottery ticket every week, or pondered questions suchas “If I were offered a choice between a million dollars, or a1 in 100 chance of a billion dollars, which would I choose?”
One method of deciding on the answers to these questionsis to calculate the expected earnings of the enterprise, andaim for the option with the higher expected value.
This is a useful decision making tool for problems thatinvolve repeating many trials of an experiment — such asinvesting in stocks, choosing where to locate a business, orwhere to fish.
(For once-off decisions with high stakes, such as the choicebetween a sure 1 million dollars or a 1 in 100 chance of abillion dollars, it is unclear whether this is a useful tool.)
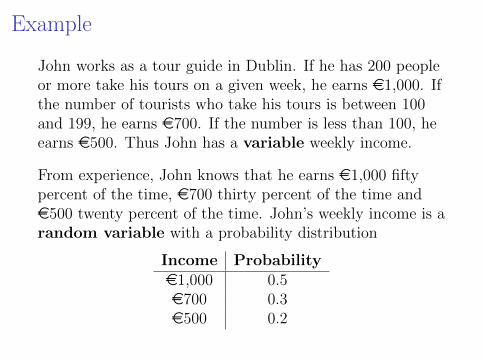
Example
John works as a tour guide in Dublin. If he has 200 peopleor more take his tours on a given week, he earns e1,000. Ifthe number of tourists who take his tours is between 100and 199, he earns e700. If the number is less than 100, heearns e500. Thus John has a variable weekly income.
From experience, John knows that he earns e1,000 fiftypercent of the time, e700 thirty percent of the time ande500 twenty percent of the time. John’s weekly income is arandom variable with a probability distribution
Income Probabilitye1,000 0.5e700 0.3e500 0.2

ExampleWhat is John’s average income, over the course of a50-week year?
Over 50 weeks, we expect that John will earn
I e1000 on about 25 of the weeks (50%);
I e700 on about 15 weeks (30%); and
I e500 on about 10 weeks (20%).
This suggests that his average weekly income will be
25(e1000) + 15(e700) + 10(e500)
50= e810.
Dividing through by 50, this calculation changes to
.5(e1000) + .3(e700) + .2(e500) = e810.
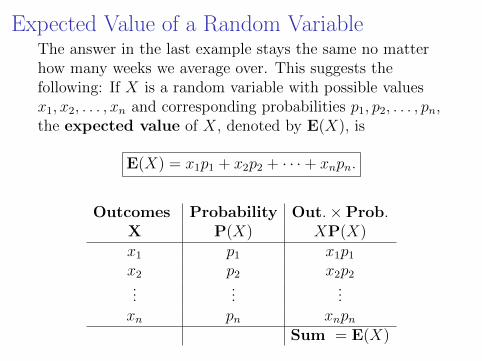
Expected Value of a Random VariableThe answer in the last example stays the same no matterhow many weeks we average over. This suggests thefollowing: If X is a random variable with possible valuesx1, x2, . . . , xn and corresponding probabilities p1, p2, . . . , pn,the expected value of X, denoted by E(X), is
E(X) = x1p1 + x2p2 + · · ·+ xnpn.
Outcomes Probability Out.×Prob.X P(X) XP(X)x1 p1 x1p1x2 p2 x2p2...
......
xn pn xnpnSum = E(X)
Expected Value of a Random Variable
We can interpret the expected value as the long termaverage of the outcomes of the experiment over a largenumber of trials. From the table, we see that thecalculation of the expected value is the same as that for theaverage of a set of data, with relative frequencies replacedby probabilities.
Warning: The expected value really ought to be called theexpected mean. It is NOT the value you most expect tosee but rather the average (or mean) of the values you seeover the course of many trials.

Coin tossing exampleFlip a coin 4 times and observe the sequence of heads andtails. Let X be the number of heads in the observedsequence. Last time we found the following probabilitydistribution for X:
X P(X)0 1/161 4/162 6/163 4/164 1/16
Find the expected number of heads for a trial of thisexperiment, that is find E(X).
E(X) =1
16· 0 +
4
16· 1 +
6
16· 2 +
4
16· 3 +
1
16· 4 =
0 + 4 + 12 + 12 + 4
16=
32
16= 2.
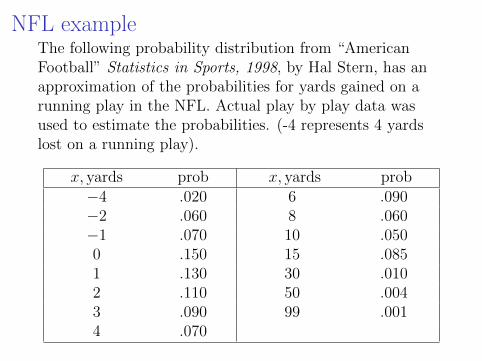
NFL exampleThe following probability distribution from “AmericanFootball” Statistics in Sports, 1998, by Hal Stern, has anapproximation of the probabilities for yards gained on arunning play in the NFL. Actual play by play data wasused to estimate the probabilities. (-4 represents 4 yardslost on a running play).
x, yards prob x, yards prob−4 .020 6 .090−2 .060 8 .060−1 .070 10 .0500 .150 15 .0851 .130 30 .0102 .110 50 .0043 .090 99 .0014 .070
NFL example
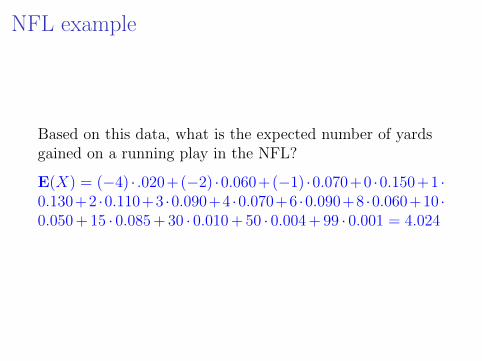
Based on this data, what is the expected number of yardsgained on a running play in the NFL?
E(X) = (−4) · .020+(−2) ·0.060+(−1) ·0.070+0 ·0.150+1 ·0.130+2 ·0.110+3 ·0.090+4 ·0.070+6 ·0.090+8 ·0.060+10 ·0.050 + 15 · 0.085 + 30 · 0.010 + 50 · 0.004 + 99 · 0.001 = 4.024
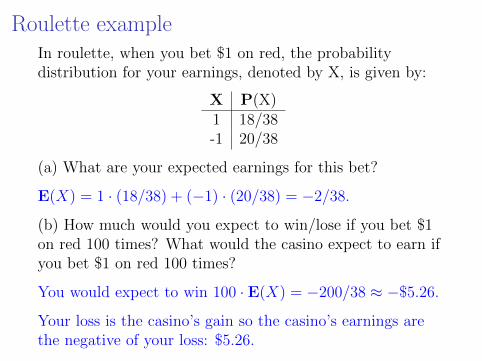
Roulette exampleIn roulette, when you bet $1 on red, the probabilitydistribution for your earnings, denoted by X, is given by:
X P(X)1 18/38-1 20/38
(a) What are your expected earnings for this bet?
E(X) = 1 · (18/38) + (−1) · (20/38) = −2/38.
(b) How much would you expect to win/lose if you bet $1on red 100 times? What would the casino expect to earn ifyou bet $1 on red 100 times?
You would expect to win 100 · E(X) = −200/38 ≈ −$5.26.
Your loss is the casino’s gain so the casino’s earnings arethe negative of your loss: $5.26.

A winning(?) strategy for Roulette?
Roulette seems like a fool’s game. But here’s a possiblestrategy for playing it:
1. Begin by betting a dollar on red.
2. If you win, take your winnings and go home.
3. If you lose, place two one-dollar bets in a row on red.
4. Whatever happens on those two rolls, go home (eitherwith your winnings to date, or cutting your losses)
Question: Is this a winning strategy? Specifically, what isthe probability that you will leave the Roulette wheel withmore money than you began with, and is this probabilitymore or less than 1/2?

A winning(?) strategy for Roulette?Let X be net winnings from this strategy. Possibleoutcomes/values for X:
I Win on first roll, probability 18/38 ≈ .474, X = +1
I Lose on first, win on next two, probability(20/38)(18/38)2 ≈ .118, X = +1
I Lose on first, win exactly one of next two, probability(20/38)2(18/38)(20/38) ≈ .262, X = −1
I Lose all three, probability (20/38)3 ≈ .146, X = −3.
So X takes value +1 with probability ≈ .592, value −1with probability ≈ .262, and value −3 with probability≈ .146. So the strategy is winning — you have a get gainmore often than a net loss!
On the other hand,E(X) = 1(.592)− 1(.262)− 3(.146) = −.108. So on average,playing this strategy long-term, you will lose money :(

Gambling example
The rules of a carnival game are as follows:
1. The player pays $1 to play the game.
2. The player then flips a fair coin, if the player gets ahead the game attendant gives the player $2 and theplayer stops playing.
3. If the player gets a tail on the coin, the player rolls afair six-sided die. If the player gets a six, the gameattendant gives the player $1 and the game is over.
4. If the player does not get a six on the die, the game isover and the game attendant gives nothing to theplayer.

Gambling exampleLet X denote the player’s (net) earnings for this game.Last time, we saw that X has probability distribution
X P(X)-1 5/120 1/121 1/2
(a) What are the expected earnings for the player for eachplay of this game?
E(X) = (−1) · 5
12+0 · 1
12+1 · 1
2=−5 + 0 + 6
12=
1
12≈ $0.08.
(b) What are the expected earnings for the game host foreach play of this game?
Host’s earnings are negative of your earnings:−1/12 ≈ −$0.08.

Variance and standard deviation
Let us return to the initial example of John’s weekly incomewhich was a random variable with probability distribution
Income Probabilitye1,000 0.5e700 0.3e500 0.2
with mean e810. Over 50 weeks, we might expect thevariance of John’s weekly earnings to be roughly
25(e1000-e810)2 + 15(e700-e810)2 + 10(e500-e810)2
50= 49, 900
or
.5(e1000-e810)2+.3(e700-e810)2+.2(e500-e810)2 = 49, 900

Variance and standard deviation
As with the calculations for the expected value, if we hadchosen any large number of weeks in our estimate, theestimates would have been the same. This suggests aformula for the variance of a random variable.
If X is a random variable with values x1, x2, . . . , xn,corresponding probabilities p1, p2, . . . , pn, and expectedvalue µ = E(X), then
Variance = σ2(X) = p1(x1 − µ)2 + p2(x2 − µ)2 + · · ·+ pn(xn − µ)2
and
Standard Deviation = σ(X) =√
Variance .

Variance and standard deviation
Variance = σ2(X) = p1(x1 − µ)2 + p2(x2 − µ)2 + · · ·+ pn(xn − µ)2
Standard Deviation = σ(X) =√
Variance .
xi pi xipi (xi − µ) (xi − µ)2 pi(xi − µ)2
x1 p1 x1p1 (x1 − µ) (x1 − µ)2 p1(x1 − µ)2
x2 p2 x2p2 (x2 − µ) (x2 − µ)2 p2(x2 − µ)2
......
......
......
xn pn xnpn (xn − µ) (xn − µ)2 pn(xn − µ)2
Sum = µ Sum = σ2(X)

Gambling example
The rules of a carnival game are as follows:
1. The player pays $1 to play the game.
2. The player then flips a fair coin, if the player gets ahead the game attendant gives the player $2 and theplayer stops playing.
3. If the player gets a tail on the coin, the player rolls afair six-sided die. If the player gets a six, the gameattendant gives the player $1 and the game is over.
4. If the player does not get a six on the die, the game isover and the game attendant gives nothing to theplayer.
Gambling example
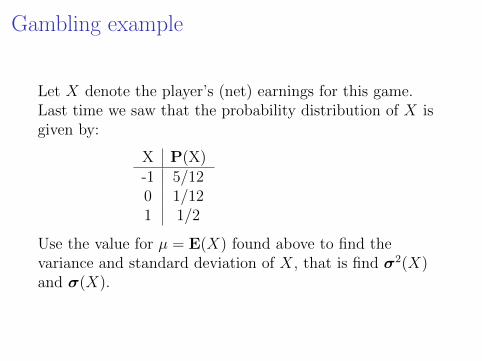
Let X denote the player’s (net) earnings for this game.Last time we saw that the probability distribution of X isgiven by:
X P(X)-1 5/120 1/121 1/2
Use the value for µ = E(X) found above to find thevariance and standard deviation of X, that is find σ2(X)and σ(X).
Gambling example
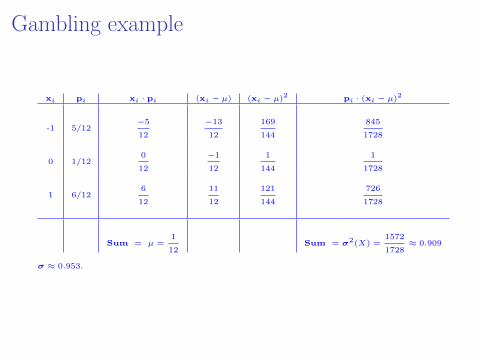
xi pi xi · pi (xi − µ) (xi − µ)2 pi · (xi − µ)2
-1 5/12−5
12
−13
12
169
144
845
1728
0 1/120
12
−1
12
1
144
1
1728
1 6/126
12
11
12
121
144
726
1728
Sum = µ =1
12Sum = σ2(X) =
1572
1728≈ 0.909
σ ≈ 0.953.

Coin tossing example
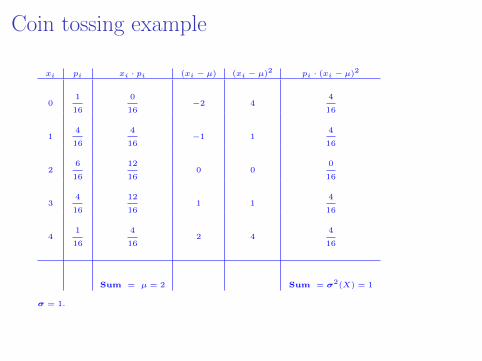
An experiment consists of flipping a coin 4 times andobserving the sequence of heads and tails. The randomvariable X is the number of heads in the observedsequence. Last time we found the following probabilitydistribution for X:
X P(X)0 1/161 4/162 6/163 4/164 1/16
We saw above that the expected value for this randomvariable is E(X) = 2. Find σ2(X) and σ(X).
Coin tossing example
xi pi xi · pi (xi − µ) (xi − µ)2 pi · (xi − µ)2
01
16
0
16−2 4
4
16
14
16
4
16−1 1
4
16
26
16
12
160 0
0
16
34
16
12
161 1
4
16
41
16
4
162 4
4
16
Sum = µ = 2 Sum = σ2(X) = 1
σ = 1.
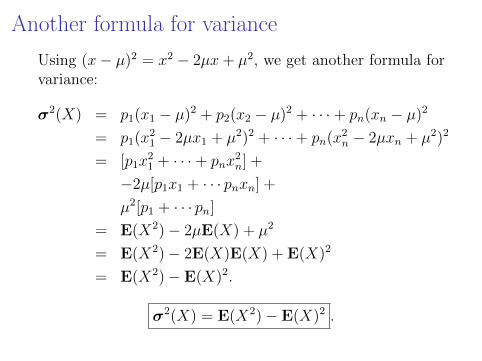
Another formula for variance
Using (x− µ)2 = x2 − 2µx+ µ2, we get another formula forvariance:
σ2(X) = p1(x1 − µ)2 + p2(x2 − µ)2 + · · ·+ pn(xn − µ)2
= p1(x21 − 2µx1 + µ2)2 + · · ·+ pn(x2n − 2µxn + µ2)2
= [p1x21 + · · ·+ pnx
2n] +
−2µ[p1x1 + · · · pnxn] +
µ2[p1 + · · · pn]
= E(X2)− 2µE(X) + µ2
= E(X2)− 2E(X)E(X) + E(X)2
= E(X2)− E(X)2.
σ2(X) = E(X2)− E(X)2 .
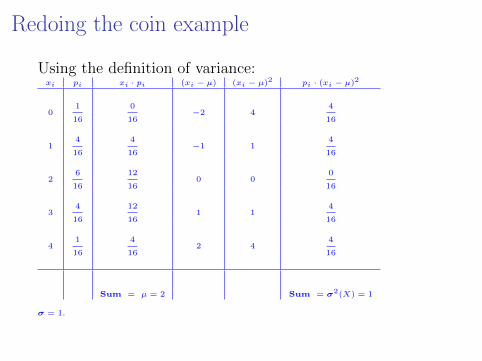
Redoing the coin example
Using the definition of variance:xi pi xi · pi (xi − µ) (xi − µ)2 pi · (xi − µ)2
01
16
0
16−2 4
4
16
14
16
4
16−1 1
4
16
26
16
12
160 0
0
16
34
16
12
161 1
4
16
41
16
4
162 4
4
16
Sum = µ = 2 Sum = σ2(X) = 1
σ = 1.
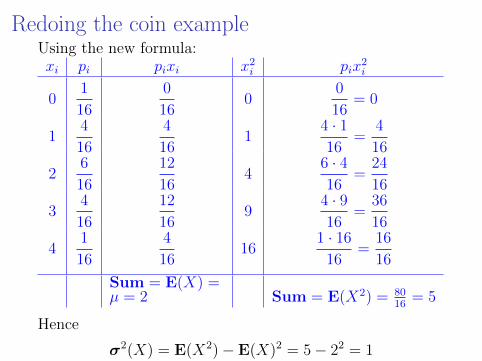
Redoing the coin exampleUsing the new formula:xi pi pixi x2i pix
2i
01
16
0
160
0
16= 0
14
16
4
161
4 · 116
=4
16
26
16
12
164
6 · 416
=24
16
34
16
12
169
4 · 916
=36
16
41
16
4
1616
1 · 16
16=
16
16
Sum = E(X) =µ = 2 Sum = E(X2) = 80
16= 5
Hence
σ2(X) = E(X2)− E(X)2 = 5− 22 = 1

Back to the Roulette strategyRecall that we had a Roulette strategy where yourwinnings X had probability distribution
P (X = 1) = .592, P (X = −1) = .262, P (X = −3) = .146.
We calculated E(X) = 1(.592)− 1(.262)− 3(.146) ≈ −.108
We can easily calculateE(X2) = 12(.592) + (−1)2(.2622) + (−3)2(.1462) ≈ 2.16
From this we get σ2(X) = .216− (−.108)2 ≈ 2.15, so thestandard deviation of your winnings is roughly√
2.15 ≈ 1.46.
The strategy “bet once on Red” has expected winnings−.053, with standard deviation .998 — our complicatedstrategy is a little bit worse on average, and much moreunstable