Embed Size (px)
Citation preview
Expeditionary Fluid Analysis Capability (EFAC)Phase III
Bob Yurko Spectro Scientific
Bob Appleton Troika Solutions

Purpose of Project
Develop a proposed DoD wide deployment plan for the EFAC oil analysis capability
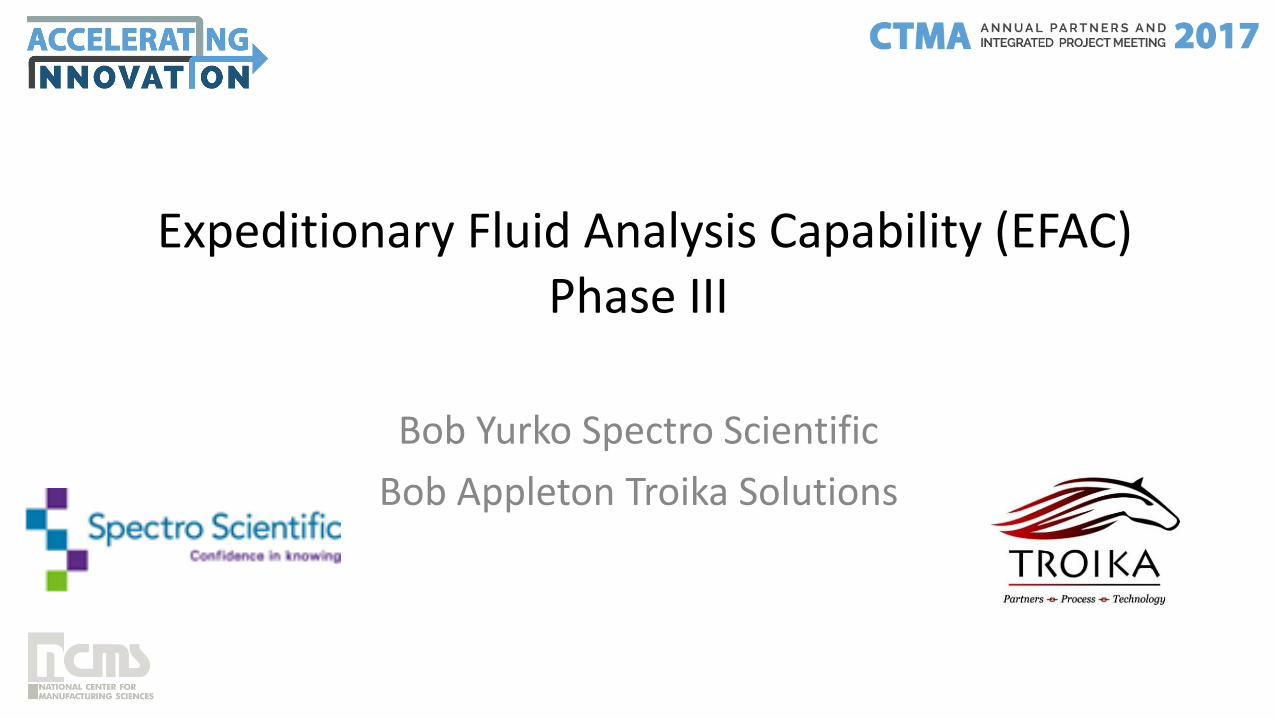
Problem Statement• Every year the DoD spends ~$71.5 billion on Maintenance
• A large portion of this is the cost of regularly scheduled time-based preventive maintenance• Since 2002, CBM+ has been established policy.
• Studies reveal that 33% - 60% of oil changed on a calendar based schedule is serviceable
• Oil change costs include:
• Oil
• Filter
• Transportation
• Labor hours
• Waste Disposal
Need a reliable method to assess oil condition at the vehicle prior to changing

What Could Be Gained by Oil Analysis
• Estimated DoD cost of changing and disposing of serviceable oil:
– $150-200 Million per year
– 160,000 man days per year
– Additional monetary, environmental, and transportation burdens
• Diagnosis/prognosis of mechanical condition for CBM
– Oil condition can identify mechanical condition
– i.e. USMC LVSR Transfer Case
Or what is lost by failure to analyze lubricating oil
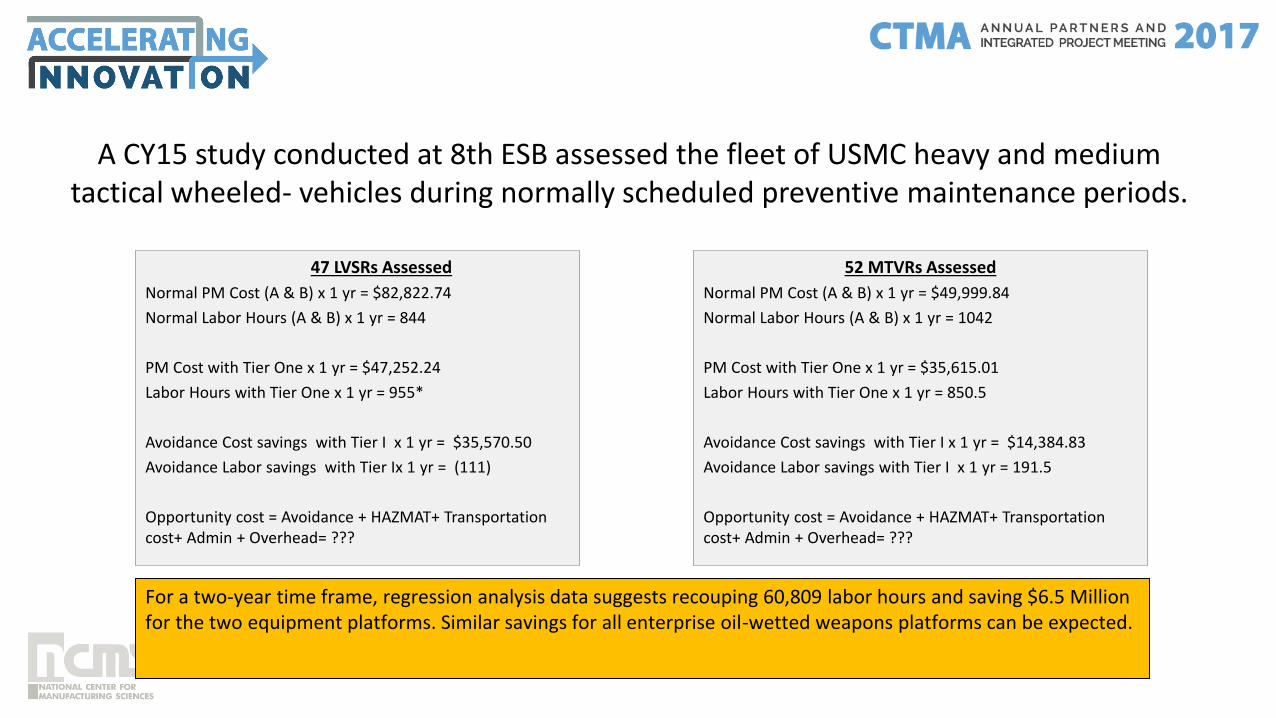
A CY15 study conducted at 8th ESB assessed the fleet of USMC heavy and medium tactical wheeled- vehicles during normally scheduled preventive maintenance periods.
47 LVSRs Assessed
Normal PM Cost (A & B) x 1 yr = $82,822.74
Normal Labor Hours (A & B) x 1 yr = 844
PM Cost with Tier One x 1 yr = $47,252.24
Labor Hours with Tier One x 1 yr = 955*
Avoidance Cost savings with Tier I x 1 yr = $35,570.50
Avoidance Labor savings with Tier Ix 1 yr = (111)
Opportunity cost = Avoidance + HAZMAT+ Transportation cost+ Admin + Overhead= ???
52 MTVRs Assessed
Normal PM Cost (A & B) x 1 yr = $49,999.84
Normal Labor Hours (A & B) x 1 yr = 1042
PM Cost with Tier One x 1 yr = $35,615.01
Labor Hours with Tier One x 1 yr = 850.5
Avoidance Cost savings with Tier I x 1 yr = $14,384.83
Avoidance Labor savings with Tier I x 1 yr = 191.5
Opportunity cost = Avoidance + HAZMAT+ Transportation cost+ Admin + Overhead= ???
For a two-year time frame, regression analysis data suggests recouping 60,809 labor hours and saving $6.5 Million for the two equipment platforms. Similar savings for all enterprise oil-wetted weapons platforms can be expected.
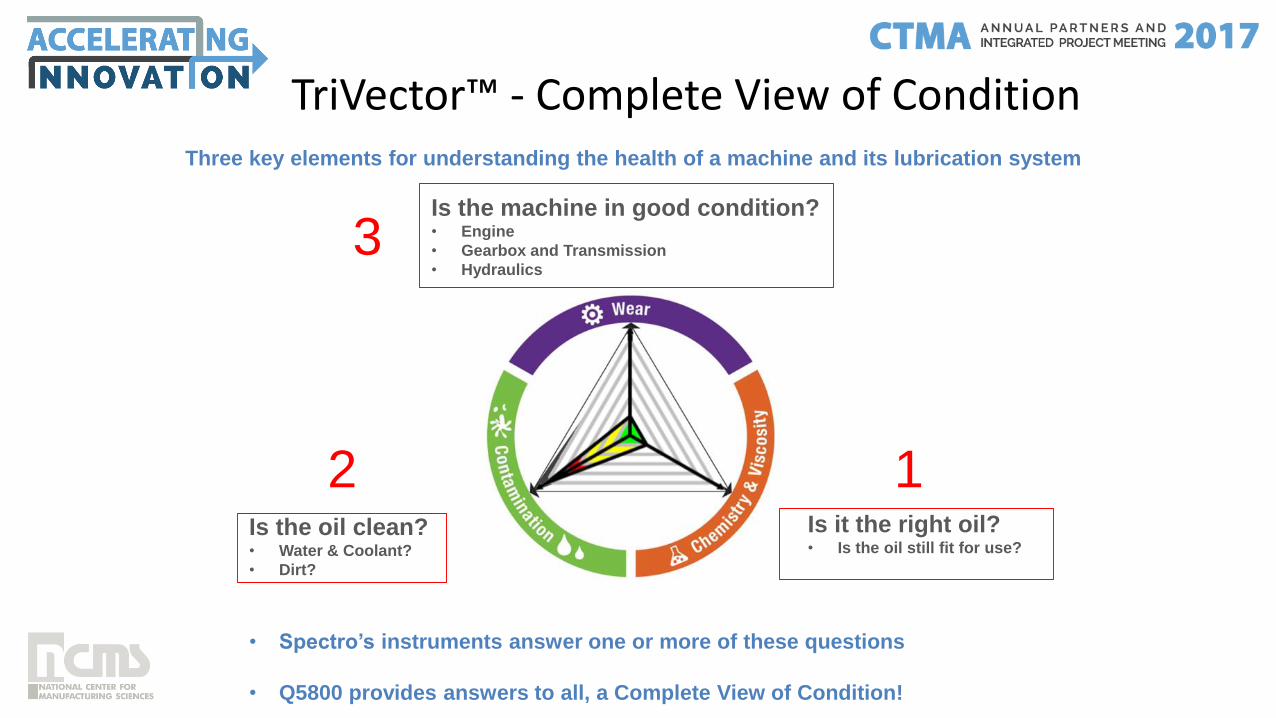
TriVector™ - Complete View of Condition
Is the machine in good condition?• Engine
• Gearbox and Transmission
• Hydraulics
Is it the right oil?• Is the oil still fit for use?
Is the oil clean?• Water & Coolant?
• Dirt?
Three key elements for understanding the health of a machine and its lubrication system
• Spectro’s instruments answer one or more of these questions
• Q5800 provides answers to all, a Complete View of Condition!
12
3
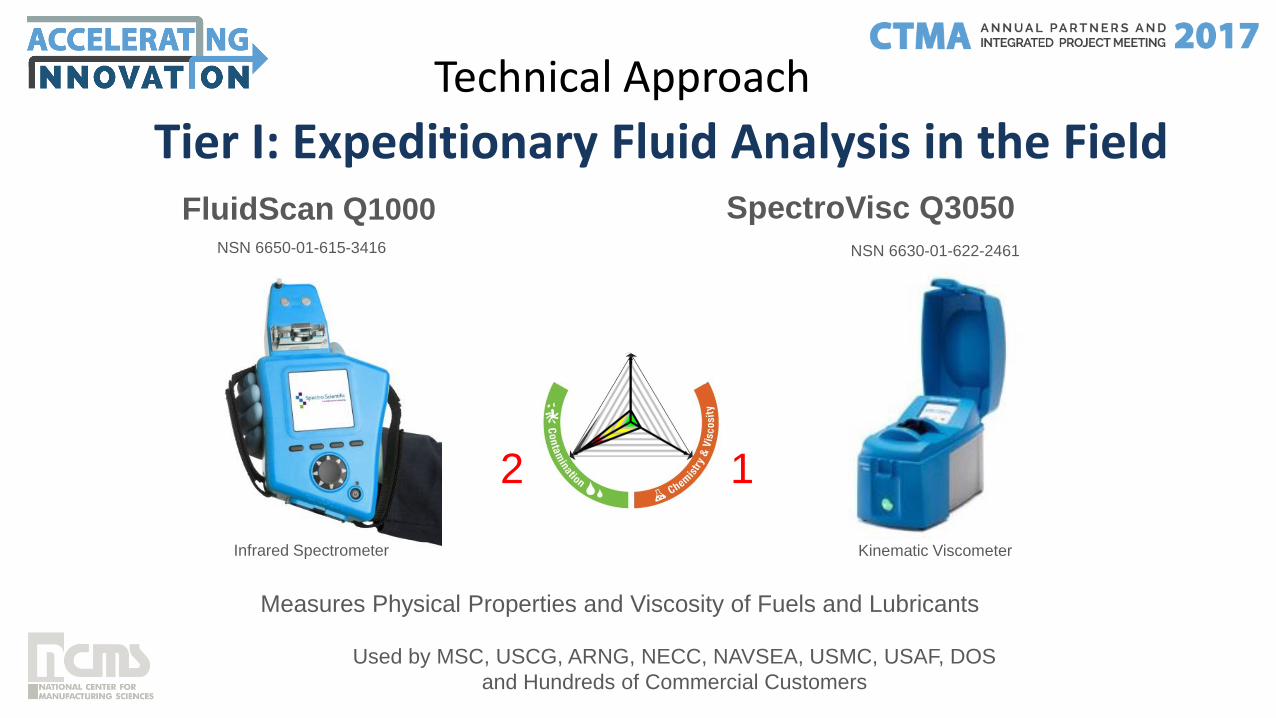
Technical Approach
Tier I: Expeditionary Fluid Analysis in the FieldFluidScan Q1000
Infrared Spectrometer Kinematic Viscometer
Used by MSC, USCG, ARNG, NECC, NAVSEA, USMC, USAF, DOS
and Hundreds of Commercial Customers
Measures Physical Properties and Viscosity of Fuels and Lubricants
NSN 6650-01-615-3416 NSN 6630-01-622-2461
SpectroVisc Q3050
12
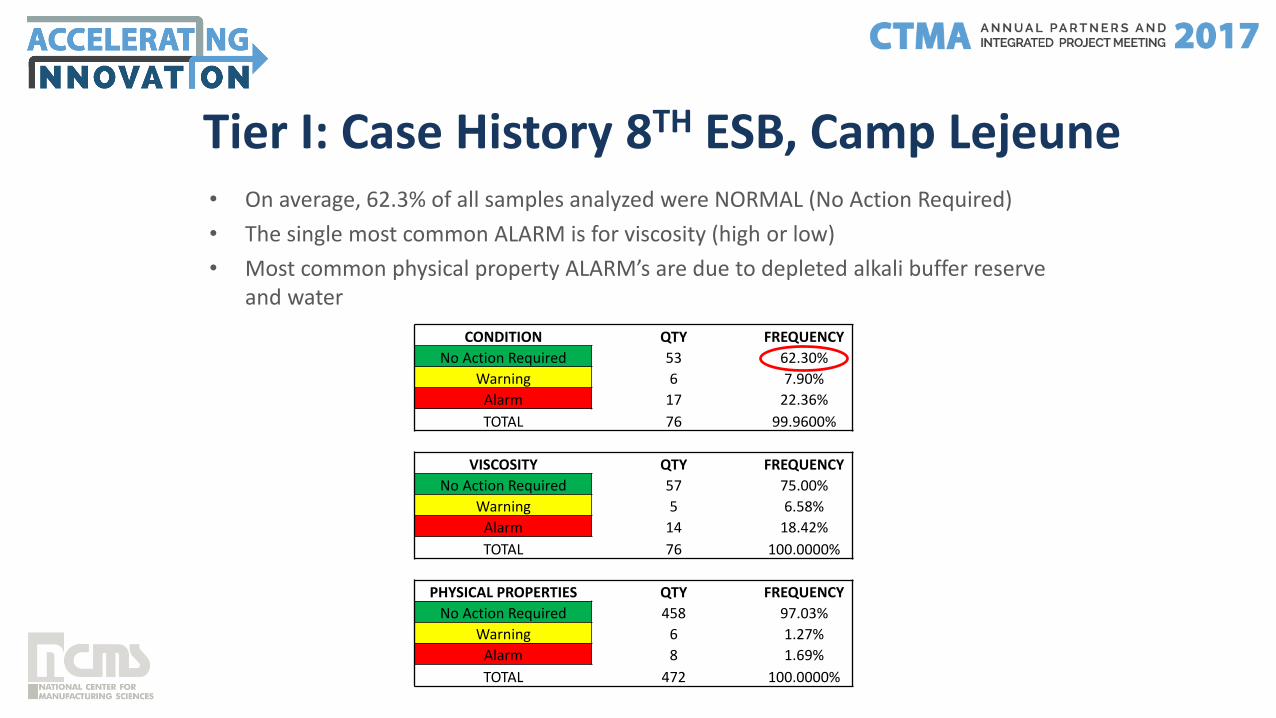
Tier I: Case History 8TH ESB, Camp Lejeune• On average, 62.3% of all samples analyzed were NORMAL (No Action Required)
• The single most common ALARM is for viscosity (high or low)
• Most common physical property ALARM’s are due to depleted alkali buffer reserve and water
CONDITION QTY FREQUENCY
No Action Required 53 62.30%
Warning 6 7.90%
Alarm 17 22.36%
TOTAL 76 99.9600%
VISCOSITY QTY FREQUENCY
No Action Required 57 75.00%
Warning 5 6.58%
Alarm 14 18.42%
TOTAL 76 100.0000%
PHYSICAL PROPERTIES QTY FREQUENCY
No Action Required 458 97.03%
Warning 6 1.27%
Alarm 8 1.69%
TOTAL 472 100.0000%
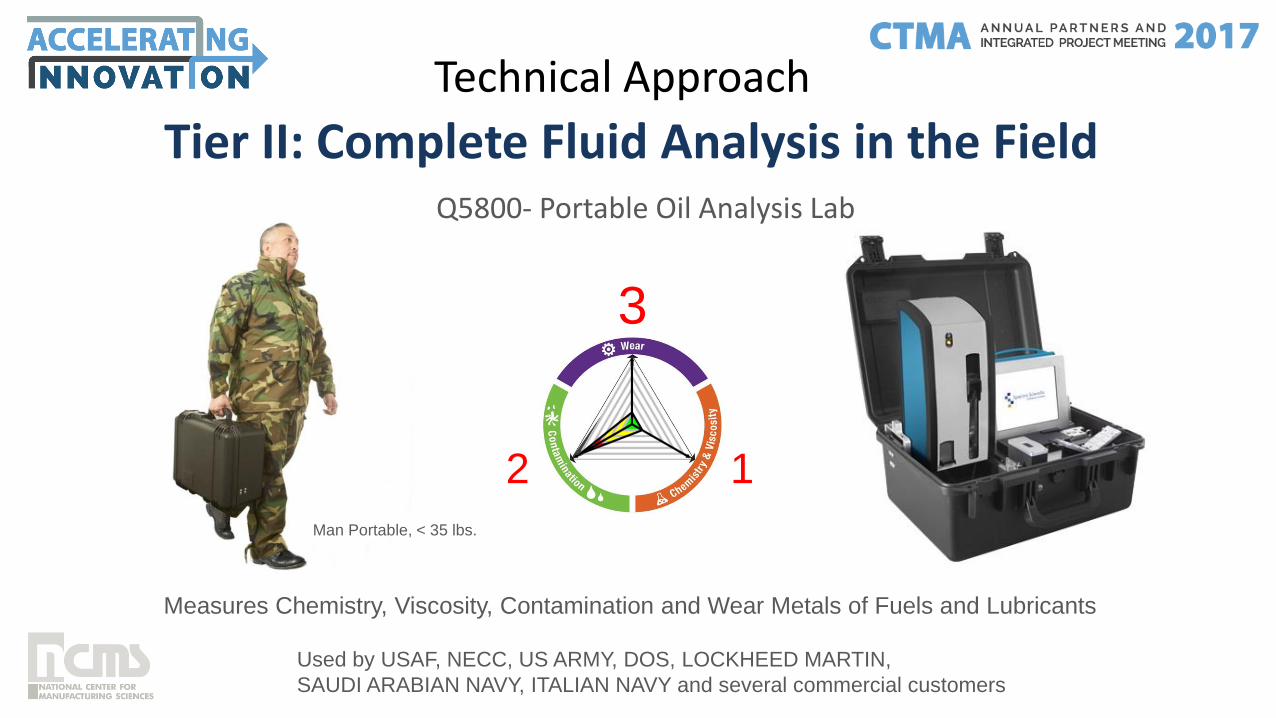
Technical Approach
Tier II: Complete Fluid Analysis in the FieldQ5800- Portable Oil Analysis Lab
Used by USAF, NECC, US ARMY, DOS, LOCKHEED MARTIN,
SAUDI ARABIAN NAVY, ITALIAN NAVY and several commercial customers
Man Portable, < 35 lbs.
Measures Chemistry, Viscosity, Contamination and Wear Metals of Fuels and Lubricants
12
3
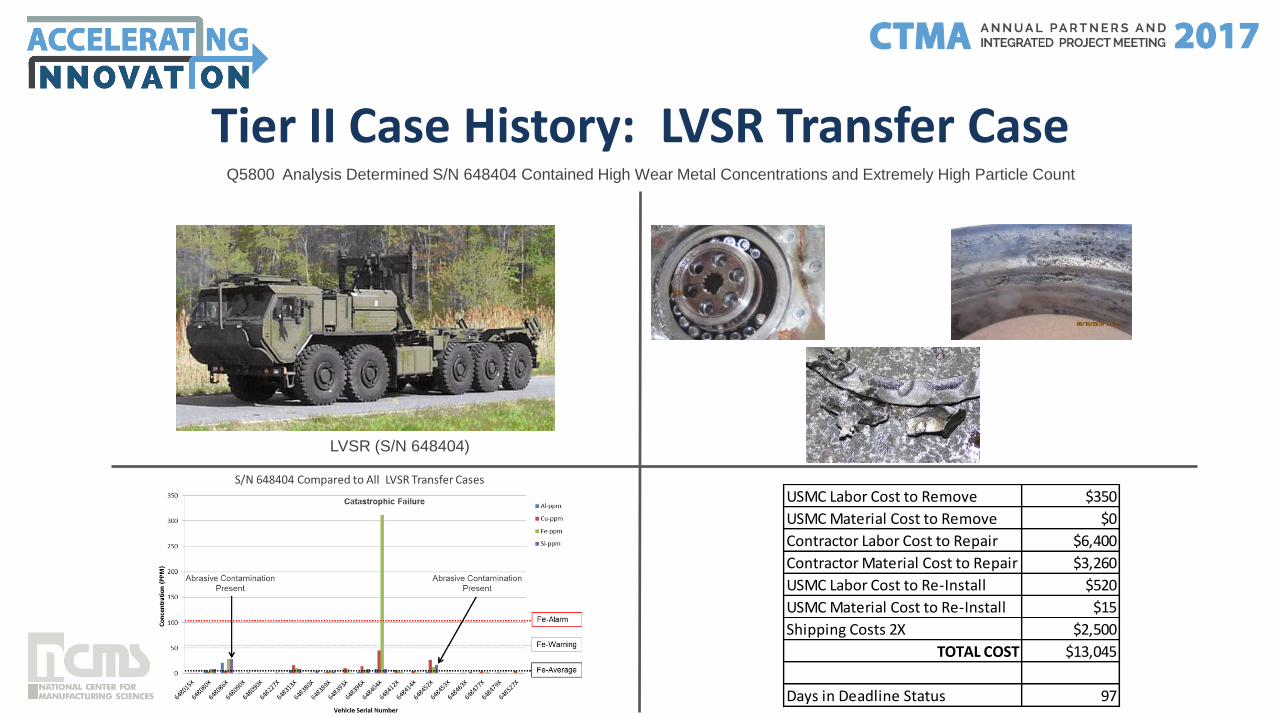
Tier II Case History: LVSR Transfer CaseQ5800 Analysis Determined S/N 648404 Contained High Wear Metal Concentrations and Extremely High Particle Count
LVSR (S/N 648404)
USMC Labor Cost to Remove $350
USMC Material Cost to Remove $0
Contractor Labor Cost to Repair $6,400
Contractor Material Cost to Repair $3,260
USMC Labor Cost to Re-Install $520
USMC Material Cost to Re-Install $15
Shipping Costs 2X $2,500
TOTAL COST $13,045
Days in Deadline Status 97
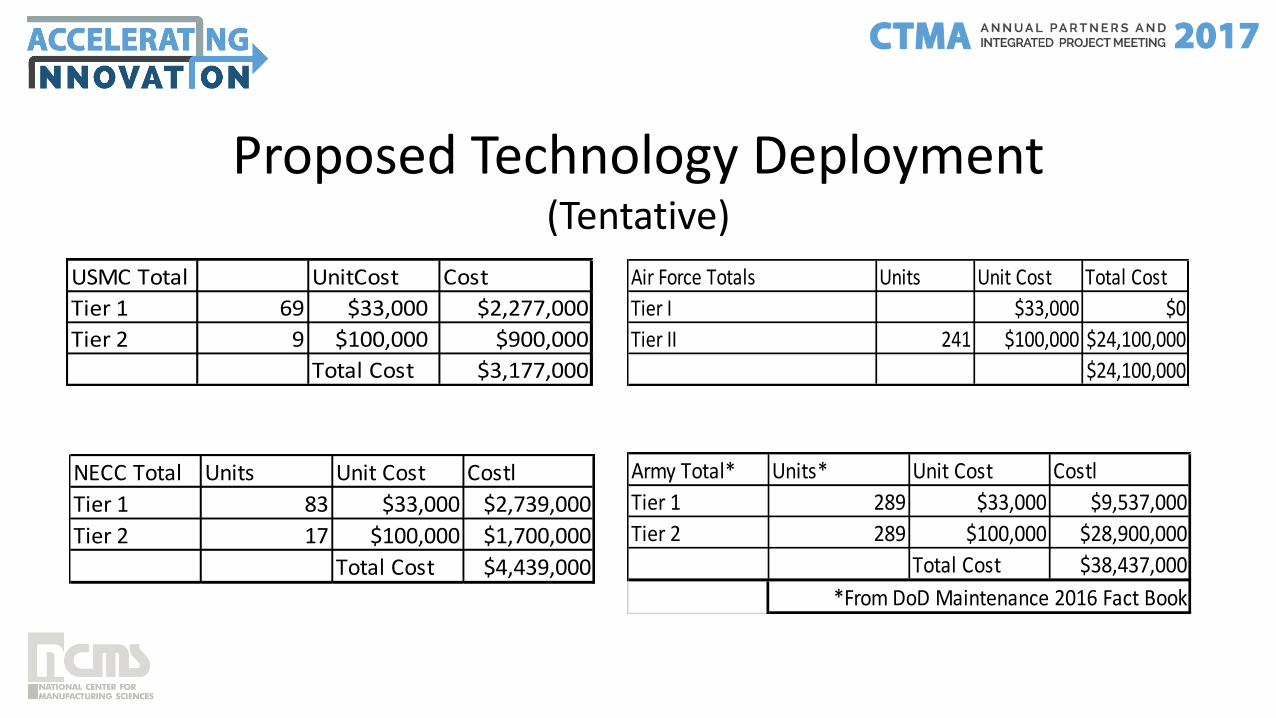
Proposed Technology Deployment(Tentative)
NECC Total Units Unit Cost Costl
Tier 1 83 $33,000 $2,739,000
Tier 2 17 $100,000 $1,700,000
Total Cost $4,439,000
Army Total* Units* Unit Cost Costl
Tier 1 289 $33,000 $9,537,000
Tier 2 289 $100,000 $28,900,000
Total Cost $38,437,000
*From DoD Maintenance 2016 Fact Book
USMC Total UnitCost Cost
Tier 1 69 $33,000 $2,277,000
Tier 2 9 $100,000 $900,000
Total Cost $3,177,000
Air Force Totals Units Unit Cost Total Cost
Tier I $33,000 $0
Tier II 241 $100,000 $24,100,000
$24,100,000
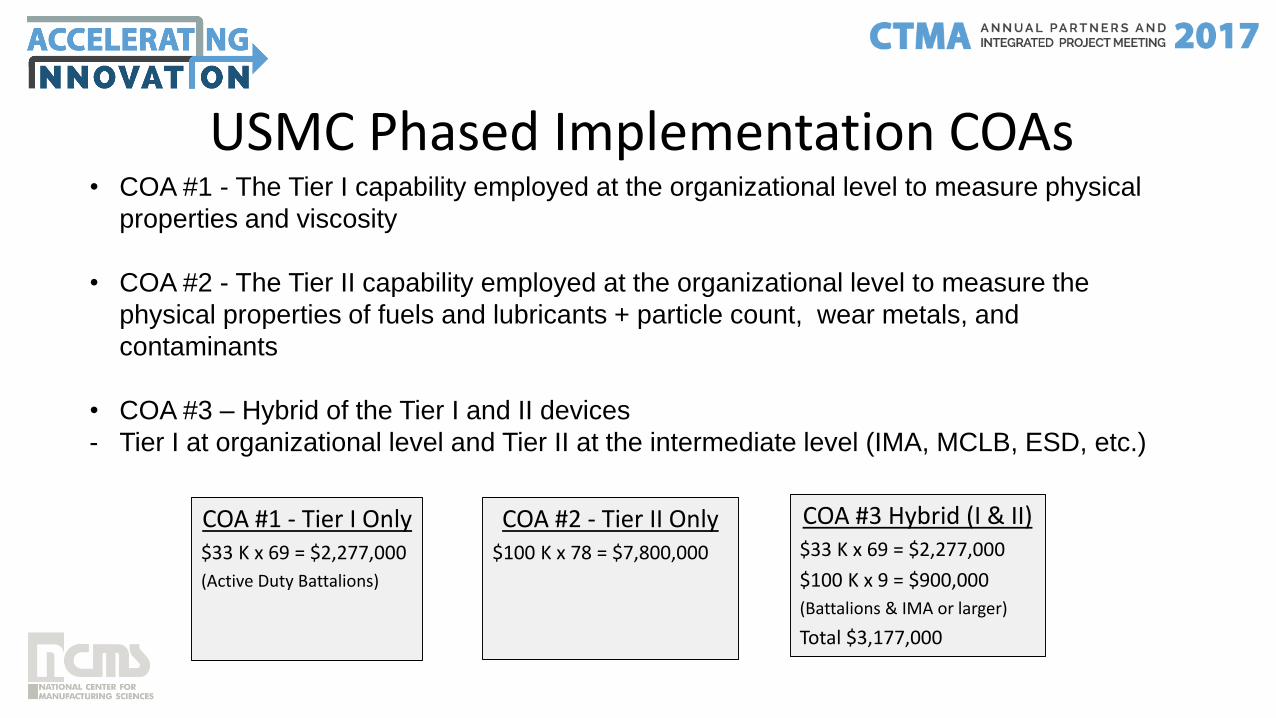
USMC Phased Implementation COAs
COA #1 - Tier I Only$33 K x 69 = $2,277,000
(Active Duty Battalions)
COA #3 Hybrid (I & II)$33 K x 69 = $2,277,000
$100 K x 9 = $900,000
(Battalions & IMA or larger)
Total $3,177,000
COA #2 - Tier II Only$100 K x 78 = $7,800,000
• COA #1 - The Tier I capability employed at the organizational level to measure physical
properties and viscosity
• COA #2 - The Tier II capability employed at the organizational level to measure the
physical properties of fuels and lubricants + particle count, wear metals, and
contaminants
• COA #3 – Hybrid of the Tier I and II devices
- Tier I at organizational level and Tier II at the intermediate level (IMA, MCLB, ESD, etc.)
Project Team Participants
• Government– OSD
– JS J4
– USMC I&L
– Army AMSAA
– Navy Expeditionary Combat Command
• Industry– Spectro Scientific
– Troika Solutions LLC
– National Center for Manufacturing Sciences

QUESTIONS