Embed Size (px)
Citation preview
CMPO Working Paper Series No. 01/030
CMPO is funded by the Leverhulme Trust.
Expenditure on Health Care in the UK:
A review of the issues
Carol Propper
Department of Economics and CMPO University of Bristol,CASE LSE and CEPR
May 2001
AbstractThis review examines the performance of the UK health care system. After presenting data on the leveland distribution of resources, three topics are examined. The first is the lessons from internationalcomparisons of evidence on expenditure, equity and health care outcomes. The second is the lessonsfrom the recent internal market reforms. The third is the lessons from an analysis of the role for privatefinance in UK health care. The review concludes that economists and policy makers need to focus moreattention on the relationship between health care inputs – expenditure – and health outcomes, andwithin this on the incentives facing suppliers and demanders of health care.
JEL Classification: I1, H4
Keywords: Public healthcare expenditure, equity in distribution of health care, health outcomes,international comparisons
AcknowledgementsI would like to thank Olwen Renowlden for data assistance and Simon Burgess for his very helpfuladvice. Funding from the Leverhulme Trust is gratefully acknowledged. Any errors are mine.
Address for CorrespondenceCMPO, Department of EconomicsUniversity of Bristol8 Woodland RoadBristolBS8 [email protected]
Summary
This review examines the performance of the UK health care system. Publicexpenditure on health care in the UK is large. In 2000 just under £50bn was spent bythe state on health care, a sum that accounted for around 6 percent of GDP. On top ofthese large public expenditures, individuals buy health care and pharmaceuticalsdirectly, and private expenditure on health care in the UK totalled about £9bn in 2000.Within the OECD and the G7 group of countries, UK expenditure per capita is lowand the share that is publicly funded high.
This paper reviews key issues in the funding of health care in the UK. It begins with asummary of the recent position of UK and sets this in an international context. It thenfocuses on three topics. The first is the lessons from international comparisons. Thisreflects the debate that other forms of health service organisation may be animprovement on that currently in operation in the UK. The paper examines therelationship between the organisation of the system and three sets of outputs that aremeasures of first, the efficiency of the system, second, the equity of the system andthird, the outcomes of the system. These are expenditure per capita, the distribution ofpayments for, and receipt of, health care resources, and measures of health (healthoutcomes).
The second topic is the lessons from the internal market reforms that wereimplemented in the UK in the early 1990s. These reforms are part of a general movein health care organisation towards increase competition and the review examines theimplications for efficiency.
The third topic is the role for private finance in the funding of UK health care. Thepaper examines the extent of private finance in the UK health care system and theinterrelationships between public and private finance with the aim of deriving theimplications for the evolution of public health care finance in the UK system.
The international comparisons suggest the following. The lower expenditure percapita of the UK can, in part, be attributed to organisation of the health care system.Features of the UK system, such as the use of primary care gatekeepers and budgetsset at a system wide level, appear to keep expenditure below what would be expectedgiven national income. The evidence on equity in finance and delivery indicates thaton the finance side the UK has one of the most progressive systems. On the deliveryside the NHS is not worse, and indeed somewhat better, in terms of equity in the useof health care resources, than several other OECD countries which spend considerablymore per capita on their health care.
On the other hand, the international evidence on expenditure cannot be taken asevidence of efficiency as no adjustment is made for quality. Further, the evidence alsoindicates that that these positive properties of the UK system may not translate intohealth outcomes. The UK has, on some measures, poorer health outcomes than similarcountries and a poorer distribution of health. While these outcomes might be betterthan expected given the level of funding, the fact that little relationship betweenfunding and mortality has been found at cross-country level makes such an inferencesomething of a leap of faith. And the distribution of outcomes appears more related tothe distribution of income than to any measures of health care spending.

What international comparisons also hint at is the importance of incentives at the levelof the supplier and the demander. The funding analyses show the UK use ofgatekeepers (the UK's General Practice system whereby individual's must be referredinto the hospital sector for treatment and diagnosis by their family doctors) andpayment of doctors by salary rather than fee-for-service mean expenditure per capitais lower than it would be with other design features. However, cross-country analysesare generally at a level at which is hard to isolate the impact of such incentives: tounderstand these micro-incentives it is necessary to examine data in which theincentive structures can be more clearly identified.
Examination of responses to the financial incentives embodied in the UK internalmarket reforms indicates that physicians and health care providers do appear torespond to financial incentives in a tax financed, predominantly public providedhealth care system. Referral patterns of GPs reflected financial (and other) rewards.Where competition was stronger, prices appeared to be lower. However, it is alsoclear that responses of agents were limited by the structures established, and theactions taken, by central government to ‘manage the market’.
In terms of the type of finance, the review suggests there are no clear equity groundsfor moving away from tax finance. The present tax financed system is more equitablethan either social insurance or private insurance. On the other hand, there are growingpressures on the NHS, which are reflected in public attitudes. The evidence suggeststhat a marginal extension of private finance will not necessarily erode public supportfor the NHS.
Finally, the review highlights the importance of moving on from a focus on what arebasically inputs - expenditure and its distribution - to an examination of outcomes andthe links between inputs and outputs. The UK appears to meet its equity goals well interms of how it spends public finance, but this is not mirrored by an increase in equityin health outputs. The existence of health inequalities raises the issue that the focus bygovernments on inputs and amounts of money spent is somewhat skewed. Asimportant is a focus on what is being achieved for this money. To assess the extent towhich health outcomes have much to do with expenditure on health care, greaterresearch effort needs to be directed to looking at the impact of expenditure on health.In other words, economists need to direct effort to the study of the efficiency ofproduction. This in turn suggests a greater focus on the responses of suppliers anddemanders to incentives.
2
IntroductionPublic expenditure on health care in the UK is large. In 2000 just under £50bn wasspent by the state on health care, a sum that accounted for around 6 percent of GDP.On top of these large public expenditures, individuals buy health care andpharmaceuticals directly, and private expenditure on health care in the UK totalledabout £9bn in 2000. Nor is high public and private expenditure on health care just aBritish phenomenon. Governments and private individuals throughout the OECDcontribute large sums for health care expenditure. In fact, within the OECD and theG7 group of countries, UK expenditure per capita is low. The UK spends around 7percent of GDP per capita, while the G7 average is 9% and the OECD average is 8%.However, in comparison to both the OECD and G7 countries, the share of expenditureaccounted for by the public sector is high. The UK share is 85 percent, while theaverage for the G7 group is 70% and for the OECD is 75%.
The large scale of public intervention is justified on both efficiency and equitygrounds1, but while it is common for governments to intervene in the market forhealthcare, it is also clear that the form and extent of this intervention variesconsiderably across countries. This raises questions of whether the UK spendssufficient sums of either public or private finance on health care, whether the balancebetween public and private finance is optimal, and whether the way in which thosesums are spent achieves either the efficiency or equity goals of the population. Toanswer such questions is beyond the scope of a single review. Instead this reviewfocuses on a set of topics that are both relevant to current debates about the financingof UK health care and shed light on theses broader questions.
The first topic reflects the debate that other forms of health service organisation maybe an improvement on that currently in operation in the UK. I examine therelationship between the organisation of the system and three sets of outputs that aremeasures of first, the efficiency of the system, second, the equity of the system andthird, the outcomes of the system. These are expenditure per capita, the distribution ofpayments for, and receipt of, health care resources, and measures of health (healthoutcomes). This examination is based on comparison of performance acrosscomparable countries, which has its strength and weaknesses, and are explored below.The second topic examines the lessons from the internal market reforms that wereimplemented in the UK in the early 1990s. These reforms are part of a general movein health care organisation towards increase competition and the review examines theimplications for efficiency. The third topic examines the role for private finance inthe funding of UK health care. I examine the extent of private finance in the UKhealth care system and the interrelationships between public and private finance withthe aim of deriving the implications for the evolution of public health care finance inthe UK system.
The organisation of the paper is as follows. Sections 1 and 2 examine the performanceof the current system. Section 1 presents the trends in health care expenditure in theUK and compares the UK, in terms of financing and organisation of the health caresystem, with other OECD countries. Section 2 presents the performance of the UK
1 See Barr (1998) and Emmerson et al (2000) for a review of both efficiency and equity arguments forgovernment intervention in health care markets
3
system in terms of the distribution of resources. Section 3 presents evidence fromrecent international comparative studies to examine the relationship betweenorganisational design and the performance of the health care system in terms of percapita expenditure. Section 4 examines the relationship between system design andequity in the payment for, and in the receipt of, resources. Section 5 examines therelationship between system design and health outcomes and the distribution of theseoutcomes. Section 6 examines the internal market reforms and Section 7 examines therole of private finance and issues in the dynamics of UK health care expenditure. Thefinal section draws out the lessons for the finance of UK health care expenditure andfor future research.
1. The UK level of expenditure on health care
Trends in UK health care expenditure
UK health care expenditure can be broadly divided into public expenditure, which ismainly spent on the National Health Service, and private expenditure, which isdefined as expenditure by the household and corporate sector on health care(including dentistry and over-the-counter medicines). Estimates of public expenditureare somewhat more reliable than estimates of private expenditure, but whicheverestimates are used, the bulk of expenditure in the UK (around 85 percent in 2000) ispublic.
Figure 1 presents real spending on the NHS as a proportion of GDP from 1960 to1999. The chart shows that the share of the NHS in national income has grown fromunder 3.5 to just under 6 percent in 40 years. But it is also clear that this increase hasnot been constant and that there have been years in which the share has fallen, to bethen followed years in which expenditure has increased faster than the long run trend.Figure 2 presents the percentage year on year increase in real NHS expenditure. Thisshows considerable variation around the average of 3.4 percent annual growth for theperiod. There were periods of negative growth during the mid 1950s, the early andlate 1970s, and there have been periodic large increases of a size comparable to, oreven slightly larger than the settlements made by the Labour Administration for 2000to 2001 and forecast through to 2004.
Figure 3 presents private expenditure as a share of GDP. The scale indicates thesmaller share of private expenditure and the graph also shows that private spendingremained small, and indeed even fell upto the mid-1970s. Figure 4 presents thepercentage growth year-on-year in private expenditure in real terms and the large fallsfirst in the mid-1960s, and then again in the mid-70s are apparent. The 1980s show apattern of strong growth, but this tailed off during the early 1990s, and there has beenconsiderable volatility in growth rates in the second half of the 1990s. Figure 5presents private expenditure as a percentage of total expenditure on healthcare from1960 to 1999. This shows that the share that was private rose in the early 1960s, fellfrom a peak in 1964 to a low in 1976, rose again upto 1991, then fell as NHSexpenditure increased rapidly with the advent of the internal market in 1991, and thenrose from 1994 to 1997 and then fell again in the late 1990s.
In summary, the picture that emerges is one of long run growth in both public andprivate expenditure, but around this long run trend, of considerable year on year
4
volatility in both public and private annual growth rates, and also in the share that isprivate.
The UK compared
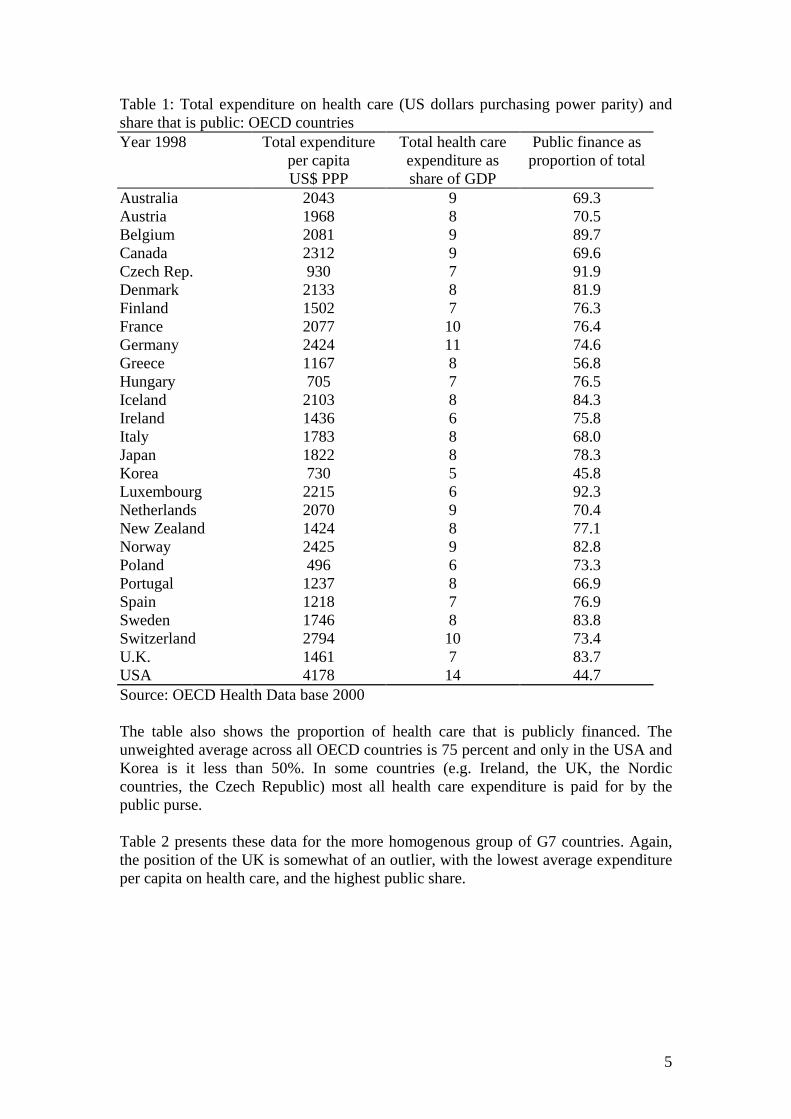
Tables 1 and 2 present the UK's position, in terms of total expenditure and the sharethat is public, in comparison to two groups of countries - the OECD and the G7countries, The table indicates substantial differences in the level of health expenditureacross countries, even within the relatively homogenous industrialised countries of theOECD. Table 1 illustrates health expenditure per capita as measured in purchasingpower parities in the OECD. In 1997 these ranged from less than $1000 (e.g. Hungaryand Korea) to more than $2,500 (Switzerland $2794 and the United States $4178)2.Within these countries the position of the UK is towards the bottom end. There isalso a range in the share that health expenditure accounts for in GDP. The highestshare is in the US, the lowest in Korea. Again the position of the UK is near thebottom of the OECD group.
2 In comparison, in low-income countries these amounts are much smaller - $10 per capita in manyAfrican countries, and less than $100 per capita in most of Asia and Latin America. The share in GDPis also smaller.
5
Table 1: Total expenditure on health care (US dollars purchasing power parity) andshare that is public: OECD countriesYear 1998 Total expenditure
per capitaUS$ PPP
Total health careexpenditure asshare of GDP
Public finance asproportion of total
Australia 2043 9 69.3Austria 1968 8 70.5Belgium 2081 9 89.7Canada 2312 9 69.6Czech Rep. 930 7 91.9Denmark 2133 8 81.9Finland 1502 7 76.3France 2077 10 76.4Germany 2424 11 74.6Greece 1167 8 56.8Hungary 705 7 76.5Iceland 2103 8 84.3Ireland 1436 6 75.8Italy 1783 8 68.0Japan 1822 8 78.3Korea 730 5 45.8Luxembourg 2215 6 92.3Netherlands 2070 9 70.4New Zealand 1424 8 77.1Norway 2425 9 82.8Poland 496 6 73.3Portugal 1237 8 66.9Spain 1218 7 76.9Sweden 1746 8 83.8Switzerland 2794 10 73.4U.K. 1461 7 83.7USA 4178 14 44.7Source: OECD Health Data base 2000
The table also shows the proportion of health care that is publicly financed. Theunweighted average across all OECD countries is 75 percent and only in the USA andKorea is it less than 50%. In some countries (e.g. Ireland, the UK, the Nordiccountries, the Czech Republic) most all health care expenditure is paid for by thepublic purse.
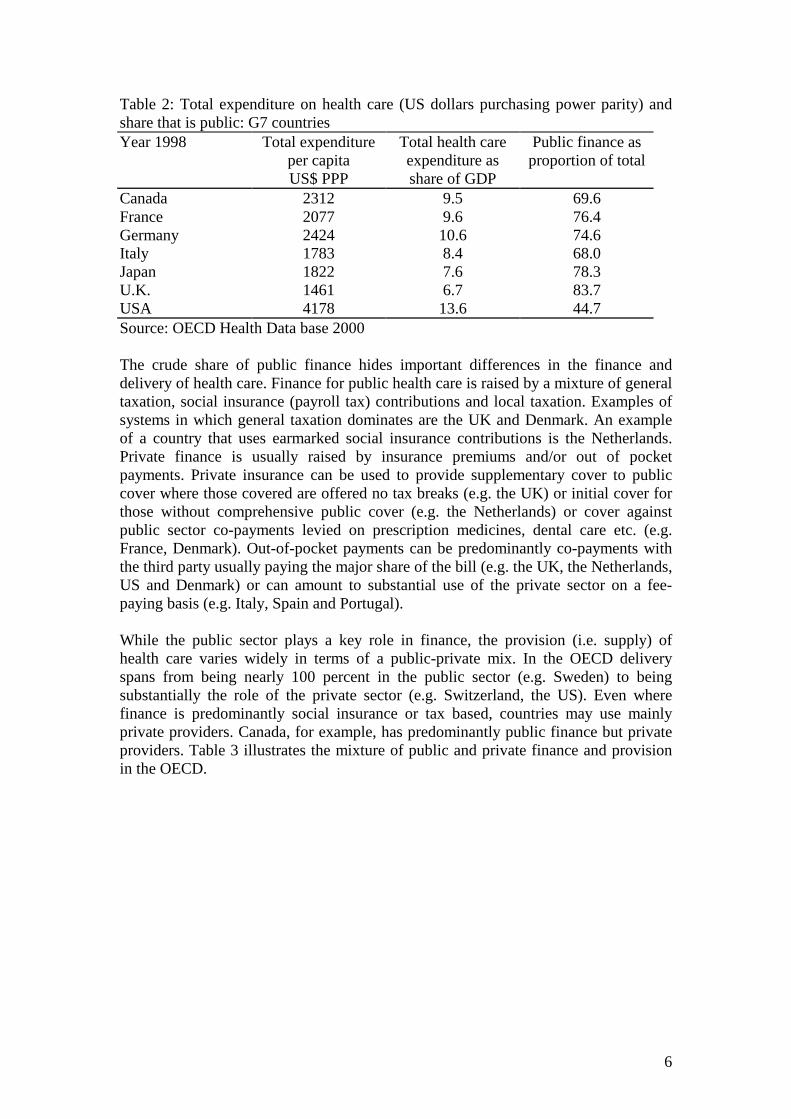
Table 2 presents these data for the more homogenous group of G7 countries. Again,the position of the UK is somewhat of an outlier, with the lowest average expenditureper capita on health care, and the highest public share.
6
Table 2: Total expenditure on health care (US dollars purchasing power parity) andshare that is public: G7 countriesYear 1998 Total expenditure
per capitaUS$ PPP
Total health careexpenditure asshare of GDP
Public finance asproportion of total
Canada 2312 9.5 69.6France 2077 9.6 76.4Germany 2424 10.6 74.6Italy 1783 8.4 68.0Japan 1822 7.6 78.3U.K. 1461 6.7 83.7USA 4178 13.6 44.7Source: OECD Health Data base 2000
The crude share of public finance hides important differences in the finance anddelivery of health care. Finance for public health care is raised by a mixture of generaltaxation, social insurance (payroll tax) contributions and local taxation. Examples ofsystems in which general taxation dominates are the UK and Denmark. An exampleof a country that uses earmarked social insurance contributions is the Netherlands.Private finance is usually raised by insurance premiums and/or out of pocketpayments. Private insurance can be used to provide supplementary cover to publiccover where those covered are offered no tax breaks (e.g. the UK) or initial cover forthose without comprehensive public cover (e.g. the Netherlands) or cover againstpublic sector co-payments levied on prescription medicines, dental care etc. (e.g.France, Denmark). Out-of-pocket payments can be predominantly co-payments withthe third party usually paying the major share of the bill (e.g. the UK, the Netherlands,US and Denmark) or can amount to substantial use of the private sector on a fee-paying basis (e.g. Italy, Spain and Portugal).
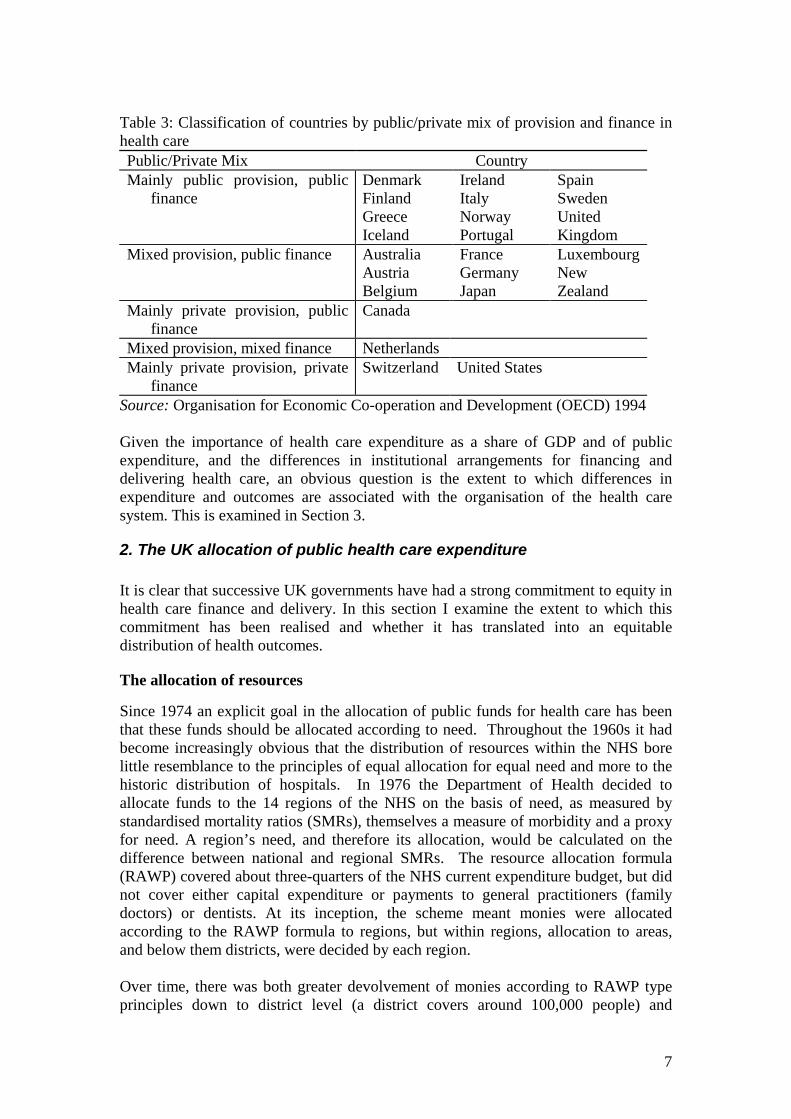
While the public sector plays a key role in finance, the provision (i.e. supply) ofhealth care varies widely in terms of a public-private mix. In the OECD deliveryspans from being nearly 100 percent in the public sector (e.g. Sweden) to beingsubstantially the role of the private sector (e.g. Switzerland, the US). Even wherefinance is predominantly social insurance or tax based, countries may use mainlyprivate providers. Canada, for example, has predominantly public finance but privateproviders. Table 3 illustrates the mixture of public and private finance and provisionin the OECD.
7
Table 3: Classification of countries by public/private mix of provision and finance inhealth carePublic/Private Mix CountryMainly public provision, public
financeDenmarkFinlandGreeceIceland
IrelandItalyNorwayPortugal
SpainSwedenUnitedKingdom
Mixed provision, public finance AustraliaAustriaBelgium
FranceGermanyJapan
LuxembourgNewZealand
Mainly private provision, publicfinance
Canada
Mixed provision, mixed finance NetherlandsMainly private provision, private
financeSwitzerland United States
Source: Organisation for Economic Co-operation and Development (OECD) 1994
Given the importance of health care expenditure as a share of GDP and of publicexpenditure, and the differences in institutional arrangements for financing anddelivering health care, an obvious question is the extent to which differences inexpenditure and outcomes are associated with the organisation of the health caresystem. This is examined in Section 3.
2. The UK allocation of public health care expenditure
It is clear that successive UK governments have had a strong commitment to equity inhealth care finance and delivery. In this section I examine the extent to which thiscommitment has been realised and whether it has translated into an equitabledistribution of health outcomes.
The allocation of resources
Since 1974 an explicit goal in the allocation of public funds for health care has beenthat these funds should be allocated according to need. Throughout the 1960s it hadbecome increasingly obvious that the distribution of resources within the NHS borelittle resemblance to the principles of equal allocation for equal need and more to thehistoric distribution of hospitals. In 1976 the Department of Health decided toallocate funds to the 14 regions of the NHS on the basis of need, as measured bystandardised mortality ratios (SMRs), themselves a measure of morbidity and a proxyfor need. A region’s need, and therefore its allocation, would be calculated on thedifference between national and regional SMRs. The resource allocation formula(RAWP) covered about three-quarters of the NHS current expenditure budget, but didnot cover either capital expenditure or payments to general practitioners (familydoctors) or dentists. At its inception, the scheme meant monies were allocatedaccording to the RAWP formula to regions, but within regions, allocation to areas,and below them districts, were decided by each region.
Over time, there was both greater devolvement of monies according to RAWP typeprinciples down to district level (a district covers around 100,000 people) and
8
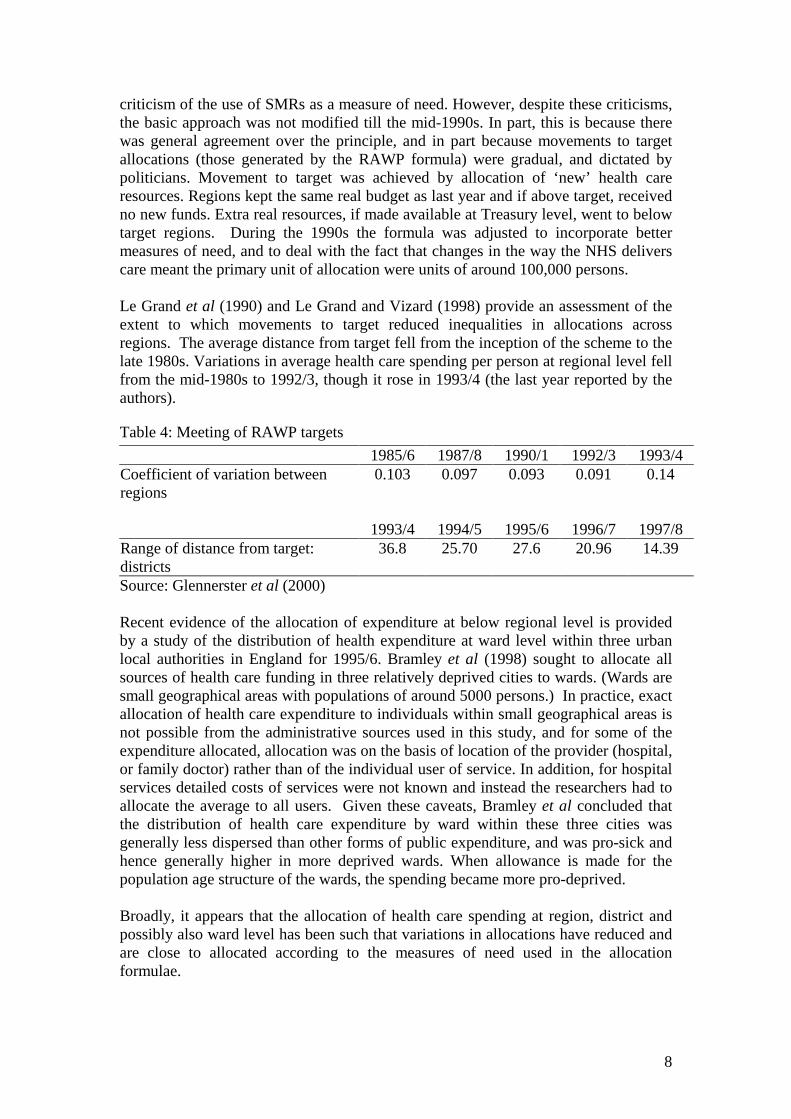
criticism of the use of SMRs as a measure of need. However, despite these criticisms,the basic approach was not modified till the mid-1990s. In part, this is because therewas general agreement over the principle, and in part because movements to targetallocations (those generated by the RAWP formula) were gradual, and dictated bypoliticians. Movement to target was achieved by allocation of ‘new’ health careresources. Regions kept the same real budget as last year and if above target, receivedno new funds. Extra real resources, if made available at Treasury level, went to belowtarget regions. During the 1990s the formula was adjusted to incorporate bettermeasures of need, and to deal with the fact that changes in the way the NHS deliverscare meant the primary unit of allocation were units of around 100,000 persons.
Le Grand et al (1990) and Le Grand and Vizard (1998) provide an assessment of theextent to which movements to target reduced inequalities in allocations acrossregions. The average distance from target fell from the inception of the scheme to thelate 1980s. Variations in average health care spending per person at regional level fellfrom the mid-1980s to 1992/3, though it rose in 1993/4 (the last year reported by theauthors).
Table 4: Meeting of RAWP targets1985/6 1987/8 1990/1 1992/3 1993/4
Coefficient of variation betweenregions
0.103 0.097 0.093 0.091 0.14
1993/4 1994/5 1995/6 1996/7 1997/8Range of distance from target:districts
36.8 25.70 27.6 20.96 14.39
Source: Glennerster et al (2000)
Recent evidence of the allocation of expenditure at below regional level is providedby a study of the distribution of health expenditure at ward level within three urbanlocal authorities in England for 1995/6. Bramley et al (1998) sought to allocate allsources of health care funding in three relatively deprived cities to wards. (Wards aresmall geographical areas with populations of around 5000 persons.) In practice, exactallocation of health care expenditure to individuals within small geographical areas isnot possible from the administrative sources used in this study, and for some of theexpenditure allocated, allocation was on the basis of location of the provider (hospital,or family doctor) rather than of the individual user of service. In addition, for hospitalservices detailed costs of services were not known and instead the researchers had toallocate the average to all users. Given these caveats, Bramley et al concluded thatthe distribution of health care expenditure by ward within these three cities wasgenerally less dispersed than other forms of public expenditure, and was pro-sick andhence generally higher in more deprived wards. When allowance is made for thepopulation age structure of the wards, the spending became more pro-deprived.
Broadly, it appears that the allocation of health care spending at region, district andpossibly also ward level has been such that variations in allocations have reduced andare close to allocated according to the measures of need used in the allocationformulae.
9
The receipt of health care
Equity in the geographical distribution of resources does not necessarily imply equityin the distribution of health care across individuals of different incomes. In a series ofstudies, Propper and her co-authors have examined equity in the delivery of healthcare standardised for medical need. These studies estimate the extent to whichviolations of the principle 'equal treatment for equal need' are systematically related toincome in the UK. The studies use individual level data from household surveys thatcontain data on individuals’ access to resources, their use of health care services andtheir self-reported health status. Answers to the self-assessed health questions havebeen found to be good predictors of subsequent mortality in a variety of industrialisedcountries. Individual's incomes are defined as their equivalised household income.Medical need is defined as self assessed health, and various measures of this are used.Several forms of care (GP care, outpatient care, and in hospital care) are examined.The approach of using data on users and non-users contrasts with many other studiesof equity in the allocation of health care which have looked at only users of healthcare (Propper, 1998, reviews these).
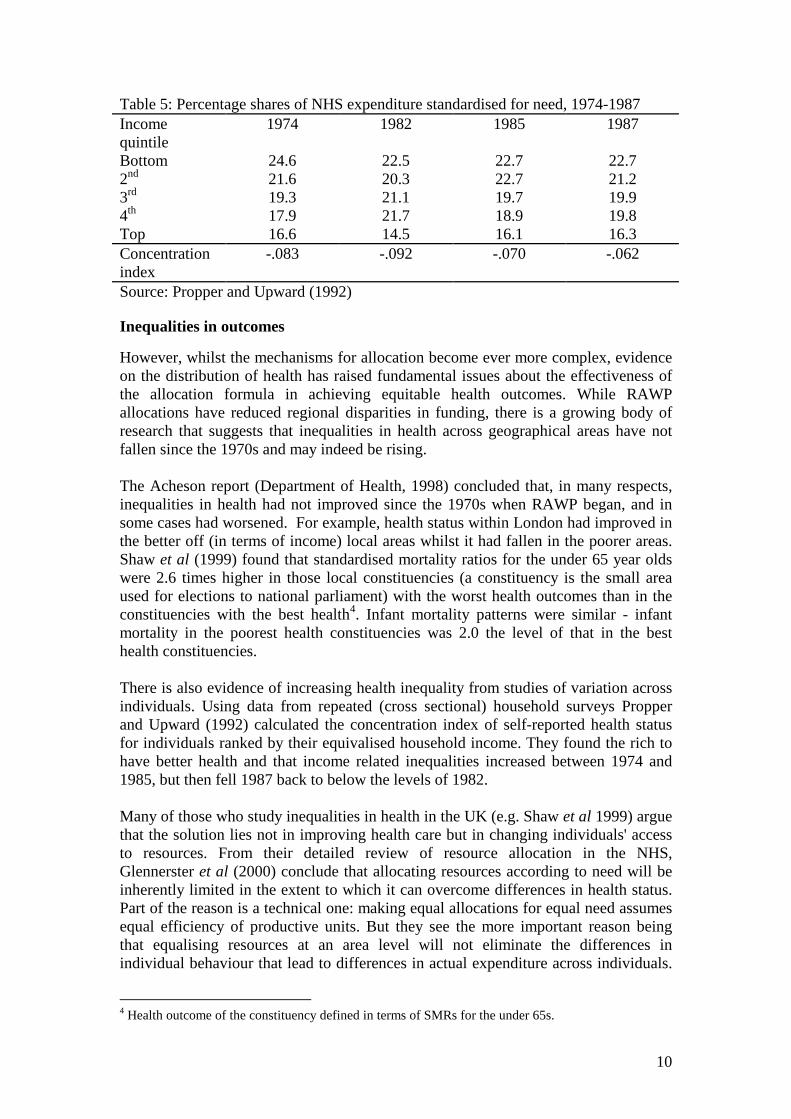
O’Donnell and Propper (1991) examine whether there are departures from ‘equaltreatment for equal need’ that are systematically related to income using data from themid-1980s and conclude that the distribution of NHS care is weakly pro-poor.Propper and Upward (1992) examine the distribution of health care utilisationstandardised for need by income group for the UK for the years 1974, 1982, 1985 and1987. These results are presented in Table 5. The columns present the share of NHSexpenditure received by each income quintile after standardising for self reportedmorbidity. In 1974 the lowest income quintile received nearly 25 per cent of totalNHS standardised expenditure. The comparable figure in 1987 was just under 23 percent. The last line in each column presents the concentration index. This is a measureof the departure of the cell averages from proportionality and is a measure of thedeparture from equal treatment for equal need. The index that ranges from -1 to +1where a negative (positive) number indicates pro-poor (pro-rich) inequity3. Theresults indicate a mildly pro-poor distribution in all four years. Propper (1998) found asimilar distribution for 1991 and 1994.
3 For details of the methodology see van Doorslaer and Wagstaff (1992) and van Doorslaer et al(2000).
10
Table 5: Percentage shares of NHS expenditure standardised for need, 1974-1987Incomequintile
1974 1982 1985 1987
Bottom 24.6 22.5 22.7 22.72nd 21.6 20.3 22.7 21.23rd 19.3 21.1 19.7 19.94th 17.9 21.7 18.9 19.8Top 16.6 14.5 16.1 16.3Concentrationindex
-.083 -.092 -.070 -.062
Source: Propper and Upward (1992)
Inequalities in outcomes
However, whilst the mechanisms for allocation become ever more complex, evidenceon the distribution of health has raised fundamental issues about the effectiveness ofthe allocation formula in achieving equitable health outcomes. While RAWPallocations have reduced regional disparities in funding, there is a growing body ofresearch that suggests that inequalities in health across geographical areas have notfallen since the 1970s and may indeed be rising.
The Acheson report (Department of Health, 1998) concluded that, in many respects,inequalities in health had not improved since the 1970s when RAWP began, and insome cases had worsened. For example, health status within London had improved inthe better off (in terms of income) local areas whilst it had fallen in the poorer areas.Shaw et al (1999) found that standardised mortality ratios for the under 65 year oldswere 2.6 times higher in those local constituencies (a constituency is the small areaused for elections to national parliament) with the worst health outcomes than in theconstituencies with the best health4. Infant mortality patterns were similar - infantmortality in the poorest health constituencies was 2.0 the level of that in the besthealth constituencies.
There is also evidence of increasing health inequality from studies of variation acrossindividuals. Using data from repeated (cross sectional) household surveys Propperand Upward (1992) calculated the concentration index of self-reported health statusfor individuals ranked by their equivalised household income. They found the rich tohave better health and that income related inequalities increased between 1974 and1985, but then fell 1987 back to below the levels of 1982.
Many of those who study inequalities in health in the UK (e.g. Shaw et al 1999) arguethat the solution lies not in improving health care but in changing individuals' accessto resources. From their detailed review of resource allocation in the NHS,Glennerster et al (2000) conclude that allocating resources according to need will beinherently limited in the extent to which it can overcome differences in health status.Part of the reason is a technical one: making equal allocations for equal need assumesequal efficiency of productive units. But they see the more important reason beingthat equalising resources at an area level will not eliminate the differences inindividual behaviour that lead to differences in actual expenditure across individuals.
4 Health outcome of the constituency defined in terms of SMRs for the under 65s.
11
The problem is compounded by the well-known fact that variations in health seem tobe largely determined by factors outside of the health care system, some well known,and others less so5.
3. Does the organisation of the health care system determineexpenditure?
International comparisons have been used to attempt to answer questions such as doesthe overall organisation of the health care system have any impact on healthexpenditure, does the use of a gatekeeper to the hospital sector result in lowerexpenditure, does the method of remunerating doctors affect expenditure, and doincreases in the supply of doctors result in increases in health expenditure? Suchinternational comparisons have also examined the impact of income and ofdemographic factors on total expenditure.
These international comparisons tend to be beset by several problems (Gerdtham andJonsson 2000). The first is the weak theoretical base for the determinants of aggregatehealth expenditure. There is no clearly accepted model for the macroeconomicanalysis of health expenditure. Few of the estimated models make clear the causalrelationships between aggregate expenditure and the organisation of the health caresector. The importance of the physician as the agent for the patient and the keysupplier of health care, the fact that health services are often provided on the basis of‘need’ rather than willingness to pay, the use of non-price rationing (e.g. waiting lists)make the usual separation of demand from supply difficult. Second, the data may varyin its reliability. It can be difficult to capture the precise institutional details of ahealth care system. It can be difficult, for example, to determine which expendituresto include in health care when the same care may be covered in different countries byeither the social security system, the health sector or the social services sector (anobvious example being care for the elderly). The specifics of the health care sectorwithin countries means that classification of financing and delivery systems can oftenbe somewhat arbitrary. For example, variables representing the public fraction ofhealth care expenditure, the use of high cost procedures, the type of reimbursementsystem are often only approximations to the underlying influences of interest. Thedistinctions between institutional arrangements of different countries are usuallycaptured by the use of dummy variables, but this means they often cannot bedistinguished from country effects. Third, many of the extant studies rely on fairlysmall samples, and increasing the sample size increases the heterogeneity of thesample. Fourth, many of the estimates have not incorporated dynamics, even thoughobserved differences in health expenditure are likely to be the result of bothpermanent and transitory differences6.
Given these problems it is perhaps not surprising that relatively few robust resultsemerge from cross-country comparisons of the determinants of health careexpenditure. A recent survey (Gertham and Jonsson 2000) concluded that results 5 In one of the few studies of variation in expenditure across a reasonably homogenous population,Cremieux et al (1999) found a positive association between expenditure on health care and better lifeexpectancy and lower infant mortality across Canadian provinces.6 One commentator on early studies in this area concluded “We have had crude data, misspecifiedequations, contentious theory and cavalier history” (Culyer, quoted in Gertham and Jonsson, 2000).

12
must be treated with caution, but identified the following results. With respect to thenon-institutional variables (those factors that are not features of the health carefinancing and delivery system) a common and extremely robust finding is that theeffect of per capita income on expenditure is positive and often close to unity. On theother hand, the population age structure is generally insignificant. Institutionalfeatures appear to have the following impact on expenditure. The use of primary caregatekeepers, the use of direct patient payment for care followed by re-imbursementfrom a public or private insurer, the use of capitation payments for physicians in theambulatory sector, the public provision of health services (proxied by the ratio ofpublic beds to total beds) are all associated with lower health expenditures. Use of in-patient expenditure is associated with higher health care expenditures. Evidence onother features of the health care system, for example, the use of budget ceilings oninpatient care, and whether doctors are salaried or paid on a fee-for-service basis, isless clear cut.
These results indicate that both income and institutional factors determine health careexpenditure, suggesting that as countries grow, so will their health care expenditure,but the extent of growth will be determined by the precise nature of the health caresystem. Looked at another way, these studies point to the importance of micro-incentives - incentives at the level of the supplier and the demander of health care.These issues are discussed in more detail below for the UK.
While these studies give some indication of the features of a health care system thatmay matter, two further caveats need to be borne in mind. The first is that cross-country studies to date have examined expenditure, and not efficiency. Whilstgovernments may be concerned with expenditure and expenditure growth, the realissue that is important for the design of health care systems is efficiency. However,without a way of adjusting expenditure for quality, efficiency cannot be measured. Itis argued that this focus on expenditure distorts international comparisons. Forexample, it is argued that looking at expenditure only ignores the costs imposed bywaiting lists that tend to be used in countries that have lower expenditure per capita,and so erroneously equates higher expenditure with inefficiency7. More generally, theposition of the USA as an outlier with both high expenditure and higher (unmeasured)quality means that results are often not robust to leaving the USA out of the analysis.
Second, none of these studies have fully addressed the issue that the organisationalform and financing of health care expenditure are endogenous. For example,centralised control of, or influence on health budgets, is itself a response to lowincome, budget deficits and a desire to control costs. Such endogeneity will bias theestimates of the coefficients on the institutional design factors in the estimates.Finally, even income may not be exogenous in the long run, as the level of health careaffects productivity.
Age and expenditure
Perhaps one surprising result from the studies is the lack of the impact of age or ofother measures of need (e.g. unemployment) on health care expenditures. The impactof ageing on government expenditure has been a major concern for both governmentsand academic writers (e.g. Bos and von Weisacker 1989). Severe consequences were 7 For an example of this argument see Danzon (1992)
13
expected for the health care sector, when population aging was argued to be the causeof rises in government expenditure upto the mid 1980s (OECD 1988)8.
However, recent analyses of cross-country expenditure data have concluded that theage effect is correlated with income (richer countries in the sample have olderpopulations) and show that, holding constant for income, age per se has little effect.Recent analysis of country specific micro data on health care expenditure dataindicates expenditures on health care are concentrated in the last few months of life.An analysis of micro data for a sample of Swiss individuals in the last eight quartersof life during the period 1983-1992 (Zweifel et al 1999) indicate that the amount ofhealth care expenditure depends on remaining lifetimes but not on calendar age, atleast for those over 65. From this Zweifel et al infer that the positive relationshipbetween age and health care expenditure that can be observed in cross sectional datamay be caused by the fact that at age 80, for example, there are many moreindividuals living in their last 2 years than at age 65. The impact of ageing will thusbe to push the high levels of health care expenditure to later in individual’s livesrather than to increase per capita expenditure.
Cutler and co-authors (Cutler and Meara 1999, 1998, Cutler and Sheiner 1999) havecarried out detailed analysis of the relationship between ageing and health using dataon health care expenditures in the US under the Medicare programme for elderlypersons. Cutler and Meara (1999) analyse the increase in Medicare spending duringthe 1980s and 1990s. During these decades, Medicare spending has doubled in realterms despite the fact that the health of Medicare beneficiaries improved over theperiod. In attempting to reconcile these two facts, they show that most of the growthhas been amongst the oldest old. Between 1985 and 1995 spending among those ages65-69 rose by 2 percent annually. In contrast, spending for those over 85 rose by 4percent. However, the source of this increase is not increased use of acute care (forwhich the growth rate amongst the young elderly is in fact higher than for the oldelderly) but increased use of post-acute services.
They speculate that this increase in use might reflect three factors. The first is‘gaming’ in response to the reimbursement mechanisms used in Medicare. Inpatientcare is reimbursed prospectively, so hospitals receive the same payment regardless ofwhether they provide rehabilitative care or not. However, post-acute care isreimbursed on a cost basis when services are used. So if hospitals unbundle the postacute care from the inpatient setting, they collect additional revenues at no extra cost.The second factor is that some of the additional services might reflect real extraservices, perhaps substituting for care previously provided by a family member.Getting reimbursement for such care was made easier in the late 1980s. Finally,Culter and Meara argue some of the increase in expenditure might be fraud. Theirdata mean they are unable to establish the relative strength of these factors.
This analysis illustrates the importance of the interaction of demography, healthstatus, and the institutional arrangements for reimbursement and delivery of care.Ageing per se does not necessarily mean that individuals are more in need of healthcare: in fact, in the US data at least, older groups are healthier than in the past.However, even though healthier they use more resources. This is in part due to
8 Emmerson et al (2000) contains projections of the impact of aging on expenditure for the UK.
14
changes in family choice (dues to changes in taste and in income) and the availabilityof better rehabilitation care, but is also due to the particular nature of thereimbursement arrangements for publicly funded care in the US. In other words, againthe literature points to the importance of micro-incentives and the responses of agentsto these incentives in determining the level and composition of expenditure.
It is also possible that that the impact of age will be affected by endogenousgovernment budgetary responses. Getzen (1992) found no empirical relationshipbetween ageing and expenditure and argued (as an ad hoc justification of his findings)that during the 1980s the existence of budget deficits meant that governments acted todamp down the increased demand that arose from an ageing population. He concludedtherefore that aging per se did not automatically mean greater health care expenditure:the effect would depend on the overall fiscal position of the government. Thiscontention remains to be tested.
4. Does the organisation of the health care system determine equity?
There is considerable evidence that policy makers within OECD countries areconcerned about equity in health care. As shown in Table 1, the share of the state inhealth care expenditure is high, and many countries have achieved close to universalcoverage of their population for the majority of health care services (OECD 1993).
The simple share of public finance in total health care expenditure hides the fact thatOECD countries finance their health care though a mixture of taxes, social insurancecontributions, private insurance premiums and direct payments at point of use (knownas out-of-pocket payments). These various different payment sources have verydifferent implications for both vertical and horizontal equity in the payment for healthcare, and may also have an impact on equity in the receipt of health care.
Equity in the finance of health care
Wagstaff et al (1999) examine the progressivity of the health care financing system in12 OECD countries. Progressivity is measured using the Kakwani index, which isequal to the difference between the concentration index for payments and the Ginicoefficient for gross (i.e. pre health care payment) income. This index measuresdepartures from proportionality. A zero value of this index indicates proportionality inpayments (i.e. all individuals pay the same proportion of their income for health care),and a negative (positive) value indicates a progressive (regressive) structure. Indiceswere calculated for the five sources of payment for health care: direct taxes, indirecttaxes, social insurance, private insurance and direct payments. Indices for total taxes(direct and indirect), total public (taxes plus social insurance), total private and totalexpenditures were computed as weighted averages of the relevant separate indices.
The results indicate that direct taxes used to finance health care are progressive. Thisis particularly true in the UK, Ireland and Germany, but less true in Sweden andFinland where a relatively high share of direct taxation for health care finance comesfrom local income taxes which are less progressive than national taxation. Indirecttaxes are regressive in all of the countries in the study. Social insurance is generallyprogressive, apart from Netherlands and Germany, where higher income groups areexcluded from the social insurance schemes used to finance health care. The
15
progressivity of private insurance depends upon what private insurance buys. Incountries where private insurance buys cover against public sector co-payments (e.g.Denmark and France) progressivity is lower where co-payments are higher (becausepoorer individuals spend a higher proportion of their income on insurance against co-payments). In countries where private insurance is taken out as supplementary tocover (often 'double' cover) provided by the state (e.g. Italy, the UK, Portugal andSpain) insurance is generally progressive. This is because richer individuals are thosewho pay for cover twice. Where insurance is the sole form of cover for the majority ofthe population (the US, Switzerland) it is highly regressive. Where it is the sole formof cover for richer individuals (Germany, the Netherlands) it is progressive. Finally,out-of-pocket payments are generally a highly regressive means of raising revenue,though their regressivity varies across countries, reflecting the differences acrosscountries in exemptions from out-of-pocket payments.
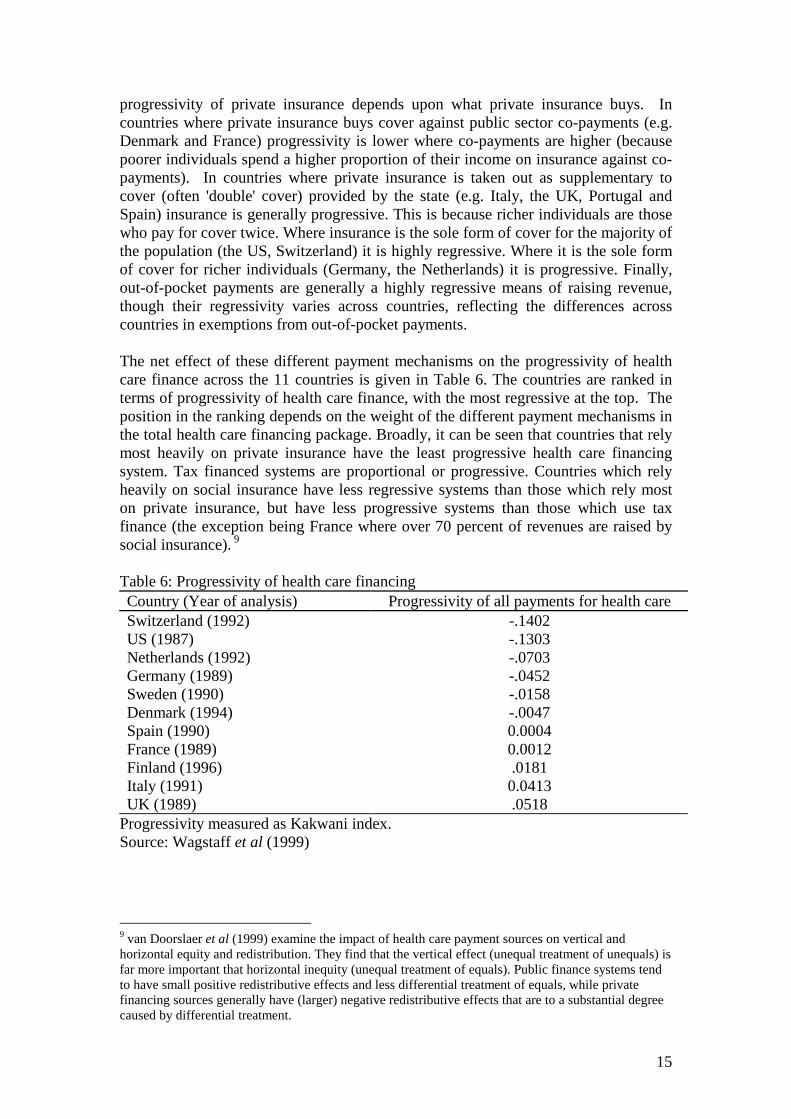
The net effect of these different payment mechanisms on the progressivity of healthcare finance across the 11 countries is given in Table 6. The countries are ranked interms of progressivity of health care finance, with the most regressive at the top. Theposition in the ranking depends on the weight of the different payment mechanisms inthe total health care financing package. Broadly, it can be seen that countries that relymost heavily on private insurance have the least progressive health care financingsystem. Tax financed systems are proportional or progressive. Countries which relyheavily on social insurance have less regressive systems than those which rely moston private insurance, but have less progressive systems than those which use taxfinance (the exception being France where over 70 percent of revenues are raised bysocial insurance). 9
Table 6: Progressivity of health care financingCountry (Year of analysis) Progressivity of all payments for health careSwitzerland (1992) -.1402US (1987) -.1303Netherlands (1992) -.0703Germany (1989) -.0452Sweden (1990) -.0158Denmark (1994) -.0047Spain (1990) 0.0004France (1989) 0.0012Finland (1996) .0181Italy (1991) 0.0413UK (1989) .0518
Progressivity measured as Kakwani index.Source: Wagstaff et al (1999)
9 van Doorslaer et al (1999) examine the impact of health care payment sources on vertical andhorizontal equity and redistribution. They find that the vertical effect (unequal treatment of unequals) isfar more important that horizontal inequity (unequal treatment of equals). Public finance systems tendto have small positive redistributive effects and less differential treatment of equals, while privatefinancing sources generally have (larger) negative redistributive effects that are to a substantial degreecaused by differential treatment.
16
Equity in the delivery of health care
The principle of equity in the delivery of health care is widely adopted in OECDcountry policy documents (van Doorslaer and Wagstaff 1992). But differences in themix of public and private financing, and in the delivery systems across these countriesmay mean that these equity goals are not met in practice. van Doorslaer et al (2000)estimate the extent to which violations of the principle 'equal treatment for equal need'are systematically related to income in 13 OECD countries. The study uses individuallevel data from household surveys. This contrasts with many other studies of equityin the allocation of health care, which have looked at only users of health care.Individual's incomes are their equivalised household income and various forms ofcare are examined. Departures from proportionality (equal treatment for equal need)are measured by an index that ranges from -1 to +1 where a negative (positive)number indicates pro-poor (pro-rich) inequity10.
In all the countries studied, individuals in lower income groups are more intensiveusers of the health care system. The poor use more services of the general practitioner,the medical specialist and the hospital. But after standardising for the level of needfor care, there is little or no evidence of significant inequality in the delivery of healthcare overall. Interpreted literally, these results indicates that in the late 1980s andearly 1990s, the health care systems of these countries appeared to performreasonably well on the horizontal equity criterion of equal treatment for equal need.
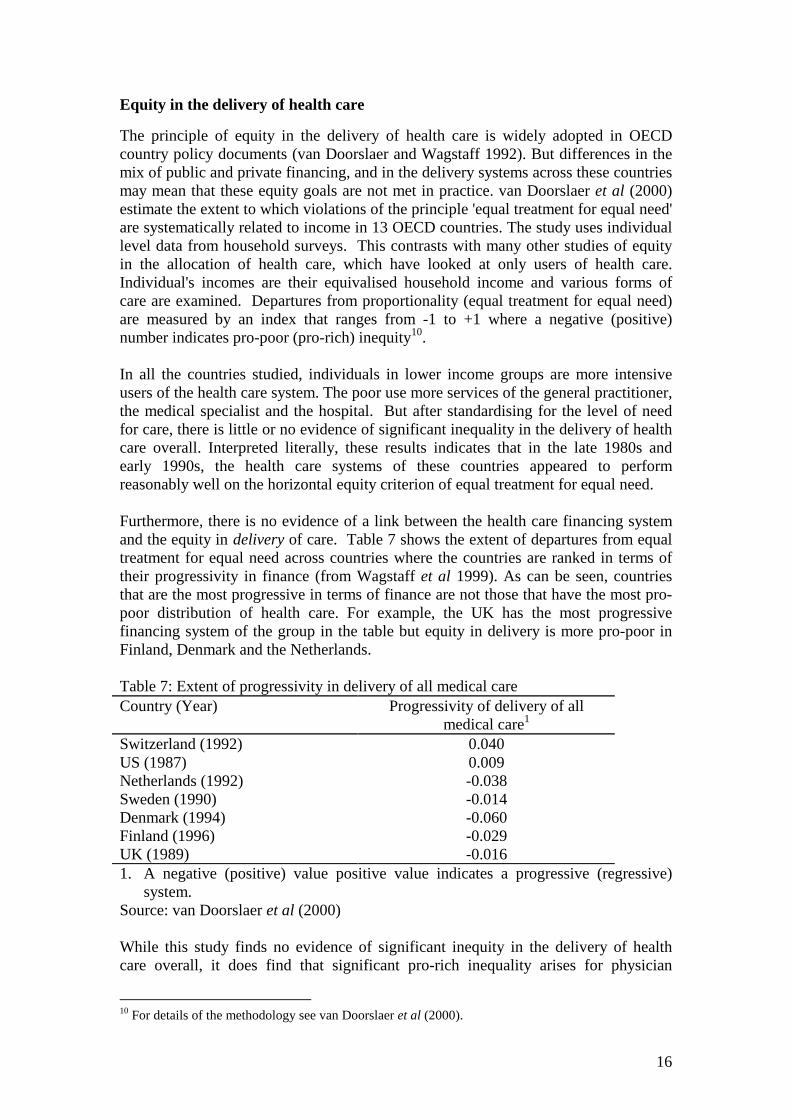
Furthermore, there is no evidence of a link between the health care financing systemand the equity in delivery of care. Table 7 shows the extent of departures from equaltreatment for equal need across countries where the countries are ranked in terms oftheir progressivity in finance (from Wagstaff et al 1999). As can be seen, countriesthat are the most progressive in terms of finance are not those that have the most pro-poor distribution of health care. For example, the UK has the most progressivefinancing system of the group in the table but equity in delivery is more pro-poor inFinland, Denmark and the Netherlands.
Table 7: Extent of progressivity in delivery of all medical careCountry (Year) Progressivity of delivery of all
medical care1
Switzerland (1992) 0.040US (1987) 0.009Netherlands (1992) -0.038Sweden (1990) -0.014Denmark (1994) -0.060Finland (1996) -0.029UK (1989) -0.0161. A negative (positive) value positive value indicates a progressive (regressive)
system.Source: van Doorslaer et al (2000)
While this study finds no evidence of significant inequity in the delivery of healthcare overall, it does find that significant pro-rich inequality arises for physician
10 For details of the methodology see van Doorslaer et al (2000).

17
contacts. This seems to be due mainly to a higher use of medical specialist services byhigher income groups and a higher use of GPs care amongst lower income groups.These findings appear to be fairly general and emerge in different countries with verydiverse characteristics regarding access to specialists and provider incentives. Itoccurs in countries with universal coverage (Scandinavia) as well as those without(US), countries with (Denmark, Netherlands) and without (Belgium) a GP gatekeeperrole, countries with (Belgium) and without (Denmark) substantial cost sharing bypatients. On the other hand, this finding does not emerge in two other countries thatshare few features in common (the UK and Switzerland).
The lessons which may be drawn from these studies to date of equity in the financeand delivery of health care is that changes to the finance side would appear to havemore impact on equity than changes to the delivery side. However, such conclusionsmay be premature. The analysis on the delivery side was not able to adjust fordifferences in quality of care across individuals and relied upon analysis of datadrawn from a variety of country-specific surveys. Second, the results on the financeside are not incompatible with a position in which countries in which citizen careabout fairness in health care finance adopt more progressive finance (i.e. use taxationrather than social insurance or private insurance and use less co-payments). In otherwords, the financing system might be endogenous to the beliefs about fairness.
A study of attitudes towards the role of the state in financing health care carried outby Taylor-Gooby (1999) showed that there is a considerable difference in the level ofsupport for government responsibility for the sick. Table 8 presents the answers to aquestion asked in 4 countries over time. This shows considerable variation in the levelof support for this principle. In addition, the ranking of these countries in terms ofsupport for this statement is similar to their ranking in terms of progressivity offinancing of health care. Again, further research using comparable data sets is neededto ascertain the link between equity beliefs and financing arrangements.
Table 8: Percentage saying government should definitely be responsible for healthcare for the sickYear West
GermanyBritain Italy Sweden
1985 54 85 87 n.a1990 57 85 88 n.a1996 51 82 n.a 71Source: Taylor-Gooby (1999)
5. Does the organisation of the health care system determine healthoutcomes?
The level of health
The above analyses have been concerned with expenditure of the health care systemand its level and distribution. Health expenditure is, however, input: arguably whatindividuals care about is the output of the health care sector, in other words, health.Obviously there are many factors other than health care that determine individual’shealth status, but one measure of performance of health care systems is the extent of
18
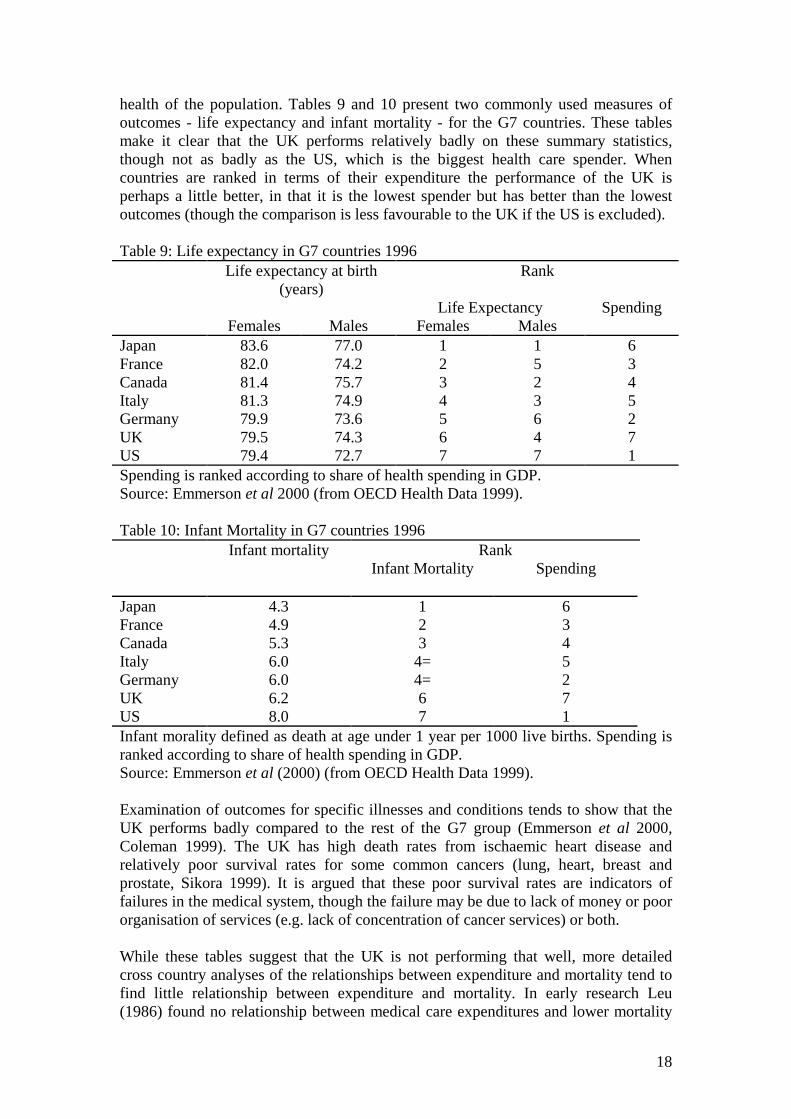
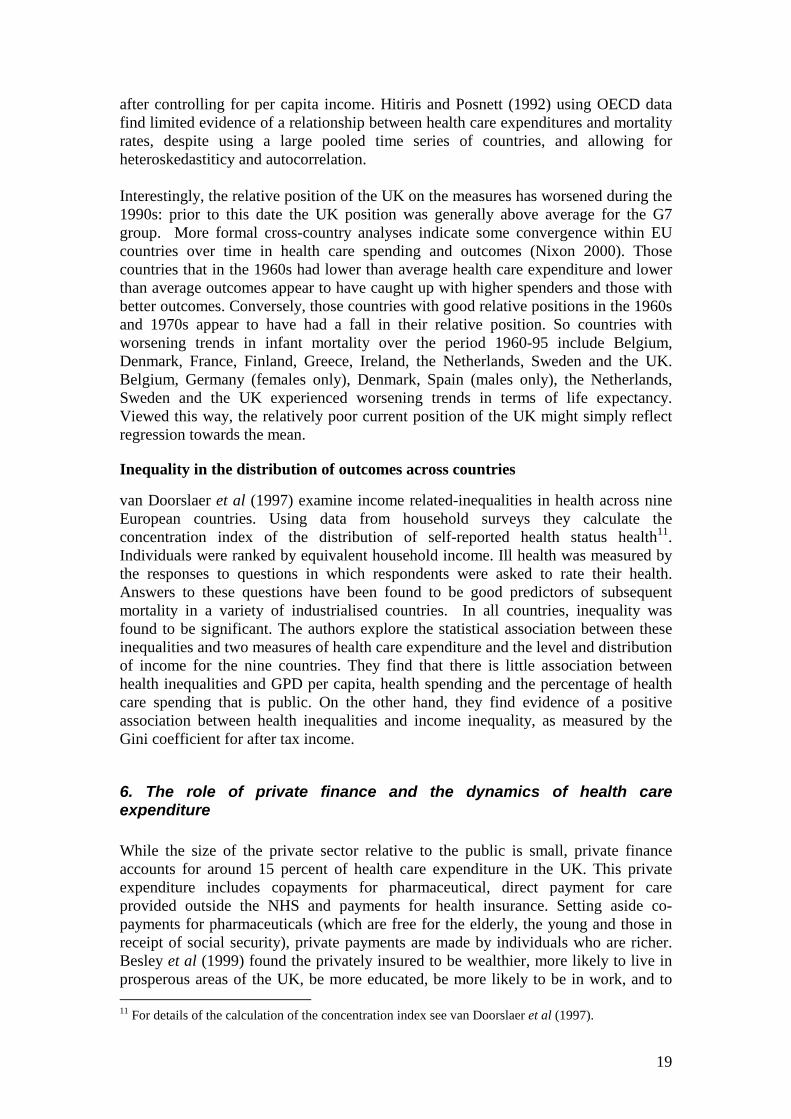
health of the population. Tables 9 and 10 present two commonly used measures ofoutcomes - life expectancy and infant mortality - for the G7 countries. These tablesmake it clear that the UK performs relatively badly on these summary statistics,though not as badly as the US, which is the biggest health care spender. Whencountries are ranked in terms of their expenditure the performance of the UK isperhaps a little better, in that it is the lowest spender but has better than the lowestoutcomes (though the comparison is less favourable to the UK if the US is excluded).
Table 9: Life expectancy in G7 countries 1996Life expectancy at birth
(years)Rank
Life Expectancy SpendingFemales Males Females Males
Japan 83.6 77.0 1 1 6France 82.0 74.2 2 5 3Canada 81.4 75.7 3 2 4Italy 81.3 74.9 4 3 5Germany 79.9 73.6 5 6 2UK 79.5 74.3 6 4 7US 79.4 72.7 7 7 1Spending is ranked according to share of health spending in GDP.Source: Emmerson et al 2000 (from OECD Health Data 1999).
Table 10: Infant Mortality in G7 countries 1996Infant mortality Rank
Infant Mortality Spending
Japan 4.3 1 6France 4.9 2 3Canada 5.3 3 4Italy 6.0 4= 5Germany 6.0 4= 2UK 6.2 6 7US 8.0 7 1Infant morality defined as death at age under 1 year per 1000 live births. Spending isranked according to share of health spending in GDP.Source: Emmerson et al (2000) (from OECD Health Data 1999).
Examination of outcomes for specific illnesses and conditions tends to show that theUK performs badly compared to the rest of the G7 group (Emmerson et al 2000,Coleman 1999). The UK has high death rates from ischaemic heart disease andrelatively poor survival rates for some common cancers (lung, heart, breast andprostate, Sikora 1999). It is argued that these poor survival rates are indicators offailures in the medical system, though the failure may be due to lack of money or poororganisation of services (e.g. lack of concentration of cancer services) or both.
While these tables suggest that the UK is not performing that well, more detailedcross country analyses of the relationships between expenditure and mortality tend tofind little relationship between expenditure and mortality. In early research Leu(1986) found no relationship between medical care expenditures and lower mortality
19
after controlling for per capita income. Hitiris and Posnett (1992) using OECD datafind limited evidence of a relationship between health care expenditures and mortalityrates, despite using a large pooled time series of countries, and allowing forheteroskedastiticy and autocorrelation.
Interestingly, the relative position of the UK on the measures has worsened during the1990s: prior to this date the UK position was generally above average for the G7group. More formal cross-country analyses indicate some convergence within EUcountries over time in health care spending and outcomes (Nixon 2000). Thosecountries that in the 1960s had lower than average health care expenditure and lowerthan average outcomes appear to have caught up with higher spenders and those withbetter outcomes. Conversely, those countries with good relative positions in the 1960sand 1970s appear to have had a fall in their relative position. So countries withworsening trends in infant mortality over the period 1960-95 include Belgium,Denmark, France, Finland, Greece, Ireland, the Netherlands, Sweden and the UK.Belgium, Germany (females only), Denmark, Spain (males only), the Netherlands,Sweden and the UK experienced worsening trends in terms of life expectancy.Viewed this way, the relatively poor current position of the UK might simply reflectregression towards the mean.
Inequality in the distribution of outcomes across countries
van Doorslaer et al (1997) examine income related-inequalities in health across nineEuropean countries. Using data from household surveys they calculate theconcentration index of the distribution of self-reported health status health11.Individuals were ranked by equivalent household income. Ill health was measured bythe responses to questions in which respondents were asked to rate their health.Answers to these questions have been found to be good predictors of subsequentmortality in a variety of industrialised countries. In all countries, inequality wasfound to be significant. The authors explore the statistical association between theseinequalities and two measures of health care expenditure and the level and distributionof income for the nine countries. They find that there is little association betweenhealth inequalities and GPD per capita, health spending and the percentage of healthcare spending that is public. On the other hand, they find evidence of a positiveassociation between health inequalities and income inequality, as measured by theGini coefficient for after tax income.
6. The role of private finance and the dynamics of health careexpenditure
While the size of the private sector relative to the public is small, private financeaccounts for around 15 percent of health care expenditure in the UK. This privateexpenditure includes copayments for pharmaceutical, direct payment for careprovided outside the NHS and payments for health insurance. Setting aside co-payments for pharmaceuticals (which are free for the elderly, the young and those inreceipt of social security), private payments are made by individuals who are richer.Besley et al (1999) found the privately insured to be wealthier, more likely to live inprosperous areas of the UK, be more educated, be more likely to be in work, and to 11 For details of the calculation of the concentration index see van Doorslaer et al (1997).

20
support the Conservative Party. Propper et al (2001) also find evidence of a cohorteffect in purchase: younger individuals are currently more likely to purchase thantheir older counterparts. Unsurprisingly, adding in the receipt of private care to NHSexpenditure makes the UK distribution of health expenditure less progressive(O’Donnell et al, 1993).
There are a number of essentially static arguments in favour of a private sector thatoperates alongside a public sector system. First, there are a limited number ofeconomic models that show that systems in which there is private provision alongsidepublic is welfare increasing. Besley and Coate (1991) argued that systems in whichthere is de jure universal provision, but in which richer individuals are de factoallowed to 'opt out' can be redistributive, even when public provision is financed by anon-redistributive mechanism such as a head tax. Gouveia (1997) argues that allowingthe rich 'opt out' maintains the existence of a public system by keeping tax paymentsdown to levels supported by a coalition of the rich and the poor. The second oftenadvanced argument is that the private sector allows individuals choice. The third isthat for a given budget, individuals who use the private sector may actually benefitthose who remain in the public sector. If richer individuals use private care but paytaxes for public care, then this will reduce demand in the public sector, so increasingthe resources available per capita in the public sector. For example, in the UK it isargued that those who use the private sector for treatment reduce waiting times forthose who remain in the public sector.
But the dynamics of the process may be somewhat different. If the wealthier receiveless of their health care through the public system, their commitment to contributetaxes to the system may decrease. In addition, without the 'sharp elbows' of the middleclasses to keep up quality, the quality of the public sector may fall. A fall may lead tolobbying for lower taxes for the public scheme and a reduction in budgets. If optingout does depend on the quality of the public sector, reductions in the budget will leadto less use of the system by richer individuals. This will, in turn, lead to further callsfor reductions in the budget. So attempts to cut public expenditure may lead to thepublic sector becoming a 'poor service for the poor'.
The relationship between private financing and the evolution of the public systemturns on the relationship between the quality of the public sector, use of the public andprivate sector, and political support for the public sector. The argument that privatefinance will lead to a downward spiral towards a ‘poor service for the poor’ dependsupon the premise that support for public sector financing is negatively associated withprivate demand and that the demand for a privately financed alternative is affected bythe quality of the public sector.
In practice, there are several possible relationships between support for public financeand use of private health care. Users of private health care services may be lesssupportive of public services on ideological grounds or because they simply see littlepersonal return from public services they do not use. Alternatively, users of privateservices may be frustrated with the level of service available from the public sector,although ideologically they may prefer higher state spending to achieve higher servicelevels and quality for all. Use of the public or private sector may affect attitudes.Users dissatisfied with the level of service in the public sector may switch to theprivate sector. Users of the private sector may like the quality of service they receive
21
and no longer see themselves as potential beneficiaries of the public service, and inturn lessen their support for state provision.
At an EU level, Mossialis (1997) finds a positive relationship between expenditureper capita and satisfaction with the health care services, though there are two outliers(Denmark and Italy). In addition he finds a north-south divide in citizen's satisfactionwith health care systems, with those in the north being more satisfied, those in thesouth being less so, and the UK (and Ireland) lying between the two. In anexamination of the dynamics of expenditure across countries (using OECD data),Globerman and Vining (1998) find no relationship between the current share of publicexpenditure in a country and past shares of public expenditure in health care in thatcountry. In other words, low current levels of public expenditure do not necessarilyimply low levels of expenditure in the future.
At a national level, evidence from the UK suggests that those who use the privatesector are, in general, less supportive of public financing of health care. Users ofprivate health care services and, more particularly, users of private medical insurance,are less supportive of increases in expenditure on the NHS or the equity goals of theNHS (Burchardt et al 1999, Hall and Preston 1998). There is also evidence from theUK that the quality of the NHS is associated with use of the private sector: longerwaiting lists have been found to be linked with higher levels of demand for privatemedical insurance (Besley et al 1999), though not with use of the private sector(Burchardt et al 1999). Besley et al and Calnan et al (1993) also find evidence of alink between dissatisfaction with the quality of the NHS and private insurancepurchase in the UK. However, both stress that it is dissatisfaction with the quality ofservice, rather than the concept of public provision, which drives people into theprivate sector.
But there is considerably less evidence that private use leads to change in attitudes.Burchardt and Propper (1999) find that use of private health care in the UK in theearly 1990s did not lead to clear-cut changes in attitudes towards the NHS over thefollowing 5 years. Furthermore, over this 5-year period the attitudes of both privatesector and NHS users changed and the changes in attitudes of both sets of users werevery close. It appears that, in the UK at present, it is use of a service that leads toattitude change and not whether that individual uses a public or a private service.
These studies point to an interaction between NHS utilisation, private utilisation andattitudes which suggests that the state of the NHS might have an impact upon theutilisation of the private sector alternative by the individual. The evidence is less clearas to whether this will translate into lower support for the NHS and for taxes for theNHS. Judge et al (1998) found that levels of dissatisfaction with health care fluctuatedbetween 1983 and 1996, but rose towards the end of the period to be higher thanduring the previous 13 years. A strong association exists (at national level) betweenactual levels of expenditure on the NHS, spending priorities and dissatisfaction withthe NHS. Public support for higher spending and levels of dissatisfaction with theNHS rose in the second half of the 1980s when funding increases were relativelysmall, fell back again in the early 1990s when spending rose, then rose again asspending slowed down in the mid 1990s. However, the same study found littlesupport for major changes in the traditional method of tax finance for the NHS duringthis period. In a study of attitudes to public sector funding, Brook et al (1997) found
22
that the use of private sector alternatives for health care was an important determinantof individuals thought was a funding priority for themselves, but was a less importantdeterminant of what they perceived to be in the national interest.
Given this evidence, it appears that a decrease in expenditure on the NHS may lead toincreased use of the private sector but this will not lead to a large shift in supportaway from the NHS. Increasing NHS expenditure paradoxically may therefore putgreater pressure on the NHS as more individuals use the higher quality public service.Conversely, the findings also suggest there may be scope for more private finance atthe margin without threatening the tax base of the NHS.
In considering extensions to private finance it is necessary to take into accountpossible supply-side responses. Under the current performance monitoringarrangements within the NHS, in which hospitals are set waiting list or waiting timetargets, Martin and Smith (1999) found that an increase in waiting lists resulted in alarger increases in supply than reductions in demand. They attributed this to the factthat hospital managers are strongly monitored in terms of waiting time/list targets. Inaddition, physicians who work in the private sector generally also work on the publicsector and are not strongly monitored in terms of hours of work supplied to the NHS.So any exogenous increase in demand for private services (say a tax break for privatepurchase) or a change in quality of the NHS will impact on both sectors.
Measures to stimulate private finance could lead to a worsening of service in the NHSas staff moved into the private sector to meet the increased private demand. If the fallin demand for NHS care was sufficiently large NHS waiting lists would then fall. Thismight stimulate some NHS demand, but it might also reduce the pressure on managersto exert effort, and if the Martin and Smith estimates are taken at face value, wouldresult in less NHS activity. So in the short run, giving tax breaks could harm NHSusers. The benefit to private users would depend on whether price in the private sectorrose and the difference in the benefits of treatment - including the difference inwaiting times - in the two sectors.
7. Lessons from the internal market reforms
The UK, along with several other OECD countries, implemented a major reform of itshealth care system in the 1990s. In 1991 the internal market reforms were introduced.These separated the functions of provision and purchase of hospital based health care,creating one set of agents responsible for provision and another responsible forpurchase. NHS hospitals were to be given greater autonomy from central and localcontrol and purchasers were created from area based authorities that had previouslyadminstered hospitals and from a self-selected group of primary care physicians(Culyer et al 1990). The intention of the reforms was to create competition on thesupply side of the market. Purchasers were free to buy hospital based health care fromany provider, including the small private sector. Providers would compete forcontracts to supply care, which it was argued would encourage efficiency (Maynard1991).
23
These reforms are part of a more general health care reform process intended toincrease competition in health care markets12. It is generally agreed that such reformshave brought about less change than their architects hoped for13. However, within aUK context the reforms have highlighted the importance of incentives for providersand purchasers of health care. An assessment of the reforms concluded that “theincentives were too weak and the constraints too strong” (Le Grand et al 1998). Theconstraints come, in part, from the controls imposed by central government (Propper1995).
One area over which there was less central control was on the behaviour of GeneralPractice Fundholders. In the internal market, two main classes of buyer were created:health authorities and a self-selected group of family physicians (General Practitionersor GPs), called General Practice Fundholders (GPFHs). The reforms gave GPs choice,and GPFHs the ability to pay for this choice for a subset of treatments.
The fundholding scheme ran from 1991 to 1999. The scheme was voluntary, andpractices joined in different years over the scheme’s life. By its end, nationally abouthalf of all general practices were fundholders. GP fundholders held a budget fromwhich they were expected to pay for only particular, specified types of care, includinga specified subset of all procedures that an elective hospital patient might have. Theseincluded common elective procedures, and accounted for about 70% of all electiveadmissions. GP fundholders placed contracts for these procedures with hospitals.These contracts commonly included information about price and some dimensions ofquality including, in some instances, waiting times (Glennerster et al. 1994). Thecontracts were likely to link payment to activity, with GP fundholders basicallypaying hospitals for each case treated.
Any surplus from the fund could be retained by fundholder to use in their practices.As GPFHs are self-employed contractors subject to relatively little financialmonitoring, exactly how these funds were spent was not subject to detailed scrutiny,and at the very least, practice improvements translate into higher income when the GPexits from the practice. The research on the behaviour of GPFHs shows that GPs weregenerally active in making changes in the internal market (Glennerster et al 1994) anddetailed analyses of the financial incentives embodied in the scheme suggests thatGPFHs responded to financial, as well as non-financial, incentives. Theimplementation of the reforms was undertaken in a way that GPFHs had budgetsbased on their referrals in the year immediately prior to entry into the scheme. Thisgave them incentives to increase their use of hospital services prior to entering thescheme in order to inflate their budgets (which they then could hold at this level forthe life of the scheme). Croxson et al (2001) show that fundholders did respond tothese financial incentives by increasing their referrals to hospital prior to entry intothe scheme, so inflating their budgets upwards for the duration of the fundholding
12 Culyer et al (1990) and Maynard (1991) provide an overview of the NHS reforms. Propper (1995)provides an assessment of the limits to reform. Glied (2000) provides a review of the US literature onmanaged care. Chalkley and Malcomson (2000) review issues in government contracting for healthcare services. Le Grand and Bartlett (1993) provide a review of the wider set of ‘quasi-market’ reformsenacted in the UK.13 Le Grand et al (1998) provide an assessment of the UK reforms. Saltmann and Figueras (1998)review the experience of managed competition. A more sociological assessment of several reforms isprovided in Social Science and Medicine 52 (2001).
24
scheme. Gravelle et al (2001) showed that fundholding practices responded topositive prices by admitting fewer patients than non-fundholding practices. They alsoresponded to changes in waiting times and patient characteristics in a way that wasconsistent with the positive financial costs of making referrals.
Evidence on the prices charged by NHS hospitals to GPFHs and the District HealthAuthority buyers indicates that external incentives – competition – also influencedbehaviour. The Department of Health set regulations such that price was meant toequal average cost. However, this rule was not (and probably could not) be monitored.A limited number of studies of the impact of supply side competition on prices wereundertaken. These showed that higher levels of competition were associated withlower prices, particularly for services which had lower costs (Propper, 1996 andPropper et al, 1998). These studies also suggest that NHS hospitals gave greaterdiscounts to those buyers who were more able to move their contracts between sellers.
So, while in general the regulatory activities of central government might have limitedthe responses of agents in the internal market, it does appear that even with suchregulation, agents did respond to financial incentives.
8. Conclusions
This review has examined the financing of the UK health care sector using evidencefrom both international comparisons and from within the UK. The internationalcomparisons suggest the following. The lower expenditure per capita of the UK can,in part, be attributed to organisation of the health care system. Features of the UKsystem, such as the use of primary care gatekeepers and budgets set at a system widelevel, appear to keep expenditure below what would be expected given nationalincome. The evidence on equity in finance and delivery indicates that on the financeside the UK has one of the most progressive systems. On the delivery side the NHS isnot worse, and indeed somewhat better, in terms of equity in the use of health careresources, than several other OECD countries which spend considerably more percapita on their health care.
On the other hand, the international evidence on expenditure cannot be taken asevidence of efficiency as no adjustment is made for quality. Further, the evidence alsoindicates that that these positive properties of the UK system may not translate intohealth outcomes. The UK has, on some measures, poorer health outcomes than similarcountries and a poorer distribution of health. While these outcomes might be betterthan expected given the level of funding, the fact that little relationship betweenfunding and mortality has been found at cross-country level makes such an inferencesomething of a leap of faith. And the distribution of outcomes appears more related tothe distribution of income than to any measures of health care spending.
What international comparisons also hint at is the importance of incentives at the levelof the supplier and the demander. The funding analyses show the UK use ofgatekeepers (the UK's General Practice system whereby individual's must be referredinto the hospital sector for treatment and diagnosis by their family doctors) andpayment of doctors by salary rather than fee-for-service mean expenditure per capitais lower than it would be with other design features. However, cross-country analysesare generally at a level at which is hard to isolate the impact of such incentives: to

25
understand these micro-incentives it is necessary to examine data in which theincentive structures can be more clearly identified.
Examination of responses to the financial incentives embodied in the UK internalmarket reforms indicates that physicians and health care providers do appear torespond to financial incentives in a tax financed, predominantly public providedhealth care system. Referral patterns of GPs reflected financial (and other) rewards.Where competition was stronger, prices appeared to be lower. However, it is alsoclear that responses of agents were limited by the structures established, and theactions taken, by central government to ‘manage the market’.
In terms of the type of finance, the review suggests there are no clear equity groundsfor moving away from tax finance. The present tax financed system is more equitablethan either social insurance or private insurance. On the other hand, there are growingpressures on the NHS, which are reflected in public attitudes. The evidence suggeststhat a marginal extension of private finance will not necessarily erode public supportfor the NHS.
Finally, the review highlights the importance of moving on from a focus on what arebasically inputs - expenditure and its distribution - to an examination of outcomes andthe links between inputs and outputs. The UK appears to meet its equity goals well interms of how it spends public finance, but this is not mirrored by an increase in equityin health outputs. The existence of health inequalities raises the issue that the focus bygovernments on inputs and amounts of money spent is somewhat skewed. Asimportant is a focus on what is being achieved for this money. To assess the extent towhich health outcomes have much to do with expenditure on health care, greaterresearch effort needs to be directed to looking at the impact of expenditure on health.In other words, economists need to direct effort to the study of the efficiency ofproduction. This in turn suggests a greater focus on the responses of suppliers anddemanders to incentives.
26
ReferencesBarr, N (1998). The Economics of the Welfare State, 3rd edition. Oxford: OUP.Besley, T and Coate, S. (1991). Public Provision Of Private Goods And The
Redistribution Of Income. American Economic Review 81(4), 979-984.Besley, T., Hall J. and Preston, I. (1999). The Demand for Private Health Insurance:
Do Waiting Lists Matter? Journal of Public Economics 72 (2), 155-181Bos, D and von Weisacker (1989). Economic consequences of an ageing population.
European Economic Review 33, 345-54.Bramley, G, et al (1998). Where does public spending go? Pilot study to analyse the
flows of public expenditure into local areas. DETR Regeneration ResearchReport. London: Department of the Environment, Transport and Regions.
Brook, L, Hall J and I Preston, (1997). What drives support for higher publicspending? London: Institute for Fiscal Studies Working Paper W97/16.
Burchardt, T. and Propper, C. (1999). Does the UK have a private welfare class?Journal of Social Policy 28 (4), 643-665
Burchardt, T, Hills, J and C Propper (1999). Private welfare and public policy. York:Joseph Rowntree Foundation.
Calnan, M, Cant, S and J Gabe (1993). Going Private: why people pay for their healthcare. Oxford: Oxford University Press.
Chalkley, M and Malcomson J, (2000). Government Purchasing of Health CareServices, in A J Culyer and J Newhouse (eds), Handbook of HealthEconomics. Amsterdam: North Holland.
Coleman, M P (1999). Cancer Survival Trends in England and Wales 1971-1995:Deprivation and NHS Region. Series SMPS no. 61. London: Stationary Ofiice.
Cremieux P-Y, Ouellette, P and Pilon, C (1999). Health care spending as determinantsof health outcomes. Health Economics 8, 627-639.
Croxson, B, Propper, and Perkins, P (2001). Do Doctors Respond to FinancialIncentives: UK family Doctors and the GP Fundholder Scheme, Journal ofPublic Economics 79 (2), 375-398.
Culter, D and Meara, E (1998). The Medical costs of the young and the old; a fortyyear perspective, in D. Wise (ed) Frontiers in Aging. Chicago: University ofChicago Press.
Culter, D and Meara, E (1999). The Concentration of Medical Spending: An UpdateNBER Working Paper no. W7279.
Culyer, A., Maynard, A. and Posnett, J. (eds), (1990). Competition in Health Care:Reforming the NHS. Basingstoke : Macmillan.
Cutler, D and Sheiner, L (1999) Demographics and Medical Care Spending: Standardand non-standard effects. In A Auerbach and R Lee (eds) Demographics andFiscal Policy. Cambridge: CUP.
Danzon, P.M. (1992). Hidden Overhead Costs: Is Canada’s system really lessexpensive?’ Health Affairs (Spring), 21-43
Department of Health (1998). Independent inquiry into inequalities in health report.Acheson Report. London: The stationary office.
Emmerson, C, Frayne, C, Goodman, A (2000). Pressures in UK Healthcare:Challenges for the NHS. Institute for Fiscal Studies Commentary 81.
Gerdtham, U. G. and Jonsson, B (2000). Cross-Country studies of health careexpenditure, in Culyer A J and Newhouse J (eds) The Handbook of HealthEconomics, Volume 1A. North Holland.
27
Getzen, T E (1992). Population ageing and the growth of health care expenditures.Journal of Gerontology: Social Sciences 47: S98-104.
Glennerster, H, Hills, J and Travers, T (2000). Paying for health care, housing andeducation. Oxford: OUP.
Glennerster, H, Matsaganis, M and Owens, P (1994). Implementing GP Fundholding:Wild Card or Winning Hand? Buckingham: Open University Press.
Glied, S (2000). Managed Care in A J Culyer and J Newhouse (eds), Handbook ofHealth Economics. Amsterdam: North Holland.
Globerman, S. and Vining, A. (1998) ‘A Policy Perspective On “Mixed” Health CareFinancial Systems Of Business and Economics’, Journal Of Risk AndInsurance 65(1), 57-80.
Gouveia, M. (1997). Majority Rule And The Public Provision Of A Private Good’.Public Choice 93, 221-244.
Gravelle, H, Duskeiko, M and Sutton, M (2001). The demand for elective surgery:time and money prices in the UK National Health Service. Mimeo, Centre forHealth Economics, University of York.
Hall, J. and Preston, I. (1998). Public and Private Choice in UK Health Insurance’.Institute for Fiscal Studies Working Paper Series, W98/19
Hitiris, T and Posnett, J (1992). The determinants and the effects of healthexpenditure in developed countries. Journal of Health Economics 11, 173-181.
Judge, K, Mulligan, J-A and New, B (1998). The NHS: new prescription needed? in RJowell, J Curtis, A Park, L Brook, K Thomson and C Bryson (eds) BritishSocial Attitudes: the 14th Report. London: Ashgate/SCPR.
Le Grand, J and Vizard, P (1998). The National Health Service: Crisis, change orContinuity?, in H. Glennerster and J. Hills (eds) The State of Welfare: TheEconomics of Social Spending. Oxford: OUP.
Le Grand, J and W. Bartlett (eds) (1993). Quasi-Markets and Social Policy.Houndmills: Macmillan.
Le Grand, J, Mays, N and Mulligan, J (eds) (1998). Learning from the NHS InternalMarket. London: Kings Fund.
Le Grand, J, Winter, D and Woolley, F (1990). The National Health Service: Safe inwhose hands? in J. Hills (ed) The State of Welfare: The welfare state in Britainsince 1974. Oxford: OUP.
Leu, R (1986). The public-private mix and international health care costs in A JCulyer and B Jonsson (eds) Public and Private health services. Oxford: BasilBlackwell.
Martin, S and Smith, P (1999). Rationing by waiting lists: an empirical investigation.Journal of Public Economics 71, 141-164.
Maynard, A. (1991). Developing a Health Care Market. Economic Journal 101, 405,pp. 1277-86.
Mossialis, E (1997). Citizen's views on the healthcare system in the 15 member statesof the European Union. Health Economics 6, 109-16.
Nixon, J (2000). Convergence of Health Care spending and health outcomes in theEuropean Union 1960-95. Centre for Health Economics, University of YorkDiscussion Paper 183.
O'Donnell, O and C. Propper (1991). Equity and the Distribution of NHS Resources",Journal of Health Economics, 10, 1-20.
O’Donnell, O, Propper, C and Upward, R (1993). Equity in the finance and deliveryof health care in Britain in E van Doorslaer, A Wagstaff and F Rutten (eds)
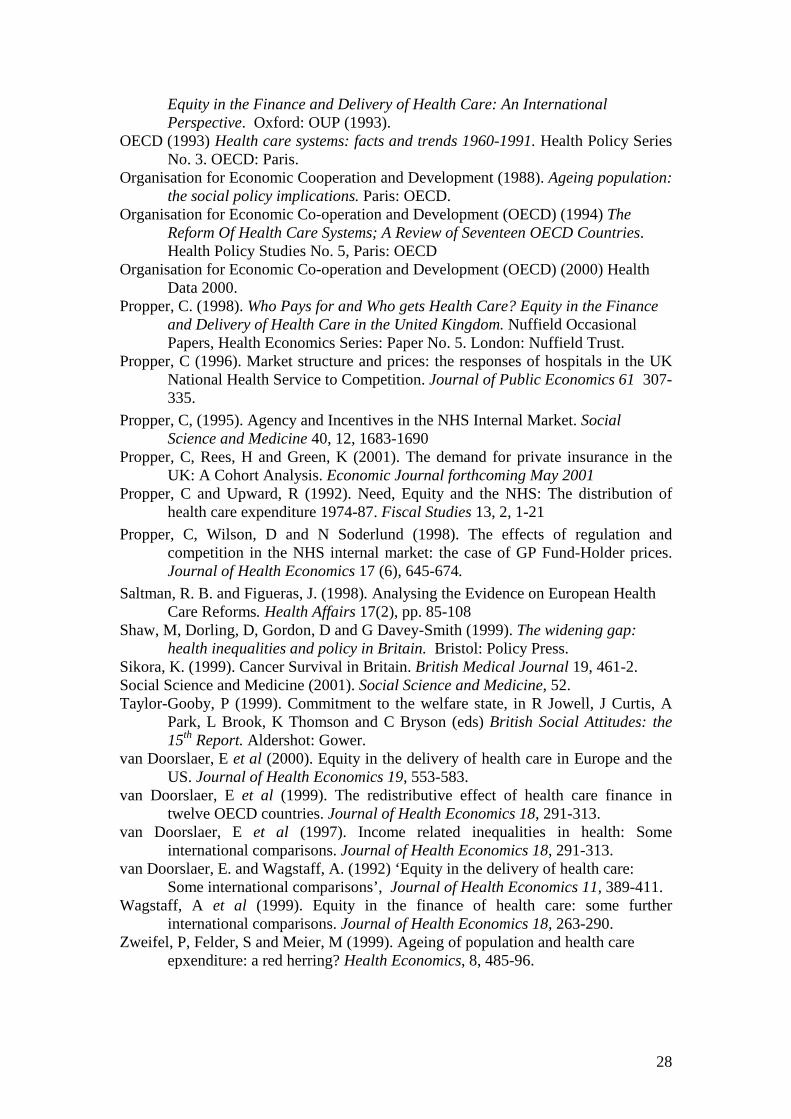
28
Equity in the Finance and Delivery of Health Care: An InternationalPerspective. Oxford: OUP (1993).
OECD (1993) Health care systems: facts and trends 1960-1991. Health Policy SeriesNo. 3. OECD: Paris.
Organisation for Economic Cooperation and Development (1988). Ageing population:the social policy implications. Paris: OECD.
Organisation for Economic Co-operation and Development (OECD) (1994) TheReform Of Health Care Systems; A Review of Seventeen OECD Countries.Health Policy Studies No. 5, Paris: OECD
Organisation for Economic Co-operation and Development (OECD) (2000) HealthData 2000.
Propper, C. (1998). Who Pays for and Who gets Health Care? Equity in the Financeand Delivery of Health Care in the United Kingdom. Nuffield OccasionalPapers, Health Economics Series: Paper No. 5. London: Nuffield Trust.
Propper, C (1996). Market structure and prices: the responses of hospitals in the UKNational Health Service to Competition. Journal of Public Economics 61 307-335.
Propper, C, (1995). Agency and Incentives in the NHS Internal Market. SocialScience and Medicine 40, 12, 1683-1690
Propper, C, Rees, H and Green, K (2001). The demand for private insurance in theUK: A Cohort Analysis. Economic Journal forthcoming May 2001
Propper, C and Upward, R (1992). Need, Equity and the NHS: The distribution ofhealth care expenditure 1974-87. Fiscal Studies 13, 2, 1-21
Propper, C, Wilson, D and N Soderlund (1998). The effects of regulation andcompetition in the NHS internal market: the case of GP Fund-Holder prices.Journal of Health Economics 17 (6), 645-674.
Saltman, R. B. and Figueras, J. (1998). Analysing the Evidence on European HealthCare Reforms. Health Affairs 17(2), pp. 85-108
Shaw, M, Dorling, D, Gordon, D and G Davey-Smith (1999). The widening gap:health inequalities and policy in Britain. Bristol: Policy Press.
Sikora, K. (1999). Cancer Survival in Britain. British Medical Journal 19, 461-2.Social Science and Medicine (2001). Social Science and Medicine, 52.Taylor-Gooby, P (1999). Commitment to the welfare state, in R Jowell, J Curtis, A
Park, L Brook, K Thomson and C Bryson (eds) British Social Attitudes: the15th Report. Aldershot: Gower.
van Doorslaer, E et al (2000). Equity in the delivery of health care in Europe and theUS. Journal of Health Economics 19, 553-583.
van Doorslaer, E et al (1999). The redistributive effect of health care finance intwelve OECD countries. Journal of Health Economics 18, 291-313.
van Doorslaer, E et al (1997). Income related inequalities in health: Someinternational comparisons. Journal of Health Economics 18, 291-313.
van Doorslaer, E. and Wagstaff, A. (1992) ‘Equity in the delivery of health care:Some international comparisons’, Journal of Health Economics 11, 389-411.
Wagstaff, A et al (1999). Equity in the finance of health care: some furtherinternational comparisons. Journal of Health Economics 18, 263-290.
Zweifel, P, Felder, S and Meier, M (1999). Ageing of population and health careepxenditure: a red herring? Health Economics, 8, 485-96.
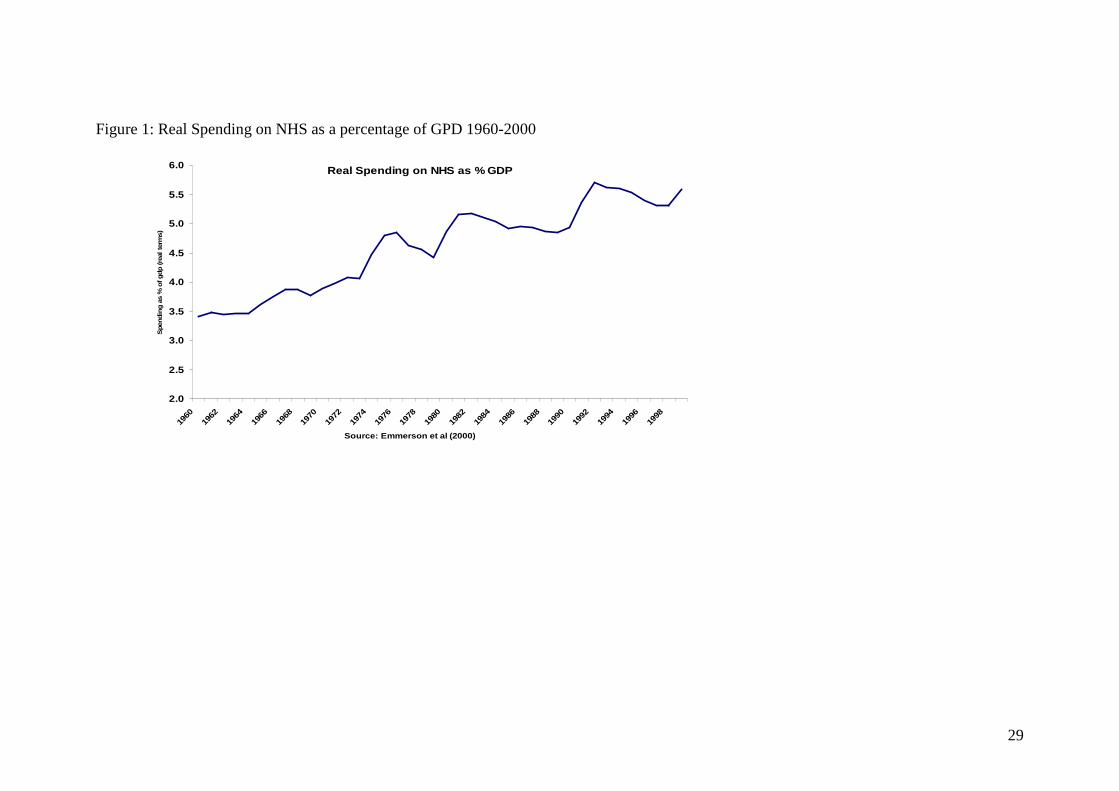
29
Figure 1: Real Spending on NHS as a percentage of GPD 1960-2000
Real Spending on NHS as % GDP
2.0
2.5
3.0
3.5
4.0
4.5
5.0
5.5
6.0
1960
1962
1964
1966
1968
1970
1972
1974
1976
1978
1980
1982
1984
1986
1988
1990
1992
1994
1996
1998
Source: Emmerson et al (2000)
Spe
ndin
g as
% o
f gdp
(rea
l ter
ms)

30
Figure 2: Real year on year growth in spending on the NHS 1961-1999
Real Spending on NHS, %yoy
-7.00
-5.00
-3.00
-1.00
1.00
3.00
5.00
7.00
9.00
11.00
1950
1952
1954
1956
1958
1960
1962
1964
1966
1968
1970
1972
1974
1976
1978
1980
1982
1984
1986
1988
1990
1992
1994
1996
1998
Source: Emmerson et al (2000)
Rea
l Spe
ndin
g G
row
th %
yoy
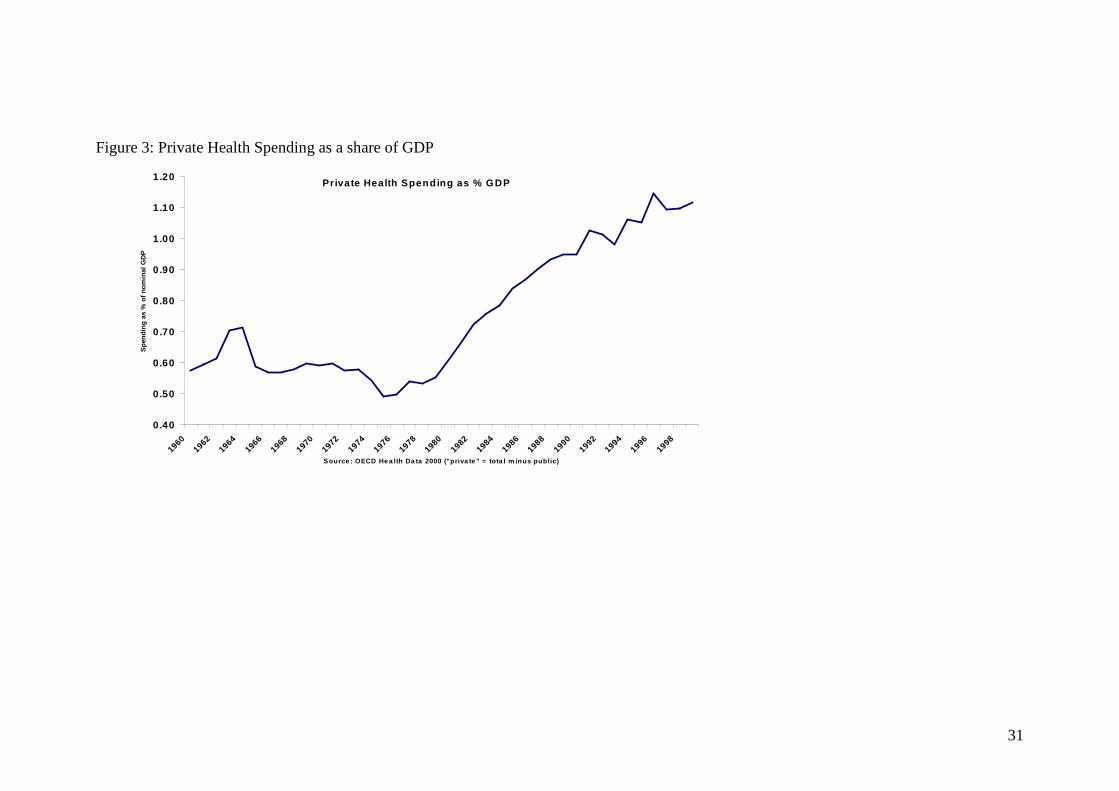
31
Figure 3: Private Health Spending as a share of GDP
Private Health Spending as % GDP
0.40
0.50
0.60
0.70
0.80
0.90
1.00
1.10
1.20
1960
1962
1964
1966
1968
1970
1972
1974
1976
1978
1980
1982
1984
1986
1988
1990
1992
1994
1996
1998
S ource : OECD He a lth Da ta 2000 ("priva te " = tota l m inus public)
Spe
ndin
g as
% o
f nom
inal
GD
P
32
Figure 4: Real year on year growth in private expenditure 1961-1999
Private Spending Growth, real terms %yoy
-20.00
-15.00
-10.00
-5.00
0.00
5.00
10.00
15.00
20.00
25.00
19611963196519671969197119731975197719791981198319851987198919911993199519971999
Source: OECD Health Data 2000, private = total minus public
%yo
y
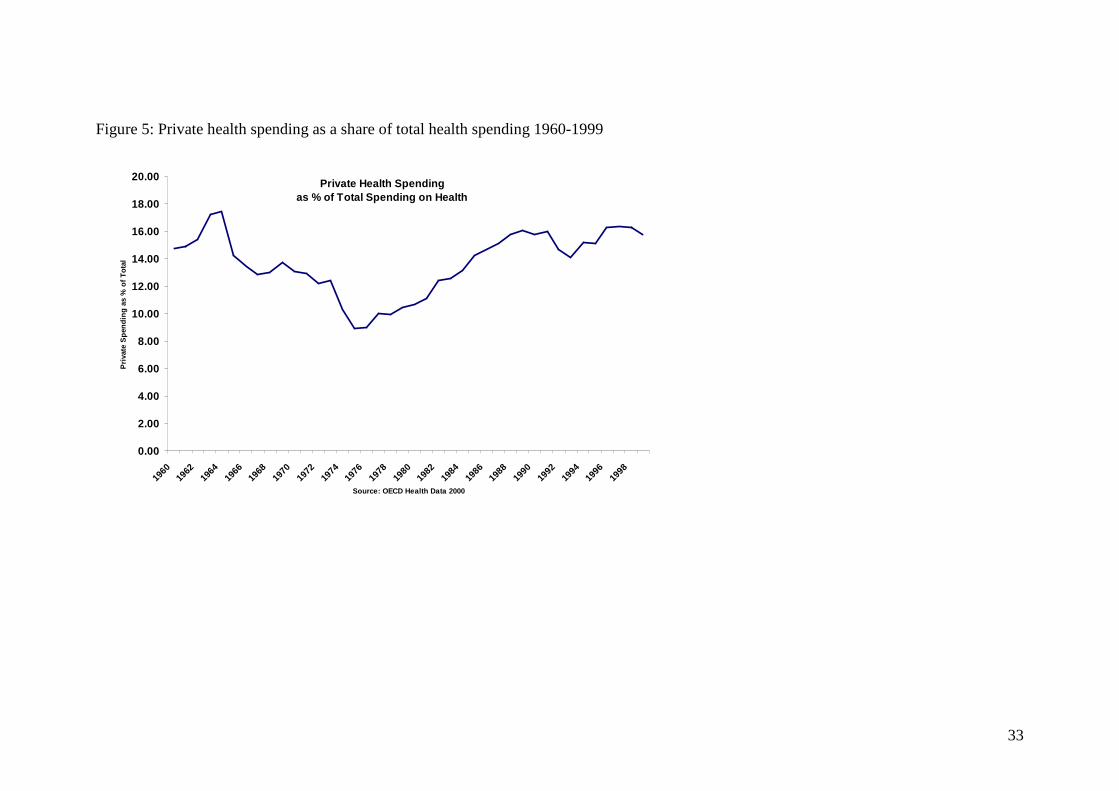
33
Figure 5: Private health spending as a share of total health spending 1960-1999
Private Health Spendingas % of Total Spending on Health
0.00
2.00
4.00
6.00
8.00
10.00
12.00
14.00
16.00
18.00
20.00
1960
1962
1964
1966
1968
1970
1972
1974
1976
1978
1980
1982
1984
1986
1988
1990
1992
1994
1996
1998
Source: OECD Health Data 2000
Pri
vate
Spe
ndin
g as
% o
f Tot
al