Embed Size (px)
Citation preview

Experience. The difference.
Annual Report 2008Part Two – Statutory Financial Statements (including Directors’ Report)
PERPETUAL LIMITED AND ITS CONTROLLED ENTITIES | 1
Annual Report 2008Part Two – Statutory Financial Statements(including Directors’ Report)
Annual financial statements 30 June 2008 for Perpetual Limited ABN 86 000 431 827 and its controlled entities.
2 | PERPETUAL LIMITED AND ITS CONTROLLED ENTITIES
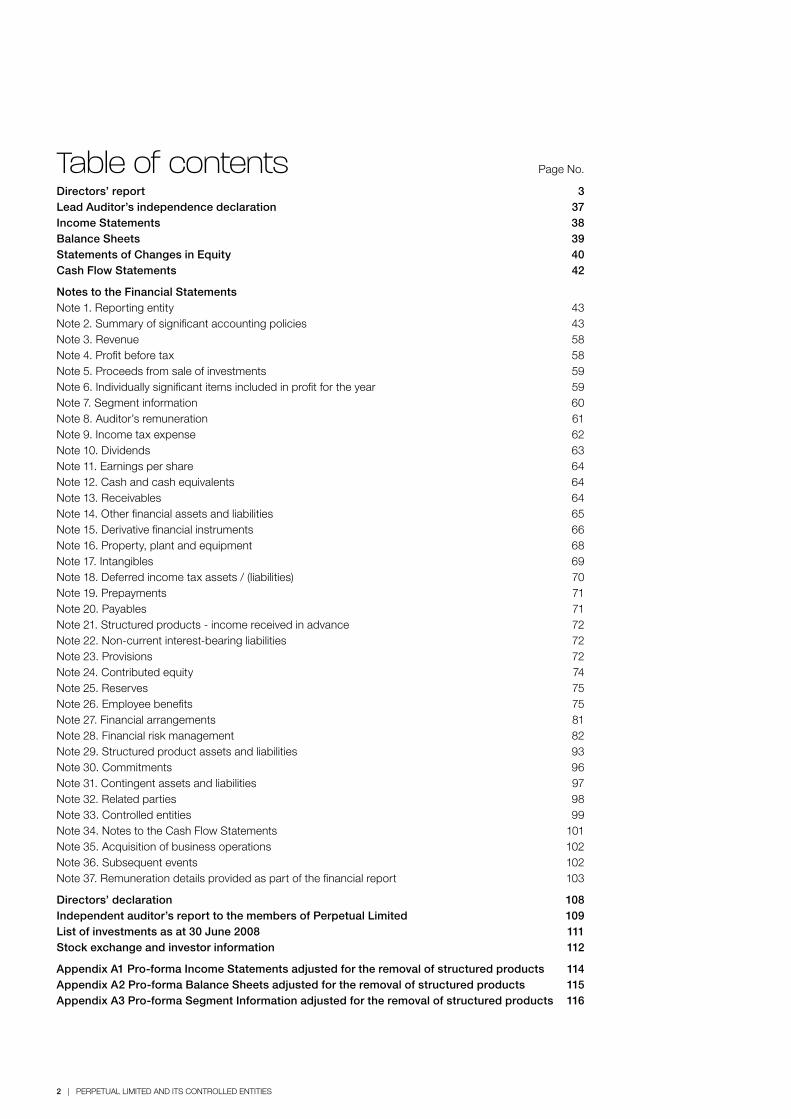
Table of contents Page No.
Directors’ report 3Lead Auditor’s independence declaration 37Income Statements 38Balance Sheets 39Statements of Changes in Equity 40Cash Flow Statements 42
Notes to the Financial StatementsNote 1. Reporting entity 43Note 2. Summary of significant accounting policies 43Note 3. Revenue 58Note 4. Profit before tax 58Note 5. Proceeds from sale of investments 59Note 6. Individually significant items included in profit for the year 59Note 7. Segment information 60Note 8. Auditor’s remuneration 61Note 9. Income tax expense 62Note 10. Dividends 63Note 11. Earnings per share 64Note 12. Cash and cash equivalents 64Note 13. Receivables 64Note 14. Other financial assets and liabilities 65Note 15. Derivative financial instruments 66Note 16. Property, plant and equipment 68Note 17. Intangibles 69Note 18. Deferred income tax assets / (liabilities) 70Note 19. Prepayments 71Note 20. Payables 71Note 21. Structured products - income received in advance 72Note 22. Non-current interest-bearing liabilities 72Note 23. Provisions 72Note 24. Contributed equity 74Note 25. Reserves 75Note 26. Employee benefits 75Note 27. Financial arrangements 81Note 28. Financial risk management 82Note 29. Structured product assets and liabilities 93Note 30. Commitments 96Note 31. Contingent assets and liabilities 97Note 32. Related parties 98Note 33. Controlled entities 99Note 34. Notes to the Cash Flow Statements 101Note 35. Acquisition of business operations 102Note 36. Subsequent events 102Note 37. Remuneration details provided as part of the financial report 103
Directors’ declaration 108Independent auditor’s report to the members of Perpetual Limited 109List of investments as at 30 June 2008 111Stock exchange and investor information 112
Appendix A1 Pro-forma Income Statements adjusted for the removal of structured products 114Appendix A2 Pro-forma Balance Sheets adjusted for the removal of structured products 115Appendix A3 Pro-forma Segment Information adjusted for the removal of structured products 116
PERPETUAL LIMITED AND ITS CONTROLLED ENTITIES | 3
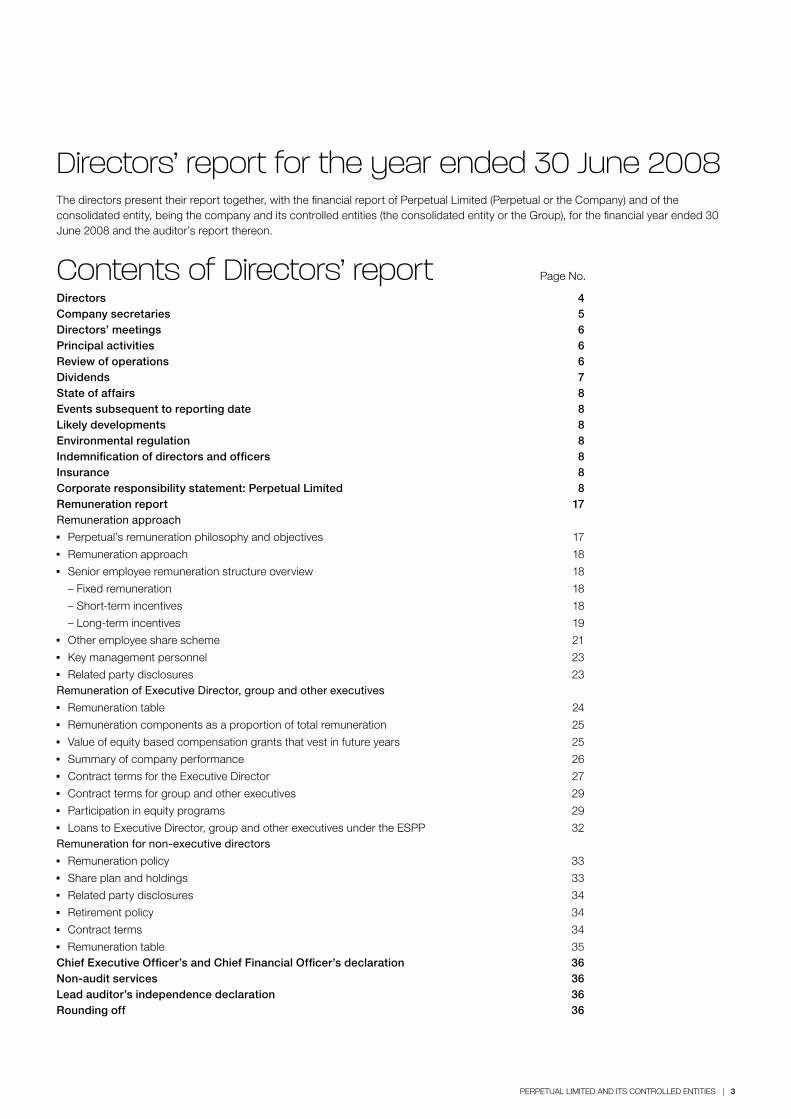
Directors’ report for the year ended 30 June 2008The directors present their report together, with the financial report of Perpetual Limited (Perpetual or the Company) and of the consolidated entity, being the company and its controlled entities (the consolidated entity or the Group), for the financial year ended 30 June 2008 and the auditor’s report thereon.
Contents of Directors’ report Page No.
Directors 4Company secretaries 5Directors’ meetings 6Principal activities 6Review of operations 6Dividends 7State of affairs 8Events subsequent to reporting date 8Likely developments 8Environmental regulation 8Indemnification of directors and officers 8Insurance 8Corporate responsibility statement: Perpetual Limited 8Remuneration report 17Remuneration approach
b Perpetual’s remuneration philosophy and objectives 17
b Remuneration approach 18
b Senior employee remuneration structure overview 18
– Fixed remuneration 18
– Short-term incentives 18
– Long-term incentives 19
b Other employee share scheme 21
b Key management personnel 23
b Related party disclosures 23Remuneration of Executive Director, group and other executives
b Remuneration table 24
b Remuneration components as a proportion of total remuneration 25
b Value of equity based compensation grants that vest in future years 25
b Summary of company performance 26
b Contract terms for the Executive Director 27
b Contract terms for group and other executives 29
b Participation in equity programs 29
b Loans to Executive Director, group and other executives under the ESPP 32Remuneration for non-executive directors
b Remuneration policy 33
b Share plan and holdings 33
b Related party disclosures 34
b Retirement policy 34
b Contract terms 34
b Remuneration table 35Chief Executive Officer’s and Chief Financial Officer’s declaration 36Non-audit services 36Lead auditor’s independence declaration 36Rounding off 36
4 | PERPETUAL LIMITED AND ITS CONTROLLED ENTITIES
DirectorsThe directors of the Company at any time during or since the end of the financial year are:
Robert M Savage, Chairman and Independent Director FASCPAS, FAICD, FAIM (Age 66)Appointed as a director in 2001 and as Chairman in October 2005. He was formerly Chairman and Managing Director of IBM Australia and New Zealand. He is Chairman of David Jones Limited and a director of Fairfax Media Limited. He is Chairman of Perpetual’s Nominations Committee and a member of the People and Remuneration Committee.
Mr Savage brings to the Perpetual board his experience as a senior executive in Australia and the Asian region, including experience in people management and organisation effectiveness issues and several years as a non-executive director and chairman across a wide range of Australian companies.
Listed company directorships held during the past three financial years:
b David Jones Limited from October 1999 (current)
b Smorgon Steel Group Limited from April 2000 to August 2007
b Mincom Limited (Chairman) from May 2002 to May 2007
b Fairfax Media Limited from June 2007 (current)
Meredith J Brooks, Independent Director BA, FIAA (Age 46)Appointed as a director in November 2004. She was formerly Managing Director, US Institutional Investment Services for Frank Russell Company based in New York. Prior to that she held the position of Managing Director of Frank Russell Australasia for five years and was previously Director, European Funds based in London. Ms Brooks is Chair of Synergy & TaikOz Limited. She is a member of Perpetual’s Audit Risk and Compliance Committee and Investment Committee.
Ms Brooks brings to the board over 20 years of senior funds management experience both in Australia and internationally.
E Paul McClintock, Independent Director BA, LLB (Age 59)Appointed as a director in April 2004. He is a director of investment banking firm McClintock Associates, a role he has held since 1985, apart from the period between July 2000 and March 2003, when he was Secretary to the Cabinet and Head of the Cabinet Policy Unit in the Australian Government. He is Chairman of Thales Australia, Medibank Private Limited and COAG Reform Council. He is Chairman of Perpetual’s Investment Committee and a member of the Nominations Committee and People and Remuneration Committee.
Mr McClintock brings to the board over 30 years experience as a legal adviser, investment banker and senior policy adviser to Government and corporations.
Listed company directorships held during the past three financial years:
b Symbion Health Limited from June 2005 to February 2008
b Macquarie Infrastructure Investment Management Limited (the manager of Macquarie Infrastructure Group) from May 2003 (current)
Elizabeth M Proust, Independent Director BA (Hons), LLB, FAICD (Age 57)Appointed as a director in January 2006. She was formerly Managing Director of Esanda, part of the ANZ Group. Prior to joining ANZ she was Secretary (CEO) of the Victorian Department of the Premier and Cabinet and Chief Executive Officer of the City of Melbourne. She is currently Chairman of the Melbourne Symphony Orchestra, Chairman of the Centre for Dialogue, La Trobe University, Chairman, Campus Council for the Royal Children’s Hospital, Melbourne and a director of Spotless Group Limited, Insurance Manufacturers of Australia Pty Ltd, Sinclair Knight Merz Pty Ltd and NonProfit Australia. She is Chairman of Perpetual’s People and Remuneration Committee and a member of the Audit Risk and Compliance Committee and Nominations Committee.
In addition to her skills from her leadership roles in significant change management programs, Ms Proust brings to the board her strengths in human resources, public affairs and strategy development, and her strong knowledge of board processes and governance through her many senior executive and board roles.
Listed company directorships held during the past three financial years:
b Spotless Group Limited from June 2008 (current)
Peter B Scott, Independent Director BE (Hons), M.Eng.Sc (Age 54)Appointed as a director in July 2005. He was formerly the Chief Executive Officer of MLC, an Executive General Manager of National Australia Bank and held a number of senior positions with Lend Lease. He is Chairman of Sinclair Knight Merz Management Limited and a director of Stockland Corporation Limited. Mr Scott is an advisory board member of Jones Lang LaSalle and Pilotlight Australia. He is a member of Perpetual’s Investment Committee and People and Remuneration Committee.
Mr Scott has more than 20 years of senior business experience in publicly listed companies and extensive knowledge of the wealth management industry.
Listed company directorships held during the past three financial years:
b Stockland Corporation Limited from August 2005 (current)
PERPETUAL LIMITED AND ITS CONTROLLED ENTITIES | 5
Alexander Stevens, Independent Director MB BS (Hons), FRACS, MBA (AGSM), MAICD (Age 49)Appointed as a director in June 2008. He was formerly Chief Executive Officer of PepsiCo Australia and New Zealand, and a member of the PepsiCo Asia Executive Committee. Prior to that he transitioned through several senior Executive roles within PepsiCo, in both Australia and the USA. Before joining PepsiCo, he held executive positions in Investment Banking at Ord Minnett (now JP Morgan) in both the Corporate Finance and Equity Markets divisions, and also at DBSM (now UBS). Mr Stevens is chairman of Crescent Food Group and a member of the Advisory Board to the Faculty of Medicine at the University of New South Wales. He is a Fellow of the Royal Australasian College of Surgeons and a member of the Australian Institute of Company Directors. He is a member of Perpetual’s Audit Risk and Compliance Committee and Investment Committee.
Mr Stevens brings to the Perpetual board a unique range of competencies in the areas of innovation, strategy and marketing that compliment the existing strong mix of skill sets and experience.
Philip J Twyman, Independent Director BSc, MBA, FIA, FIAA, FAICD (Age 64)Appointed as a director in November 2004. He was formerly Group Executive Director of the London-based Aviva plc, one of the world’s largest insurance groups with extensive fund management and wealth management businesses. Mr Twyman was also formerly Chairman of Morley Fund Management, a director of the Quilter Group, a UK private client stockbroker, and a senior executive of AMP in Australia. He has also been Chief Financial Officer of General Accident plc, Aviva plc and the AMP Group. Since returning to Australia, Mr Twyman has joined the boards of IAG Limited, Medibank Private Limited and the local boards of the Swiss Re Group. He is also Chairman of ANZ Lenders Mortgage Insurance Pty Ltd and Overseas Council Australia. He is Chairman of Perpetual’s Audit Risk and Compliance Committee and a member of the Investment Committee and Nominations Committee.
As an experienced international executive and director, Mr Twyman brings to the Perpetual board his background in financial services, investment and wealth management together with considerable practical experience in relation to the audit and risk management issues faced by public companies in Australia and overseas.
David M Deverall, Managing Director BE (Hons) MBA (Stanford) (Age 42)Appointed Managing Director in September 2003. He held senior management positions at Macquarie Bank Limited for seven years including Group Head of the Funds Management Group and Head of Strategy, Analysis and Planning. Prior to this he was a strategy consultant with Bain International and The LEK Partnership. Mr Deverall is Chair of the Investment and Financial Services Association (IFSA) and a member of the Executive Council of the Faculty of Business at the University of Technology Sydney.
Mr Deverall brings to Perpetual a combination of strategic ability and commercial drive and skills in product innovation and experience in management across a broad range of investment products and services. He also possesses an extensive overall understanding of the wealth management and wider financial services industry.
Alternate Director
Ivan D Holyman, Alternate Director BEc, LLB (Age 52)Alternate director for Mr Deverall from May 2006. He joined Perpetual in June 2004 as Chief Risk Officer. Prior to joining Perpetual he held the position of Chief Operating Officer Asia Pacific for UBS Warburg and spent 19 years with UBS AG (and its predecessor organisations) in various positions. Prior to UBS AG he spent two years with Samuel Montagu & Co Limited (a UK merchant bank) and four years with Blake Dawson Waldron, Solicitors.
Directors who retired or resigned during the year
Sandra V McPhee, Independent Director Dip Ed, FAICD (Age 62)Appointed as a director in April 2004 and retired on 30 October 2007 at the conclusion of the Annual General Meeting.
Listed company directorships held during the past three financial years:
b Primelife Corporation Limited from June 2003 to May 2005
b Coles Group Limited from July 2003 to November 2007
b AGL Energy Limited from October 2006 (current)
P John Nesbitt, Alternate Director BFA, CA (Age 49)Appointed as alternate director for Mr Savage on 15 November 2005 and resigned on 13 May 2008, following his appointment as Group Executive, Perpetual Private Wealth.
Company secretariesJoanne Hawkins BCom, LLB, Grad Dip CSP FCIS Appointed Company Secretary in June 2003. Prior to this, Ms Hawkins was Assistant Company Secretary of Macquarie Bank and Ord Minnett and was Company Secretary, National Bank of the Solomon Islands. Ms Hawkins has also worked as a solicitor and legal adviser in New Zealand.
Glenda Charles Grad Dip Corp Gov ASX Listed EntitiesJoined Perpetual in August 1994. She was appointed Assistant Company Secretary of Perpetual in 1999. Ms Charles has over ten years experience in company secretarial practice and administration and has worked in the financial services industry for over 20 years.
6 | PERPETUAL LIMITED AND ITS CONTROLLED ENTITIES
Review of operationsThe consolidated profit after tax for the financial year ended 30 June 2008 attributable to the members of Perpetual Limited was $128.8 million (2007: $182.1 million). The consolidated entities operating profit after tax and operating EBITDA represents profit and EBITDA from underlying operations. The calculations are shown in Tables 2 and 3 on page 7.
In the current financial year the consolidated entity sold its equity portfolio and a number of seed investments which yielded profit after tax of $24.1 million offset by an impairment charge of $3.0 million against available-for-sale investments held by Perpetual’s seed funds.
As originally disclosed to the market on 30 October 2007, Perpetual has booked mark-to-market losses as a result of its guarantee of the benchmark return to Exact Market Cash Fund investors. For the period ending 30 June 2008 the losses amounted to $36.9 million before tax ($25.8 million after tax). $9.0 million before tax of the losses (including $3.3 million of hedging costs) have been realised. The balance of the losses are unrealised and were caused by the sharp widening of credit spreads that resulted from the deterioration of liquidity within global credit markets. Exact Market Cash Fund losses before tax of $36.9 million are included in distributions and expenses relating to structured products on the Consolidated Income Statement.
The 2008 financial year experienced significant volatility in global credit and equity markets. Volatility in credit markets was driven by US sub-prime mortgage issues and its impact on liquidity within global credit markets. Global equity markets fell from historic highs on the back of disruptions in credit markets, growing global inflation and a historically high oil price. These factors have impacted each of Perpetual Limited’s business units. A review of our operating segments is below:
Perpetual Investments’ operating profit before tax decreased 28 per cent to $110.2 million for the twelve months to 30 June 2008 from $152.2 million over the same period to 30 June 2007. This result includes losses of $36.9 million before tax ($25.8 million after tax) associated with our Exact Market Cash Fund which is treated as a significant item. The lower result is largely driven by a fall in average Funds Under Management (“FUM”) from a decline in asset values through the downturn in global credit and equity markets and net outflows (particularly in credit products). FUM at 30 June 2008 was $30.3 billion, down from $39.1 billion at 30 June 2007.
Private Wealth’s operating profit before tax grew 8 per cent to $46.4 million for the twelve months to 30 June 2008 from $42.8 million over the same period to 30 June 2007. This increase was driven by higher average Funds Under Advice (“FUA”) in 2008 compared to the prior year. The prior year experienced strong net inflows towards the end of 2007 with the changes to maximum
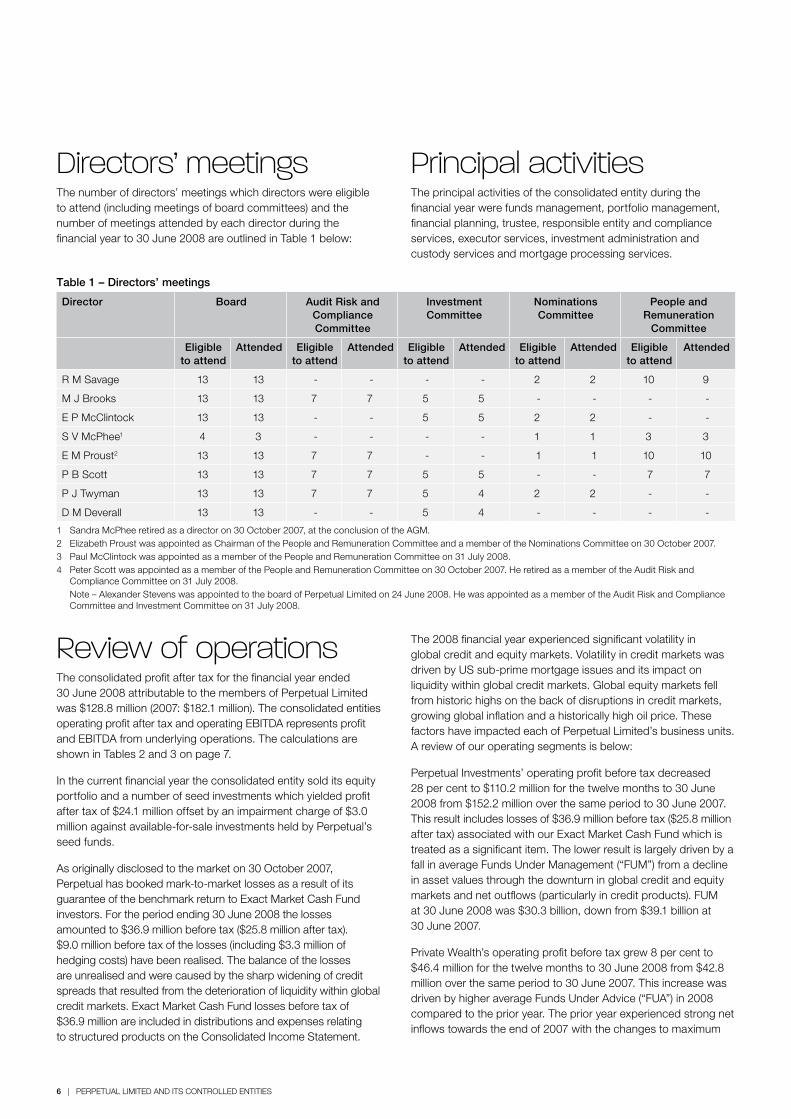
Directors’ meetingsThe number of directors’ meetings which directors were eligible to attend (including meetings of board committees) and the number of meetings attended by each director during the financial year to 30 June 2008 are outlined in Table 1 below:
Principal activitiesThe principal activities of the consolidated entity during the financial year were funds management, portfolio management, financial planning, trustee, responsible entity and compliance services, executor services, investment administration and custody services and mortgage processing services.
Table 1 – Directors’ meetings
Director Board Audit Risk and Compliance Committee
Investment Committee
Nominations Committee
People and Remuneration
Committee
Eligible to attend
Attended Eligible to attend
Attended Eligible to attend
Attended Eligible to attend
Attended Eligible to attend
Attended
R M Savage 13 13 - - - - 2 2 10 9
M J Brooks 13 13 7 7 5 5 - - - -
E P McClintock 13 13 - - 5 5 2 2 - -
S V McPhee1 4 3 - - - - 1 1 3 3
E M Proust2 13 13 7 7 - - 1 1 10 10
P B Scott 13 13 7 7 5 5 - - 7 7
P J Twyman 13 13 7 7 5 4 2 2 - -
D M Deverall 13 13 - - 5 4 - - - -
1 Sandra McPhee retired as a director on 30 October 2007, at the conclusion of the AGM.2 Elizabeth Proust was appointed as Chairman of the People and Remuneration Committee and a member of the Nominations Committee on 30 October 2007.3 Paul McClintock was appointed as a member of the People and Remuneration Committee on 31 July 2008.4 Peter Scott was appointed as a member of the People and Remuneration Committee on 30 October 2007. He retired as a member of the Audit Risk and
Compliance Committee on 31 July 2008. Note – Alexander Stevens was appointed to the board of Perpetual Limited on 24 June 2008. He was appointed as a member of the Audit Risk and Compliance
Committee and Investment Committee on 31 July 2008.
PERPETUAL LIMITED AND ITS CONTROLLED ENTITIES | 7
limits of superannuation contributions. FUA was $7.7 billion at 30 June 2008, down from $8.4 billion at 30 June 2007 with net inflows from new clients offset by declines in asset values from the downturn in global credit and equity markets.
Perpetual Corporate Trust’s operating profit before tax decreased 17 per cent to $29.5 million for the twelve months to 30 June 2008 from $35.7 million over the same period to 30 June 2007. The decrease is driven by two factors. Firstly the impact of the virtual closure of Australian securitisation markets has led to minimal new issuance of Residential Mortgage Backed Securities (“RMBS”) from banks and non-banks. This has prevented growth in Funds Under Administration (“FUA”) with existing FUA running off naturally through loan principal repayments. Secondly, the developing mortgage servicing business operates at a lower
margin to traditional RMBS Trustee services. The FUA for Perpetual Corporate Trust totalled $222.9 billion at 30 June 2008 an increase of 6 per cent from the balance of $210.1 billion at 30 June 2007. Approximately $29 billion of FUA comprises internally securitised bank RMBS able to be used by banks as an eligible security to access funding from the Reserve Bank of Australia. These securities are administered on a lower margin than traditional RMBS. Excluding these securities FUA declined 8 per cent to $193.7 billion.
The Support Services expense base has increased slightly to support our new businesses. Perpetual has continued to make good progress and is on track in implementing a program of work required to meet the obligations under the Anti-Money Laundering and Counter-Terrorism Financing (AML/CTF) Legislation.
DividendsDividends paid or declared by the company to members since the end of the previous financial year were:
Cents per share
Total amount $’000
Franked1
unfrankedDate of
payment
Declared and paid during the financial year 2008
Final 2007 ordinary 187 77,260 Franked 14 Sep 2007
Interim 2008 ordinary 189 79,216 Franked 14 Mar 2008
Total 156,476
Declared after end of year
After balance sheet date, the directors proposed the following dividend:
Final 2008 ordinary 141 59,153 Franked 12 Sep 2008
Total 59,153
1 Franked dividends declared and paid during the year were franked at 30 per cent
The financial effect of dividends declared after year end are not reflected in the 30 June 2008 financial statements and will be recognised in subsequent financial reports.
Table 2 – Reconciliation of operating profit after tax
30 June 2008
$’000
30 June 2007
$’000
Profit for the year 128,813 182,108
Less: Net profit on sale on investments (after tax) (21,145) (36,773)
Add: Exact Market Cash Fund losses (after tax) 25,796 -
Perpetual’s operating profit after tax 133,464 145,335
Table 3 – Reconciliation of operating EBITDA*
30 June 2008
$’000
30 June 2007
$’000
EBITDA for the year 190,211 237,993
Add: Exact Market Cash Fund losses (before tax) 36,852 -
Perpetual’s operating EBITDA 227,063 237,993
* EBITDA – Earnings before interest, tax, depreciation and amortisation

8 | PERPETUAL LIMITED AND ITS CONTROLLED ENTITIES
State of affairsSignificant changes in the state of affairs of the consolidated entity during the financial year were as follows:
b The consolidated entity continued to sell its equity portfolio and a number of seed investments in Perpetual managed funds during the year.
b The consolidated entity’s operating profit before tax decreased by $36.9 million as a result of its guarantee of the benchmark return to Exact Market Cash Fund investors.
b The consolidated entity acquired specified assets of National Lending Solutions Pty Limited and Argosy Wealth Consultants Pty Limited for cash consideration totalling $5.4 million.
Events subsequent to reporting dateSubsequent to reporting date, the consolidated entity completed the sale of its infrastructure funds business to Palisade Investment Partners on 21 July 2008.
Except for the above, the directors are not aware of any event or circumstance since the end of the financial year not otherwise dealt with in this report that has or may significantly affect the operations of the consolidated entity, the results of those operations or the state of affairs of the consolidated entity in subsequent financial years. Events subsequent to balance sheet date are set out in Note 36 to the consolidated Financial Statements.
Likely developmentsFurther information about likely developments in the operations of the consolidated entity and the expected results of those operations in future financial years has not been included in this report because disclosure of the information would be likely to result in unreasonable prejudice to the consolidated entity.
Environmental regulationThe consolidated entity acts as trustee or custodian for a number of property trusts, which have significant developments throughout Australia. These fiduciary operations are subject to environmental regulations under both Commonwealth and State legislation in relation to property developments. Approvals for commercial property developments are required by state planning authorities and environmental protection agencies. The licence requirements relate to air, noise, water and waste disposal. The responsible entity or manager of each of these property trusts is responsible for compliance and reporting under the government legislation.
The consolidated entity is not aware of any material non-compliance in relation to these licence requirements during the financial year.
Indemnification of directors and officersThe company and its controlled entities have resolved to indemnify the current directors and officers of the companies against all liabilities to another person (other than the company or a related body corporate) that may arise from their position as directors of the consolidated entity, except where the liabilities arise out of conduct involving a lack of good faith. The resolution stipulates that the company and its controlled entities will meet the full amount of any such liabilities, including costs and expenses.
InsuranceIn accordance with the provisions of the Corporations Act 2001 the company has a directors and officers’ liability policy which covers all directors and officers of the consolidated entity. The terms of the policy specifically prohibit disclosure of details of the amount of the insurance cover and the premium paid.
Corporate Responsibility Statement: Perpetual Limited (Perpetual or the Company)Perpetual’s board and management have a long-standing commitment to good corporate governance. The success of Perpetual’s core businesses – the management of other people’s money and the safekeeping of assets and securities – relies on a reputation of absolute trustworthiness. This statement sets out our approach to corporate governance. Copies of or summaries of documents that are underlined like this in this Corporate Governance Statement are set out on our website at www.perpetual.com.au
ASX Corporate Governance Council’s Corporate Governance Principles and Recommendations At Perpetual, good corporate governance includes a genuine commitment to the revised ASX Corporate Governance Council’s Principles and Recommendations (ASX Principles). We have made an early transition to reporting against the revised ASX Principles.
The board considers that it complies with all the ASX Principles and has done so throughout the reporting period.
PERPETUAL LIMITED AND ITS CONTROLLED ENTITIES | 9
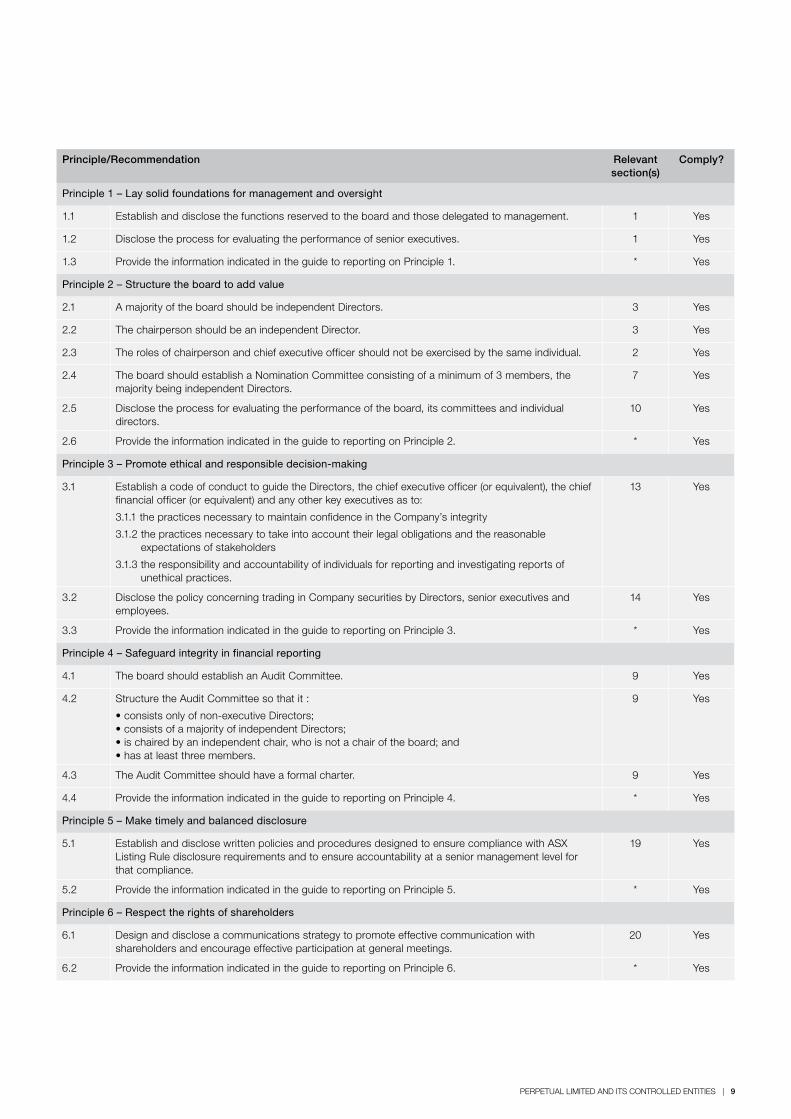
Principle/Recommendation Relevant section(s)
Comply?
Principle 1 – Lay solid foundations for management and oversight
1.1 Establish and disclose the functions reserved to the board and those delegated to management. 1 Yes
1.2 Disclose the process for evaluating the performance of senior executives. 1 Yes
1.3 Provide the information indicated in the guide to reporting on Principle 1. * Yes
Principle 2 – Structure the board to add value
2.1 A majority of the board should be independent Directors. 3 Yes
2.2 The chairperson should be an independent Director. 3 Yes
2.3 The roles of chairperson and chief executive officer should not be exercised by the same individual. 2 Yes
2.4 The board should establish a Nomination Committee consisting of a minimum of 3 members, the majority being independent Directors.
7 Yes
2.5 Disclose the process for evaluating the performance of the board, its committees and individual directors.
10 Yes
2.6 Provide the information indicated in the guide to reporting on Principle 2. * Yes
Principle 3 – Promote ethical and responsible decision-making
3.1 Establish a code of conduct to guide the Directors, the chief executive officer (or equivalent), the chief financial officer (or equivalent) and any other key executives as to:
3.1.1 the practices necessary to maintain confidence in the Company’s integrity
3.1.2 the practices necessary to take into account their legal obligations and the reasonable expectations of stakeholders
3.1.3 the responsibility and accountability of individuals for reporting and investigating reports of unethical practices.
13 Yes
3.2 Disclose the policy concerning trading in Company securities by Directors, senior executives and employees.
14 Yes
3.3 Provide the information indicated in the guide to reporting on Principle 3. * Yes
Principle 4 – Safeguard integrity in financial reporting
4.1 The board should establish an Audit Committee. 9 Yes
4.2 Structure the Audit Committee so that it :
• consists only of non-executive Directors; • consists of a majority of independent Directors; • is chaired by an independent chair, who is not a chair of the board; and • has at least three members.
9 Yes
4.3 The Audit Committee should have a formal charter. 9 Yes
4.4 Provide the information indicated in the guide to reporting on Principle 4. * Yes
Principle 5 – Make timely and balanced disclosure
5.1 Establish and disclose written policies and procedures designed to ensure compliance with ASX Listing Rule disclosure requirements and to ensure accountability at a senior management level for that compliance.
19 Yes
5.2 Provide the information indicated in the guide to reporting on Principle 5. * Yes
Principle 6 – Respect the rights of shareholders
6.1 Design and disclose a communications strategy to promote effective communication with shareholders and encourage effective participation at general meetings.
20 Yes
6.2 Provide the information indicated in the guide to reporting on Principle 6. * Yes
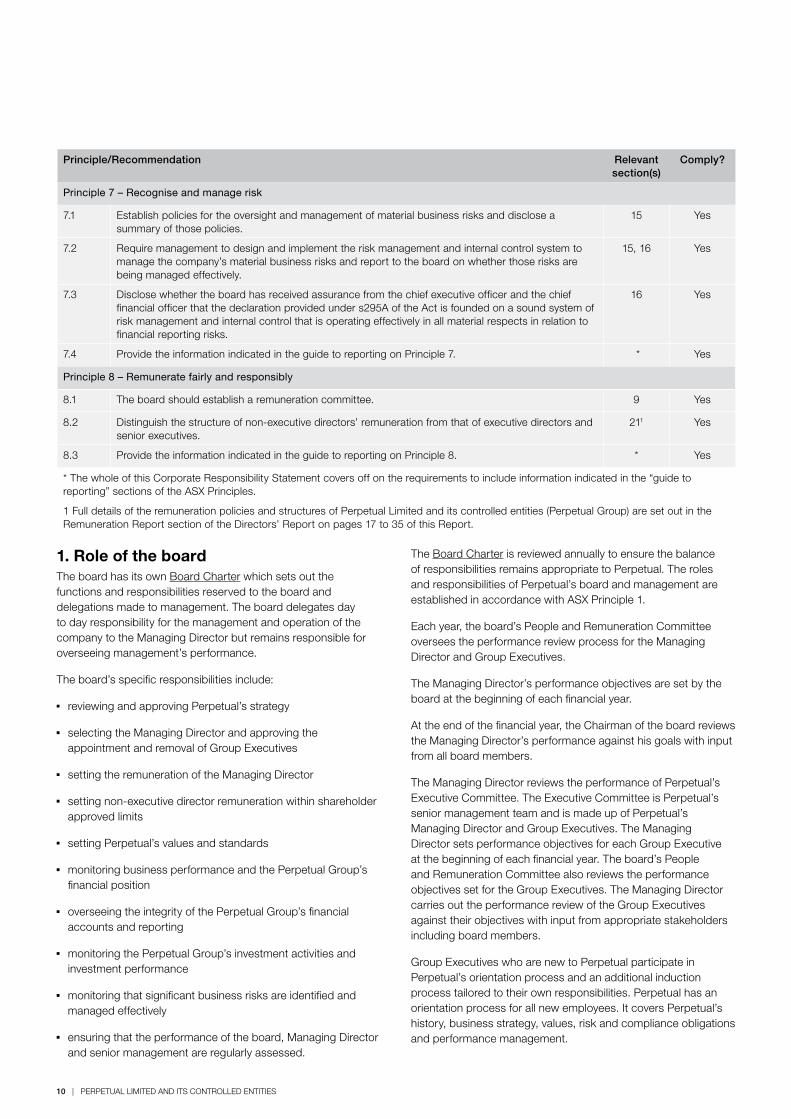
10 | PERPETUAL LIMITED AND ITS CONTROLLED ENTITIES
Principle/Recommendation Relevant section(s)
Comply?
Principle 7 – Recognise and manage risk
7.1 Establish policies for the oversight and management of material business risks and disclose a summary of those policies.
15 Yes
7.2 Require management to design and implement the risk management and internal control system to manage the company’s material business risks and report to the board on whether those risks are being managed effectively.
15, 16 Yes
7.3 Disclose whether the board has received assurance from the chief executive officer and the chief financial officer that the declaration provided under s295A of the Act is founded on a sound system of risk management and internal control that is operating effectively in all material respects in relation to financial reporting risks.
16 Yes
7.4 Provide the information indicated in the guide to reporting on Principle 7. * Yes
Principle 8 – Remunerate fairly and responsibly
8.1 The board should establish a remuneration committee. 9 Yes
8.2 Distinguish the structure of non-executive directors’ remuneration from that of executive directors and senior executives.
211 Yes
8.3 Provide the information indicated in the guide to reporting on Principle 8. * Yes
* The whole of this Corporate Responsibility Statement covers off on the requirements to include information indicated in the “guide to reporting” sections of the ASX Principles.
1 Full details of the remuneration policies and structures of Perpetual Limited and its controlled entities (Perpetual Group) are set out in the Remuneration Report section of the Directors’ Report on pages 17 to 35 of this Report.
1. Role of the board The board has its own Board Charter which sets out the functions and responsibilities reserved to the board and delegations made to management. The board delegates day to day responsibility for the management and operation of the company to the Managing Director but remains responsible for overseeing management’s performance.
The board’s specific responsibilities include:
b reviewing and approving Perpetual’s strategy
b selecting the Managing Director and approving the appointment and removal of Group Executives
b setting the remuneration of the Managing Director
b setting non-executive director remuneration within shareholder approved limits
b setting Perpetual’s values and standards
b monitoring business performance and the Perpetual Group’s financial position
b overseeing the integrity of the Perpetual Group’s financial accounts and reporting
b monitoring the Perpetual Group’s investment activities and investment performance
b monitoring that significant business risks are identified and managed effectively
b ensuring that the performance of the board, Managing Director and senior management are regularly assessed.
The Board Charter is reviewed annually to ensure the balance of responsibilities remains appropriate to Perpetual. The roles and responsibilities of Perpetual’s board and management are established in accordance with ASX Principle 1.
Each year, the board’s People and Remuneration Committee oversees the performance review process for the Managing Director and Group Executives.
The Managing Director’s performance objectives are set by the board at the beginning of each financial year.
At the end of the financial year, the Chairman of the board reviews the Managing Director’s performance against his goals with input from all board members.
The Managing Director reviews the performance of Perpetual’s Executive Committee. The Executive Committee is Perpetual’s senior management team and is made up of Perpetual’s Managing Director and Group Executives. The Managing Director sets performance objectives for each Group Executive at the beginning of each financial year. The board’s People and Remuneration Committee also reviews the performance objectives set for the Group Executives. The Managing Director carries out the performance review of the Group Executives against their objectives with input from appropriate stakeholders including board members.
Group Executives who are new to Perpetual participate in Perpetual’s orientation process and an additional induction process tailored to their own responsibilities. Perpetual has an orientation process for all new employees. It covers Perpetual’s history, business strategy, values, risk and compliance obligations and performance management.
PERPETUAL LIMITED AND ITS CONTROLLED ENTITIES | 11
New directors also participate in an induction process designed to familiarise them with Perpetual’s business, strategy, operations and management team.
2. Board structure The board currently comprises eight directors: seven non-executive directors and the Managing Director. The roles of Chairman and Managing Director are separate.
The Chairman is responsible for leadership of the board and ensuring the board performs its role and functions. He is also responsible for facilitating the effective contribution of directors by ensuring that each director fully participates in the board’s activities.
Details of the background, experience and professional skills of each director are set out on pages 4 to 5 of the Directors’ Report.
The structure of the board accords with ASX Principle 2.
3. Director independence The board considers all the non-executive directors to be independent directors, including the Chairman.
In assessing the independence of each director, the board considers, on a director-by-director basis, whether she or he has any relationships that would materially affect the director’s ability to exercise unfettered and independent judgment in the interests of Perpetual’s shareholders. Consistent with the emphasis on ‘substance over form’ advocated by the ASX Principles, Perpetual takes a qualitative approach to materiality rather than setting strict quantitative thresholds, and considers each director’s individual circumstances on its merits.
The independence of each director is formally reviewed annually in May and at any time when a change occurs that may affect a director’s independence. Non-executive directors also formally advise the Chairman of any relevant information, and update the Chairman if their circumstances change at any time.
In determining the position of individual directors, the board has considered the relevant elements of the definition of independence adopted by the board. These elements include:
b having a substantial shareholding in Perpetual or being an officer of a company which has a substantial shareholding in Perpetual (or otherwise associated with a substantial shareholder of Perpetual)
b being employed by the Perpetual Group at any stage and in any capacity within the previous three years
b being involved with the Perpetual Group in an advising or consulting role at any time within the previous three years
b being (or being associated with) a material supplier or customer of the Perpetual Group
b being in a material contractual relationship with the Perpetual Group (other than as a director).
Paul McClintock is a director of Macquarie Infrastructure Investment Management Limited, a company which operates in the financial services sector and whose businesses may, in part, compete with Perpetual.
Sandra McPhee who retired from the board in October 2007 had a minority ownership interest in AMAL Asset Management Limited which is a commercial mortgage servicing company whose business may compete with aspects of Perpetual’s Corporate Trust business.
In considering whether such circumstances materially affect the independence of individual directors, the board considers the extent of competition relative to each organisation’s total business, and the frequency with which directors may be required to absent themselves from board deliberations by reason of conflicts of interest.
In the case of Paul McClintock and Sandra McPhee, the board considered that both directors were sufficiently removed from Perpetual’s operations so as to make any conflicts of interest minimal in the context of both Perpetual and their outside roles.
Although the board was able to satisfy itself of her independence as a director, Sandra McPhee subsequently chose to resign from the board of Perpetual to avoid any potential conflict of interest with her ownership interest in AMAL Asset Management Limited.
From time to time, funds managed by the Perpetual Group may take holdings, including substantial holdings in securities of listed entities. Perpetual directors may also serve as non-executive directors on the boards of these entities. This factor alone is not considered to impact director independence as decisions as to stock selection are not made by the board of Perpetual but by Perpetual’s asset management teams in accordance with client or fund investment mandates.
It is the board’s view that no directors currently hold other positions that materially affect their ability to exercise independent judgement in the interests of Perpetual shareholders.
4. Contracts with directors In the 2008 financial year, no director disclosed a material personal interest in any contract entered into by any member of the Perpetual Group other than the remuneration paid to the directors as outlined in this Annual Report, and the deeds of indemnity described below.
5. Indemnity of directors and officers Perpetual has entered into deeds to indemnify directors and officers of the Perpetual Group, to the extent permissible by law from all liabilities incurred as directors or officers. Liabilities to the Perpetual Group, and liabilities that arise out of conduct that was not in good faith are not covered by the indemnities. In addition, Perpetual has directors and officers’ insurance against claims that Perpetual may be liable to pay under these indemnities. This policy also insures directors and officers directly.
12 | PERPETUAL LIMITED AND ITS CONTROLLED ENTITIES
6. Board access to information and independent advice Directors receive regular updates on changes in the regulatory environment affecting Perpetual and the financial services industry. Directors are also encouraged to attend relevant conferences and seminars. In 2008, education sessions were held for the board in relation to trends and good practice in risk management as well as risk management practices within Perpetual.
Non-executive directors regularly confer without management present and the Chairman presides over these sessions. All directors have unrestricted access to company records and information. We have a formal policy allowing the board or an individual director to seek independent professional advice at the Perpetual Group’s expense, provided that the director has obtained the prior approval of the Chairman, or if the relevant director is the Chairman, the prior approval of a majority of Perpetual’s non-executive directors. In the 2008 financial year no director sought professional advice under this policy.
7. Nomination, appointment, re-election and retirement of directors Consistent with ASX Principle 2, the board has a Nominations Committee with its own Terms of Reference.
The Nominations Committee is responsible for reviewing the size and structure of the board. The aim is to ensure that the board comprises an appropriate mix of skills and experience. As set out in Perpetual’s Policy on the Appointment of Directors, if a board vacancy arises, the board will appoint the most suitable candidate, having regard to the recommendation of the Nominations Committee. External consultants may be engaged to assist the board to identify qualified candidates. A director appointed to fill a casual vacancy must stand for election at the next Annual General Meeting.
In June 2008, Alexander Stevens joined the board. He was invited to join the board because of his competencies in the areas of innovation, strategy and marketing which complement and add to the existing skills on the board.
On his appointment, Alexander Stevens received a detailed letter of appointment and participated in a comprehensive induction program designed to familiarise him with Perpetual’s business, strategy, operations and management team.
As specified by the ASX Listing Rules, directors who have been in office without re-election for three years since their last appointment must retire and seek re-election at Perpetual’s Annual General Meeting. In order to revitalise the board, directors agree not to seek re-election after three terms of three years unless the board requests them to do so. The nine year principle does not displace shareholders’ rights to vote on the appointment and removal of directors, as set out in the ASX Listing Rules and the Corporations Act 2001.
8. Meetings of the board In the 2008 financial year, the board met 13 times, including a strategic planning session held over two days. The board receives monthly performance, operations and compliance reports from the Managing Director, the Chief Financial Officer, the Chief Risk Officer and the heads of each business division. The board also receives reports and updates on strategic issues.
In addition, directors spend time reading and analysing board papers and reports submitted by management and they engage in regular informal discussions with management. The views of the Chairman and the non-executive directors are canvassed regularly by the Managing Director and the executive team on a range of strategic and operational issues. The Chief Financial Officer and Company Secretary attend all board meetings. Other senior executives attend board and committee meetings to report on particular issues and to engage in discussion on these issues.
9. Board committees A key part of the board’s governance structure is the four board committees. Each committee has written Terms of Reference.
Unless more frequent meetings are required, all committees except the Nominations Committee generally meet at least quarterly. The Nominations Committee meets at least twice a year. The Managing Director attends all committee meetings except where matters relating to his own remuneration and performance are discussed. Attendance of directors at board and committee meetings during the year is set out in the Directors’ Report on page 6.
There are four standing committees of the board. Their membership (as at the date of this report) and key responsibilities are set out below.
Audit Risk and Compliance Committee Members: Philip Twyman (Chairman), Meredith Brooks, Elizabeth Proust and Alexander Stevens.
Changes to the committee since last Report:
Alexander Stevens: appointed 31 July 2008Peter Scott: retired 31 July 2008Sandra McPhee: retired 30 October 2007
The committee’s role is to oversee the Perpetual Group’s accounting policies and practices, the integrity of financial statements and reports, the scope, quality and independence of our external audit arrangements, the monitoring of the internal audit function, the effectiveness of risk management policies and practices and the adequacy of our insurance programs. This committee is also responsible for monitoring overall legal and regulatory compliance.
All members of the committee are independent non-executive directors and are required to be financially literate. At least one member must have accounting or finance related expertise. Members are also required to have an understanding of the
PERPETUAL LIMITED AND ITS CONTROLLED ENTITIES | 13
financial services industry in which Perpetual operates. The qualifications and skills of the members of the committee are set out on page 4 to 5 of the Directors’ Report.
Investment Committee Members: Paul McClintock (Chairman), Meredith Brooks, Peter Scott, Philip Twyman and Alexander Stevens.
Changes to the committee since last Report:
Alexander Stevens: appointed 31 July 2008David Deverall: retired 31 July 2008
The committee’s role is to monitor management to ensure that it has in place, and carries out, appropriate investment strategies and processes for the investment activities conducted both for third parties and on the Perpetual Group’s own behalf. This committee does not select securities for individual Perpetual funds as selection is carried out by Perpetual’s asset management teams. The committee has no direct involvement in selection of securities.
People and Remuneration Committee Members: Elizabeth Proust (Chairman), Robert Savage, Peter Scott and Paul McClintock.
Changes to the committee since last Report:
Paul McClintock: appointed 31 July 2008Sandra McPhee: retired 30 October 2007
The committee’s role is to monitor the Perpetual Group’s people and culture policies and practices, and to assist the Managing Director to implement fair, effective and market competitive remuneration and incentive programs designed to retain high calibre employees and which demonstrate a clear relationship between performance and remuneration. After considering advice from external remuneration advisers, the committee recommends remuneration for non-executive directors, the Managing Director, Executive Committee members and executives to the board, with whom ultimate responsibility for remuneration exists. The committee also reviews succession and career plans for key executives. All members of the committee are independent non-executive directors.
Nominations Committee Members: Robert Savage (Chairman), Paul McClintock, Elizabeth Proust and Philip Twyman
Changes to the committee since last Report:
Sandra McPhee: retired 30 October 2007.
The committee’s role is to recommend to the board nominees for appointment/election (including re-election of existing board members) and to review at least annually the size and structure of the board to ensure that the board comprises appropriately qualified and experienced people. This committee is also
responsible for the formal evaluation of the board’s performance as a whole. All members of the committee are independent non-executive directors.
10. Board performance In 2007, the board implemented a two year process for board review consisting of a facilitated review every alternate year and reviews carried out by the Chairman in each other year.
In 2008, a board review was carried out by the Chairman with particular emphasis on director performance. The Chairman reviewed with each director their individual performance and after obtaining feedback from the other directors, a nominated director has reviewed the Chairman’s performance.
The board review process aims to ensure that individual directors continue to contribute effectively to the board’s performance and that the board as a whole and its committees continue to function effectively.
11. Company Secretaries The board has access to the services and advice of Joanne Hawkins, the Company Secretary and Glenda Charles, Assistant Company Secretary. The Company Secretary is accountable to the board on governance matters. Details of the experience and qualifications of Joanne Hawkins and Glenda Charles are set out in the Directors’ Report on page 5.
12. Perpetual’s subsidiary boards The boards of Perpetual’s subsidiaries are generally made up of executive directors. The exceptions are Perpetual Superannuation Limited, which carries out Perpetual’s superannuation activities, and PI Investment Management Limited, which operates Perpetual’s global equities business. The boards of both these companies include non-executive directors. These non-executives are not directors of any other Perpetual Group companies. Perpetual’s corporate governance policies are applied to its subsidiaries but adapted to reflect the size and nature of each subsidiary’s operations and to recognise the fact that the boards of most subsidiaries do not comprise independent directors. The subsidiary boards are a key component of Perpetual’s Risk Management Framework. Focus was maintained on the subsidiary board process during 2008 ensuring appropriate governance and reporting arrangements.
In 2008, Perpetual’s superannuation activities have been consolidated and are carried out through the wholly owned subsidiary Perpetual Superannuation Limited. Superannuation activities were previously carried out by several companies in the Perpetual Group. The internal Office of the Superannuation Trustee assists Perpetual Superannuation Limited to consider and act in the best interests of fund members. The Office of the Superannuation Trustee also aims to develop increased awareness of trustee obligations throughout Perpetual.
14 | PERPETUAL LIMITED AND ITS CONTROLLED ENTITIES
13. Ethical conduct Perpetual has a Code of Conduct which draws from and expands on Perpetual’s Values. The Code of Conduct applies to all directors, executives and employees and is designed to assist them in making ethical business decisions. It is based on the following principles:
b acting with integrity
b managing conflicts of interests appropriately
b upholding the spirit as well as the letter of the law
b commitment to our clients and consistently delivering shareholder value
b respecting privacy and confidentiality
b maintaining a fair and safe work environment
b protecting those who report wrongdoing.
Additional policies deal with a range of ethical issues such as the obligation to maintain client confidentiality and to protect company information, the need to make full and timely disclosure of any price sensitive information and to provide a safe workplace for our employees, which is free from discrimination of any kind. The Code of Conduct and associated policies are in keeping with ASX Principle 3.
Perpetual’s Chief Risk Officer is Perpetual’s Code of Conduct ombudsman and is available to all staff for a confidential discussion in relation to Code of Conduct matters. All new Perpetual employees are required to familiarise themselves with the Code of Conduct as part of their induction training requirements.
Perpetual has a Whistleblowing Policy to protect employees who make good faith reports of wrongdoing, prejudice or disadvantage. As part of Perpetual’s Whistleblowing Policy, a third party has been engaged to provide an independent and confidential hotline for Perpetual employees who prefer to raise their concern with an external organisation.
14. Share dealings by directors and employees Our overriding policy is that there should be no dealings in Perpetual’s shares by any director or employee who is in possession of price sensitive information or where the dealing is for short-term or speculative gain. Provided they do not have price sensitive information, directors and employees are permitted to deal in Perpetual’s shares only in one month periods commencing:
b 24 hours after announcement of the half-year and full-year financial results
b 24 hours after release of the Chairman’s May Letter to Shareholders
b at the conclusion of the Annual General Meeting.
The Sharedealing Policy requires prior approval for any share dealings from the Chairman in the case of directors, from a nominated director in the case of the Chairman and from the Managing Director in the case of senior executives. Prior approval is also required from the Managing Director or Company Secretary in the case of certain employees who are likely to have access to potentially price sensitive information through their position in Perpetual.
Perpetual’s Sharedealing Policy prohibits employees and directors from entering into ‘hedging arrangements’ in relation to Perpetual securities. Perpetual employees cannot trade in financial products issued over Perpetual securities by third parties or trade in any associated products which limit the economic risk of holding Perpetual securities.
Employees who may have access to sensitive information in relation to Perpetual’s investment activities (such as the asset management team) are required to obtain prior approval for personal trading in any securities.
Perpetual’s Sharedealing Policy covers the suggested contents in ASX Principle 3.2 for a policy of its type.
15. Risk management The board is committed to effective risk management and all executives are accountable for managing risk within their area of responsibility. They are also required to manage risk as part of their business objectives and Perpetual’s approach to risk management is integrated across business processes.
Consistent with ASX Principle 7, Perpetual has specific policies and processes which deal with the key areas of business risk, financial risk and compliance risk. These policies cover areas such as information security, business continuity, compliance and regulatory obligations, whistleblowing, business operations, human resources requirements and occupational health and safety. Perpetual’s Risk Management Framework is available on Perpetual’s website.
Perpetual’s Chief Risk Officer leads a centralised group of risk management professionals. The Risk Group provides the framework, tools, advice and assistance to enable business units and management to effectively identify, assess and manage risk, and through monitoring, provides the board and its committees with assurance of the effectiveness and efficiency of risk management. The Risk Group includes Perpetual’s legal team which ensure Perpetual’s legal risk is effectively managed.
The board is responsible for compliance with regulatory, prudential, legal and ethical standards and monitoring that management has an appropriate risk framework in place and compliance with regulatory, prudential, legal and ethical standards. The board reviews Perpetual’s key risks, semi-annually. The board review of key risks is underpinned by facilitated workshops coordinated by the Risk Group. The workshops promote open discussion between management and the Risk Group enabling key risks, controls and any weaknesses or gaps to be identified and managed.
PERPETUAL LIMITED AND ITS CONTROLLED ENTITIES | 15
The Audit Risk and Compliance Committee oversees the implementation and maintenance of Perpetual’s risk management program. Regular reports are received by both the board and the Audit Risk and Compliance Committee from management on risk matters throughout the year.
Perpetual’s Risk Management Framework also includes an internal audit function. The Head of Internal Audit reports to the Audit Risk and Compliance Committee and is independent from the external auditor. The mission of the Internal Audit function is to provide independent assurance over the effectiveness of Perpetual’s risk management, internal control, and governance processes. The Internal Audit team do not make management decisions or engage in other activities which could be perceived as compromising their independence.
Each of the Chief Risk Officer, Chief Financial Officer and the Head of Internal Audit has the right to meet with the Audit Risk and Compliance Committee in the absence of other management.
Together with the Managing Director and Chief Financial Officer, Perpetual’s Chief Risk Officer reports to the board on the effectiveness of Perpetual’s management of its material business risks in accordance with ASX Principle 7. The board received this report in 2008 together with the statements discussed in more detail in section 16 below.
16. Financial Reporting The board has adopted policies designed to ensure that the Perpetual Group’s financial reports:
b are true and fair
b meet high standards of disclosure and audit integrity
b when read with the Perpetual Group’s other reports to shareholders, provide all material information necessary to understand the Perpetual Group’s financial performance and position.
To underpin the integrity of Perpetual’s financial reporting and risk management framework, it is Perpetual’s practice for the Managing Director and Chief Financial Officer to report to the board in writing that, in their respective opinions:
b the financial records of the Company have been properly maintained in accordance with section 286 of the Corporations Act 2001
b the financial statements and notes thereto comply with the accounting standards and give a true and fair view of the financial position and performance of the Company and consolidated entity.
The Managing Director, Chief Financial Officer and Chief Risk Officer also state to the board in writing that, in their respective opinions:
b the statements made regarding the integrity of the financial statements are founded on a sound system of risk management and internal compliance and control systems which implement the policies adopted by the board of directors
b the risk management and internal compliance and control systems, to the extent they relate to financial reporting, are operating effectively and efficiently, in all material respects, based on the risk management framework adopted by the Company
b the Company’s material business risks (including non-financial risks) are being managed effectively.
The statements referred to above are supported by written statements from senior executives, detailed financial analysis and Perpetual’s risk management, compliance and control systems. As previously noted, the Chief Financial Officer is present when the board considers financial matters, as he attends all board meetings. The statements made by the Managing Director, Chief Financial Officer and Chief Risk Officer are consistent with ASX Recommendations 7.2 and 7.3.
17. Audit process The Perpetual Group’s financial accounts are subject to an annual audit by an independent, professional auditor, who also reviews the half yearly financial statements. The Audit Risk and Compliance Committee oversees this process on behalf of the board, in accordance with its Terms of Reference.
The external auditor attends each meeting of the committee, and it is the committee’s policy to meet with the auditor for part of these meetings in the absence of management. The committee chairman meets with our audit partner at least once every quarter, also in the absence of management. The auditor has a standing invitation to meet with the committee, its chairman or with Perpetual’s Chairman in the absence of management. The auditor attends board meetings at which the annual and half yearly accounts are adopted.
18. Auditor independence The board has in place policies relating to the quality and independence of the external auditor. Those policies include the following:
b the Perpetual Group’s audit must be tendered at least every seven years and after the fifth year, the board must make a positive decision each year on whether to retain existing arrangements
b the audit partner must be rotated at least every five years, with a two year gap before a partner may be reappointed
b former audit partners and audit firm employees involved in our audit cannot become directors or employees of Perpetual Group companies for at least two years after their employment with the auditor ceases
b In addition, our policies prohibit our external audit firm being engaged to provide non-audit services that may materially conflict with its ability to exercise objective and impartial judgment on issues that may arise within our audit, such as:
16 | PERPETUAL LIMITED AND ITS CONTROLLED ENTITIES
– services related to mergers and acquisitions
– tax planning and strategy
– senior management recruitment
– significant valuations and appraisals
– design and implementation of financial information systems.
In the 2008 financial year, the greater part of fees paid to our external auditor for work other than audit of Perpetual Group accounts was for audit services in relation to investment funds of which Perpetual companies are the responsible entity and/or manager. It is the board’s view that these audit services are appropriately provided by the external auditor and are not services of a kind that might impair the impartial judgement of the external auditor in relation to the Perpetual Group’s audit.
The current external auditor is KPMG. The lead audit partner for the 2008 financial year was Dr Andries Terblanché and the engagement partner was Brendan Twining. This is the fourth year that Andries Terblanché has supervised our audit and the first year that Brendan Twining has acted as engagement partner.
19. Market Disclosure Perpetual has a Market Disclosure Policy to ensure compliance with its continuous disclosure obligations under ASX Listing Rule 3.1 and the Corporations Act 2001. The Managing Director, Chief Financial Officer, Chief Risk Officer and Company Secretary are members of the Continuous Disclosure Committee responsible for deciding information that is required to be disclosed to the ASX. Perpetual ensures that all senior executives give regular sign offs as to whether there are matters that require disclosure to the ASX. The board considers its disclosure obligations at each scheduled board meeting. Perpetual’s Market Disclosure Policy contains the matters recommended by ASX Principle 5.
Perpetual’s website includes copies of announcements lodged with ASX by Perpetual. Perpetual also webcasts scheduled analysts’ briefings and these can be found on the Company’s website along with media releases, briefings and annual reports for the last five years.
20. Shareholders The board is committed to ensuring that shareholders are fully informed of material matters that affect Perpetual’s position and prospects. It seeks to accomplish this through a strategy which includes:
b the Half Year Results released in February each year
b the Chairman’s May Letter to Shareholders each year
b the Annual Report released in August each year
b the Chairman’s and Managing Director’s addresses to the Annual General Meeting
b the posting of significant information on Perpetual’s website as soon as it is disclosed to the market.
Perpetual holds its Annual General Meeting in October and a copy of the notice of Annual General Meeting is posted on the Perpetual website. The board encourages shareholders to attend the Annual General Meeting or to appoint a proxy to vote on their behalf if they are unable to attend. The formal addresses at the Annual General Meeting are webcast for those shareholders who are unable to be present. In accordance with ASX Principle 6.2 and the Corporations Act 2001, a representative of the external auditor, KPMG, attends the Annual General Meeting for the purpose of answering shareholder questions about the audit report and audit process.
21. Remuneration Perpetual has formed a People and Remuneration Committee as recommended by the ASX Principles (Recommendation 8.1). Its role is set out on page 17 of this report. Details of board and executive remuneration are set out in the Remuneration Report which is part of the Directors’ Report section of the Annual Report and commences on page 17. The structure of board and executive remuneration is clearly distinguished in accordance with the ASX Principles (Recommendation 8.2).
22. Stakeholders At Perpetual we take advantage of opportunities to build our social, environmental and financial performance in ways that enhance our core values and business sustainability. We draw on our expertise, knowledge and experience to do this.
A management committee called the Sustainability Committee was established in November 2007. The committee includes the Managing Director of Perpetual as its chair. The committee is responsible for overseeing the strategic direction for Perpetual’s sustainability initiatives and monitoring the implementation and continued development of the framework. The committee monitors initiatives such as participation in the Carbon Disclosure Project and Perpetual’s philanthropic activities as discussed below.
Perpetual participated in the Carbon Disclosure Project for the first time in 2007 and has participated again in 2008. This is an example of Perpetual seeking to develop environmental performance in a transparent manner. As part of our 2008 response, we have calculated our greenhouse gas emissions and will be developing emission reduction plans. Our plans will focus on reducing Perpetual’s consumption of electricity.
Perpetual operates one of the oldest philanthropic businesses in Australia. Perpetual has also established the Perpetual Foundation as a public charitable trust in 1998. It brings together the generosity of individuals and organisations with the expertise and resources of Perpetual, providing the community with valuable support. Perpetual’s key objective is to promote thought leadership and best practice in philanthropy.
PERPETUAL LIMITED AND ITS CONTROLLED ENTITIES | 17
Through the Perpetual Foundation we are able to offer opportunities for discussion in the areas of philanthropy and the social economy by providing forums and commissioning research. Perpetual places particular emphasis on improved leadership, management and governance of non-profit organisations and their capacity to achieve sustainability for the long term benefit of society.
Perpetual’s key asset is its people. We recognise business sustainability as a key component to maximising long-term value for our stakeholders. We drive business sustainability by drawing on our expertise, knowledge and experience to promote best practice and to debate and foster change on issues which impact our people, our community and our environment.
Perpetual also supports its own employees who wish to give back to the community through its Staff Giving program. Through the program, Perpetual employees are able to make regular donations to ten community organisations from their pre-tax pay. Perpetual matches employees’ donations through the Perpetual Foundation.
In the 2008 financial year Perpetual did not make any political donations.
Shareholders who wish to know more about Perpetual’s corporate policies are invited to review our website www.perpetual.com.au or to contact us by email at [email protected]. Comments and suggestions from shareholders are welcomed.
Remuneration reportOur remuneration policy aims to unlock the entrepreneurial spirit of our people and to align incentives with shareholder wealth creation. Remuneration is linked to performance and aligns short-term incentives, such as bonuses, and long-term incentives with key business outcomes such as investment returns, company profit growth and total shareholder return.
This report sets out remuneration arrangements for all Perpetual employees, including directors and executives. The information provided in this remuneration report has been audited as required by section 308(3c) of the Corporations Act 2001.
Perpetual’s remuneration philosophy and objectives The People and Remuneration Committee (PARC), formerly the Human Resources and Remuneration Committee (HRRC), reviews human resource management policies and practices, decides whether they are appropriate and makes recommendations to the Board of Directors (Board) on remuneration policies for senior employees. It also reviews succession and development plans for key senior employees.
The committee:
b recommends changes in the form, structure and level of Board remuneration
b establishes and reviews the Managing Director’s remuneration
b reviews remuneration terms and performance measures
b reviews and approves remuneration arrangements for key senior employees
b determines whether long-term incentive performance hurdles are satisfied
b liaises with the Audit Risk and Compliance Committee (ARCC) to ensure disclosure requirements are met
The committee has approved a remuneration policy for employees based on the following five key principles:
b Variable pay should be a feature of all employees’ remuneration. For senior employees variable pay forms a significant part of overall remuneration. Fixed remuneration should be competitive
b Variable pay is linked to shareholder wealth creation and individuals are clear on performance criteria
18 | PERPETUAL LIMITED AND ITS CONTROLLED ENTITIES
b Short-term incentives (STI) payments are based on yearly performance and uncapped to allow for recognition of performance
b STI payments should be made out of the operating profits of the company
b Equity participation within the company should be increased to encourage a sense of ownership, be appropriately tied to stretch hurdles and encourage retention of key individuals
One of the key principles behind the remuneration policy is that it encourages a sense of ownership in the company by our employees.
The Board has reaffirmed these principles and the approach to remuneration for the 2008 financial year.
Remuneration approach We believe Perpetual’s performance and remuneration management policy:
b aligns employee remuneration with shareholder wealth creation
b actively supports the successful execution of our business strategy
b supports the development of an entrepreneurial, team-based culture
b assists in attracting and retaining senior employees
b is competitive with contemporary marketplace practice
b provides clarity and transparency
b aligns with the company’s commitment to good corporate governance
To align employee rewards with shareholder value, the company promotes employee share participation plans for all employees and issues long-term incentive shares to senior employees.
Senior employee remuneration structure overview The way we structure remuneration for senior employees comprises three components:
b a fixed remuneration component (fixed remuneration)
b a short-term incentive component (STI)
b a component related to longer-term performance and retention (LTI)
The PARC seeks to ensure senior employee remuneration is fair, reasonable and performance is rewarded.
Fixed remuneration Fixed remuneration is typically set around the market median level for each employee. We develop remuneration policies by comparing our company to other Australian-based financial institutions. In some circumstances, such as for specialist technical positions, we may compare the position with a more targeted group of comparable companies.
We calculate fixed remuneration on a ‘total cost to company’ basis, including the cost of employee benefits such as motor vehicles, superannuation and car parking, together with fringe benefits tax (FBT) applicable to those benefits.
There are no guaranteed increases to fixed remuneration in employee contracts.
Short-term incentives
Short-term incentives are bonuses awarded to employees over the short term.
Four principles define our approach:
b All permanent employees are eligible to receive a STI payment
b Incentive payments are a significant part of senior employees’ remuneration
b Incentive payments for most employees are funded out of operating profits linking STI to shareholder wealth creation. Incentive payments for other staff are based on achievement of performance targets.
b Individual incentive payments are uncapped to allow for recognition of performance that significantly exceeds expectations
STI vest to employees immediately.
How STI are funded and paid
A profit pool is created each year to fund STI for the majority of all employees. Its size is determined by the company’s operating profit after tax.
Each year, a Profit Participation Pool (PPP) is created to fund STI for all employees. Some asset management employees, whose STI is linked explicitly to investment performance, are excluded from this pool. This is also the case for certain members of the Perpetual Private Wealth team, whose STI is directly linked to sales performance.
The PPP is linked to profit performance, where increased profits fund a larger pool and decreased profits fund a smaller pool.
PERPETUAL LIMITED AND ITS CONTROLLED ENTITIES | 19
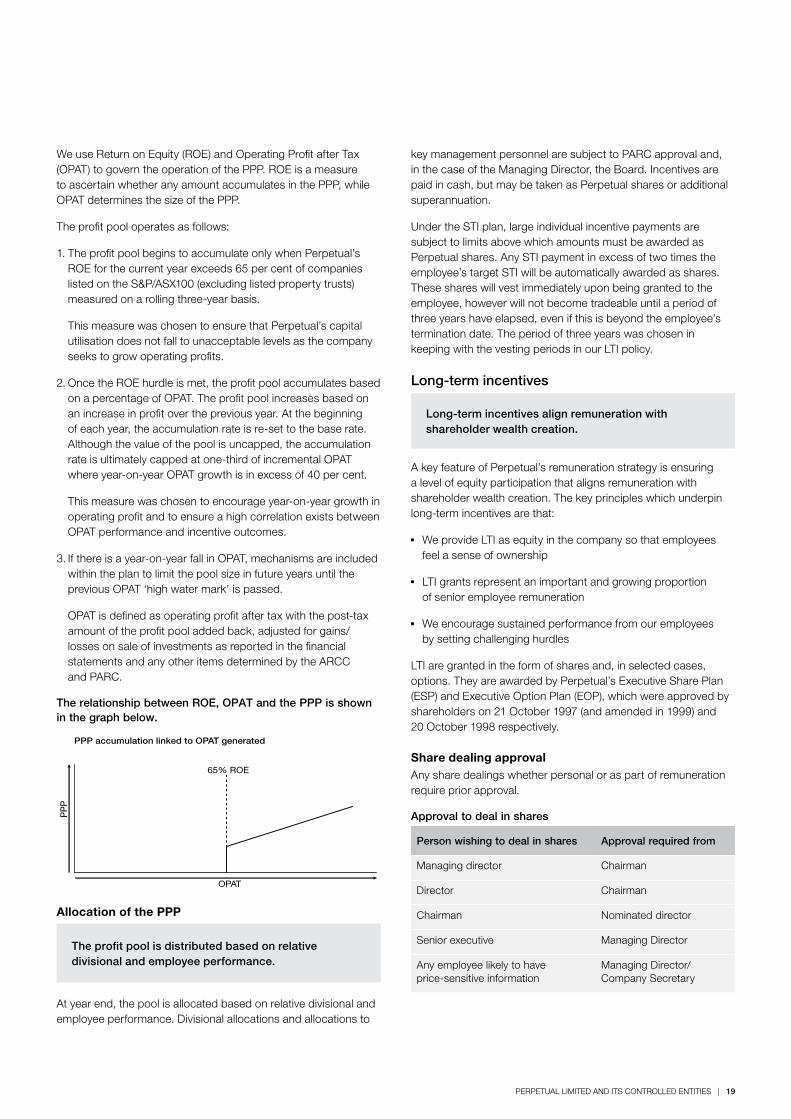
We use Return on Equity (ROE) and Operating Profit after Tax (OPAT) to govern the operation of the PPP. ROE is a measure to ascertain whether any amount accumulates in the PPP, while OPAT determines the size of the PPP.
The profit pool operates as follows:
1. The profit pool begins to accumulate only when Perpetual’s ROE for the current year exceeds 65 per cent of companies listed on the S&P/ASX100 (excluding listed property trusts) measured on a rolling three-year basis.
This measure was chosen to ensure that Perpetual’s capital utilisation does not fall to unacceptable levels as the company seeks to grow operating profits.
2. Once the ROE hurdle is met, the profit pool accumulates based on a percentage of OPAT. The profit pool increases based on an increase in profit over the previous year. At the beginning of each year, the accumulation rate is re-set to the base rate. Although the value of the pool is uncapped, the accumulation rate is ultimately capped at one-third of incremental OPAT where year-on-year OPAT growth is in excess of 40 per cent.
This measure was chosen to encourage year-on-year growth in operating profit and to ensure a high correlation exists between OPAT performance and incentive outcomes.
3. If there is a year-on-year fall in OPAT, mechanisms are included within the plan to limit the pool size in future years until the previous OPAT ‘high water mark’ is passed.
OPAT is defined as operating profit after tax with the post-tax amount of the profit pool added back, adjusted for gains/losses on sale of investments as reported in the financial statements and any other items determined by the ARCC and PARC.
The relationship between ROE, OPAT and the PPP is shown in the graph below.
PPP accumulation linked to OPAT generated
PP
P
OPAT
65% ROE
Allocation of the PPP
The profit pool is distributed based on relative divisional and employee performance.
At year end, the pool is allocated based on relative divisional and employee performance. Divisional allocations and allocations to
key management personnel are subject to PARC approval and, in the case of the Managing Director, the Board. Incentives are paid in cash, but may be taken as Perpetual shares or additional superannuation.
Under the STI plan, large individual incentive payments are subject to limits above which amounts must be awarded as Perpetual shares. Any STI payment in excess of two times the employee’s target STI will be automatically awarded as shares. These shares will vest immediately upon being granted to the employee, however will not become tradeable until a period of three years have elapsed, even if this is beyond the employee’s termination date. The period of three years was chosen in keeping with the vesting periods in our LTI policy.
Long-term incentives
Long-term incentives align remuneration with shareholder wealth creation.
A key feature of Perpetual’s remuneration strategy is ensuring a level of equity participation that aligns remuneration with shareholder wealth creation. The key principles which underpin long-term incentives are that:
b We provide LTI as equity in the company so that employees feel a sense of ownership
b LTI grants represent an important and growing proportion of senior employee remuneration
b We encourage sustained performance from our employees by setting challenging hurdles
LTI are granted in the form of shares and, in selected cases, options. They are awarded by Perpetual’s Executive Share Plan (ESP) and Executive Option Plan (EOP), which were approved by shareholders on 21 October 1997 (and amended in 1999) and 20 October 1998 respectively.
Share dealing approvalAny share dealings whether personal or as part of remuneration require prior approval.
Approval to deal in shares
Person wishing to deal in shares Approval required from
Managing director Chairman
Director Chairman
Chairman Nominated director
Senior executive Managing Director
Any employee likely to have price-sensitive information
Managing Director/ Company Secretary
20 | PERPETUAL LIMITED AND ITS CONTROLLED ENTITIES
Perpetual’s share dealing policy prohibits employees and directors from entering into hedging arrangements in relation to Perpetual securities. Perpetual employees and directors cannot trade in financial products issued over Perpetual securities by third parties or trade in any associated products which limit the economic risk of holding Perpetual securities. Share dealing can only take place in agreed trading windows throughout the year.
Performance share program and performance option program
Share and option plans used in LTI programs
Performance shares Performance options
Performance shares are issued or acquired on market, placed in trust and subject to forfeiture if performance hurdles and tenure conditions are not met.
No consideration is required from employees for the grant of performance shares.
Performance shares may vest depending on when and if performance hurdles are achieved.
The employee is the beneficial owner of the shares, with full dividend participation, while they are held in trust.
Options are granted over unissued ordinary shares.
All options are issued with an exercise price at the prevailing five-day weighted average market price for Perpetual shares at issue date.
Options may vest on the third or fourth anniversary of grant, depending on when and if performance hurdles are achieved.
On vesting, the employee is free to pay the exercise price and receive the underlying shares.
Options expire after six years from date of grant.
Overview of hurdles
LTI performance hurdles are directly linked to company performance.
Executive Director and group executives For the Executive Director and group executives, each performance share or option grant is divided into two equal tranches, with the following hurdles being applied to each respective tranche:
b The first tranche vests based on Perpetual’s total shareholder return (TSR) measured against companies listed on the S&P/ASX100 (excluding listed property trusts) determined at the date the LTI is granted
b The second tranche vests based on growth in Perpetual’s earnings per share (EPS)
TSR is defined as share price growth plus dividends paid and reinvested on the ex-dividend date (adjusted for rights, bonus issues and any capital reconstructions) measured for a three-year period from initial TSR measurement date.
Performance shares are held in trust for a maximum of ten years from grant date, while vested options may be exercised up to the sixth anniversary of grant date.
For equity-based compensation issued prior to 30 June 2003, performance measures consisted of continued employment by the relevant employee.
Total shareholder return hurdle
The TSR hurdle requires TSR growth to be equal to or better than 50 per cent of the companies listed on the S&P/ASX100 (excluding listed property trusts), at which point the following sliding vesting schedule applies:
Sliding TSR scale
Perpetual’s growth in TSR relative to S&P/ASX100
Percentage of performance shares and options that will vest
Less than median 0
Median 50
Greater than median but less than 75th percentile
2% for every one percentile increase in Perpetual’s relative position
Greater than 75th percentile 100
This performance hurdle is a commonly used indicator of shareholder wealth creation in the market. The companies listed on the S&P/ASX100 (excluding listed property trusts) for TSR purposes has been chosen as it represents the group with whom the company competes for shareholders’ capital.
Earnings per share hurdle
The EPS hurdle requires EPS growth (from grant date to vest date) to be equal to or greater than the target set by the PARC. This target, which is currently 10 per cent per annum, may be reviewed by the PARC from time to time. The following vesting schedule applies:
Vesting schedule for Executive Director and group executives
Perpetual’s growth in EPS Percentage of performance shares and options that will vest
EPS growth less than target 0
EPS growth at or above target 100
The achievement of this performance hurdle provides evidence of the company’s growth in earnings.
Business hurdle
Certain group executives also receive LTI allocations which are linked to business hurdles. These hurdles include:
b achievement of succession planning for their respective business unit and the introduction of new business ideas and products;
b achievement of targeted compound annual growth rate in profit before tax over a three year period. The shares will vest on a
PERPETUAL LIMITED AND ITS CONTROLLED ENTITIES | 21
sliding scale depending on the achievement of the compound annual growth rate; and
b achievement of targeted funds under management over a three year period for their respective business unit. The shares will vest on a sliding scale specific to each business hurdle.
Other employeesPrior to 30 June 2006, LTI performance hurdles for senior executives and other employees were the same as the Executive Director and group executives.
For senior executives and other employees, excluding the Executive Director and group executives, who received LTI allocations after 30 June 2006 the performance hurdle used is linked to EPS. The TSR performance hurdle is no longer used as EPS represents a measure that better aligns performance with their responsibilities.
Earning per share hurdle
The EPS hurdle requires EPS growth (from grant date to vesting date) to be greater than the target set by the PARC. This target, which is currently 5 per cent per annum, may be reviewed by the PARC from time to time. For full vesting, EPS growth must equal or exceed 10 per cent per annum. The following vesting schedule applies:
Vesting schedule for senior executives and other employees
Perpetual’s growth in EPS Percentage of performance shares that will vest
EPS growth at or less than target
0
EPS growth above target but less than 10%
2 for every 0.1% of EPS growth (rounded to the nearest 0.1%)
EPS growth at or above 10% 100
Hurdle testing and re-testing guidelines An initial three-year performance testing period applies to TSR and EPS hurdles. Three-year TSR and EPS performance is calculated and tested against TSR and EPS targets on the third anniversary of grant date. If the hurdle is not met, it is re-tested on the fourth anniversary of grant date, against four-year TSR and EPS targets. If the hurdle is not met after this testing, the portion of the LTI that has not vested is forfeited.
For senior executives and other employees, who receive LTI allocations after 30 June 2006, there is no re-testing of the EPS hurdle if the hurdle is not achieved on the third anniversary of the grant date.
Termination of employment (both performance shares and options) If an employee leaves employment of the company, any unvested shares will be forfeited at the termination date, except as noted below:
b If an employee dies or resigns due to total and permanent disability, all unvested shares vest to the employee at the date of death or termination date
b If an employee is made redundant, the employee will be entitled to that portion of shares which would have vested to him or her had he or she remained in employment until the end of the applicable notice and severance period or any amount as determined by the PARC
b If an employee resigns after reaching normal retirement age, the employee will be entitled to that portion of shares which would have vested to him or her up to and including retirement date
LTI arrangements for asset management employees based in Australia The Deferred Share Plan (DSP) was established in 2005 to deliver LTI and retention arrangements for a number of key employees in the company’s asset management team. 270,257 ordinary shares were issued to the DSP in the current financial year (in 2007, 44,816 ordinary shares were issued). 65,889 shares in the DSP were eligible to vest during the financial year. Shares held in the plan vest over the long-term subject to achievement of predominantly investment performance-based targets.
The plan ensures the interests of these key employees are aligned with those of shareholders over the longer term and provides a strong retention element as employees who cease employment with Perpetual during the vesting period forfeit any unvested shares.
In addition to LTI, asset management employees also receive short-term incentives based on investment performance targets.
LTI arrangements for asset management employees based in IrelandThe Global Employee Share Trust (GEST) was established in 2005 to deliver LTI and retention arrangements for key individuals who are pivotal to the long-term success of Perpetual’s global strategy.
In the current financial year, 12,749 shares were issued to the GEST (in 2007, nil shares were issued). Shares held in the plan vest over a number of years subject to achievement of agreed performance targets. None of the shares were eligible to vest during the financial year.
All shares are forfeited if the employee resigns or is terminated by Perpetual for poor performance or misconduct prior to this time.
Other employee share schemesThe company has two further equity-based benefit programs generally available to all Perpetual employees – the Tax Exempt Share Plan and the Tax Deferred Share Plan. These plans superseded the Employee Share Purchase Plan (ESPP) which made its final issue of shares to Perpetual employees in December 2004.
22 | PERPETUAL LIMITED AND ITS CONTROLLED ENTITIES
The ESPP and another inactive plan, the Employee Reward Share Plan, are discussed in Note 26 to the Financial Statements.
Tax Exempt Share Plan (TESP)b Eligible employees can salary sacrifice up to $1,000 of STI
to acquire an equivalent value of Perpetual shares
b Shares cannot be sold or transferred until the earlier of three years after allocation date or the time the participant ceases to be a Perpetual employee
b Shares issued under this plan are acquired in ordinary trading on the Australian Securities Exchange (ASX) or issued by Perpetual at market value
b Executives are not able to participate in this plan
b Shares acquired under this plan on a salary or bonus sacrifice basis are not subject to performance hurdles
Tax Deferred Share Plan (TDSP)b Eligible employees are able to salary sacrifice STI remuneration
to acquire an equivalent value of Perpetual shares
b Shares acquired under a salary sacrifice arrangement are acquired in the ordinary course of trading on the ASX
b Shares acquired under this plan on a salary or bonus sacrifice basis are not subject to performance hurdles
Sales incentive plans in Perpetual Private Wealth
b Eligible Private Wealth employees have the potential to receive share allocations as part of an annual sales-based incentive plan
b Cash incentive payments are matched by a share allocation once an individual’s sales revenue exceeds a specified level
b Shares under this arrangement vest in three equal tranches over three years, provided continued employment and ongoing sales performance are met
b This arrangement provides a basis for retaining high-performing employees within Perpetual Private Wealth
Non-executive directors’ share purchase planA share purchase plan for non-executive directors was approved by shareholders at the annual general meeting in October 1998. Under this plan, each non-executive director can sacrifice up to 50 per cent of their directors’ fees to acquire shares in the company. These shares are purchased four times each year at market value and have a disposal restriction of 10 years, or when the director ceases to be a director of the company.
Dilution limits for share plans The Board of Perpetual has by resolution replaced the internal share dilution limits relating to its active employee share plans. The previous explicit dilution limits specified in the rules of the Plans were not more than 15% of issued capital could be issued over 10 years.
Perpetual has replaced the explicit dilution limit with a Board discretion as to the number of shares to be issued under employee incentive plans. This discretion is subject to applicable restrictions under the Corporations Act 2001, ASX Listing Rules and Perpetual’s governance policy. Perpetual believes this change will better enable it to manage the share dilution in line with current governance principles, and keep up to date with future changes in legislation, listing requirements or stakeholder body guidance. In addition, it allows Perpetual to balance shareholder and company needs, enabling the granting of LTI in order to attract and retain talent. The Board will manage the issue of shares under employee incentive plans to balance remuneration needs of employees with shareholder returns.
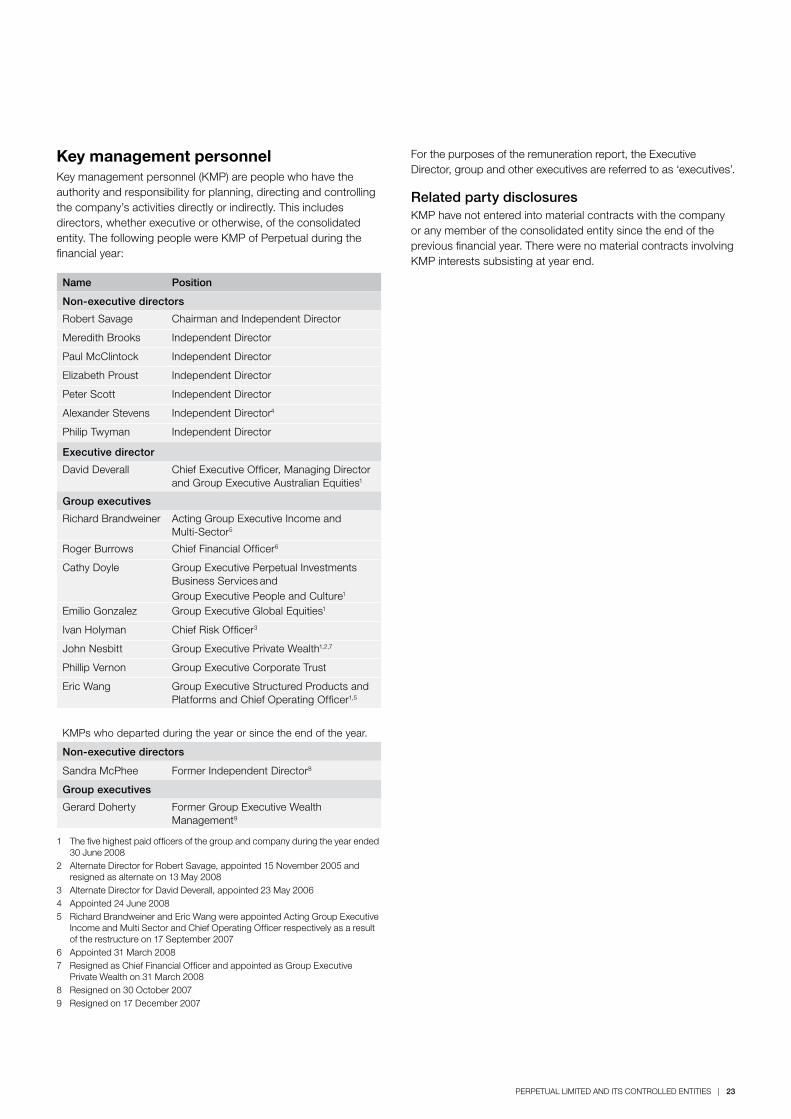
PERPETUAL LIMITED AND ITS CONTROLLED ENTITIES | 23
Key management personnelKey management personnel (KMP) are people who have the authority and responsibility for planning, directing and controlling the company’s activities directly or indirectly. This includes directors, whether executive or otherwise, of the consolidated entity. The following people were KMP of Perpetual during the financial year:
Name Position
Non-executive directors
Robert Savage Chairman and Independent Director
Meredith Brooks Independent Director
Paul McClintock Independent Director
Elizabeth Proust Independent Director
Peter Scott Independent Director
Alexander Stevens Independent Director4
Philip Twyman Independent Director
Executive director
David Deverall Chief Executive Officer, Managing Director and Group Executive Australian Equities1
Group executives
Richard Brandweiner Acting Group Executive Income and Multi-Sector5
Roger Burrows Chief Financial Officer6
Cathy Doyle Group Executive Perpetual Investments Business Services andGroup Executive People and Culture1
Emilio Gonzalez Group Executive Global Equities1
Ivan Holyman Chief Risk Officer3
John Nesbitt Group Executive Private Wealth1,2,7
Phillip Vernon Group Executive Corporate Trust
Eric Wang Group Executive Structured Products and Platforms and Chief Operating Officer1,5
KMPs who departed during the year or since the end of the year.
Non-executive directors
Sandra McPhee Former Independent Director8
Group executives
Gerard Doherty Former Group Executive Wealth Management9
1 The five highest paid officers of the group and company during the year ended 30 June 2008
2 Alternate Director for Robert Savage, appointed 15 November 2005 and resigned as alternate on 13 May 2008
3 Alternate Director for David Deverall, appointed 23 May 20064 Appointed 24 June 20085 Richard Brandweiner and Eric Wang were appointed Acting Group Executive
Income and Multi Sector and Chief Operating Officer respectively as a result of the restructure on 17 September 2007
6 Appointed 31 March 20087 Resigned as Chief Financial Officer and appointed as Group Executive
Private Wealth on 31 March 20088 Resigned on 30 October 20079 Resigned on 17 December 2007
For the purposes of the remuneration report, the Executive Director, group and other executives are referred to as ‘executives’.
Related party disclosuresKMP have not entered into material contracts with the company or any member of the consolidated entity since the end of the previous financial year. There were no material contracts involving KMP interests subsisting at year end.
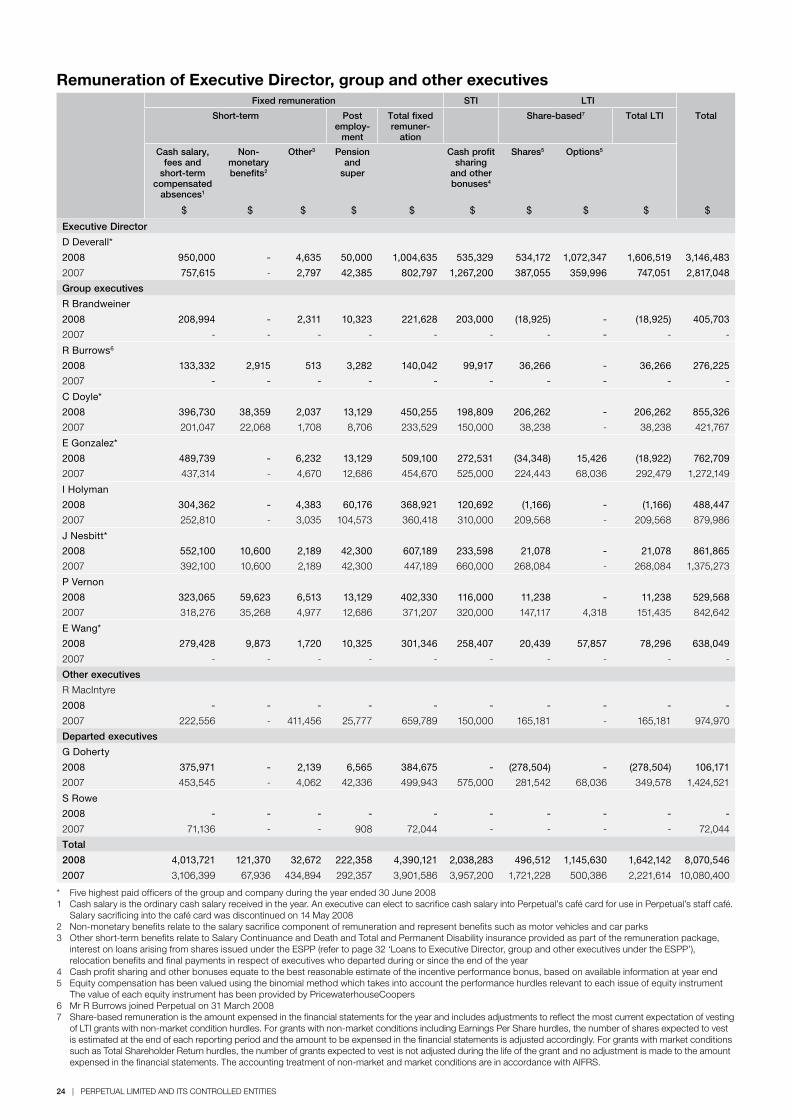
24 | PERPETUAL LIMITED AND ITS CONTROLLED ENTITIES
Remuneration of Executive Director, group and other executivesFixed remuneration STI LTI
Short-term Post employ-
ment
Total fixed remuner-
ation
Share-based7 Total LTI Total
Cash salary, fees and
short-term compensated
absences1
Non-monetary benefits2
Other3 Pension and
super
Cash profit sharing
and other bonuses4
Shares5 Options5
$ $ $ $ $ $ $ $ $ $
Executive Director
D Deverall*
2008 950,000 - 4,635 50,000 1,004,635 535,329 534,172 1,072,347 1,606,519 3,146,483
2007 757,615 - 2,797 42,385 802,797 1,267,200 387,055 359,996 747,051 2,817,048
Group executives
R Brandweiner
2008 208,994 - 2,311 10,323 221,628 203,000 (18,925) - (18,925) 405,703
2007 - - - - - - - - - -
R Burrows6
2008 133,332 2,915 513 3,282 140,042 99,917 36,266 - 36,266 276,225
2007 - - - - - - - - - -
C Doyle*
2008 396,730 38,359 2,037 13,129 450,255 198,809 206,262 - 206,262 855,326
2007 201,047 22,068 1,708 8,706 233,529 150,000 38,238 - 38,238 421,767
E Gonzalez*
2008 489,739 - 6,232 13,129 509,100 272,531 (34,348) 15,426 (18,922) 762,709
2007 437,314 - 4,670 12,686 454,670 525,000 224,443 68,036 292,479 1,272,149
I Holyman
2008 304,362 - 4,383 60,176 368,921 120,692 (1,166) - (1,166) 488,447
2007 252,810 - 3,035 104,573 360,418 310,000 209,568 - 209,568 879,986
J Nesbitt*
2008 552,100 10,600 2,189 42,300 607,189 233,598 21,078 - 21,078 861,865
2007 392,100 10,600 2,189 42,300 447,189 660,000 268,084 - 268,084 1,375,273
P Vernon
2008 323,065 59,623 6,513 13,129 402,330 116,000 11,238 - 11,238 529,568
2007 318,276 35,268 4,977 12,686 371,207 320,000 147,117 4,318 151,435 842,642
E Wang*
2008 279,428 9,873 1,720 10,325 301,346 258,407 20,439 57,857 78,296 638,049
2007 - - - - - - - - - -
Other executives
R MacIntyre
2008 - - - - - - - - - -
2007 222,556 - 411,456 25,777 659,789 150,000 165,181 - 165,181 974,970
Departed executives
G Doherty
2008 375,971 - 2,139 6,565 384,675 - (278,504) - (278,504) 106,171
2007 453,545 - 4,062 42,336 499,943 575,000 281,542 68,036 349,578 1,424,521
S Rowe
2008 - - - - - - - - - -
2007 71,136 - - 908 72,044 - - - - 72,044
Total
2008 4,013,721 121,370 32,672 222,358 4,390,121 2,038,283 496,512 1,145,630 1,642,142 8,070,546
2007 3,106,399 67,936 434,894 292,357 3,901,586 3,957,200 1,721,228 500,386 2,221,614 10,080,400
* Five highest paid officers of the group and company during the year ended 30 June 20081 Cash salary is the ordinary cash salary received in the year. An executive can elect to sacrifice cash salary into Perpetual’s café card for use in Perpetual’s staff café.
Salary sacrificing into the café card was discontinued on 14 May 20082 Non-monetary benefits relate to the salary sacrifice component of remuneration and represent benefits such as motor vehicles and car parks3 Other short-term benefits relate to Salary Continuance and Death and Total and Permanent Disability insurance provided as part of the remuneration package,
interest on loans arising from shares issued under the ESPP (refer to page 32 ‘Loans to Executive Director, group and other executives under the ESPP’), relocation benefits and final payments in respect of executives who departed during or since the end of the year
4 Cash profit sharing and other bonuses equate to the best reasonable estimate of the incentive performance bonus, based on available information at year end5 Equity compensation has been valued using the binomial method which takes into account the performance hurdles relevant to each issue of equity instrument
The value of each equity instrument has been provided by PricewaterhouseCoopers6 Mr R Burrows joined Perpetual on 31 March 20087 Share-based remuneration is the amount expensed in the financial statements for the year and includes adjustments to reflect the most current expectation of vesting
of LTI grants with non-market condition hurdles. For grants with non-market conditions including Earnings Per Share hurdles, the number of shares expected to vest is estimated at the end of each reporting period and the amount to be expensed in the financial statements is adjusted accordingly. For grants with market conditions such as Total Shareholder Return hurdles, the number of grants expected to vest is not adjusted during the life of the grant and no adjustment is made to the amount expensed in the financial statements. The accounting treatment of non-market and market conditions are in accordance with AIFRS.
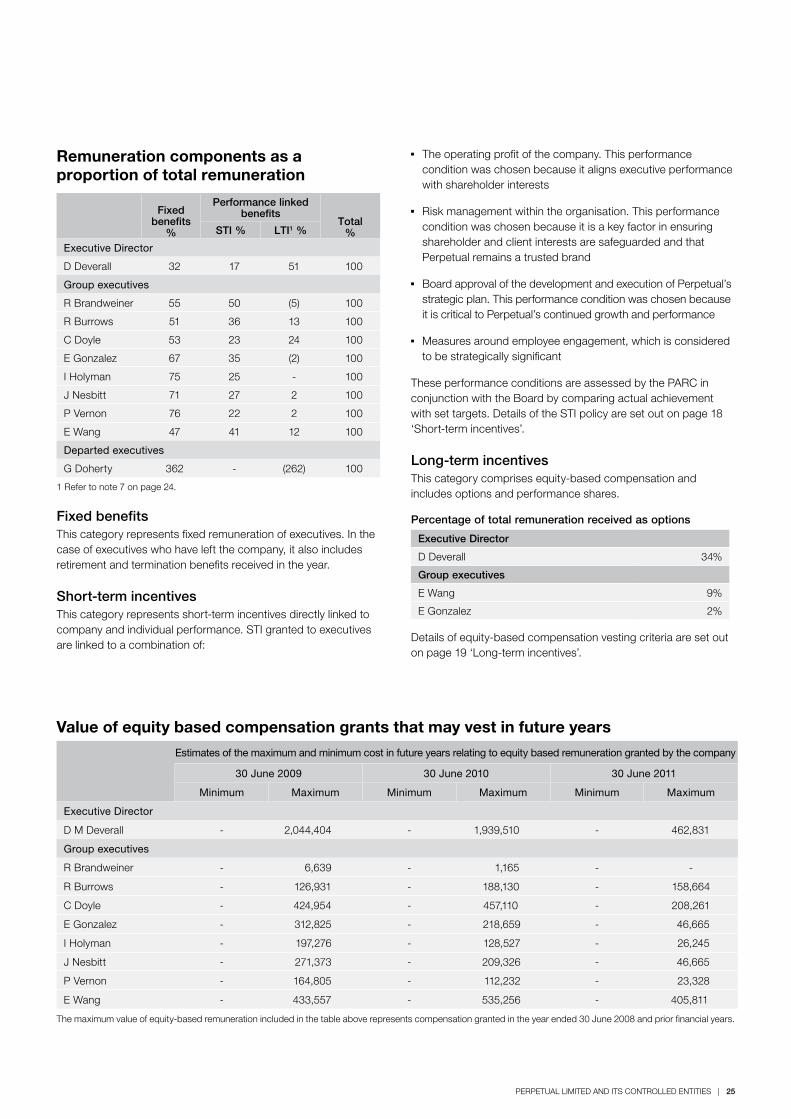
PERPETUAL LIMITED AND ITS CONTROLLED ENTITIES | 25
Remuneration components as a proportion of total remuneration
Fixed benefits
%
Performance linked benefits
Total%STI % LTI1 %
Executive Director
D Deverall 32 17 51 100
Group executives
R Brandweiner 55 50 (5) 100
R Burrows 51 36 13 100
C Doyle 53 23 24 100
E Gonzalez 67 35 (2) 100
I Holyman 75 25 - 100
J Nesbitt 71 27 2 100
P Vernon 76 22 2 100
E Wang 47 41 12 100
Departed executives
G Doherty 362 - (262) 100
1 Refer to note 7 on page 24.
Fixed benefits
This category represents fixed remuneration of executives. In the case of executives who have left the company, it also includes retirement and termination benefits received in the year.
Short-term incentives This category represents short-term incentives directly linked to company and individual performance. STI granted to executives are linked to a combination of:
b The operating profit of the company. This performance condition was chosen because it aligns executive performance with shareholder interests
b Risk management within the organisation. This performance condition was chosen because it is a key factor in ensuring shareholder and client interests are safeguarded and that Perpetual remains a trusted brand
b Board approval of the development and execution of Perpetual’s strategic plan. This performance condition was chosen because it is critical to Perpetual’s continued growth and performance
b Measures around employee engagement, which is considered to be strategically significant
These performance conditions are assessed by the PARC in conjunction with the Board by comparing actual achievement with set targets. Details of the STI policy are set out on page 18 ‘Short-term incentives’.
Long-term incentivesThis category comprises equity-based compensation and includes options and performance shares.
Percentage of total remuneration received as options
Executive Director
D Deverall 34%
Group executives
E Wang 9%
E Gonzalez 2%
Details of equity-based compensation vesting criteria are set out on page 19 ‘Long-term incentives’.
Value of equity based compensation grants that may vest in future years
Estimates of the maximum and minimum cost in future years relating to equity based remuneration granted by the company
30 June 2009 30 June 2010 30 June 2011
Minimum Maximum Minimum Maximum Minimum Maximum
Executive Director
D M Deverall - 2,044,404 - 1,939,510 - 462,831
Group executives
R Brandweiner - 6,639 - 1,165 - -
R Burrows - 126,931 - 188,130 - 158,664
C Doyle - 424,954 - 457,110 - 208,261
E Gonzalez - 312,825 - 218,659 - 46,665
I Holyman - 197,276 - 128,527 - 26,245
J Nesbitt - 271,373 - 209,326 - 46,665
P Vernon - 164,805 - 112,232 - 23,328
E Wang - 433,557 - 535,256 - 405,811
The maximum value of equity-based remuneration included in the table above represents compensation granted in the year ended 30 June 2008 and prior financial years.
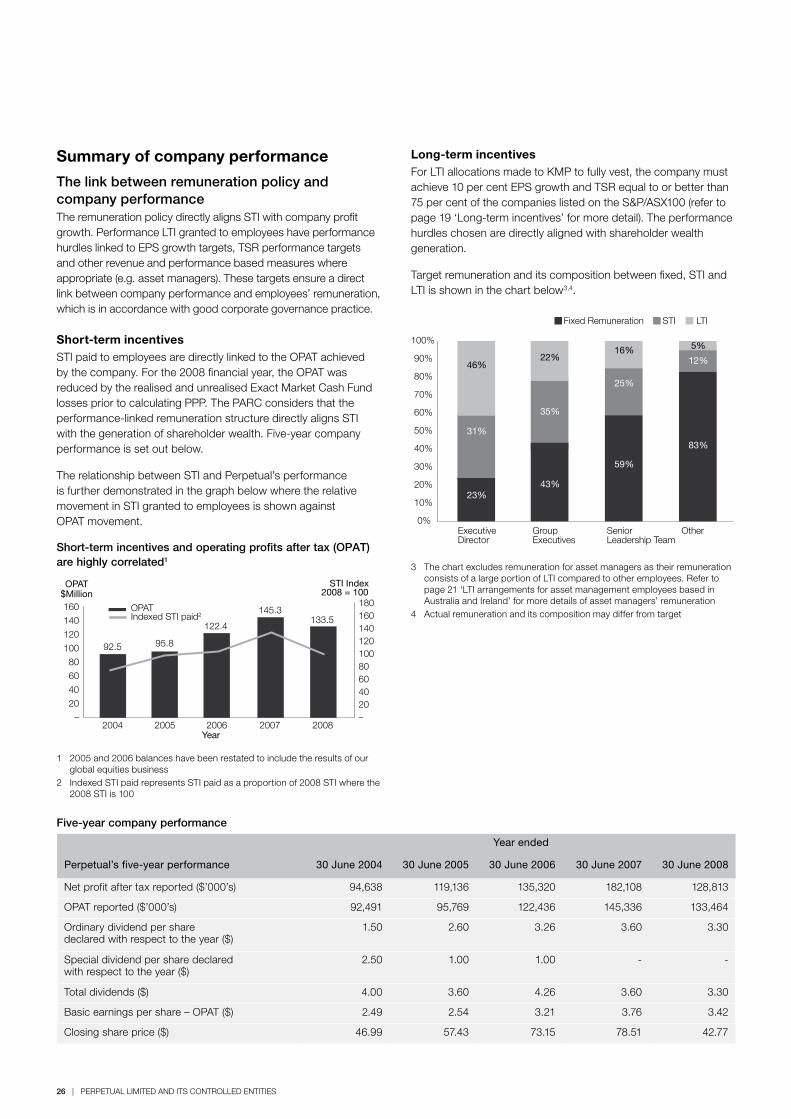
26 | PERPETUAL LIMITED AND ITS CONTROLLED ENTITIES
Summary of company performance
The link between remuneration policy and company performanceThe remuneration policy directly aligns STI with company profit growth. Performance LTI granted to employees have performance hurdles linked to EPS growth targets, TSR performance targets and other revenue and performance based measures where appropriate (e.g. asset managers). These targets ensure a direct link between company performance and employees’ remuneration, which is in accordance with good corporate governance practice.
Short-term incentivesSTI paid to employees are directly linked to the OPAT achieved by the company. For the 2008 financial year, the OPAT was reduced by the realised and unrealised Exact Market Cash Fund losses prior to calculating PPP. The PARC considers that the performance-linked remuneration structure directly aligns STI with the generation of shareholder wealth. Five-year company performance is set out below.
The relationship between STI and Perpetual’s performance is further demonstrated in the graph below where the relative movement in STI granted to employees is shown against OPAT movement.
Short-term incentives and operating profits after tax (OPAT) are highly correlated1
95.8
2005
122.4
2006
145.3
2007
133.5
20082004
92.5
160
140
120
100
–
20
40
60
80
160180
140120100
–20406080
OPAT$Million
STI Index2008 = 100
OPATIndexed STI paid2
Year
1 2005 and 2006 balances have been restated to include the results of our global equities business
2 Indexed STI paid represents STI paid as a proportion of 2008 STI where the 2008 STI is 100
Long-term incentives For LTI allocations made to KMP to fully vest, the company must achieve 10 per cent EPS growth and TSR equal to or better than 75 per cent of the companies listed on the S&P/ASX100 (refer to page 19 ‘Long-term incentives’ for more detail). The performance hurdles chosen are directly aligned with shareholder wealth generation.
Target remuneration and its composition between fixed, STI and LTI is shown in the chart below3,4.
23%43%
59%
83%
31%
35%
25%
12%46%22%
16% 5%
0%
10%
20%
30%
40%
50%
60%
70%
80%
90%
100%
ExecutiveDirector
GroupExecutives
SeniorLeadership Team
Other
Fixed Remuneration STI LTI
3 The chart excludes remuneration for asset managers as their remuneration consists of a large portion of LTI compared to other employees. Refer to page 21 ‘LTI arrangements for asset management employees based in Australia and Ireland’ for more details of asset managers’ remuneration
4 Actual remuneration and its composition may differ from target
Year ended
Perpetual’s five-year performance 30 June 2004 30 June 2005 30 June 2006 30 June 2007 30 June 2008
Net profit after tax reported ($’000’s) 94,638 119,136 135,320 182,108 128,813
OPAT reported ($’000’s) 92,491 95,769 122,436 145,336 133,464
Ordinary dividend per share declared with respect to the year ($)
1.50 2.60 3.26 3.60 3.30
Special dividend per share declared with respect to the year ($)
2.50 1.00 1.00 - -
Total dividends ($) 4.00 3.60 4.26 3.60 3.30
Basic earnings per share – OPAT ($) 2.49 2.54 3.21 3.76 3.42
Closing share price ($) 46.99 57.43 73.15 78.51 42.77
Five-year company performance
PERPETUAL LIMITED AND ITS CONTROLLED ENTITIES | 27
Contract terms for the Executive Director
David Deverall, Chief Executive Officer and Managing Director
Contract details David Deverall, Chief Executive Officer and Managing Director
Term of contract Mr Deverall’s appointment as Chief Executive Officer and Managing Director continues from the date of the agreement (24 September 2007) until terminated in accordance with its terms.
Fixed remuneration $1,000,000 per annum, reviewable in accordance with Perpetual’s policies.
STI STI of up to STI for previous year multiplied by the change in the Profit Participation Pool. For 2008, the baseline STI is $1.375 million. 20% of the STI will be subject to the Board’s assessment annually for additional performance criteria.
LTI - Group Eligible to receive LTI - Group grants equivalent to $1.025 million per annum (or such greater amount as may be determined by the Board from year to year). 50% of the LTI - Group benefits is provided by way of performance shares and 50% by way of options. Grants are dividend into two portions.
The first portion is subject to a TSR hurdle. If Perpetual’s growth in TSR relative to the comparative group is:
– less than the median, 0% vests;
– at the median, 50% vests;
– greater than the median but less than 75%, 50% plus 2% for every percentile increase vests; and
– 75% or above, 100% vests.
The second portion is subject to an EPS hurdle. If Perpetual’s growth in EPS is:
– less than 10% per annum, 0% vests; and
– at 10% or more, 100% vests.
The TSR and EPS hurdles are first tested on the 3rd anniversary of the grant date. If any portion remains unvested, it is retested on the 4th anniversary of the grant date. After this date, any unvested portion is forfeited.
LTI – Business Eligible to receive LTI - Business grants up to $6,000,000. 50% of the LTI - Business benefit is provided by way of shares and 50% by way of options. LTI Business benefit will vest on 30 June 2012 subject to compound annual growth in EPS hurdles and OPAT hurdles.
A threshold compound annual growth in EPS of 11% is required before any shares or options can vest in 2012. Once the threshold is achieved, vesting operates as follows:
– vesting of 10% of the total shares and options occurs upon achievement of compound annual growth in EPS of 11% and required OPAT target;
– 100% of the shares and options will vest if compound annual growth in EPS is 20% and required OPAT target is achieved;
– a sliding scale of vesting operates if compound annual growth in EPS is greater than 11% and below 20% and required OPAT targets are achieved.
There is an opportunity for accelerated vesting as at 30 June 2010 of up to 67% ($4,000,000) of the original benefit. A threshold compound annual growth in EPS of 15% is required before any shares or options can vest in 2010. Once the threshold is achieved, vesting operates as follows:
– vesting of shares and options valued at $2,000,000 occurs upon achievement of a compound annual growth in EPS of 15% and required OPAT target;
– shares and options valued at a total of $4,000,000 will vest upon achievement of a compound annual growth in EPS of 25% and required OPAT target;
– a sliding scale of vesting operates if compound annual growth in EPS is greater than 15% and below 25% and required OPAT targets are achieved.
Mr Deverall is not permitted to transfer or exercise any shares or options that vest under these accelerated vesting provisions until after 30 June 2011. If accelerated vesting is achieved, the balance of the LTI-Business will vest on 30 June 2012 subject to the original hurdles. There is no provision for retesting if performance hurdles are not achieved as of 30 June 2012. Any shares and options that do not vest will be forfeited as at 30 June 2012.
28 | PERPETUAL LIMITED AND ITS CONTROLLED ENTITIES
Contract details David Deverall, Chief Executive Officer and Managing Director
Termination of employment Mr Deverall can resign by providing 12 months’ notice. Perpetual can terminate Mr Deverall’s employment at any time by providing 12 months notice; immediately for misconduct or other circumstances justifying summary dismissal; as a result of Mr Deverall’s illness by providing 12 months’ notice; and for poor performance by providing 6 months’ notice. When notice is required, the Company can make a payment in lieu of all or part of any notice period.
Immediate termination without notice in certain circumstances
STI – no entitlement in respect of year in which termination occurs.
LTI - Group – shares and options not vested at termination date are forfeited.
LTI – Business - shares and options not vested at termination date are forfeited.
Termination by Perpetual on notice or due to illness - 12 months written notice (or payment in lieu)
STI – pro-rated, based on prior year entitlements.
LTI – Group – eligible to receive vesting of shares and options that have not vested at the termination date for a period of 24 months after the termination date, provided the performance hurdles are met.
LTI – Business – entitled to the greater of a pro-rata proportion of shares and options (subject to performance hurdles) and 1/10 of the LTI – Business.
Termination by Perpetual due to poor performance – 6 months written notice (or payment in lieu)
STI – no entitlement in respect of year in which termination occurs.
LTI – Group – shares and options not vested at the termination date are forfeited.
LTI – Business – entitled to the greater of a pro-rata proportion of shares and options (subject to performance hurdles) and 1/10 of the LTI – Business.
Voluntary termination – 12 months written notice (or payment in lieu)
STI – pro-rated, based on previous year entitlements.
LTI – Group – shares and options not vested at the termination date are forfeited.
LTI – Business – shares and options not vested at the termination date are forfeited.
Death of Mr Deverall
STI – pro-rata entitlement based on previous year’s STI.
LTI – Group – eligible to receive vesting of shares and options that have not vested at the termination date for a period of 24 months after the termination date, provided performance hurdles are met.
LTI – Business – eligible to receive vesting of shares and options that have not vested at the termination date for a period of 24 months after the termination date, provided the performance hurdles are met.
2407
7_B
SC
RE
M2_
0708
PERPETUAL LIMITED AND ITS CONTROLLED ENTITIES | 29
Contract terms for group and other executives Contract terms – summary
Fixed remuneration1
$
Fixed remuneration period 12 months to
Group executives
R Brandweiner 240,000 31 August 2008
R Burrows 550,000 31 August 2008
C Doyle 425,000 31 August 2008
E Gonzalez 500,000 31 August 2008
I Holyman 385,000 31 August 2008
J Nesbitt 600,000 31 August 2008
P Vernon 390,000 31 August 2008
E Wang 330,000 31 August 2008
Departed executives
G Doherty 525,000 31 August 2008
1 Annualised fixed remuneration in respect of the 12 months ending 31 August 2008 or date of departure. Fixed remuneration will be renegotiated for a further 12-month period on expiry of the current fixed remuneration period.
Termination provisionsExecutives’ contracts provide for benefit payments where contracts are terminated by Perpetual or by the executives. The contracts do not specify a fixed term, but provide for termination benefits as follows:
b three months’ notice or payment in lieu in the event of resignation
b three months’ notice in the event of termination for non-performance (six months for R Burrows, J Nesbitt)
b three months then three weeks per completed year of service up to a maximum of 52 weeks or payment in lieu (J Nesbitt – 12 months’ notice or payment in lieu) in the event of termination by Perpetual (other than for poor performance)
b immediate termination without notice for misconduct
b LTI entitlements vest as set out on page 19 ‘Long-term incentives’
Participation in equity programs
Executive Option Plan (EOP)The EOP was approved by shareholders at the 1998 Annual General Meeting (AGM).
Options are granted over unissued ordinary shares. The exercise price, determined in accordance with plan rules, is based on the weighted average price of Perpetual’s shares traded on the ASX during the five business days preceding date of option grant.
No consideration is payable to acquire the option and no voting or dividend rights are attached to the option or the unissued ordinary share underlying the option.
When exercisable, each option is convertible into one ordinary share of Perpetual Limited. Options vest at the commencement of the exercise period and all vested options are exercisable on that date. Options expire at the end of the exercise period. There are nil amounts unpaid on shares issued as a result of exercising options. Refer to ‘Option holdings of Executive Director, group and other executives’ for details of options granted on page 30.
Option holdings of Executive Director, group and other executives
Executive Share Plan (ESP)The ESP was approved by shareholders at the 1997 AGM and amended at the 1999 AGM.
The issue price of shares under this plan is the weighted average price of Perpetual’s shares traded on the ASX during the five business days preceding issue date or announcement date for relevant individuals.
Shares are either purchased on market or issued by the company to satisfy grants made to the Executive Director, group and other executives and are held in trust for a maximum of 10 years.
The Executive Director and other executives receive dividends and have voting rights while the shares are held in trust. No consideration is payable to acquire shares under the ESP although the Executive Director and other executives can elect to take a portion of their STI in the form of shares under a bonus sacrifice arrangement through the Tax Deferred Share Plan (TDSP). Shares acquired via bonus sacrifice are not subject to performance hurdles as they are acquired in lieu of cash payment by the company. Refer to ‘Unvested and vested share holdings of Executive Director and other executives’ for details of unvested and vested shares granted on pages 31 and 32.
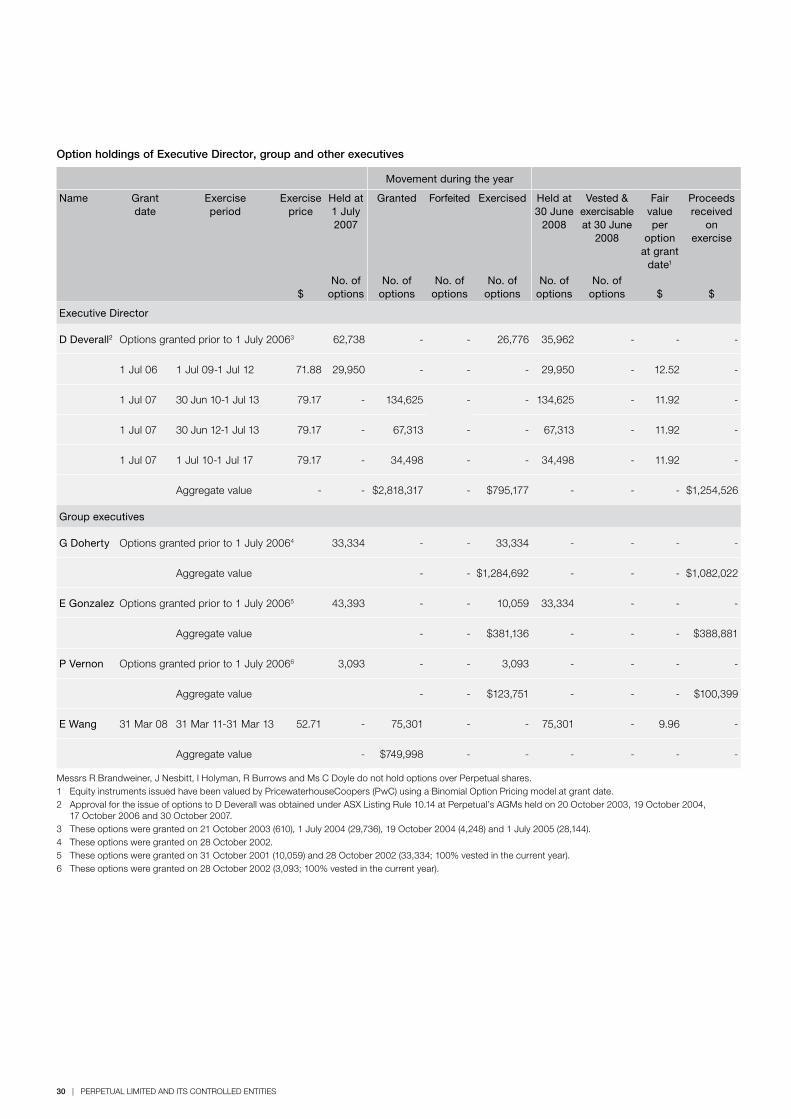
30 | PERPETUAL LIMITED AND ITS CONTROLLED ENTITIES
Option holdings of Executive Director, group and other executives
Movement during the year
Name Grant date
Exercise period
Exercise price
Held at 1 July 2007
Granted Forfeited Exercised Held at 30 June
2008
Vested & exercisable at 30 June
2008
Fair value per
option at grant
date1
Proceeds received
on exercise
$
No. of options
No. of options
No. of options
No. of options
No. of options
No. of options
$
$
Executive Director
D Deverall2 Options granted prior to 1 July 20063 62,738 - - 26,776 35,962 - - -
1 Jul 06 1 Jul 09-1 Jul 12 71.88 29,950 - - - 29,950 - 12.52 -
1 Jul 07 30 Jun 10-1 Jul 13 79.17 - 134,625 - - 134,625 - 11.92 -
1 Jul 07 30 Jun 12-1 Jul 13 79.17 - 67,313 - - 67,313 - 11.92 -
1 Jul 07 1 Jul 10-1 Jul 17 79.17 - 34,498 - - 34,498 - 11.92 -
Aggregate value - - $2,818,317 - $795,177 - - - $1,254,526
Group executives
G Doherty Options granted prior to 1 July 20064 33,334 - - 33,334 - - - -
Aggregate value - - $1,284,692 - - - $1,082,022
E Gonzalez Options granted prior to 1 July 20065 43,393 - - 10,059 33,334 - - -
Aggregate value - - $381,136 - - - $388,881
P Vernon Options granted prior to 1 July 20066 3,093 - - 3,093 - - - -
Aggregate value - - $123,751 - - - $100,399
E Wang 31 Mar 08 31 Mar 11-31 Mar 13 52.71 - 75,301 - - 75,301 - 9.96 -
Aggregate value - $749,998 - - - - - -
Messrs R Brandweiner, J Nesbitt, I Holyman, R Burrows and Ms C Doyle do not hold options over Perpetual shares.1 Equity instruments issued have been valued by PricewaterhouseCoopers (PwC) using a Binomial Option Pricing model at grant date.2 Approval for the issue of options to D Deverall was obtained under ASX Listing Rule 10.14 at Perpetual’s AGMs held on 20 October 2003, 19 October 2004,
17 October 2006 and 30 October 2007.3 These options were granted on 21 October 2003 (610), 1 July 2004 (29,736), 19 October 2004 (4,248) and 1 July 2005 (28,144).4 These options were granted on 28 October 2002.5 These options were granted on 31 October 2001 (10,059) and 28 October 2002 (33,334; 100% vested in the current year).6 These options were granted on 28 October 2002 (3,093; 100% vested in the current year).
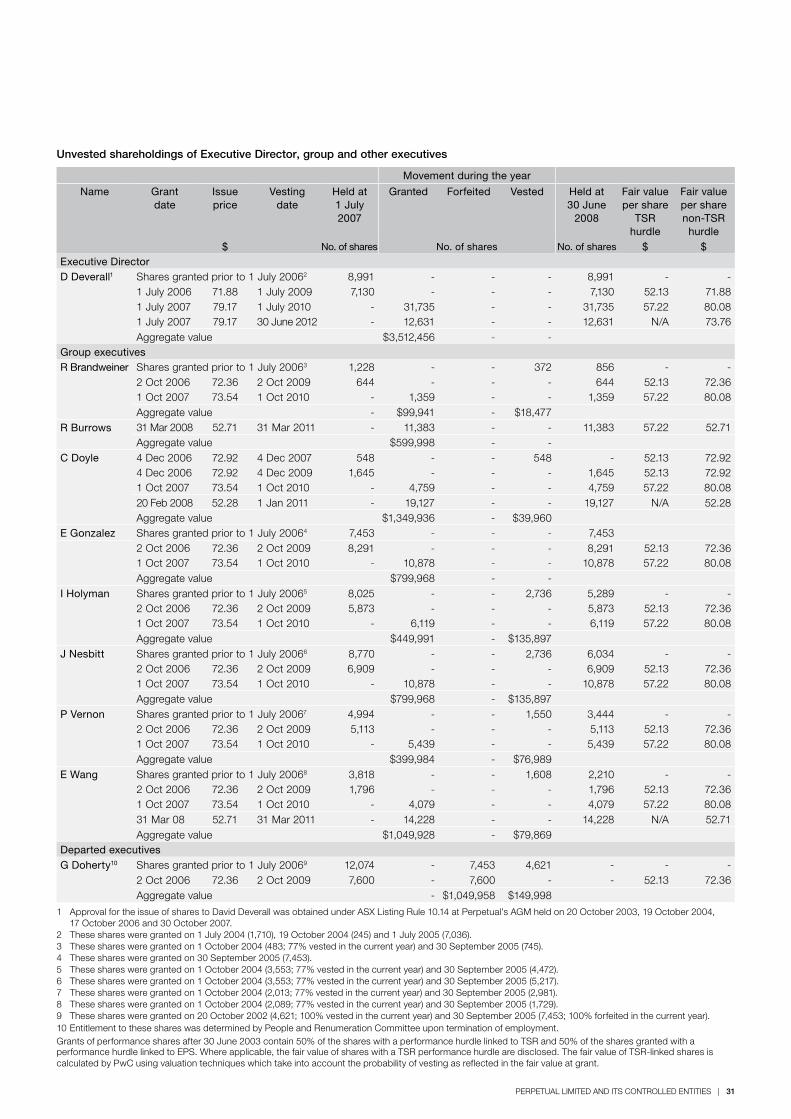
PERPETUAL LIMITED AND ITS CONTROLLED ENTITIES | 31
Unvested shareholdings of Executive Director, group and other executives
Movement during the year
Name Grant date
Issue price
Vesting date
Held at 1 July 2007
Granted Forfeited Vested Held at 30 June
2008
Fair value per share
TSR hurdle
Fair value per share non-TSR
hurdle$ No. of shares No. of shares No. of shares $ $
Executive DirectorD Deverall1 Shares granted prior to 1 July 20062 8,991 - - - 8,991 - -
1 July 2006 71.88 1 July 2009 7,130 - - - 7,130 52.13 71.881 July 2007 79.17 1 July 2010 - 31,735 - - 31,735 57.22 80.081 July 2007 79.17 30 June 2012 - 12,631 - - 12,631 N/A 73.76Aggregate value $3,512,456 - -
Group executivesR Brandweiner Shares granted prior to 1 July 20063 1,228 - - 372 856 - -
2 Oct 2006 72.36 2 Oct 2009 644 - - - 644 52.13 72.361 Oct 2007 73.54 1 Oct 2010 - 1,359 - - 1,359 57.22 80.08Aggregate value - $99,941 - $18,477
R Burrows 31 Mar 2008 52.71 31 Mar 2011 - 11,383 - - 11,383 57.22 52.71Aggregate value $599,998 - -
C Doyle 4 Dec 2006 72.92 4 Dec 2007 548 - - 548 - 52.13 72.924 Dec 2006 72.92 4 Dec 2009 1,645 - - - 1,645 52.13 72.921 Oct 2007 73.54 1 Oct 2010 - 4,759 - - 4,759 57.22 80.0820 Feb 2008 52.28 1 Jan 2011 - 19,127 - - 19,127 N/A 52.28Aggregate value $1,349,936 - $39,960
E Gonzalez Shares granted prior to 1 July 20064 7,453 - - - 7,453 2 Oct 2006 72.36 2 Oct 2009 8,291 - - - 8,291 52.13 72.361 Oct 2007 73.54 1 Oct 2010 - 10,878 - - 10,878 57.22 80.08Aggregate value $799,968 - -
I Holyman Shares granted prior to 1 July 20065 8,025 - - 2,736 5,289 - -2 Oct 2006 72.36 2 Oct 2009 5,873 - - - 5,873 52.13 72.361 Oct 2007 73.54 1 Oct 2010 - 6,119 - - 6,119 57.22 80.08Aggregate value $449,991 - $135,897
J Nesbitt Shares granted prior to 1 July 20066 8,770 - - 2,736 6,034 - -2 Oct 2006 72.36 2 Oct 2009 6,909 - - - 6,909 52.13 72.361 Oct 2007 73.54 1 Oct 2010 - 10,878 - - 10,878 57.22 80.08Aggregate value $799,968 - $135,897
P Vernon Shares granted prior to 1 July 20067 4,994 - - 1,550 3,444 - -2 Oct 2006 72.36 2 Oct 2009 5,113 - - - 5,113 52.13 72.361 Oct 2007 73.54 1 Oct 2010 - 5,439 - - 5,439 57.22 80.08Aggregate value $399,984 - $76,989
E Wang Shares granted prior to 1 July 20068 3,818 - - 1,608 2,210 - -2 Oct 2006 72.36 2 Oct 2009 1,796 - - - 1,796 52.13 72.361 Oct 2007 73.54 1 Oct 2010 - 4,079 - - 4,079 57.22 80.0831 Mar 08 52.71 31 Mar 2011 - 14,228 - - 14,228 N/A 52.71Aggregate value $1,049,928 - $79,869
Departed executivesG Doherty10 Shares granted prior to 1 July 20069 12,074 - 7,453 4,621 - - -
2 Oct 2006 72.36 2 Oct 2009 7,600 - 7,600 - - 52.13 72.36Aggregate value - $1,049,958 $149,998
1 Approval for the issue of shares to David Deverall was obtained under ASX Listing Rule 10.14 at Perpetual’s AGM held on 20 October 2003, 19 October 2004, 17 October 2006 and 30 October 2007.
2 These shares were granted on 1 July 2004 (1,710), 19 October 2004 (245) and 1 July 2005 (7,036).3 These shares were granted on 1 October 2004 (483; 77% vested in the current year) and 30 September 2005 (745).4 These shares were granted on 30 September 2005 (7,453).5 These shares were granted on 1 October 2004 (3,553; 77% vested in the current year) and 30 September 2005 (4,472).6 These shares were granted on 1 October 2004 (3,553; 77% vested in the current year) and 30 September 2005 (5,217).7 These shares were granted on 1 October 2004 (2,013; 77% vested in the current year) and 30 September 2005 (2,981). 8 These shares were granted on 1 October 2004 (2,089; 77% vested in the current year) and 30 September 2005 (1,729).9 These shares were granted on 20 October 2002 (4,621; 100% vested in the current year) and 30 September 2005 (7,453; 100% forfeited in the current year).10 Entitlement to these shares was determined by People and Renumeration Committee upon termination of employment.Grants of performance shares after 30 June 2003 contain 50% of the shares with a performance hurdle linked to TSR and 50% of the shares granted with a performance hurdle linked to EPS. Where applicable, the fair value of shares with a TSR performance hurdle are disclosed. The fair value of TSR-linked shares is calculated by PwC using valuation techniques which take into account the probability of vesting as reflected in the fair value at grant.
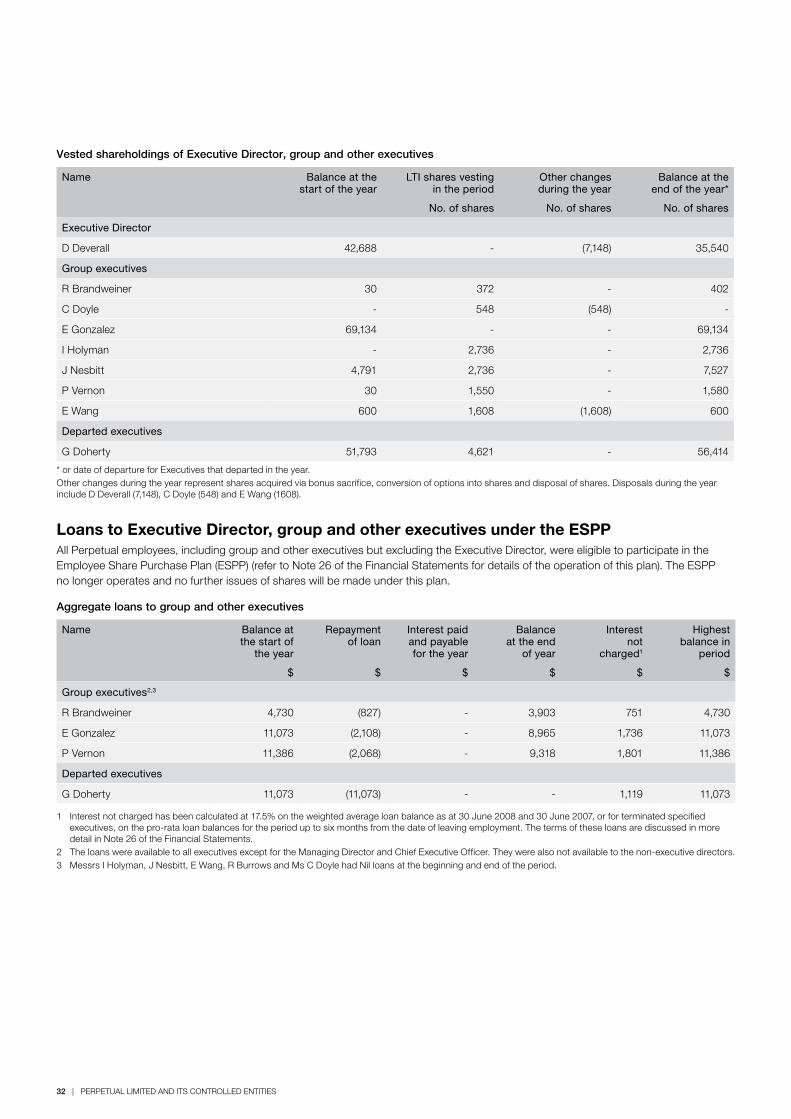
32 | PERPETUAL LIMITED AND ITS CONTROLLED ENTITIES
Vested shareholdings of Executive Director, group and other executives
Name Balance at the start of the year
LTI shares vesting in the period
Other changes during the year
Balance at the end of the year*
No. of shares No. of shares No. of shares
Executive Director
D Deverall 42,688 - (7,148) 35,540
Group executives
R Brandweiner 30 372 - 402
C Doyle - 548 (548) -
E Gonzalez 69,134 - - 69,134
I Holyman - 2,736 - 2,736
J Nesbitt 4,791 2,736 - 7,527
P Vernon 30 1,550 - 1,580
E Wang 600 1,608 (1,608) 600
Departed executives
G Doherty 51,793 4,621 - 56,414
* or date of departure for Executives that departed in the year. Other changes during the year represent shares acquired via bonus sacrifice, conversion of options into shares and disposal of shares. Disposals during the year include D Deverall (7,148), C Doyle (548) and E Wang (1608).
Loans to Executive Director, group and other executives under the ESPP All Perpetual employees, including group and other executives but excluding the Executive Director, were eligible to participate in the Employee Share Purchase Plan (ESPP) (refer to Note 26 of the Financial Statements for details of the operation of this plan). The ESPP no longer operates and no further issues of shares will be made under this plan.
Aggregate loans to group and other executives
Name Balance at the start of
the year
Repayment of loan
Interest paid and payable for the year
Balance at the end
of year
Interest not
charged1
Highest balance in
period
$ $ $ $ $ $
Group executives2,3
R Brandweiner 4,730 (827) - 3,903 751 4,730
E Gonzalez 11,073 (2,108) - 8,965 1,736 11,073
P Vernon 11,386 (2,068) - 9,318 1,801 11,386
Departed executives
G Doherty 11,073 (11,073) - - 1,119 11,073
1 Interest not charged has been calculated at 17.5% on the weighted average loan balance as at 30 June 2008 and 30 June 2007, or for terminated specified executives, on the pro-rata loan balances for the period up to six months from the date of leaving employment. The terms of these loans are discussed in more detail in Note 26 of the Financial Statements.
2 The loans were available to all executives except for the Managing Director and Chief Executive Officer. They were also not available to the non-executive directors.3 Messrs I Holyman, J Nesbitt, E Wang, R Burrows and Ms C Doyle had Nil loans at the beginning and end of the period.
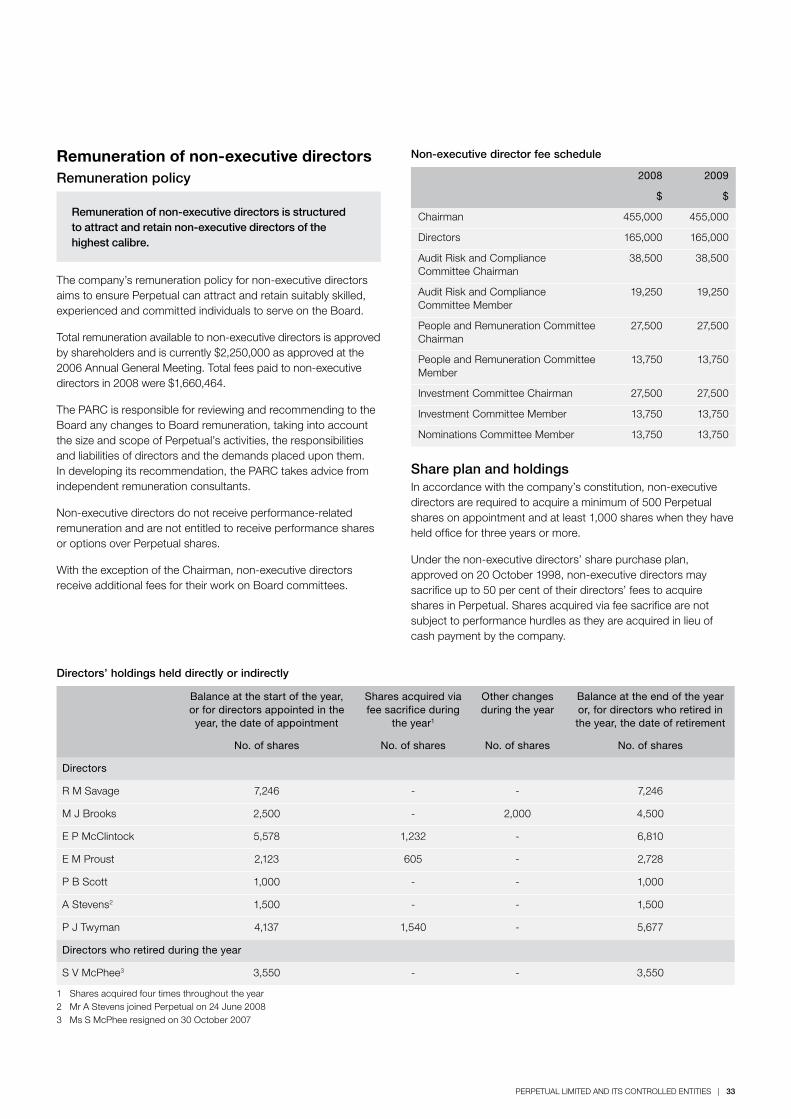
PERPETUAL LIMITED AND ITS CONTROLLED ENTITIES | 33
Remuneration of non-executive directorsRemuneration policy
Remuneration of non-executive directors is structured to attract and retain non-executive directors of the highest calibre.
The company’s remuneration policy for non-executive directors aims to ensure Perpetual can attract and retain suitably skilled, experienced and committed individuals to serve on the Board.
Total remuneration available to non-executive directors is approved by shareholders and is currently $2,250,000 as approved at the 2006 Annual General Meeting. Total fees paid to non-executive directors in 2008 were $1,660,464.
The PARC is responsible for reviewing and recommending to the Board any changes to Board remuneration, taking into account the size and scope of Perpetual’s activities, the responsibilities and liabilities of directors and the demands placed upon them. In developing its recommendation, the PARC takes advice from independent remuneration consultants.
Non-executive directors do not receive performance-related remuneration and are not entitled to receive performance shares or options over Perpetual shares.
With the exception of the Chairman, non-executive directors receive additional fees for their work on Board committees.
Non-executive director fee schedule
2008 2009
$ $
Chairman 455,000 455,000
Directors 165,000 165,000
Audit Risk and Compliance Committee Chairman
38,500 38,500
Audit Risk and Compliance Committee Member
19,250 19,250
People and Remuneration Committee Chairman
27,500 27,500
People and Remuneration Committee Member
13,750 13,750
Investment Committee Chairman 27,500 27,500
Investment Committee Member 13,750 13,750
Nominations Committee Member 13,750 13,750
Share plan and holdingsIn accordance with the company’s constitution, non-executive directors are required to acquire a minimum of 500 Perpetual shares on appointment and at least 1,000 shares when they have held office for three years or more.
Under the non-executive directors’ share purchase plan, approved on 20 October 1998, non-executive directors may sacrifice up to 50 per cent of their directors’ fees to acquire shares in Perpetual. Shares acquired via fee sacrifice are not subject to performance hurdles as they are acquired in lieu of cash payment by the company.
Directors’ holdings held directly or indirectly
Balance at the start of the year, or for directors appointed in the year, the date of appointment
Shares acquired via fee sacrifice during
the year1
Other changes during the year
Balance at the end of the year or, for directors who retired in the year, the date of retirement
No. of shares No. of shares No. of shares No. of shares
Directors
R M Savage 7,246 - - 7,246
M J Brooks 2,500 - 2,000 4,500
E P McClintock 5,578 1,232 - 6,810
E M Proust 2,123 605 - 2,728
P B Scott 1,000 - - 1,000
A Stevens2 1,500 - - 1,500
P J Twyman 4,137 1,540 - 5,677
Directors who retired during the year
S V McPhee3 3,550 - - 3,550
1 Shares acquired four times throughout the year2 Mr A Stevens joined Perpetual on 24 June 20083 Ms S McPhee resigned on 30 October 2007
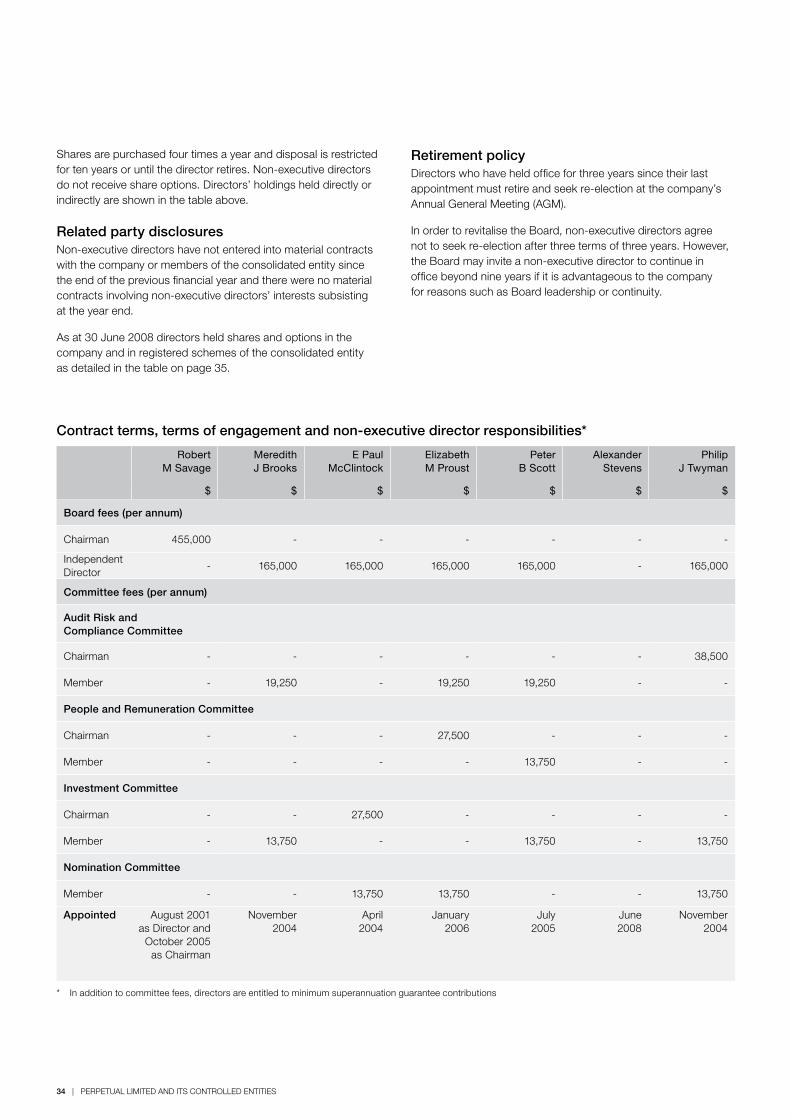
34 | PERPETUAL LIMITED AND ITS CONTROLLED ENTITIES
Shares are purchased four times a year and disposal is restricted for ten years or until the director retires. Non-executive directors do not receive share options. Directors’ holdings held directly or indirectly are shown in the table above.
Related party disclosuresNon-executive directors have not entered into material contracts with the company or members of the consolidated entity since the end of the previous financial year and there were no material contracts involving non-executive directors’ interests subsisting at the year end.
As at 30 June 2008 directors held shares and options in the company and in registered schemes of the consolidated entity as detailed in the table on page 35.
Retirement policyDirectors who have held office for three years since their last appointment must retire and seek re-election at the company’s Annual General Meeting (AGM).
In order to revitalise the Board, non-executive directors agree not to seek re-election after three terms of three years. However, the Board may invite a non-executive director to continue in office beyond nine years if it is advantageous to the company for reasons such as Board leadership or continuity.
Contract terms, terms of engagement and non-executive director responsibilities*
Robert M Savage
Meredith J Brooks
E Paul McClintock
Elizabeth M Proust
Peter B Scott
Alexander Stevens
Philip J Twyman
$ $ $ $ $ $ $
Board fees (per annum)
Chairman 455,000 - - - - - -
Independent Director
- 165,000 165,000 165,000 165,000 - 165,000
Committee fees (per annum)
Audit Risk and Compliance Committee
Chairman - - - - - - 38,500
Member - 19,250 - 19,250 19,250 - -
People and Remuneration Committee
Chairman - - - 27,500 - - -
Member - - - - 13,750 - -
Investment Committee
Chairman - - 27,500 - - - -
Member - 13,750 - - 13,750 - 13,750
Nomination Committee
Member - - 13,750 13,750 - - 13,750
Appointed August 2001 as Director and
October 2005 as Chairman
November 2004
April 2004
January 2006
July 2005
June 2008
November 2004
* In addition to committee fees, directors are entitled to minimum superannuation guarantee contributions
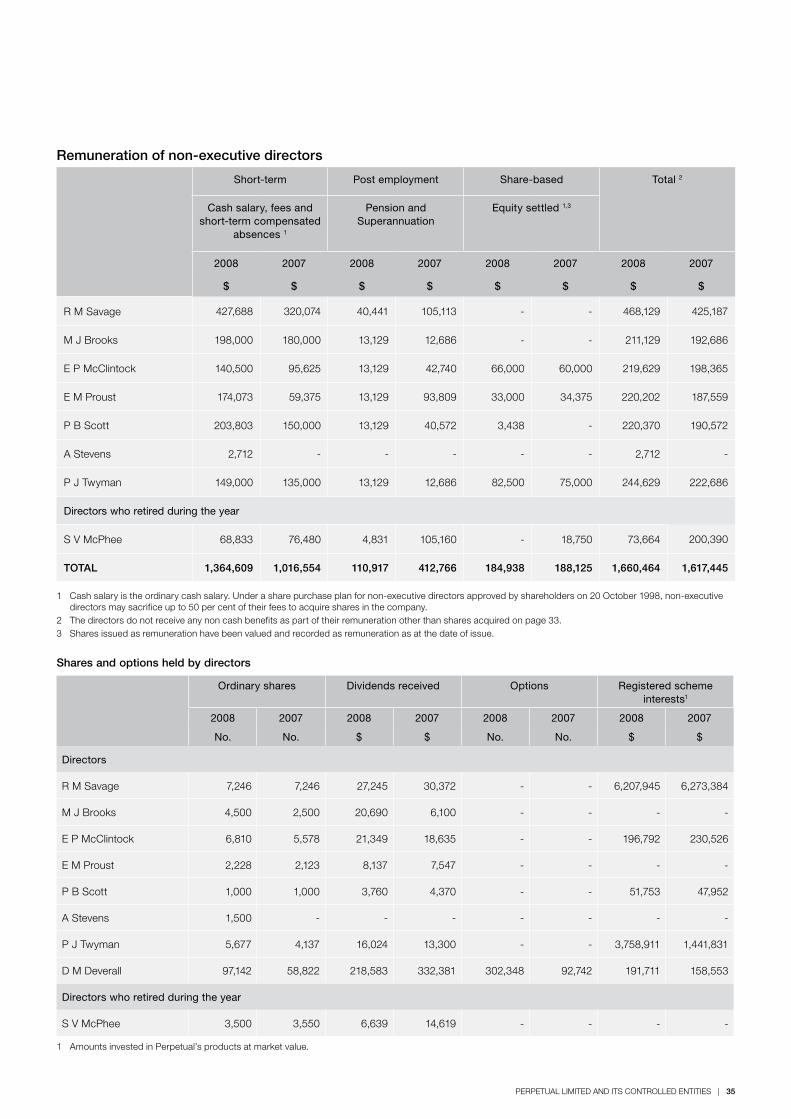
PERPETUAL LIMITED AND ITS CONTROLLED ENTITIES | 35
Remuneration of non-executive directors
Short-term Post employment Share-based Total 2
Cash salary, fees and short-term compensated
absences 1
Pension and Superannuation
Equity settled 1,3
2008 2007 2008 2007 2008 2007 2008 2007
$ $ $ $ $ $ $ $
R M Savage 427,688 320,074 40,441 105,113 - - 468,129 425,187
M J Brooks 198,000 180,000 13,129 12,686 - - 211,129 192,686
E P McClintock 140,500 95,625 13,129 42,740 66,000 60,000 219,629 198,365
E M Proust 174,073 59,375 13,129 93,809 33,000 34,375 220,202 187,559
P B Scott 203,803 150,000 13,129 40,572 3,438 - 220,370 190,572
A Stevens 2,712 - - - - - 2,712 -
P J Twyman 149,000 135,000 13,129 12,686 82,500 75,000 244,629 222,686
Directors who retired during the year
S V McPhee 68,833 76,480 4,831 105,160 - 18,750 73,664 200,390
TOTAL 1,364,609 1,016,554 110,917 412,766 184,938 188,125 1,660,464 1,617,445
1 Cash salary is the ordinary cash salary. Under a share purchase plan for non-executive directors approved by shareholders on 20 October 1998, non-executive directors may sacrifice up to 50 per cent of their fees to acquire shares in the company.
2 The directors do not receive any non cash benefits as part of their remuneration other than shares acquired on page 33.3 Shares issued as remuneration have been valued and recorded as remuneration as at the date of issue.
Shares and options held by directors
Ordinary shares Dividends received Options Registered scheme interests1
2008 2007 2008 2007 2008 2007 2008 2007
No. No. $ $ No. No. $ $
Directors
R M Savage 7,246 7,246 27,245 30,372 - - 6,207,945 6,273,384
M J Brooks 4,500 2,500 20,690 6,100 - - - -
E P McClintock 6,810 5,578 21,349 18,635 - - 196,792 230,526
E M Proust 2,228 2,123 8,137 7,547 - - - -
P B Scott 1,000 1,000 3,760 4,370 - - 51,753 47,952
A Stevens 1,500 - - - - - - -
P J Twyman 5,677 4,137 16,024 13,300 - - 3,758,911 1,441,831
D M Deverall 97,142 58,822 218,583 332,381 302,348 92,742 191,711 158,553
Directors who retired during the year
S V McPhee 3,500 3,550 6,639 14,619 - - - -
1 Amounts invested in Perpetual’s products at market value.
36 | PERPETUAL LIMITED AND ITS CONTROLLED ENTITIES
Chief Executive Officer’s and Chief Financial Officer’s Declaration The Chief Executive Officer and Chief Financial Officer declared in writing to the board, in accordance with section 295A of the Corporations Act 2001 that the financial records of the Company for the financial year have been properly maintained, the Company’s financial reports for the year ended 30 June 2008 comply with accounting standards and present a true and fair view of the Company’s financial condition and operational results. This statement is required annually.
Non-audit servicesDuring the year KPMG, the Company’s auditor, did not perform other non-audit services in addition to their statutory duties (2007: $4,000).
The board considered the non-audit services provided during the prior year by the auditor and in accordance with written advice provided by resolution of the Audit Risk and Compliance Committee, is satisfied that the provision of those non-audit services by the auditor is compatible with, and did not compromise, the auditor independence requirements of the Corporations Act 2001 for the following reasons:
b all non-audit services were subject to the corporate governance procedures adopted by the Company and have been reviewed by the Audit Risk and Compliance Committee to ensure they do not impact the integrity and objectivity of the auditor;
b the non-audit services provided do not undermine the general principles relating to auditor independence as set out in Professional Statement F1 Professional independence, as they did not involve reviewing or auditing the auditor’s own work, acting in a management or decision making capacity for the Company, acting as an advocate for the Company or jointly sharing risks and rewards. Not withstanding the above, amounts paid to external auditors for non-audit services are insignificant in relation to the overall audit engagement.
Lead auditor’s independence declarationThe Lead Auditor’s independence declaration is set out on page 37 and forms part of the Directors’ report for the 30 June 2008 financial year.
Rounding offThe Company is of a kind referred to in ASIC Class Order 98/100 dated 10 July 1998 and in accordance with that Order, amounts in the financial report and the directors’ report have been rounded off to the nearest thousand dollars, unless otherwise stated.
This report is made with a resolution of the directors:
Robert Savage Chairman
David Deverall Chief Executive Officer and Managing Director
Sydney 20th August 2008
PERPETUAL LIMITED AND ITS CONTROLLED ENTITIES | 37
To: the Directors of Perpetual Limited
I declare that, to the best of my knowledge and belief, in relation to the audit for the financial year ended 30 June 2008 there have been:
(i) no contraventions of the auditor independence requirements as set out in the Corporations Act 2001 in relation to the audit; and
(ii) no contraventions of any applicable code of professional conduct in relation to the audit.
KPMG
Dr. Andries B Terblanché Partner
Sydney 20th August 2008
Lead auditor’s independence declaration under Section 307C of the Corporations Act 2001
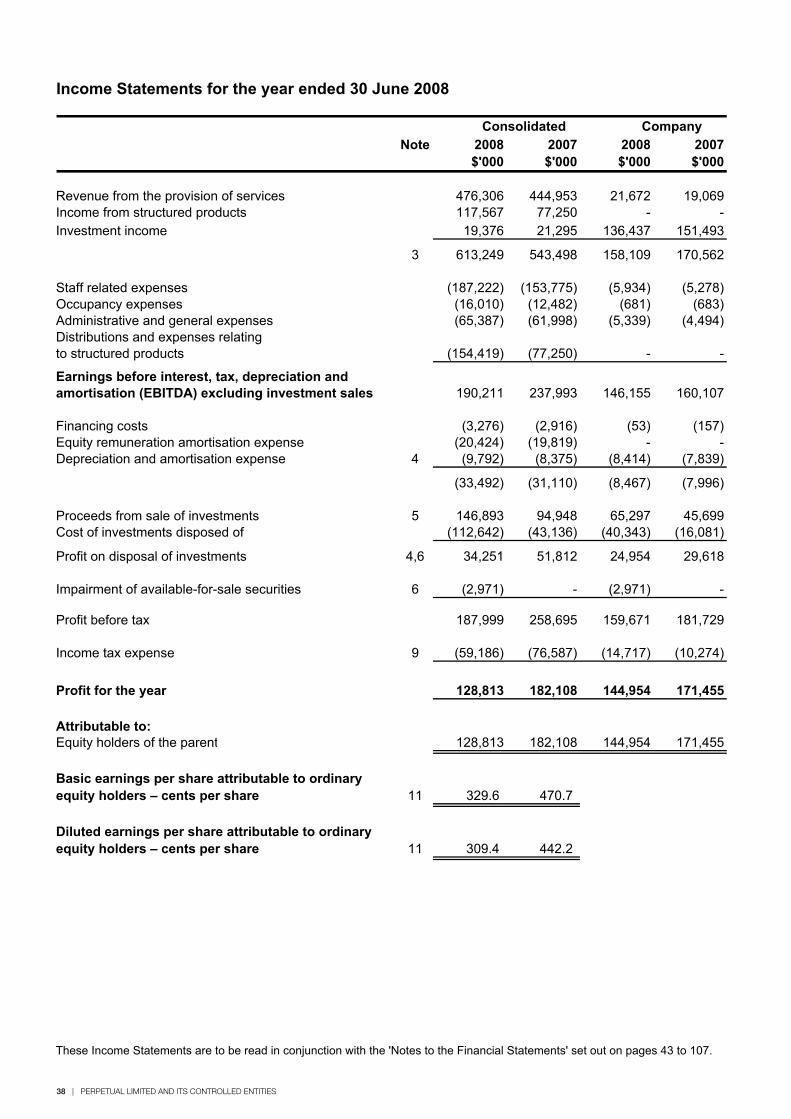
38 | PERPETUAL LIMITED AND ITS CONTROLLED ENTITIES
Income Statements for the year ended 30 June 2008
Note 2008 2007 2008 2007$'000 $'000 $'000 $'000
Revenue from the provision of services 476,306 444,953 21,672 19,069117,567 77,250 - -
Investment income 19,376 21,295 136,437 151,493
3 613,249 543,498 158,109 170,562
Staff related expenses (187,222) (153,775) (5,934) (5,278)Occupancy expenses (16,010) (12,482) (681) (683)Administrative and general expenses (65,387) (61,998) (5,339) (4,494)
(154,419) (77,250) - -
Earnings before interest, tax, depreciation and amortisation (EBITDA) excluding investment sales 190,211 237,993 146,155 160,107
Financing costs (3,276) (2,916) (53) (157)Equity remuneration amortisation expense (20,424) (19,819) - -Depreciation and amortisation expense 4 (9,792) (8,375) (8,414) (7,839)
(33,492) (31,110) (8,467) (7,996)
Proceeds from sale of investments 5 146,893 94,948 65,297 45,699Cost of investments disposed of (112,642) (43,136) (40,343) (16,081)
Profit on disposal of investments 4,6 34,251 51,812 24,954 29,618
Impairment of available-for-sale securities 6 (2,971) - (2,971) -
Profit before tax 187,999 258,695 159,671 181,729
Income tax expense 9 (59,186) (76,587) (14,717) (10,274)
Profit for the year 128,813 182,108 144,954 171,455
Attributable to:Equity holders of the parent 128,813 182,108 144,954 171,455
11 329.6 470.7
11 309.4 442.2
Company
Basic earnings per share attributable to ordinary equity holders – cents per share
Diluted earnings per share attributable to ordinary equity holders – cents per share
These Income Statements are to be read in conjunction with the 'Notes to the Financial Statements' set out on pages 43 to 107.
Consolidated
Income from structured products
Distributions and expenses relating to structured products
PERPETUAL LIMITED AND ITS CONTROLLED ENTITIES | 39
Balance Sheets as at 30 June 2008
Note 2008 2007 2008 2007$'000 $'000 $'000 $'000
Current assetsCash and cash equivalents 12 183,111 214,580 76,324 102,929Receivables 13 88,503 83,042 75,245 28,158Other financial assets 14 100 100 - -Structured product assets 29 1,507,331 1,430,564 - -Derivative financial instruments 15 15,503 10,779 - -Prepayments 19 7,781 5,357 4,074 4,208
Total current assets 1,802,329 1,744,422 155,643 135,295
Non-current assetsReceivables 13 - - - 414Shares in other companies, investments in 14 77,032 123,412 256,265 300,171unlisted unit trusts and other financial assets Structured products – loans receivable 29 343,633 160,541 - -Property, plant and equipment 16 30,654 27,345 30,439 27,065Intangibles 17 87,956 76,637 20,336 14,469Deferred tax assets 18 28,538 20,874 20,117 19,242
Total non-current assets 567,813 408,809 327,157 361,361
Total assets 2,370,142 2,153,231 482,800 496,656
Current liabilitiesPayables 20 43,554 45,538 66,700 63,238Structured product liabilities 29 1,507,331 1,430,564 - -Structured products – payable to investors 29 122,705 - - -Structured products – income received in advance 21 21,264 12,264 - -Derivative financial instruments 15 235 2,751 - -Current tax liabilities 25,408 41,986 25,396 41,987Employee benefits 26 37,122 35,012 36,849 34,595Provisions 23 825 1,466 825 -
Total current liabilities 1,758,444 1,569,581 129,770 139,820
Non-current liabilitiesPayables 20 8,401 5,434 - -Interest-bearing liabilities 22 45,000 45,000 - -Structured products – interest-bearing liabilities 29 215,600 160,671 - -Deferred tax liabilities 18 1,587 13,988 1,382 9,798Employee benefits 26 2,125 1,804 2,092 1,787Provisions 23 24,575 15,789 19,666 14,822
Total non-current liabilities 297,288 242,686 23,140 26,407
Total liabilities 2,055,732 1,812,267 152,910 166,227
Net assets 314,410 340,964 329,890 330,429
EquityContributed equity 24 163,811 152,641 193,460 181,568Reserves 25 44,280 64,506 36,968 47,294Retained earnings 105,574 123,817 99,462 101,567
Total equity attributable to holders of parent 313,665 340,964 329,890 330,429
Minority interest 745 - - -
Total equity 314,410 340,964 329,890 330,429
CompanyConsolidated
These Balance Sheets are to be read in conjunction with the 'Notes to the Financial Statements' set out on pages 43 to 107.

40 | PERPETUAL LIMITED AND ITS CONTROLLED ENTITIES
Stat
emen
ts o
f Cha
nges
in E
quity
for t
he y
ear e
nded
30
June
200
8
Con
solid
ated
Gro
ssco
ntrib
uted
Trea
sury
shar
eTo
tal
cont
ribut
edC
apita
lpr
ofits
Ava
ilabl
efo
r sal
e G
ener
al
Fore
ign
curr
ency
Equi
tyco
mpe
nsat
ion
Cas
hflo
whe
dge
Tota
lR
etai
ned
Tota
lM
inor
ity
Tota
l$'
000
equi
ty
rese
rve
equi
tyre
serv
e re
serv
e re
serv
ere
serv
ere
serv
ere
serv
ere
serv
esea
rnin
gs
inte
rest
Bal
ance
at 1
Jul
y 20
0727
7,79
9(1
25,1
58)
152,
641
-32
,660
103
(913
)32
,539
117
64,5
0612
3,81
734
0,96
4 -
340,
964
Item
s re
cogn
ised
dire
ctly
in e
quity
Fore
ign
exch
ange
tran
slat
ion
diffe
renc
es -
- -
- -
-22
5 -
-22
5 -
225
-22
5Im
pairm
ent o
f inv
estm
ents
- -
- -
2,97
1 -
- -
-2,
971
-2,
971
-2,
971
Fair
valu
e ad
just
men
ts ta
ken
to p
rofit
and
loss
on
sale
of i
nves
tmen
ts -
- -
- -
- -
- -
- -
- -
-C
hang
e in
fair
valu
e of
fina
ncia
l ass
ets
avai
labl
e fo
r sal
e -
- -
-(4
3,65
8) -
- -
-(4
3,65
8) -
(43,
658)
-(4
3,65
8)D
efer
red
inco
me
tax
liabi
lity
on c
hang
e in
fair
valu
e of
ass
ets
- -
- -
13,1
32 -
- -
-13
,132
-13
,132
-13
,132
Net
inco
me
reco
gnis
ed d
irect
ly in
equ
ity -
- -
-(2
7,55
5) -
225
- -
(27,
330)
-(2
7,33
0) -
(27,
330)
Pro
fit fo
r the
yea
r -
- -
- -
- -
- -
-12
8,81
312
8,81
3 -
128,
813
Tota
l rec
ogni
sed
inco
me
and
expe
nse
for t
he y
ear
- -
- -
(27,
555)
-22
5 -
-(2
7,33
0)12
8,81
310
1,48
3 -
101,
483
Tran
sact
ions
with
equ
ity h
olde
rs in
thei
r cap
acity
as
equ
ity h
olde
rs27
7,79
9(1
25,1
58)
152,
641
-5,
105
103
(688
)32
,539
117
37,1
7625
2,63
044
2,44
7 -
442,
447
Con
tribu
tions
of e
quity
(opt
ions
exe
rcis
ed)
5,12
9 -
5,12
9 -
- -
- -
- -
-5,
129
-5,
129
Em
ploy
ee S
hare
Pur
chas
e P
lan
loan
repa
ymen
ts d
urin
g th
e ye
ar -
893
893
- -
- -
- -
- -
893
-89
3Tr
easu
ry s
hare
s is
sued
dur
ing
the
year
42,7
76(4
2,77
6) -
- -
- -
- -
- -
- -
-Tr
easu
ry s
hare
s pu
rcha
sed
on m
arke
t -
(1,2
50)
(1,2
50)
- -
- -
- -
- -
(1,2
50)
-(1
,250
)Tr
easu
ry s
hare
s ve
sted
dur
ing
the
year
-7,
674
7,67
4 -
- -
-(7
,674
) -
(7,6
74)
- -
- -
TSR
ves
ted
shar
es fa
ir va
lue
adju
stm
ent
(20)
20 -
- -
- -
- -
- -
- -
-R
ecyc
led
shar
es fa
ir va
lue
adju
stm
ent
(981
)98
1 -
- -
- -
- -
- -
- -
-D
ivid
ends
on
treas
ury
shar
es u
sed
to p
urch
ase
equi
ty -
(1,2
76)
(1,2
76)
- -
- -
1,27
6 -
1,27
6 -
- -
-D
ivid
ends
pai
d to
sha
reho
lder
s -
- -
- -
- -
- -
-(1
56,4
76)
(156
,476
) -
(156
,476
)D
ivid
ends
pai
d on
trea
sury
sha
res
- -
- -
- -
-(9
,420
) -
(9,4
20)
9,42
0 -
- -
Mar
k to
mar
ket o
f int
eres
t rat
e sw
aps
- -
- -
- -
- -
2,88
22,
882
-2,
882
-2,
882
Tran
sfer
of m
ark
to m
arke
t of i
nter
est r
ate
swap
s to
pro
fit a
nd lo
ss -
- -
- -
- -
-(1
55)
(155
) -
(155
) -
(155
)P
erpe
tual
Jam
es F
ield
ing
fair
valu
e ad
just
men
t -
- -
-(1
98)
- -
- -
(198
) -
(198
) -
(198
)Tr
ansf
er fr
om c
apita
l pro
fits
rese
rve
--
--
- -
--
--
--
- -
ES
PP
and
opt
ions
ves
ted
--
--
- -
-(3
1)-
(31)
-(3
1) -
(31)
Am
ortis
atio
n of
trea
sury
sha
res
- -
- -
- -
-20
,424
-20
,424
-20
,424
-20
,424
Min
ority
inte
rest
- -
- -
- -
- -
- -
- -
745
745
Bal
ance
at 3
0 Ju
ne 2
008
324,
703
(160
,892
)16
3,81
1 -
4,90
710
3(6
88)
37,1
142,
844
44,2
8010
5,57
431
3,66
574
531
4,41
0
Con
solid
ated
Gro
ssco
ntrib
uted
Trea
sury
shar
eTo
tal
cont
ribut
edC
apita
lpr
ofits
Ava
ilabl
e fo
r sa
le
Gen
eral
Fo
reig
ncu
rren
cyEq
uity
com
pens
atio
nC
ashf
low
hedg
e To
tal
Ret
aine
dTo
tal
Min
ority
To
tal
$'00
0eq
uity
re
serv
eeq
uity
rese
rve
rese
rve
rese
rve
rese
rve
rese
rve
rese
rve
rese
rves
earn
ings
in
tere
stB
alan
ce a
t 1 J
uly
2006
255,
200
(115
,555
)13
9,64
521
,253
53,5
9710
3(2
98)
27,2
16 -
101,
871
89,4
8033
0,99
6 -
330,
996
Item
s re
cogn
ised
dire
ctly
in e
quity
Fore
ign
exch
ange
tran
slat
ion
diffe
renc
es -
- -
- -
-(6
15)
- -
(615
) -
(615
) -
(615
)Fa
ir va
lue
adju
stm
ents
take
n to
pro
fit a
nd lo
ss o
n sa
le o
f inv
estm
ents
- -
- -
(48,
951)
- -
- -
(48,
951)
-(4
8,95
1) -
(48,
951)
Cha
nge
in fa
ir va
lue
of fi
nanc
ial a
sset
s av
aila
ble
for s
ale
- -
- -
19,0
92 -
- -
-19
,092
-19
,092
-19
,092
Def
erre
d in
com
e ta
x lia
bilit
y on
cha
nge
in fa
ir va
lue
of a
sset
s -
- -
-8,
922
- -
- -
8,92
2 -
8,92
2 -
8,92
2N
et in
com
e re
cogn
ised
dire
ctly
in e
quity
- -
- -
(20,
937)
-(6
15)
- -
(21,
552)
-(2
1,55
2) -
(21,
552)
Pro
fit fo
r the
yea
r -
- -
- -
- -
- -
-18
2,10
818
2,10
8 -
182,
108
Tota
l rec
ogni
sed
inco
me
and
expe
nse
for t
he y
ear
- -
- -
(20,
937)
-(6
15)
- -
(21,
552)
182,
108
160,
556
-16
0,55
6Tr
ansa
ctio
ns w
ith e
quity
hol
ders
in th
eir c
apac
ity
as e
quity
hol
ders
255,
200
(115
,555
)13
9,64
521
,253
32,6
6010
3(9
13)
27,2
16 -
80,3
1927
1,58
849
1,55
2 -
491,
552
Con
tribu
tions
of e
quity
(opt
ions
exe
rcis
ed)
8,84
4 -
8,84
4 -
- -
- -
- -
-8,
844
-8,
844
Em
ploy
ee S
hare
Pur
chas
e P
lan
loan
repa
ymen
ts d
urin
g th
e ye
ar -
587
587
- -
- -
- -
- -
587
-58
7Tr
easu
ry s
hare
s is
sued
dur
ing
the
year
13,7
55(1
3,75
5) -
- -
- -
- -
- -
- -
-Tr
easu
ry s
hare
s pu
rcha
sed
on m
arke
t -
(925
)(9
25)
- -
- -
- -
- -
(925
) -
(925
)Tr
easu
r y s
hare
s ve
sted
dur
ing
the
year
-6,
024
6,02
4-
- -
-(6
,024
)-
(6,0
24)
--
- -
Div
iden
ds o
n tre
asur
y sh
ares
use
d to
pur
chas
e eq
uity
-(1
,534
)(1
,534
)-
- -
-1,
534
-1,
534
--
- -
Div
iden
ds p
aid
on tr
easu
ry s
hare
s-
--
--
--
(10,
006)
-(1
0,00
6)10
,006
- -
-D
ivid
ends
pai
d to
sha
reho
lder
s -
- -
- -
- -
- -
-(1
79,0
30)
(179
,030
) -
(179
,030
)Tr
ansf
er to
cap
ital p
rofit
s re
serv
e -
- -
(21,
253)
- -
- -
-(2
1,25
3)21
,253
- -
-M
ark
to m
arke
t of i
nter
est r
ate
swap
s -
- -
- -
- -
-11
711
7 -
117
-11
7A
mor
tisat
ion
of tr
easu
ry s
hare
s -
- -
- -
- -
19,8
19 -
19,8
19 -
19,8
19 -
19,8
19B
alan
ce a
t 30
June
200
727
7,79
9(1
25,1
58)
152,
641
-32
,660
103
(913
)32
,539
117
64,5
0612
3,81
734
0,96
4 -
340,
964
The
Sta
tem
ent o
f Cha
nges
in E
quity
is to
be
read
in c
onju
nctio
n w
ith th
e "N
otes
to th
e Fi
nanc
ial S
tate
men
ts" s
et o
ut o
n pa
ges
43 to
107
PERPETUAL LIMITED AND ITS CONTROLLED ENTITIES | 41
Stat
emen
ts o
f Cha
nges
in E
quity
for t
he y
ear e
nded
30
June
200
8
Com
pany
Gro
ssco
ntrib
uted
Trea
sury
shar
eTo
tal
cont
ribut
edC
apita
lpr
ofits
Ava
ilabl
efo
r sal
e Eq
uity
com
pens
atio
nC
ashf
low
hedg
e To
tal
Ret
aine
dTo
tal
$'00
0eq
uity
re
serv
eeq
uity
rese
rve
rese
rve
rese
rve
rese
rve
rese
rves
earn
ings
Bal
ance
at 1
Jul
y 20
0727
7,79
9(9
6,23
1)18
1,56
8 -
22,8
6124
,433
-47
,294
101,
567
330,
429
Fair
valu
e ad
just
men
ts ta
ken
to p
rofit
and
loss
on
sale
of i
nves
tmen
ts -
- -
- -
- -
- -
-Im
pairm
ent o
f inv
estm
ents
- -
- -
2,97
1 -
-2,
971
-2,
971
Cha
nge
in fa
ir va
lue
of fi
nanc
ial a
sset
s av
aila
ble
for s
ale
- -
- -
(28,
012)
- -
(28,
012)
-(2
8,01
2)D
efer
red
inco
me
tax
liabi
lity
on c
hang
e in
fair
valu
e of
ass
ets
- -
- -
8,40
4 -
-8,
404
-8,
404
Net
inco
me
reco
gnis
ed d
irect
ly in
equ
ity -
- -
-(1
6,63
7) -
-(1
6,63
7) -
(16,
637)
Pro
fit fo
r the
yea
r -
- -
- -
- -
-
14
4,95
414
4,95
4
Tota
l rec
ogni
sed
inco
me
and
expe
nse
for t
he y
ear
- -
- -
(16,
637)
- -
(16,
637)
144,
954
128,
317
Tran
sact
ions
with
equ
ity h
olde
rs in
thei
r cap
acity
as
equ
ity h
olde
rs27
7,79
9(9
6,23
1)18
1,56
8 -
6,22
424
,433
-30
,657
246,
521
458,
746
Con
tribu
tions
of e
quity
(opt
ions
exe
rcis
ed)
5,12
9 -
5,12
9 -
- -
- -
-5,
129
Em
ploy
ee S
hare
Pur
chas
e P
lan
loan
repa
ymen
ts d
urin
g th
e ye
ar -
893
893
- -
- -
- -
893
Trea
sury
sha
res
issu
ed d
urin
g th
e ye
ar42
,776
(42,
776)
- -
- -
- -
- -
Trea
sury
sha
res
purc
hase
d on
mar
ket
-(1
,250
)(1
,250
) -
- -
- -
-(1
,250
)Tr
easu
ry s
hare
s ve
sted
dur
ing
the
year
-7,
822
7,82
2 -
-(7
,822
) -
(7,8
22)
- -
TSR
ves
ted
shar
es(2
0)20
- -
- -
- -
- -
Rec
ycle
d sh
ares
(981
)98
1 -
- -
- -
- -
-O
ptio
ns v
este
d du
ring
the
year
- -
- -
-90
7 -
907
-90
7D
ivid
ends
on
treas
ury
shar
es u
sed
to p
urch
ase
equi
ty -
(702
)(7
02)
- -
702
-70
2 -
-D
ivid
ends
pai
d to
sha
reho
lder
s -
- -
- -
- -
-(1
56,4
76)
(156
,476
)D
ivid
ends
pai
d on
trea
sury
sha
res
- -
- -
-(9
,420
) -
(9,4
20)
9,42
0 -
Tran
sfer
to c
apita
l pro
fits
rese
rve
- -
- -
- -
- -
- -
Tran
sfer
from
cap
ital p
rofit
s re
serv
e -
- -
- -
- -
- -
-Fo
reig
n cu
rren
cy tr
ansl
atio
n di
ffere
nces
- -
- -
- -
- -
(3)
(3)
Am
ortis
atio
n of
trea
sury
sha
res
- -
- -
-21
,944
-21
,944
-21
,944
Bal
ance
at 3
0 Ju
ne 2
008
324,
703
(131
,243
)19
3,46
0 -
6,22
430
,744
-36
,968
99,4
6232
9,89
0
Com
pany
Gro
ssco
ntrib
uted
Trea
sury
shar
eTo
tal
cont
ribut
edC
apita
lpr
ofits
Ava
ilabl
efo
r sal
e Eq
uity
com
pens
atio
nC
ash
flow
he
dge
Tota
lR
etai
ned
Tota
l$'
000
equi
ty
rese
rve
equi
tyre
serv
ere
serv
e re
serv
ere
serv
ere
serv
esea
rnin
gsB
alan
ce a
t 1 J
uly
2006
255,
200
(86,
627)
168,
573
34,2
6533
,889
22,1
75 -
90,3
2964
,871
323,
773
Fair
valu
e ad
just
men
ts ta
ken
to p
rofit
and
loss
on
sale
of i
nves
tmen
ts-
--
-(2
1,14
2)-
-(2
1,14
2) -
(21,
142)
Cha
nge
in fa
ir va
lue
of fi
nanc
ial a
sset
s av
aila
ble
for s
ale
--
- -
5,38
7-
-5,
387
-5,
387
Def
erre
d in
com
e ta
x lia
bilit
y on
cha
nge
in fa
ir va
lue
of a
sset
s -
- -
-4,
727
- -
4,72
7 -
4,72
7N
et in
com
e re
cogn
ised
dire
ctly
in e
quity
- -
- -
(11,
028)
- -
(11,
028)
-(1
1,02
8)
Pro
fit fo
r the
yea
r -
- -
- -
- -
-17
1,45
517
1,45
5
Tota
l rec
ogni
sed
inco
me
and
expe
nse
for t
he y
ear
- -
- -
(11,
028)
- -
(11,
028)
171,
455
160,
427
Tran
sact
ions
with
equ
ity h
olde
rs in
thei
r cap
acity
as
equ
ity h
olde
rs25
5,20
0(8
6,62
7)16
8,57
334
,265
22,8
6122
,175
-79
,301
236,
326
484,
200
Con
tribu
tions
of e
quity
(opt
ions
exe
rcis
ed)
8,84
4 -
8,84
4 -
- -
- -
-8,
844
Em
ploy
ee S
hare
Pur
chas
e P
lan
loan
repa
ymen
ts d
urin
g th
e ye
ar -
586
586
- -
- -
- -
586
Trea
sury
sha
res
issu
ed d
urin
g th
e ye
ar13
,755
(13,
755)
- -
- -
- -
- -
Trea
sury
sha
res
purc
hase
d on
mar
ket
-(9
25)
(925
) -
- -
- -
-(9
25)
Trea
sury
sha
res
vest
ed d
urin
g th
e ye
ar -
6,02
46,
024
- -
(6,0
24)
-(6
,024
) -
-D
ivid
ends
on
treas
ury
shar
es u
sed
to p
urch
ase
equi
ty -
(1,5
34)
(1,5
34)
- -
1,53
4 -
1,53
4 -
-D
ivid
ends
pai
d to
sha
reho
lder
s -
- -
- -
- -
-(1
79,0
30)
(179
,030
)D
ivid
ends
pai
d on
trea
sury
sha
res
- -
- -
-(1
0,00
6)(1
0,00
6)10
,006
-Tr
ansf
er to
cap
ital p
rofit
s re
serv
e -
- -
(34,
265)
- -
-(3
4,26
5)34
,265
-Tr
ansf
er fr
om c
apita
l pro
fits
rese
rve
- -
- -
- -
- -
- -
Am
ortis
atio
n of
trea
sury
sha
res
- -
- -
-16
,754
-16
,754
-16
,754
Bal
ance
at 3
0 Ju
ne 2
007
277,
799
(96,
231)
181,
568
-22
,861
24,4
33-
47,2
9 410
1,56
733
0,42
9
The
Sta
tem
ent o
f Cha
nges
in E
quity
is to
be
read
in c
onju
nctio
n w
ith th
e "N
otes
to th
e Fi
nanc
ial S
tate
men
ts" s
et o
ut o
n pa
ges
43 to
107
42 | PERPETUAL LIMITED AND ITS CONTROLLED ENTITIES
Cash Flow Statements for the year ended 30 June 2008
Note 2008 2007 2008 2007$'000 $'000 $'000 $'000
Cash flows from operating activitiesCash receipts in the course of operations 480,162 496,082 26,903 52,480Cash payments in the course of operations (310,671) (276,009) (9,171) (27,597)Dividends received 1,921 2,846 115,626 138,358Interest received 13,432 16,009 10,443 10,342Interest paid (3,276) (2,916) (53) (157)Net advances (to) / from subsidiaries - - (21,447) 70,173Income taxes paid (72,518) (53,451) (24,560) (53,312)Net cash from operating activities 34 109,050 182,561 97,741 190,287
Cash flows from investing activitiesPayments for property, plant and equipment (17,680) (17,940) (16,514) (17,720)Payments for investments (102,793) (46,359) (24,348) (38,548)Repayments of advances to employees 893 587 893 587Acquisition of business operations 35 (5,418) (6,110) - -Proceeds from the sale of investments 151,961 85,274 74,593 38,887Capitalisation of subsidiaries - - - (28,851)Repayment of loan from subsidiary - - - 23,350Loan to Perpetual Diversified Infrastructure Fund (6,000) - - -Tax paid on sale of investments (10,135) (16,226) (7,623) (16,226)Net cash from investing activities 10,828 (774) 27,001 (38,521)
Cash flows from financing activitiesProceeds from issue of shares 5,129 8,844 5,129 8,844Dividends paid (156,476) (179,030) (156,476) (179,028)Net cash used in financing activities (151,347) (170,186) (151,347) (170,184)
Net increase / (decrease) in cash and cash equivalents (31,469) 11,601 (26,605) (18,418)Cash and cash equivalents at 1 July 214,580 202,979 102,929 121,347
Cash and cash equivalents at 30 June 12 183,111 214,580 76,324 102,929
CompanyConsolidated
These Cash Flow Statements are to be read in conjunction with 'Notes to the Financial Statements' set out on pages 43 to 107.
PERPETUAL LIMITED AND ITS CONTROLLED ENTITIES | 43
Note 1. Reporting entity
The financial report was authorised for issue by the directors on 20th August 2008.
Note 2. Summary of significant accounting policies
a. Statement of compliance
b. Basis of preparation
Note 15. Valuation of financial instrumentsNote 17. Impairment of goodwill and intangibles with indefinite useful livesNote 18. Ability to realise deferred tax assetsNote 23 and 31. Provisions and contingenciesNote 26. Vesting profile of treasury sharesNote 29. Structured products – loan receivable provisionNote 35. Business combinations
Notes to and forming part of the financial statements for the year ended 30 June 2008
Perpetual Limited (the Company) is domiciled in Australia. The consolidated financial report of the Company as at and for the year ended 30 June 2008 comprises the Company and its controlled entities (together referred to as the consolidated entity) and the consolidated entity’s interests in associates.
The financial report is a general purpose financial report prepared in accordance with Australian Accounting Standards (including Australian Interpretations) adopted by the Australian Accounting Standards Board (AASB) and the Corporations Act 2001.
The financial reports of the consolidated entity and the Company also comply with International Financial Reporting Standards and interpretations (IFRS) adopted by the International Accounting Standards Board (IASB).
The accounting policies set out below have been applied consistently to all periods presented in the consolidated report, and have been applied consistently by the consolidated entity.
In particular, information about significant areas of estimation uncertainty and critical judgements in applying accounting policies that have the most significant effect on the amount recognised in the consolidated financial report are:
The consolidated financial statements have been prepared on a historical cost basis, except for available-for-sale financial assets and derivative financial instruments which are measured at fair value. Non-current assets are stated at lower of carrying amount or fair value less selling costs.
The consolidated financial statements are presented in Australian dollars, which is the Company’s functional and presentation currency and the functional currency of the majority of the consolidated entity. Functional currency is the currency of the primary economic environment in which the entity operates.
The Company is of a kind referred to in ASIC Class Order 98/100 dated 10 July 1998 and in accordance with that Class Order, all financial information presented in Australian dollars has been rounded to the nearest thousand unless otherwise stated.
The preparation of the financial report requires management to make judgements, estimates and assumptions that affect the application of accounting policies and the reported amounts of assets, liabilities, income and expenses. Actual results may differ from these estimates. Estimates and underlying assumptions are reviewed on an ongoing basis. Revisions to accounting estimates are recognised in the period in which the estimate is revised and in any future periods affected.
44 | PERPETUAL LIMITED AND ITS CONTROLLED ENTITIES
Note 2. Summary of significant accounting policies (continued)
c. Basis of consolidation
(i) Subsidiaries
Investments in subsidiaries are carried at cost in the Company’s financial statements.
(ii) Share plan entities
(iii) Associates
(iv) Transactions eliminated on consolidation
d. Foreign currency translation
(i) Foreign currency transactions and balancesForeign currency transactions are translated into the functional currency using the exchange rates prevailing at the dates of the transactions. Foreign exchange gains and losses resulting from the settlement of such transactions and from the translation at year end exchange rates of monetary assets and liabilities denominated in foreign currencies are recognised in the Income Statement.
Intra-group balances and any unrealised income and expenses arising from intra-group transactions, are eliminated in preparing consolidated financial statements. Unrealised gains arising from transactions with associates are eliminated against the investment to the extent of the consolidated entity’s interest in the associate. Unrealised losses are eliminated in the same way as unrealised gains, but only to the extent that there is no evidence of impairment. Gains and losses are recognised when the contributed assets are consumed or sold by the associates or, if not consumed or sold, when the consolidated entity’s interest in such entities is disposed of.
Notes to and forming part of the financial statements for the year ended 30 June 2008
Subsidiaries are entities controlled by the consolidated entity. Control exists when the consolidated entity has the power to govern the financial and operating policies of an entity so as to obtain benefits from its activities. In assessing control, potential voting rights presently exercisable are taken into account. Financial statements of subsidiaries are included in the consolidated financial statements from the date control commences until the date control ceases.
The consolidated entity has established a number of share plan entities (SPE) in relation to the administration of employee shares plans rather than for trading and investment purposes. A SPE is consolidated if, based on an evaluation of the substance of its relationships within the consolidated entity and the SPE’s risks and rewards, the consolidated entity concludes that it controls the SPE. SPEs controlled by the consolidated entity were established under terms that impose strict limitations on the decision making powers of the SPEs’ management and that result in the consolidated entity receiving the majority of the benefits related to the SPEs operations and net assets, being exposed to risks incident to the SPEs activities and retaining the majority of the residual or ownership risks related to the SPEs or their assets.
Associates are those entities in which the consolidated entity has significant influence, but not control, over the financial and operating policies. Significant influence is presumed to exist when the consolidated entity holds between 20 and 50 percent of the voting power of another entity. Associates are accounted for using the equity method. The consolidated financial statements include the consolidated entity’s share of the income and expenses of associates, after adjustments to align the accounting policies with those of the consolidated entity, from the date significant influence commences until the date significant influence ceases. When the consolidated entity’s share of losses exceeds its interest in an associate, the carrying amount is reduced to nil and recognition of further losses is discontinued except to the extent that the consolidated entity has incurred legal or constructive obligations to make payments on behalf of an associate.
PERPETUAL LIMITED AND ITS CONTROLLED ENTITIES | 45
Note 2. Summary of significant accounting policies (continued)
d. Foreign currency translation (continued)
(i) Foreign currency transactions and balances (continued)
(ii) Foreign operations
e. Intangible assets
(i) Goodwill
Negative goodwill arising on an acquisition is recognised directly in profit or loss.
(ii) Software
(iii) Other intangible assets
Gains and losses on the disposal of an entity include the carrying amount of goodwill relating to the entity sold.
Certain internal and external costs directly incurred in acquiring and developing software have been capitalised and are amortised over their useful life. Development costs include only those costs directly attributable to the development phase and are only recognised following completion of technical feasibility and where the consolidated entity has an intention and ability to use the asset. Costs incurred on software maintenance are expensed as incurred.
Other intangible assets acquired by the consolidated entity, which have finite useful lives, are stated at cost less accumulated amortisation (refer to accounting policy e (v)) and impairment losses (see accounting policy u).
Goodwill represents the excess of acquisition cost over the fair value of the consolidated entity’s share of the net identifiable assets of the acquired subsidiary or associate at the date of acquisition. Goodwill on acquisition of subsidiaries is included in intangible assets and on acquisition of associates is included in investment in associates. Goodwill is allocated to cash-generating units and is not amortised, but tested for impairment annually or more frequently if events or changes in circumstances indicate that it might be impaired. When impaired, goodwill is carried at cost less accumulated impairment losses (see accounting policy u).
Notes to and forming part of the financial statements for the year ended 30 June 2008
Translation differences on financial assets and liabilities carried at fair value are reported as part of their fair value gain or loss. Translation differences on non-monetary financial assets and liabilities such as equities held at fair value through profit and loss are recognised in profit and loss as part of the fair value gain or loss. Translation differences on non-monetary financial assets such as equities classified as available-for-sale financial assets are included in the asset revaluation reserve in equity.
The results and financial position of subsidiaries that have a functional currency different from the presentation currency are translated into Australian dollars as follows:
When a foreign operation is sold, a proportionate share of such exchange differences are recognised in the Income Statement as part of the gain or loss on sale where applicable.
Assets and liabilities for each Balance Sheet presented are translated at the closing rate at the date of that balance sheetIncome and expenses for each Income Statement are translated at average exchange rates (unless this is not a reasonable approximation of the cumulative effect of the rates prevailing on the transaction dates, in which case income and expenses are translated at the dates of the transactions)All resulting foreign exchange differences are recognised as a separate component of equity.
46 | PERPETUAL LIMITED AND ITS CONTROLLED ENTITIES
Note 2. Summary of significant accounting policies (continued)
e. Intangible assets (continued)
(iv) Subsequent expenditure
(v) Amortisation
The estimated useful lives in the current and comparative periods are as follows:
capitalised software costs: 2.5 - 5 yearsfunds under management acquired: 5 yearscustomer contracts acquired: 5 - 10 years.
f. Revenue and income recognition
(i) Revenue from the provision of services
(ii) Investment incomeInterest income is recognised as it accrues taking into account the effective yield of the financial asset.
Unit trust distributions are recognised in the Income Statement as they are received.
(iii) Sale of non-current assets
g. Segment reporting
A segment is a distinguishable component of the consolidated entity engaged in providing related services (business segment), or providing services within an economic environment (geographical segment), which is subject to risks and rewards different from those of other segments. The consolidated entity’s primary format for segment reporting is based on business segments. The business segments are determined based on the consolidated entity’s management and internal reporting structure.
Revenue is recognised at fair value of consideration received or receivable net of goods and services tax payable to the taxation authority.
Revenue is earned from provision of services to customers outside the consolidated entity. Revenue is recognised when services are provided.
Dividend income is recognised in the Income Statement on the date the entity's right to receive payment is established which, in the case of quoted securities, is the ex-dividend date.
Profit or loss on disposal of assets is brought to account at the date an unconditional contract of sale is signed.
Notes to and forming part of the financial statements for the year ended 30 June 2008
Subsequent expenditure is capitalised only when it increases future economic benefits embodied in the specific asset to which it relates. All other expenditure is expensed as incurred.
Amortisation is recognised in the Income Statement on a straight-line basis over the period the benefits from the assets arise, unless these assets are indefinite life assets. Goodwill and intangible assets with an indefinite useful life are systematically tested for impairment at each balance sheet date or more frequently if events or changes in circumstances indicate that they might be impaired. Other intangible assets are amortised from the date they are available for use.
Net gains or losses on disposal of non-current assets are included as other operating income or other operating expenses accordingly. The gain or loss arising from disposal of an item of property, plant and equipment is determined as the difference between net disposal proceeds, being the cash price equivalent where payment is deferred, and the carrying amount of the item.
PERPETUAL LIMITED AND ITS CONTROLLED ENTITIES | 47
Note 2. Summary of significant accounting policies (continued)
h. Interest-bearing borrowings
i. Income tax
Deferred tax is not recognised for the following temporary differences:
the initial recognition of goodwillthe initial recognition of assets or liabilities that affect neither accounting nor taxable profit
(i) Tax consolidation The Company and its wholly owned Australian resident entities formed a tax-consolidated group with effect from 1 July 2003 and are therefore taxed as a single entity from that date. The head entity within the tax consolidated group is Perpetual Limited.
Current tax expense, deferred tax liabilities and deferred tax assets arising from temporary differences of the members of the tax consolidated group are recognised in the separate financial statements of the members of the tax consolidated group using the 'group allocation' approach by reference to the carrying amounts of assets and liabilities in the separate financial statements of each entity and the tax values applying under tax consolidation.
Deferred tax assets and liabilities are offset when there is a legally enforceable right to offset current tax assets and liabilities and when the deferred tax balances relate to the same taxation authority. Current tax assets and tax liabilities are offset where the entity has a legally enforceable right to offset and intends either to settle on a net basis, or to realise the asset and settle the liability simultaneously.
Additional income taxes that arise from the distribution of dividends are recognised at the same time as the liability to pay the related dividend is recognised.
Notes to and forming part of the financial statements for the year ended 30 June 2008
Deferred tax is recognised using the balance sheet method, providing for temporary differences between carrying amounts of assets and liabilities for financial reporting purposes and amounts used for taxation purposes.
Deferred tax is measured at the tax rates that are expected to be applied to the temporary differences when they reverse, based on the laws that have been enacted or substantively enacted by the reporting date.
A deferred tax asset is recognised to the extent that it is probable that future taxable profits will be available against which temporary differences can be utilised. Deferred tax assets are reviewed at each balance sheet date and are reduced to the extent that it is no longer probable that the related tax benefit will be realised.
Interest-bearing borrowings are initially recognised at fair value net of transaction costs incurred. Subsequent to initial recognition, interest-bearing borrowings are stated at amortised cost with any difference between initial carrying amount and redemption value being recognised in the Income Statement over the period of the borrowings using the effective interest method.
Interest-bearing borrowings are removed from the Balance Sheet when the obligation specified in the contract is discharged, cancelled or expired.
Income tax expense comprises current and deferred tax. Income tax expense is recognised in the Income Statement except to the extent that it relates to items recognised directly in equity, in which case it is recognised in equity.
Current tax is expected tax payable on the taxable income for the year, using tax rates enacted or substantially enacted at reporting date and any adjustment to tax payable in respect of previous years.
differences relating to investments in subsidiaries to the extent that they probably will not reverse in the foreseeable future.
48 | PERPETUAL LIMITED AND ITS CONTROLLED ENTITIES
Note 2. Summary of significant accounting policies (continued)
i. Income tax (continued)
(i) Tax consolidation (continued)
(ii) Nature of tax funding arrangements and tax sharing arrangements
j. Goods and services tax
k. Investments
(i) Held-to-maturity investmentsInvestments are classified as held-to-maturity if the consolidated entity has the positive intent and ability to hold to maturity. Held-to-maturity investments are measured at amortised cost using the effective interest method, less any impairment losses.
Notes to and forming part of the financial statements for the year ended 30 June 2008
The tax funding arrangements require payments to or from the head entity equal to the current tax liability or asset assumed by the head entity and any tax loss deferred tax asset assumed by the head entity, resulting in the head entity recognising an inter-company receivable or payable equal to the tax liability or asset assumed. The inter-company receivable or payable is at call.
Contributions to fund the current tax liabilities are payable as per the tax funding arrangement and reflect the timing of the head entity’s obligation to make payments for tax liabilities to the relevant tax authorities.
Current tax liabilities or assets and deferred tax assets arising from unused tax losses and tax credits of subsidiaries are assumed by the Company in the tax-consolidated group and are recognised as amounts payable to or receivable from other entities in the tax-consolidated group in conjunction with any tax funding arrangement amounts (refer accounting policy i (ii)). Any difference between these amounts is recognised by the Company as an equity contribution or distribution.
The Company recognises deferred tax assets arising from unused tax losses of the tax-consolidated group to the extent that it is probable that future taxable profits of the tax-consolidated group will be available against which the asset can be utilised.
Any subsequent period adjustments to deferred tax assets arising from unused tax losses as a result of revised assessments of the probability of recoverability are recognised by the head entity only.
The head entity, in conjunction with other members of the tax consolidated group, has also entered into a tax sharing agreement. The tax sharing agreement provides for the determination of the allocation of income tax liabilities between the entities should the head entity default on its tax payment obligations. No amounts have been recognised in the financial statements in respect of this agreement as payment of any amounts under the tax sharing agreement is considered remote.
The head entity, in conjunction with other members of the tax consolidated group, has entered into a tax funding arrangement which sets out funding obligations of members of the tax-consolidated group in respect of tax amounts.
Revenues, expenses and assets are recognised net of goods and services tax (GST), except where GST incurred is not recoverable from the Australian Taxation Office (ATO). In these circumstances the GST is recognised as part of the cost of acquisition of the asset or as part of the expense.
Receivables and payables are stated with GST included. The net amount of GST recoverable from, or payable to, the ATO is included as a current asset or liability in the Balance Sheet.
Cash flows are included in the Cash Flow statements on a gross basis. GST components of cash flows arising from investing and financing activities which are recoverable from, or payable to, the ATO are classified as operating cash flows.
PERPETUAL LIMITED AND ITS CONTROLLED ENTITIES | 49
Note 2. Summary of significant accounting policies (continued)
k. Investments (continued)
(ii) Available-for-sale financial assets
(iii) Investments at fair value through profit or loss
l. Structured products
(i) Exact Market Cash Fund
(ii) Perpetual Protected Investments
Financial instruments designated at fair value through profit or loss are measured at fair value and changes recognised in the Income Statement.
Structured products comprise products sold to investors where there is residual risk taken by the Company. Currently, structured products comprise products such as the Exact Market Cash Fund (the EMCF product) and Perpetual Protected Investments (PPI). Refer to Note 29 for details on the EMCF product and PPI.
The EMCF product is consolidated as the Company is deemed to control the EMCF product since it retains the residual risks and benefits through the total return swap. The total return swap is an inter-company transaction between the Company and the product and is eliminated on consolidation.
Notes to and forming part of the financial statements for the year ended 30 June 2008
The consolidated entity’s investments in equity securities and unlisted unit trusts are classified as available-for-sale financial assets. Subsequent to initial recognition, they are measured at fair value and changes therein, other than impairment losses (see accounting policy u), are recognised as a separate component of equity. When an investment is derecognised, the cumulative gain or loss in equity is transferred to the Income Statement.
The fair value of financial instruments classified as available-for-sale is their quoted bid price at the balance sheet date.
Investments are classified at fair value through profit or loss if they are held for trading or designated as such upon initial recognition. The consolidated entity’s derivative instruments within asset management incubation funds are classified as held for trading financial assets. On initial recognition, attributable transaction costs are recognised in the Income Statement when incurred.
Assets and liabilities of the EMCF product, which net to zero, are disclosed separately on the face of the Balance Sheet as structured product assets and structured product liabilities. The benchmark return generated by the EMCF product and distributions to unit holders are shown separately on the Income Statement.
Loans to investors which are held as non-current assets at amortised cost on the Balance Sheet (referred to as Structured Products – loan receivables) are non-derivative financial assets with fixed or determinable payments that are not quoted in an active market.
Loans to investors are subject to recurring review and assessment for possible impairment. Provisions for loan losses are based on an incurred loss model, which recognises a provision where there is objective evidence of impairment at each balance sheet date, and are calculated based on the discounted values of expected future cash flows.
50 | PERPETUAL LIMITED AND ITS CONTROLLED ENTITIES
Note 2. Summary of significant accounting policies (continued)
l. Structured products (continued)
(ii) Perpetual Protected Investments (continued)
m. Property, plant and equipment
(i) Recognition and measurement
(ii) Subsequent costs
(iii) Depreciation
plant and equipment: 4 - 10 yearsleasehold improvements: 3 - 15 years.
Notes to and forming part of the financial statements for the year ended 30 June 2008
Property, plant and equipment are measured at cost or deemed cost less accumulated depreciation and impairment losses (see accounting policy u).
Management makes judgements whether there is any observable data indicating that there is a significant decrease in the estimated future cash flows from a portfolio of loans. This evidence may include observable data indicating that there has been an adverse change in the payment status of the borrowers in a group, or national or local economic conditions that correlate with defaults on assets in that group.
The incurred loss model makes specific provision where specific loan impairment is identified. For individual loans not impaired, assets with similar risk profiles are pooled and collectively assessed for losses that have incurred but not yet identified. Bad debts are written off in the period in which they are identified.
Depreciation is recognised in the Income Statement on a straight-line basis over the estimated useful lives of each part of an item of property, plant and equipment. The estimated useful lives for the current and comparative periods are as follows:
The residual value, if not insignificant, useful life and depreciation method applied to an asset are reassessed at least annually.
Details of funding and operations of PPI are set out in Note 29.
Cost includes expenditures that are directly attributable to the acquisition of the asset. Cost of self-constructed assets includes cost of materials, direct labour, an appropriate proportion of overheads and where relevant, the initial estimate of the costs of dismantling and removing the items and restoring the site on which they are located. Purchased software that is integral to the functionality of the related equipment is capitalised as part of that equipment.
Where parts of an item of property, plant and equipment have different useful lives, they are accounted for as separate items of property, plant and equipment.
The consolidated entity recognises the cost of replacing part of an item of property, plant and equipment in the carrying amount of that item when the cost is incurred, it is probable that future economic benefits embodied within the item will flow to the consolidated entity and the cost of the item can be measured reliably. The carrying amount of the replaced part is derecognised. All other costs are recognised in the Income Statement as an expense when incurred.
Gains and losses on disposal of an item of property, plant and equipment are determined by comparing the proceeds from disposal with the carrying amount of property, plant and equipment. When revalued assets are sold, the amounts included in the revaluation reserve are transferred to retained earnings.
PERPETUAL LIMITED AND ITS CONTROLLED ENTITIES | 51
Note 2. Summary of significant accounting policies (continued)
n. Receivables
o. Expenses
(i) Operating leases
(ii) Financing costsFinancing costs comprise interest payments on borrowings calculated using the effective interest method.
p. Payables
Payables are stated at amortised cost and are non-interest bearing.
q. Provisions
(i) Restructuring
(ii) Self-insuranceProvision for self-insurance recognises incurred but not reported claims. These provisions are measured at the cost that the consolidated entity expects to incur in settling the claim, discounted using a government bond rate with a maturity date approximating the term of the obligation.
A provision for restructuring is recognised when the consolidated entity has approved a detailed and formal restructuring plan and the restructuring has either commenced or has been announced publicly. Future operating costs are not provided for.
Notes to and forming part of the financial statements for the year ended 30 June 2008
A provision is recognised in the Balance Sheet when the consolidated entity has a present legal or constructive obligation that can be measured reliably as a result of a past event and it is probable that an outflow of economic benefits will be required to settle the obligation.
Management exercise judgement in estimating provision amounts. It may be possible, based on existing knowledge, that outcomes in the next annual reporting period differ from amounts provided and may require adjustment to the carrying amount of the liability affected.
Provisions are determined by discounting the expected future cash flows at a pre-tax rate that reflects current market assessments of the time value of money and, where appropriate, the risks specific to the liability.
Receivables are stated at amortised cost using the effective interest method less impairment losses (see accounting policy u).
Operating lease payments are recognised as an expense in the Income Statement on a straight-line basis over the term of the lease. Incentives received by the consolidated entity on entering a lease agreement are recognised on a straight-line basis over the term of the lease.
The difference between the cash amount paid and the amount recognised as an expense in the Income Statement is recognised as a lease provision in the Balance Sheet (see accounting policy q). The provision is expected to be realised over the term of the underlying leases.
52 | PERPETUAL LIMITED AND ITS CONTROLLED ENTITIES
Note 2. Summary of significant accounting policies (continued)
q. Provisions (continued)
(iii) Legal provision
(iv) Employee benefitsRefer to accounting policy w for details on employee benefits provisions.
r. Financial guarantee contracts
s. Share capital
(i) Ordinary shares
(ii) Repurchase of share capital (treasury shares)
(iii) DividendsDividends are recognised as a liability in the period in which they are declared.
Notes to and forming part of the financial statements for the year ended 30 June 2008
A provision for litigation is recognised when reported litigation claims arise and are measured at the cost that the consolidated entity expects to incur in settling the claim.
In the Company’s financial statements the transactions of the Company sponsored employee share plan trust are treated as being executed directly by the Company (as the trust acts as the Company’s agent). Accordingly, sharesheld by the trust are recognised as treasury shares and deducted from equity.
Financial guarantee contracts are recognised as a financial liability at the time the guarantee is issued. The liability is initially measured at fair value and subsequently at the higher of the amount determined in accordance with AASB 137 Provisions, Contingent Liabilities and Contingent Assets and the amount initially recognised less cumulative amortisation, where appropriate.
Where guarantees in relation to loans or other payables of subsidiaries are provided for no compensation, the fair values are accounted for as contributions and recognised as part of the cost of the investment.
Ordinary shares are classified as equity. Incremental costs directly attributable to the issue of ordinary shares are recognised as a deduction from equity, net of any tax effects.
When share capital recognised as equity is repurchased or held by employee share plans and subject to vesting conditions, the amount of the consideration paid, including directly attributable costs, is recognised as a deduction from equity. When treasury shares are sold or reissued subsequently, the amount received is recognised as an increase in equity.
PERPETUAL LIMITED AND ITS CONTROLLED ENTITIES | 53
Note 2. Summary of significant accounting policies (continued)
t. Cash and cash equivalents
u. Impairment
(i) Financial assets
(ii) Non-financial assets
Impairment losses are recognised in the Income Statement. Any cumulative loss in respect of an available-for-sale financial asset recognised previously in equity is transferred to the Income Statement.
Notes to and forming part of the financial statements for the year ended 30 June 2008
Cash and cash equivalents comprise bank balances, deposits on call and short-term deposits.
A financial asset is assessed at each reporting date to determine whether there is any objective evidence of impairment. A financial asset is considered to be impaired if objective evidence indicates that one or more events have had a negative effect on the estimated future cash flows of that asset.
An impairment loss in respect of a financial asset measured at amortised cost is calculated as the difference between its carrying amount, and the present value of the estimated future cash flows discounted at the original effective interest rate. An impairment loss in respect of an available-for-sale financial asset is calculated by reference to its current fair value. Individually significant financial assets are tested for impairment on an individual basis. The remaining financial assets are assessed collectively in groups that share similar credit risk characteristics.
An impairment loss is reversed if the reversal can be related objectively to an event occurring after the impairment loss was recognised. For financial assets measured at amortised cost and available-for-sale financial assets that are debt securities, the reversal is recognised in the Income Statement. For available-for-sale financial assets that are equity securities, the reversal is recognised directly in equity.
The recoverable amount of an asset or cash-generating unit is the greater of its value in use and its fair value less costs to sell. In assessing value in use, the estimated future cash flows are discounted to their present value using a pre-tax discount rate that reflects current market assessments of the time value of money and the risks specific to the asset.
The carrying amounts of the consolidated entity’s non-financial assets, other than deferred tax assets (see accounting policy i), are reviewed at each reporting date to determine whether there is any indication of impairment. If any such indication exists, the asset’s recoverable amount is estimated. For goodwill and intangible assets that have indefinite lives or that are not yet available for use, the recoverable amount is estimated at each Balance Sheet date.
An impairment loss is recognised if the carrying amount of an asset or its cash-generating unit exceeds its recoverable amount. A cash-generating unit is the smallest identifiable asset group that generates cash flows that largely are independent from other assets and groups. Impairment losses are recognised in the Income Statement. Impairment losses recognised in respect of cash generating units are allocated first to reduce the carrying amount of any goodwill allocated to the units and then, to reduce the carrying amount of the other assets in the unit on a pro rata basis.
54 | PERPETUAL LIMITED AND ITS CONTROLLED ENTITIES
Note 2. Summary of significant accounting policies (continued)
u. Impairment (continued)
(ii) Non-financial assets (continued)
(iii) Derecognition of financial assets and liabilities
the rights to receive cash flows from the asset have expired
v. Derivative financial instruments
(i) Cash flow hedges
Notes to and forming part of the financial statements for the year ended 30 June 2008
The consolidated entity holds derivative financial instruments within structured products and asset management incubation funds to hedge its interest rate, foreign exchange and market risk exposures. Derivatives are recognised initially at fair value. Attributable transaction costs are recognised in the Income Statement when incurred. Subsequent to initial recognition, derivatives are measured at fair value, and changes therein are accounted for as described below.
To the extent that the hedge is effective, changes in the fair value of a derivative hedging instrument designated as a cash flow hedge are recognised directly in equity. To the extent that the hedge is ineffective, changes in fair value are recognised in the Income Statement.
If the hedging instrument no longer meets the criteria for hedge accounting, expires or is sold, terminated or exercised, then hedge accounting is discontinued prospectively. The cumulative gain or loss previously recognised in equity remains there until the forecast transaction occurs. When the hedged item is a non-financial asset, the amount recognised in equity is transferred to the carrying amount of the asset when it is recognised. In other cases the amount recognised in equity is transferred to the Income Statement in the same period that the hedged item affects profit and loss.
An impairment loss in respect of goodwill is not reversed. In respect of other assets, impairment losses recognised in prior periods are assessed at each balance sheet date for any indications that the loss has decreased or no longer exists. An impairment loss is reversed if there has been a change in the estimates used to determine the recoverable amount. An impairment loss is reversed only to the extent that the asset’s carrying amount does not exceed the carrying amount that would have been determined, net of depreciation or amortisation, if no impairment loss had been recognised.
A financial asset (or, where applicable, a part of a financial asset or part of a group of similar financial assets) is derecognised when:
the consolidated entity retains the right to receive cash flows from the asset, but has assumed an obligation to pay them in full without material delay to a third partythe consolidated entity has transferred its rights to receive cash flows from the asset and either: has transferred substantially all the risks and rewards of the asset; or has neither transferred nor retained substantially all the risks and rewards of the asset, but has transferred control of the asset.
A financial liability is derecognised when the obligation under the liability is discharged, cancelled or expired. When an existing financial liability is replaced by another from the same lender on substantially different terms, or the terms of an existing liability are substantially modified, such an exchange or modification is treated as a derecognition of the original liability and the recognition of a new liability. The difference in the respective carrying amounts is recognised in the Income Statement.
PERPETUAL LIMITED AND ITS CONTROLLED ENTITIES | 55
Note 2. Summary of significant accounting policies (continued)
w. Employee benefits
(i) Defined contribution superannuation funds
(ii) Long service leave
(iii) Wages, salaries, annual leave, sick leave and non-monetary benefits
x. Share-based payment transactions
(i) Employee share purchase and option plans
(ii) Deferred staff incentives
The fair value of the shares granted is measured by adjusting the share price for the terms and conditions upon which the shares were granted. This fair value is amortised on a straight line basis over the applicable vesting period.
Notes to and forming part of the financial statements for the year ended 30 June 2008
Liabilities for employee benefits for wages, salaries and annual leave expected to be settled within 12 months of the reporting date represent present obligations resulting from employees' services provided to reporting date. These liabilities are calculated at undiscounted amounts based on remuneration wage and salary rates that the consolidated entity expects to pay as at reporting date including related on-costs, such as workers compensation insurance and payroll tax.
Non-accumulating benefits, such as sick leave, are not provided for but are expensed as the benefits are taken by the employees. Non-accumulating non-monetary benefits, such as medical care, housing, cars and free or subsidised goods and services, are expensed based on the net marginal cost to the consolidated entity as the benefits are taken by the employees.
A provision is recognised for the amount expected to be paid under short-term bonus or profit-sharing plans if the consolidated entity has a present legal or constructive obligation to pay this amount as a result of past service provided by the employee and the obligation can be estimated reliably.
Share option and share incentive programs allow employees to acquire shares in the Company. The fair value of shares and/or options granted under these programs is recognised as an employee expense with a corresponding increase in equity. Fair value is measured at grant date and amortised over the period during which employees become unconditionally entitled to the shares and/or options.
A defined contribution plan is a post-employment benefit plan under which an entity pays fixed contributions into a separate entity and will have no legal or constructive obligation to pay further amounts. Obligations for contributions to defined contribution pension plans are recognised as an expense in the Income Statement as incurred.
The liability for long service leave is recognised in the provision for employee benefits and measured as the present value of expected future payments to be made in respect of services provided by employees up to the reporting date using the projected unit credit method. Consideration is given to expected future wage and salary levels, experience of employee departures and periods of service. Expected future payments are discounted using market yields at the reporting date on national government bonds with terms to maturity and currency that match, as closely as possible, the estimated future cash outflows.
The fair value of the options granted is measured using a binomial model, taking into account the terms and conditions upon which the options were granted. The amount recognised as an expense is adjusted to reflect the actual number of share options that vest except where forfeiture is due to share prices not achieving their threshold for vesting.
The Company grants certain employees shares under long term incentive and retention plans. Under these plans, shares vest with employees over relevant vesting periods. To satisfy the long-term incentives granted, the Company purchases or issues shares under the Executive Share Plan, Deferred Share Plan or the Global Employees Share Trust.
56 | PERPETUAL LIMITED AND ITS CONTROLLED ENTITIES
Note 2. Summary of significant accounting policies (continued)
x. Share-based payment transactions (continued)
(ii) Deferred staff incentives (continued)
y. Earnings per share
z. New standards and interpretations not yet adopted
AASB 8 Operating Segments is effective for annual reporting periods commencing on or after 1 January 2009. AASB 8 will result in a change in the approach to segment reporting, as it requires adoption of a ‘management approach’ to reporting on financial performance. The information being reported will be based on what the key decision makers use internally for evaluating segment performance and deciding how to allocate resources to operating segments. Application of AASB 8 may result in different segments, segment results and different types of information being reported in the segment note of the financial report. The consolidated entity has not yet determined the potential effect of the revised standard on the consolidated entity’s financial report.
The consolidated entity presents basic and diluted earnings per share (EPS) data for its ordinary shares. Basic EPS is calculated by dividing the profit or loss attributable to ordinary shareholders of the Company by the weighted average number of ordinary shares outstanding during the period. Diluted EPS is determined by adjustingthe profit or loss attributable to ordinary shareholders and the weighted average number of ordinary shares outstanding for the effects of all dilutive potential ordinary shares, which comprise shares and options granted to employees under long-term incentive and retention plans.
Revised AASB 101 Presentation of Financial Statements introduces as a financial statement (formerly ‘primary’ statement) the ‘statement of comprehensive income’. The revised standard does not change the recognition, measurement or disclosure of transactions and events that are required by other AASBs. The revised AASB 101 will become mandatory for the consolidated entity’s 30 June 2010 financial statements. The consolidated entity has not yet determined the potential effect of the revised standard on the consolidated entity’s disclosures.
Notes to and forming part of the financial statements for the year ended 30 June 2008
The Company and consolidated entity make estimates on the number of shares that are expected to vest. Where appropriate, revised estimates are reflected in the Income Statement or directly against opening retained earnings (in the case where shares containing a market linked hurdle do not vest due to share prices not achieving their threshold for vesting) with the corresponding adjustment to the equity compensation reserve.
The following standards, amendments to standards and interpretations have been identified as those which may impact the consolidated entity in the period of initial application. They are available for early adoption at 30 June 2008, but have not been applied in preparing this financial report:
Revised AASB 3 Business Combinations changes the application of acquisition accounting for business combinations and the accounting for non-controlling (minority) interests. Key changes include the immediate expensing of all transaction costs, measurement of contingent consideration at acquisition date with subsequent changes through the Income Statement, measurement of non-controlling (minority) interests at full fair value or the proportionate share of the fair value of the underlying net assets, guidance on issues such as reacquired rights and vendor indemnities and the inclusion of combinations by contract alone and those involving mutuals. The revised standard becomes mandatory for the consolidated entity’s 30 June 2010 financial statements.
PERPETUAL LIMITED AND ITS CONTROLLED ENTITIES | 57
Note 2. Summary of significant accounting policies (continued)
z. New standards and interpretations not yet adopted (continued)
Revised AASB 127 Consolidated and Separate Financial Statements changes the accounting for investments in subsidiaries. Key changes include the measurement to fair value of any previous or retained investment when control is obtained or lost with any resulting gain or loss being recognised in the Income Statement and the treatment of increases in ownership interest after control is obtained as transactions with equity holders in their capacity as equity holders. The revised standard will become mandatory for the consolidated entity’s 30 June 2010 financial statements. The consolidated entity has not yet determined the potential effect of the revised standard on the consolidated entity’s financial report.
AASB 2008-1 Amendments to Australian Accounting Standards – Share-Based Payment: Vesting Conditions and Cancellations changes the measurement of share-based payments that contain non-vesting conditions. AASB 2008-1 becomes mandatory for the consolidated entity’s 30 June 2010 financial statements. The consolidated entity has not yet determined the potential effect of the amending standard on the consolidated entity’s financial report.
Notes to and forming part of the financial statements for the year ended 30 June 2008
Revised AASB 123 Borrowing Costs removes the option to expense borrowing costs and requires that an entity capitalise borrowing costs directly attributable to the acquisition or construction of a qualifying asset as part of the cost of that asset. The revised AASB 123 will become mandatory for the consolidated entity’s 30 June 2010 financial statements and will constitute a change in accounting policy. In accordance with the transitional provisions, the consolidated entity will apply the revised AASB 123 to qualifying assets for which capitalisation of borrowing costs commences on or after the effective date. The consolidated entity has not yet determined the potential effect of the revised standard on future earnings.
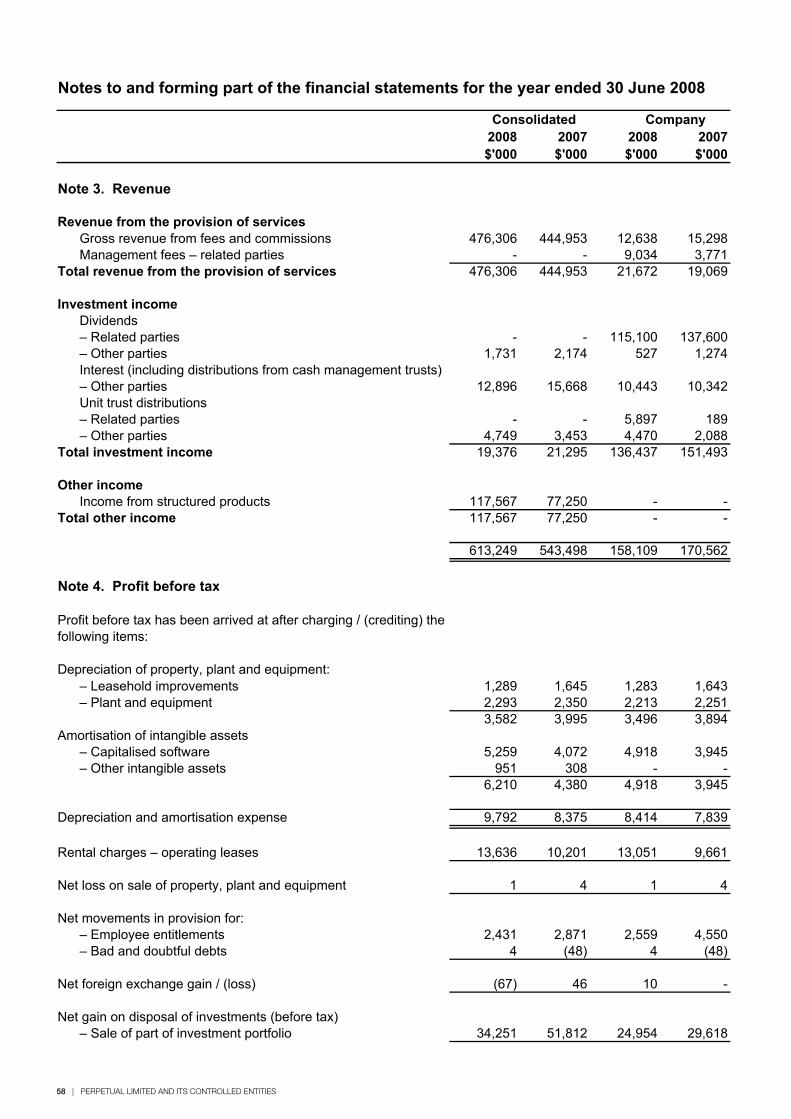
58 | PERPETUAL LIMITED AND ITS CONTROLLED ENTITIES
Notes to and forming part of the financial statements for the year ended 30 June 2008
2008 2007 2008 2007$'000 $'000 $'000 $'000
Note 3. Revenue
Revenue from the provision of servicesGross revenue from fees and commissions 476,306 444,953 12,638 15,298Management fees – related parties - - 9,034 3,771
Total revenue from the provision of services 476,306 444,953 21,672 19,069
Investment incomeDividends– Related parties - - 115,100 137,600– Other parties 1,731 2,174 527 1,274Interest (including distributions from cash management trusts)– Other parties 12,896 15,668 10,443 10,342Unit trust distributions– Related parties - - 5,897 189– Other parties 4,749 3,453 4,470 2,088
Total investment income 19,376 21,295 136,437 151,493
Other income Income from structured products 117,567 77,250 - -
Total other income 117,567 77,250 - -
613,249 543,498 158,109 170,562
Note 4. Profit before tax
Profit before tax has been arrived at after charging / (crediting) the following items:
Depreciation of property, plant and equipment:– Leasehold improvements 1,289 1,645 1,283 1,643– Plant and equipment 2,293 2,350 2,213 2,251
3,582 3,995 3,496 3,894Amortisation of intangible assets
– Capitalised software 5,259 4,072 4,918 3,945– Other intangible assets 951 308 - -
6,210 4,380 4,918 3,945
Depreciation and amortisation expense 9,792 8,375 8,414 7,839
Rental charges – operating leases 13,636 10,201 13,051 9,661
Net loss on sale of property, plant and equipment 1 4 1 4
Net movements in provision for:– Employee entitlements 2,431 2,871 2,559 4,550– Bad and doubtful debts 4 (48) 4 (48)
Net foreign exchange gain / (loss) (67) 46 10 -
Net gain on disposal of investments (before tax)– Sale of part of investment portfolio 34,251 51,812 24,954 29,618
CompanyConsolidated
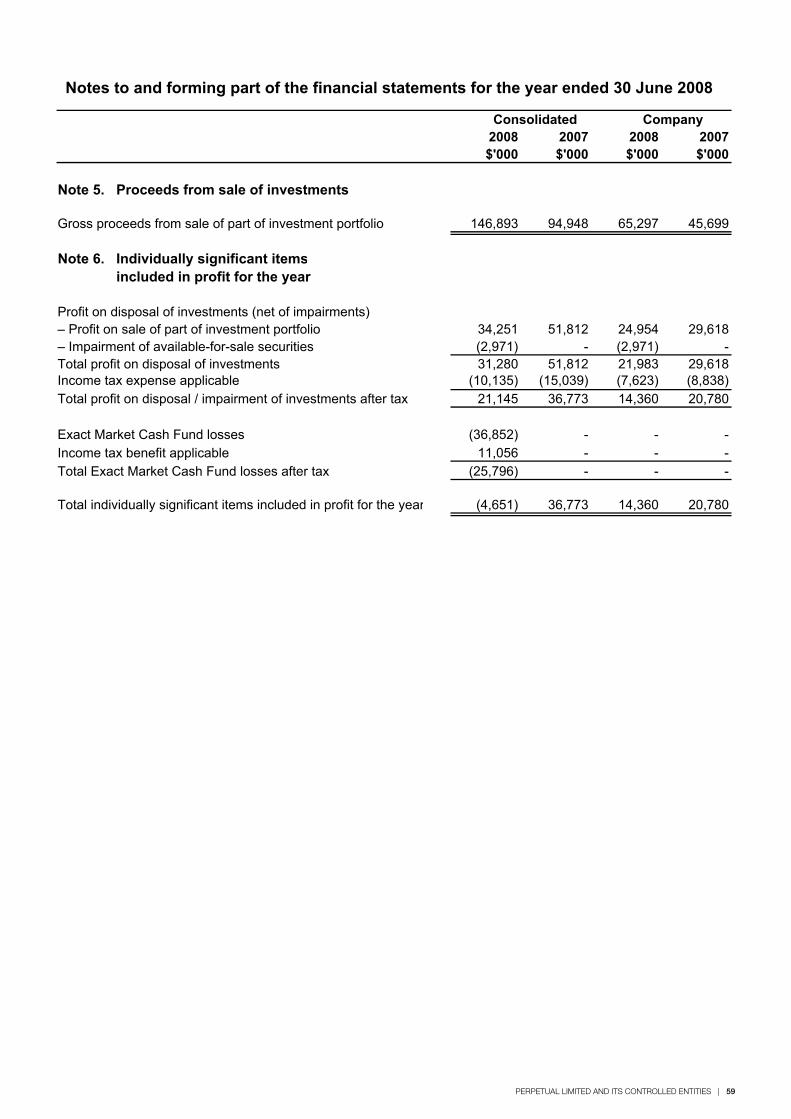
PERPETUAL LIMITED AND ITS CONTROLLED ENTITIES | 59
Notes to and forming part of the financial statements for the year ended 30 June 2008
2008 2007 2008 2007$'000 $'000 $'000 $'000
Note 5. Proceeds from sale of investments
Gross proceeds from sale of part of investment portfolio 146,893 94,948 65,297 45,699
Profit on disposal of investments (net of impairments) – Profit on sale of part of investment portfolio 34,251 51,812 24,954 29,618– Impairment of available-for-sale securities (2,971) - (2,971) -Total profit on disposal of investments 31,280 51,812 21,983 29,618Income tax expense applicable (10,135) (15,039) (7,623) (8,838)Total profit on disposal / impairment of investments after tax 21,145 36,773 14,360 20,780
(36,852) - - -11,056 - - -
(25,796) - - -
Total individually significant items included in profit for the year (4,651) 36,773 14,360 20,780
Total Exact Market Cash Fund losses after taxIncome tax benefit applicable
CompanyConsolidated
Note 6. Individually significant items included in profit for the year
Exact Market Cash Fund losses
Notes to and forming part of the financial statements for the year ended 30 June 2008
2008 2007 2008 2007$'000 $'000 $'000 $'000
Note 3. Revenue
Revenue from the provision of servicesGross revenue from fees and commissions 476,306 444,953 12,638 15,298Management fees – related parties - - 9,034 3,771
Total revenue from the provision of services 476,306 444,953 21,672 19,069
Investment incomeDividends– Related parties - - 115,100 137,600– Other parties 1,731 2,174 527 1,274Interest (including distributions from cash management trusts)– Other parties 12,896 15,668 10,443 10,342Unit trust distributions– Related parties - - 5,897 189– Other parties 4,749 3,453 4,470 2,088
Total investment income 19,376 21,295 136,437 151,493
Other income Income from structured products 117,567 77,250 - -
Total other income 117,567 77,250 - -
613,249 543,498 158,109 170,562
Note 4. Profit before tax
Profit before tax has been arrived at after charging / (crediting) the following items:
Depreciation of property, plant and equipment:– Leasehold improvements 1,289 1,645 1,283 1,643– Plant and equipment 2,293 2,350 2,213 2,251
3,582 3,995 3,496 3,894Amortisation of intangible assets
– Capitalised software 5,259 4,072 4,918 3,945– Other intangible assets 951 308 - -
6,210 4,380 4,918 3,945
Depreciation and amortisation expense 9,792 8,375 8,414 7,839
Rental charges – operating leases 13,636 10,201 13,051 9,661
Net loss on sale of property, plant and equipment 1 4 1 4
Net movements in provision for:– Employee entitlements 2,431 2,871 2,559 4,550– Bad and doubtful debts 4 (48) 4 (48)
Net foreign exchange gain / (loss) (67) 46 10 -
Net gain on disposal of investments (before tax)– Sale of part of investment portfolio 34,251 51,812 24,954 29,618
CompanyConsolidated

60 | PERPETUAL LIMITED AND ITS CONTROLLED ENTITIES
Notes to and forming part of the financial statements for the year ended 30 June 2008
2008 2007 2008 2007$'000 $'000 $'000 $'000
Note 3. Revenue
Revenue from the provision of servicesGross revenue from fees and commissions 476,306 444,953 12,638 15,298Management fees – related parties - - 9,034 3,771
Total revenue from the provision of services 476,306 444,953 21,672 19,069
Investment incomeDividends– Related parties - - 115,100 137,600– Other parties 1,731 2,174 527 1,274Interest (including distributions from cash management trusts)– Other parties 12,896 15,668 10,443 10,342Unit trust distributions– Related parties - - 5,897 189– Other parties 4,749 3,453 4,470 2,088
Total investment income 19,376 21,295 136,437 151,493
Other income Income from structured products 117,567 77,250 - -
Total other income 117,567 77,250 - -
613,249 543,498 158,109 170,562
Note 4. Profit before tax
Profit before tax has been arrived at after charging / (crediting) the following items:
Depreciation of property, plant and equipment:– Leasehold improvements 1,289 1,645 1,283 1,643– Plant and equipment 2,293 2,350 2,213 2,251
3,582 3,995 3,496 3,894Amortisation of intangible assets
– Capitalised software 5,259 4,072 4,918 3,945– Other intangible assets 951 308 - -
6,210 4,380 4,918 3,945
Depreciation and amortisation expense 9,792 8,375 8,414 7,839
Rental charges – operating leases 13,636 10,201 13,051 9,661
Net loss on sale of property, plant and equipment 1 4 1 4
Net movements in provision for:– Employee entitlements 2,431 2,871 2,559 4,550– Bad and doubtful debts 4 (48) 4 (48)
Net foreign exchange gain / (loss) (67) 46 10 -
Net gain on disposal of investments (before tax)– Sale of part of investment portfolio 34,251 51,812 24,954 29,618
CompanyConsolidated
Notes to and forming part of the financial statements for the year ended 30 June 2008
Note 7. Segment information
$’ 000 $’ 000 $’ 000 $’ 000 $’ 00030 June 2008Total Revenue 412,041 104,904 84,205 12,099 613,249
EBITDA1 131,032 49,571 32,464 (22,856) 190,211(20,864) (3,208) (2,957) (3,187) (30,216)
Segment result 110,168 46,363 29,507 (26,043) 159,995 Financing costs (3,276)Profit on disposal of investments5 31,280Income tax expense (59,186)Net profit after tax 128,813
Assets and liabilitiesSegment assets 84,442 56,044 45,334 333,358 519,178
1,850,964 - - - 1,850,964Total assets 1,935,406 56,044 45,334 333,358 2,370,142Segment liabilities (52,289) (12,715) (6,045) (133,719) (204,768)
(1,845,636) - - (5,328) (1,850,964)Total liabilities (1,897,925) (12,715) (6,045) (139,047) (2,055,732)Net assets 37,481 43,329 39,289 194,311 314,410
6,999 2,695 5,821 8,906 24,421
$’ 000 $’ 000 $’ 000 $’ 000 $’ 00030 June 2007Total Revenue 359,258 98,840 68,939 16,461 543,498
EBITDA 1 171,204 44,830 37,890 (15,931) 237,993(19,052) (2,060) (2,166) (4,916) (28,194)
Segment result 152,152 42,770 35,724 (20,847) 209,799Financing costs (2,916)Profit on disposal of investments 51,812Income tax expense (76,587)Net profit after tax 182,108
Assets and liabilitiesSegment assets 77,988 58,125 27,798 398,215 562,126
1,591,105 - - - 1,591,105Total assets 1,669,093 58,125 27,798 398,215 2,153,231Segment liabilities (51,183) (16,218) (3,967) (149,664) (221,032)
(1,591,105) - - (130) (1,591,235)Total liabilities (1,642,288) (16,218) (3,967) (149,794) (1,812,267)Net assets 26,805 41,907 23,831 248,421 340,964
4,195 3,787 7,755 8,760 24,497
1 EBITDA represents earnings before interest, tax, depreciation and amortisation including EMCF losses and excluding sale of investments.
5 Net of impairment of available-for-sale investments held by seed funds.
Structured products liabilities
PerpetualInvestments3
Group and SupportServices
Consolidated
Amortisation and depreciation 2
Private Wealth4 CorporateTrust
Structured products assets
4 Perpetual Private Wealth was previously disclosed as Perpetual Private Clients and was created as part of our corporate restructuring in 2007. The Perpetual Private Wealth segment includes our Private Clients and Direct businesses. The Direct business was previously disclosed in the Perpetual Investments segment. Comparative information for these segments have been reclassified to conform to current year presentation.
Acquisitions of non-current assets (including intangibles assets)
2 Includes equity remuneration amortisation expense.3 Total revenue includes income from structured product of $117,567,000 (2007: $77,250,000). Segment result includes EMCF losses of $36,852,000 before tax.
Acquisitions of non-current assets (including intangibles assets)
Amortisation and depreciation2
Consolidated
Structured products assets
Structured products liabilities
PerpetualInvestments3
Private Wealth4 CorporateTrust
Group and SupportServices
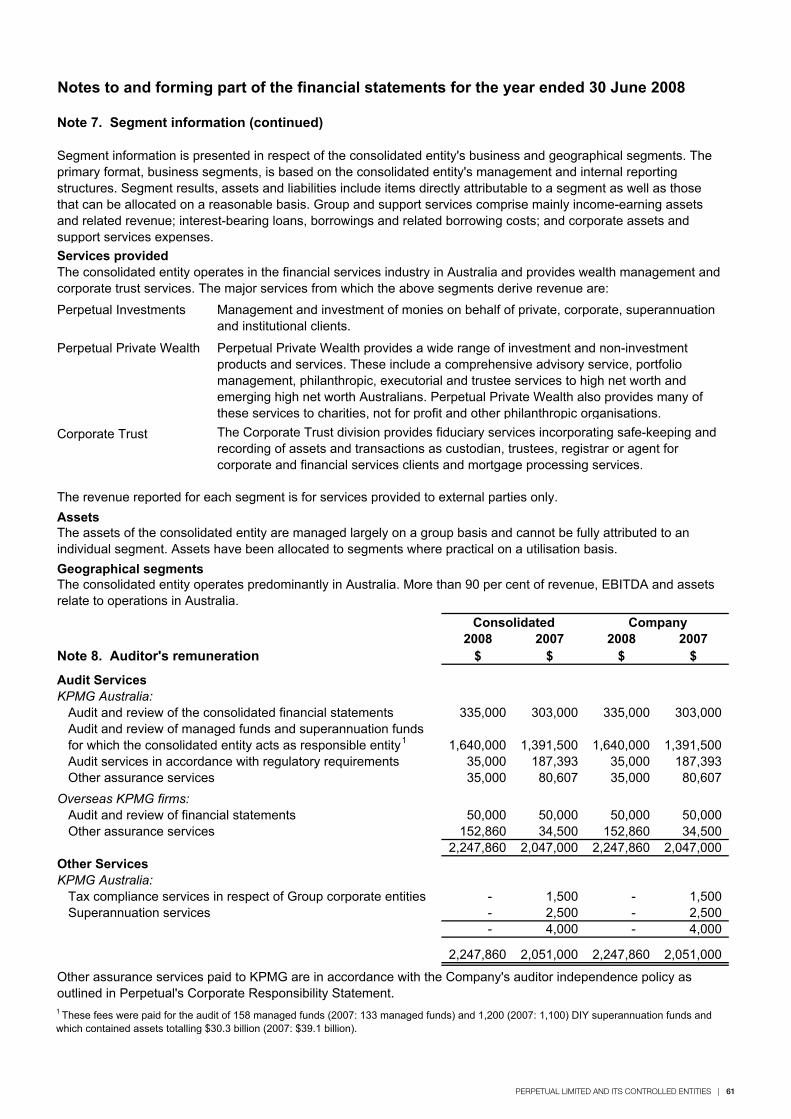
PERPETUAL LIMITED AND ITS CONTROLLED ENTITIES | 61
Notes to and forming part of the financial statements for the year ended 30 June 2008
Note 7. Segment information (continued)
Services provided
Perpetual Investments
Perpetual Private Wealth
Corporate Trust
Assets
Geographical segments
2008 2007 2008 2007Note 8. Auditor's remuneration $ $ $ $
Audit ServicesKPMG Australia:
Audit and review of the consolidated financial statements 335,000 303,000 335,000 303,000 Audit and review of managed funds and superannuation funds
1,640,000 1,391,500 1,640,000 1,391,500Audit services in accordance with regulatory requirements 35,000 187,393 35,000 187,393 Other assurance services 35,000 80,607 35,000 80,607
Overseas KPMG firms:Audit and review of financial statements 50,000 50,000 50,000 50,000 Other assurance services 152,860 34,500 152,860 34,500
2,247,860 2,047,000 2,247,860 2,047,000Other ServicesKPMG Australia:
Tax compliance services in respect of Group corporate entities - 1,500 - 1,500 Superannuation services - 2,500 - 2,500
- 4,000 - 4,000
2,247,860 2,051,000 2,247,860 2,051,000
1 These fees were paid for the audit of 158 managed funds (2007: 133 managed funds) and 1,200 (2007: 1,100) DIY superannuation funds and which contained assets totalling $30.3 billion (2007: $39.1 billion).
Other assurance services paid to KPMG are in accordance with the Company's auditor independence policy as outlined in Perpetual's Corporate Responsibility Statement.
for which the consolidated entity acts as responsible entity1
Consolidated Company
Segment information is presented in respect of the consolidated entity's business and geographical segments. The primary format, business segments, is based on the consolidated entity's management and internal reporting structures. Segment results, assets and liabilities include items directly attributable to a segment as well as those that can be allocated on a reasonable basis. Group and support services comprise mainly income-earning assets and related revenue; interest-bearing loans, borrowings and related borrowing costs; and corporate assets and support services expenses.
The assets of the consolidated entity are managed largely on a group basis and cannot be fully attributed to an individual segment. Assets have been allocated to segments where practical on a utilisation basis.
The consolidated entity operates predominantly in Australia. More than 90 per cent of revenue, EBITDA and assets relate to operations in Australia.
The consolidated entity operates in the financial services industry in Australia and provides wealth management and corporate trust services. The major services from which the above segments derive revenue are:
Management and investment of monies on behalf of private, corporate, superannuation and institutional clients.
The Corporate Trust division provides fiduciary services incorporating safe-keeping and recording of assets and transactions as custodian, trustees, registrar or agent for corporate and financial services clients and mortgage processing services.
The revenue reported for each segment is for services provided to external parties only.
Perpetual Private Wealth provides a wide range of investment and non-investment products and services. These include a comprehensive advisory service, portfolio management, philanthropic, executorial and trustee services to high net worth and emerging high net worth Australians. Perpetual Private Wealth also provides many of these services to charities, not for profit and other philanthropic organisations.
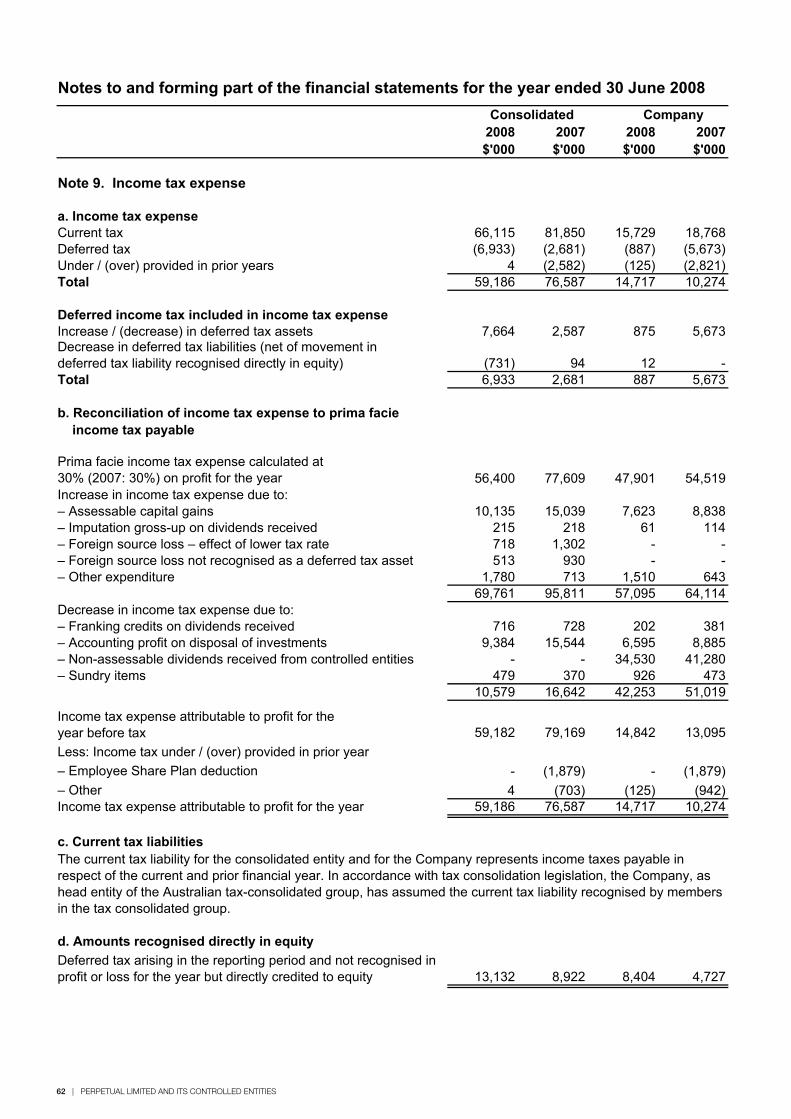
62 | PERPETUAL LIMITED AND ITS CONTROLLED ENTITIES
Notes to and forming part of the financial statements for the year ended 30 June 2008
2008 2007 2008 2007$'000 $'000 $'000 $'000
Note 9. Income tax expense
a. Income tax expenseCurrent tax 66,115 81,850 15,729 18,768Deferred tax (6,933) (2,681) (887) (5,673)Under / (over) provided in prior years 4 (2,582) (125) (2,821)Total 59,186 76,587 14,717 10,274
Increase / (decrease) in deferred tax assets 7,664 2,587 875 5,673
(731) 94 12 -Total 6,933 2,681 887 5,673
Prima facie income tax expense calculated at 30% (2007: 30%) on profit for the year 56,400 77,609 47,901 54,519Increase in income tax expense due to:– Assessable capital gains 10,135 15,039 7,623 8,838– Imputation gross-up on dividends received 215 218 61 114– Foreign source loss – effect of lower tax rate 718 1,302 - -– Foreign source loss not recognised as a deferred tax asset 513 930 - -– Other expenditure 1,780 713 1,510 643
69,761 95,811 57,095 64,114Decrease in income tax expense due to:– Franking credits on dividends received 716 728 202 381– Accounting profit on disposal of investments 9,384 15,544 6,595 8,885– Non-assessable dividends received from controlled entities - - 34,530 41,280– Sundry items 479 370 926 473
10,579 16,642 42,253 51,019
Income tax expense attributable to profit for the year before tax 59,182 79,169 14,842 13,095Less: Income tax under / (over) provided in prior year– Employee Share Plan deduction - (1,879) - (1,879)– Other 4 (703) (125) (942)
59,186 76,587 14,717 10,274
c. Current tax liabilities
13,132 8,922 8,404 4,727Deferred tax arising in the reporting period and not recognised in profit or loss for the year but directly credited to equity
b. Reconciliation of income tax expense to prima facie income tax payable
The current tax liability for the consolidated entity and for the Company represents income taxes payable in respect of the current and prior financial year. In accordance with tax consolidation legislation, the Company, as head entity of the Australian tax-consolidated group, has assumed the current tax liability recognised by members in the tax consolidated group.
Income tax expense attributable to profit for the year
d. Amounts recognised directly in equity
CompanyConsolidated
Deferred income tax included in income tax expense
Decrease in deferred tax liabilities (net of movement in deferred tax liability recognised directly in equity)
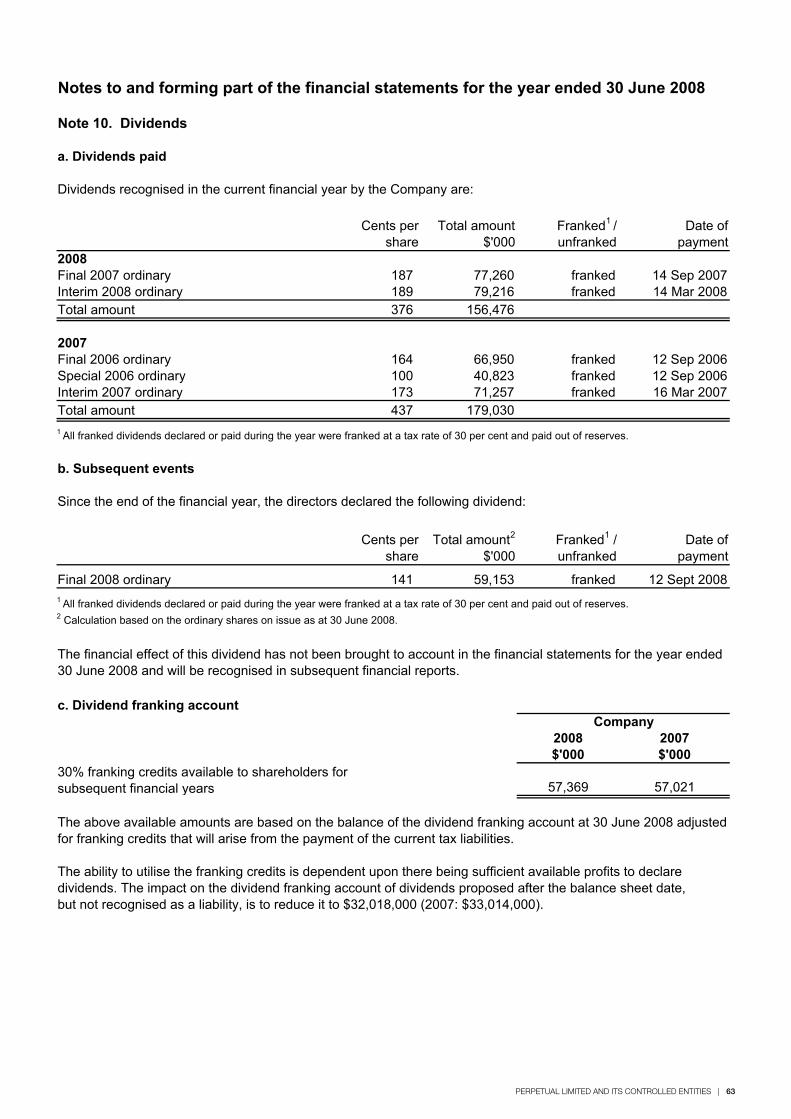
PERPETUAL LIMITED AND ITS CONTROLLED ENTITIES | 63
Note 10. Dividends
a. Dividends paid
Dividends recognised in the current financial year by the Company are:
Cents per share
Total amount $'000
Franked1 /unfranked
Date of payment
2008Final 2007 ordinary 187 77,260 franked 14 Sep 2007Interim 2008 ordinary 189 79,216 franked 14 Mar 2008Total amount 376 156,476
2007Final 2006 ordinary 164 66,950 franked 12 Sep 2006Special 2006 ordinary 100 40,823 franked 12 Sep 2006Interim 2007 ordinary 173 71,257 franked 16 Mar 2007Total amount 437 179,0301 All franked dividends declared or paid during the year were franked at a tax rate of 30 per cent and paid out of reserves.
b. Subsequent events
Since the end of the financial year, the directors declared the following dividend:
Cents per share
Total amount2
$'000Franked1 / unfranked
Date of payment
Final 2008 ordinary 141 59,153 franked 12 Sept 20081 All franked dividends declared or paid during the year were franked at a tax rate of 30 per cent and paid out of reserves.2 Calculation based on the ordinary shares on issue as at 30 June 2008.
c. Dividend franking account
2008 2007$'000 $'000
57,369 57,021
The ability to utilise the franking credits is dependent upon there being sufficient available profits to declare dividends. The impact on the dividend franking account of dividends proposed after the balance sheet date, but not recognised as a liability, is to reduce it to $32,018,000 (2007: $33,014,000).
Notes to and forming part of the financial statements for the year ended 30 June 2008
Company
The financial effect of this dividend has not been brought to account in the financial statements for the year ended 30 June 2008 and will be recognised in subsequent financial reports.
30% franking credits available to shareholders for subsequent financial years
The above available amounts are based on the balance of the dividend franking account at 30 June 2008 adjusted for franking credits that will arise from the payment of the current tax liabilities.
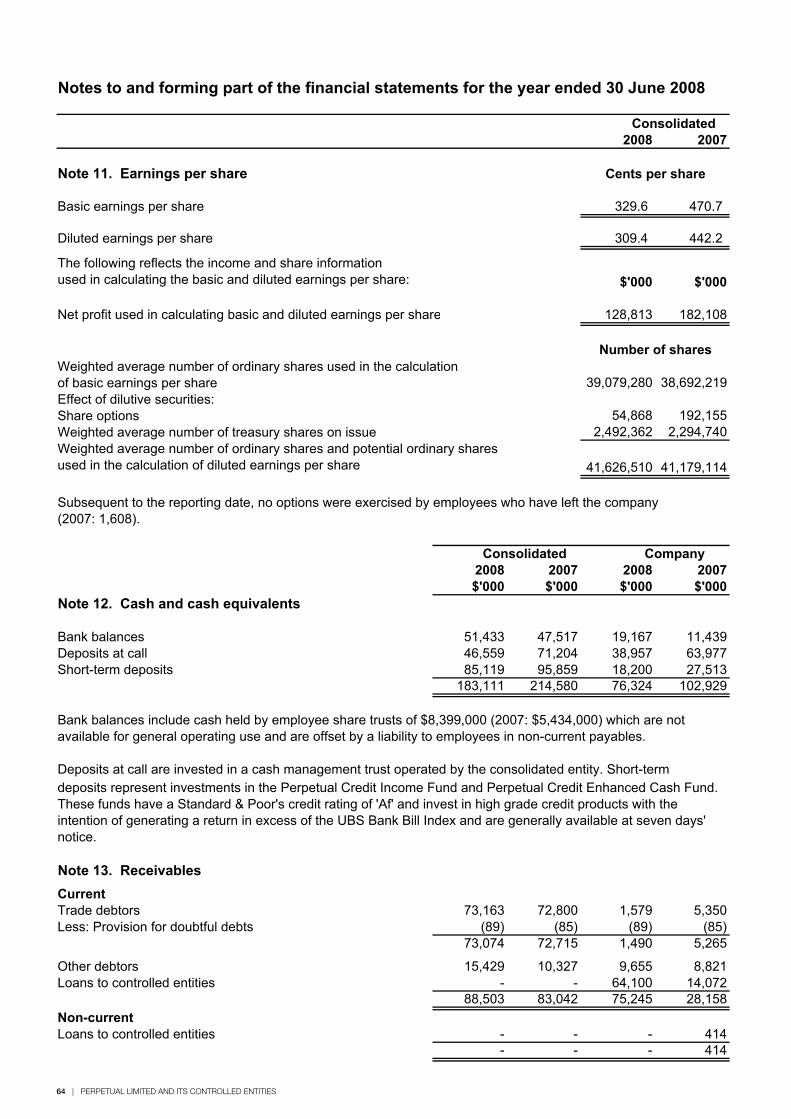
64 | PERPETUAL LIMITED AND ITS CONTROLLED ENTITIES
Notes to and forming part of the financial statements for the year ended 30 June 2008
2008 2007
Note 11. Earnings per share
329.6 470.7
Diluted earnings per share 309.4 442.2
$'000 $'000
Net profit used in calculating basic and diluted earnings per share 128,813 182,108
39,079,280 38,692,219Effect of dilutive securities:Share options 54,868 192,155Weighted average number of treasury shares on issue 2,492,362 2,294,740
41,626,510 41,179,114
2008 2007 2008 2007$'000 $'000 $'000 $'000
Note 12. Cash and cash equivalents
51,433 47,517 19,167 11,439Deposits at call 46,559 71,204 38,957 63,977Short-term deposits 85,119 95,859 18,200 27,513
183,111 214,580 76,324 102,929
Note 13. ReceivablesCurrentTrade debtors 73,163 72,800 1,579 5,350Less: Provision for doubtful debts (89) (85) (89) (85)
73,074 72,715 1,490 5,265
Other debtors 15,429 10,327 9,655 8,821Loans to controlled entities - - 64,100 14,072
88,503 83,042 75,245 28,158Non-currentLoans to controlled entities - - - 414
- - - 414
deposits represent investments in the Perpetual Credit Income Fund and Perpetual Credit Enhanced Cash Fund. These funds have a Standard & Poor's credit rating of 'Af' and invest in high grade credit products with the intention of generating a return in excess of the UBS Bank Bill Index and are generally available at seven days' notice.
Consolidated
Cents per share
Company
Bank balances
Basic earnings per share
Subsequent to the reporting date, no options were exercised by employees who have left the company (2007: 1,608).
The following reflects the income and share information used in calculating the basic and diluted earnings per share:
Deposits at call are invested in a cash management trust operated by the consolidated entity. Short-term
Bank balances include cash held by employee share trusts of $8,399,000 (2007: $5,434,000) which are not available for general operating use and are offset by a liability to employees in non-current payables.
Consolidated
Number of sharesWeighted average number of ordinary shares used in the calculation of basic earnings per share
Weighted average number of ordinary shares and potential ordinary shares used in the calculation of diluted earnings per share
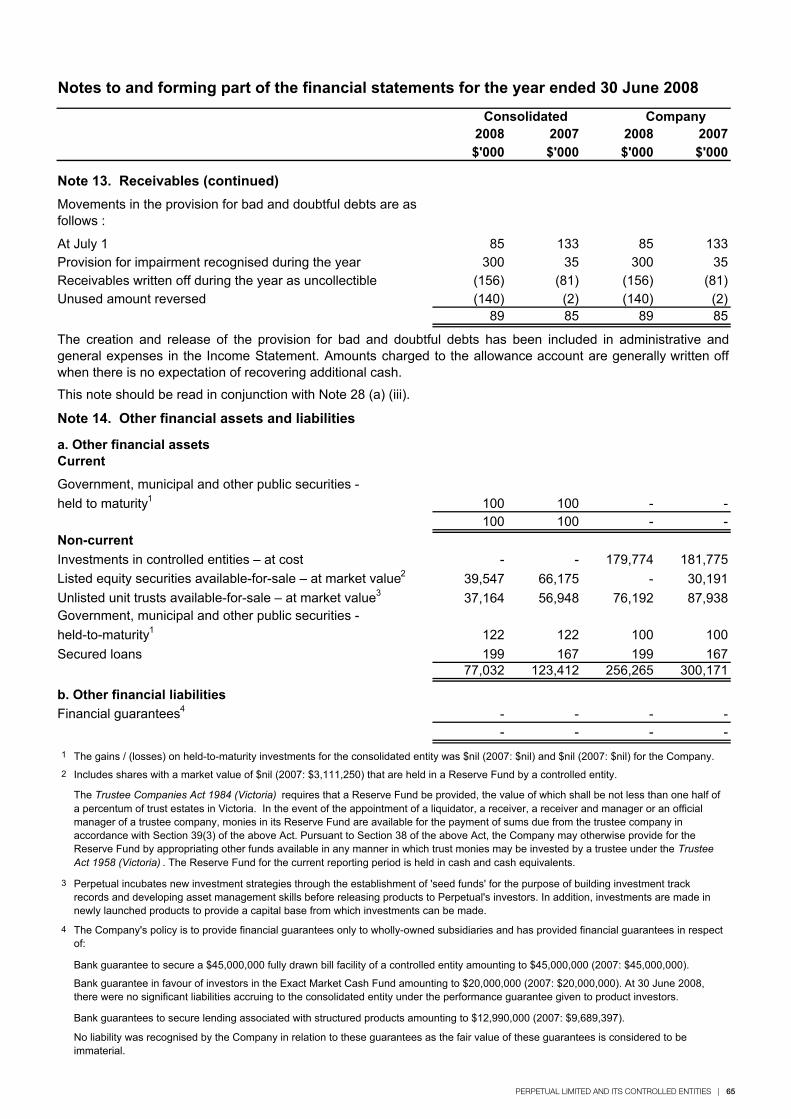
PERPETUAL LIMITED AND ITS CONTROLLED ENTITIES | 65
Notes to and forming part of the financial statements for the year ended 30 June 2008
2008 2007 2008 2007$'000 $'000 $'000 $'000
Note 13. Receivables (continued)
At July 1 85 133 85 133Provision for impairment recognised during the year 300 35 300 35Receivables written off during the year as uncollectible (156) (81) (156) (81)Unused amount reversed (140) (2) (140) (2)
89 85 89 85
This note should be read in conjunction with Note 28 (a) (iii).
Note 14. Other financial assets and liabilities
a. Other financial assetsCurrent
100 100 - -100 100 - -
Non-currentInvestments in controlled entities – at cost - - 179,774 181,775Listed equity securities available-for-sale – at market value2 39,547 66,175 - 30,191Unlisted unit trusts available-for-sale – at market value3 37,164 56,948 76,192 87,938
122 122 100 100Secured loans 199 167 199 167
77,032 123,412 256,265 300,171
b. Other financial liabilitiesFinancial guarantees4 - - - -
- - - -1
2
3
4
No liability was recognised by the Company in relation to these guarantees as the fair value of these guarantees is considered to be immaterial.
The Trustee Companies Act 1984 (Victoria) requires that a Reserve Fund be provided, the value of which shall be not less than one half of a percentum of trust estates in Victoria. In the event of the appointment of a liquidator, a receiver, a receiver and manager or an official manager of a trustee company, monies in its Reserve Fund are available for the payment of sums due from the trustee company in accordance with Section 39(3) of the above Act. Pursuant to Section 38 of the above Act, the Company may otherwise provide for theReserve Fund by appropriating other funds available in any manner in which trust monies may be invested by a trustee under the TrusteeAct 1958 (Victoria) . The Reserve Fund for the current reporting period is held in cash and cash equivalents.
Bank guarantees to secure lending associated with structured products amounting to $12,990,000 (2007: $9,689,397).
Bank guarantee in favour of investors in the Exact Market Cash Fund amounting to $20,000,000 (2007: $20,000,000). At 30 June 2008,there were no significant liabilities accruing to the consolidated entity under the performance guarantee given to product investors.
The Company's policy is to provide financial guarantees only to wholly-owned subsidiaries and has provided financial guarantees in respect of:
The gains / (losses) on held-to-maturity investments for the consolidated entity was $nil (2007: $nil) and $nil (2007: $nil) for the Company.
Perpetual incubates new investment strategies through the establishment of 'seed funds' for the purpose of building investment trackrecords and developing asset management skills before releasing products to Perpetual's investors. In addition, investments are made in newly launched products to provide a capital base from which investments can be made.
Bank guarantee to secure a $45,000,000 fully drawn bill facility of a controlled entity amounting to $45,000,000 (2007: $45,000,000).
Includes shares with a market value of $nil (2007: $3,111,250) that are held in a Reserve Fund by a controlled entity.
Consolidated Company
Government, municipal and other public securities -held to maturity1
Government, municipal and other public securities -held-to-maturity1
Movements in the provision for bad and doubtful debts are as follows :
The creation and release of the provision for bad and doubtful debts has been included in administrative andgeneral expenses in the Income Statement. Amounts charged to the allowance account are generally written offwhen there is no expectation of recovering additional cash.
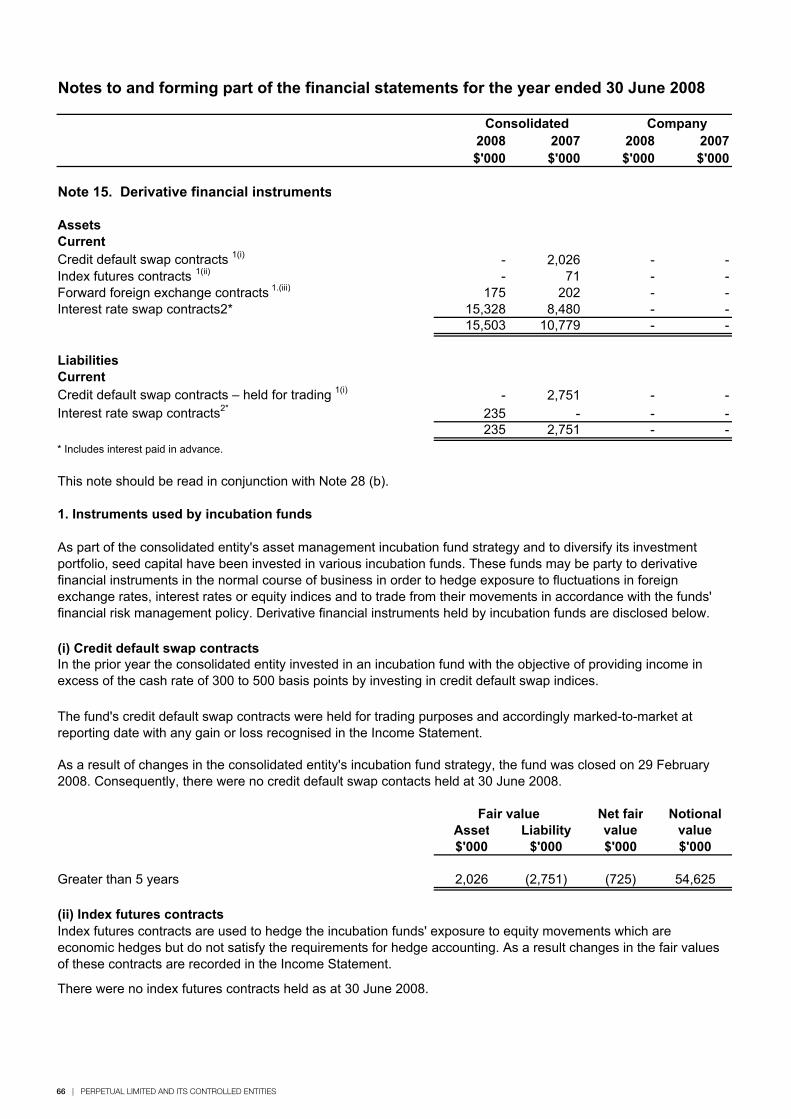
66 | PERPETUAL LIMITED AND ITS CONTROLLED ENTITIES
Notes to and forming part of the financial statements for the year ended 30 June 2008
2008 2007 2008 2007$'000 $'000 $'000 $'000
Note 15. Derivative financial instruments
AssetsCurrentCredit default swap contracts 1(i) - 2,026 - -
- 71 - -175 202 - -
Interest rate swap contracts2* 15,328 8,480 - -15,503 10,779 - -
LiabilitiesCurrentCredit default swap contracts – held for trading 1(i) - 2,751 - -Interest rate swap contracts2* 235 - - -
235 2,751 - -* Includes interest paid in advance.
1. Instruments used by incubation funds
(i) Credit default swap contracts
Net fair NotionalAsset Liability value value$'000 $'000 $'000 $'000
Greater than 5 years 2,026 (2,751) (725) 54,625
(ii) Index futures contracts
There were no index futures contracts held as at 30 June 2008.
Consolidated Company
As part of the consolidated entity's asset management incubation fund strategy and to diversify its investment portfolio, seed capital have been invested in various incubation funds. These funds may be party to derivative financial instruments in the normal course of business in order to hedge exposure to fluctuations in foreign exchange rates, interest rates or equity indices and to trade from their movements in accordance with the funds' financial risk management policy. Derivative financial instruments held by incubation funds are disclosed below.
Index futures contracts 1(ii)
Index futures contracts are used to hedge the incubation funds' exposure to equity movements which are economic hedges but do not satisfy the requirements for hedge accounting. As a result changes in the fair values of these contracts are recorded in the Income Statement.
Fair value
Forward foreign exchange contracts 1.(iii)
In the prior year the consolidated entity invested in an incubation fund with the objective of providing income in excess of the cash rate of 300 to 500 basis points by investing in credit default swap indices.
The fund's credit default swap contracts were held for trading purposes and accordingly marked-to-market at reporting date with any gain or loss recognised in the Income Statement.
This note should be read in conjunction with Note 28 (b).
As a result of changes in the consolidated entity's incubation fund strategy, the fund was closed on 29 February 2008. Consequently, there were no credit default swap contacts held at 30 June 2008.
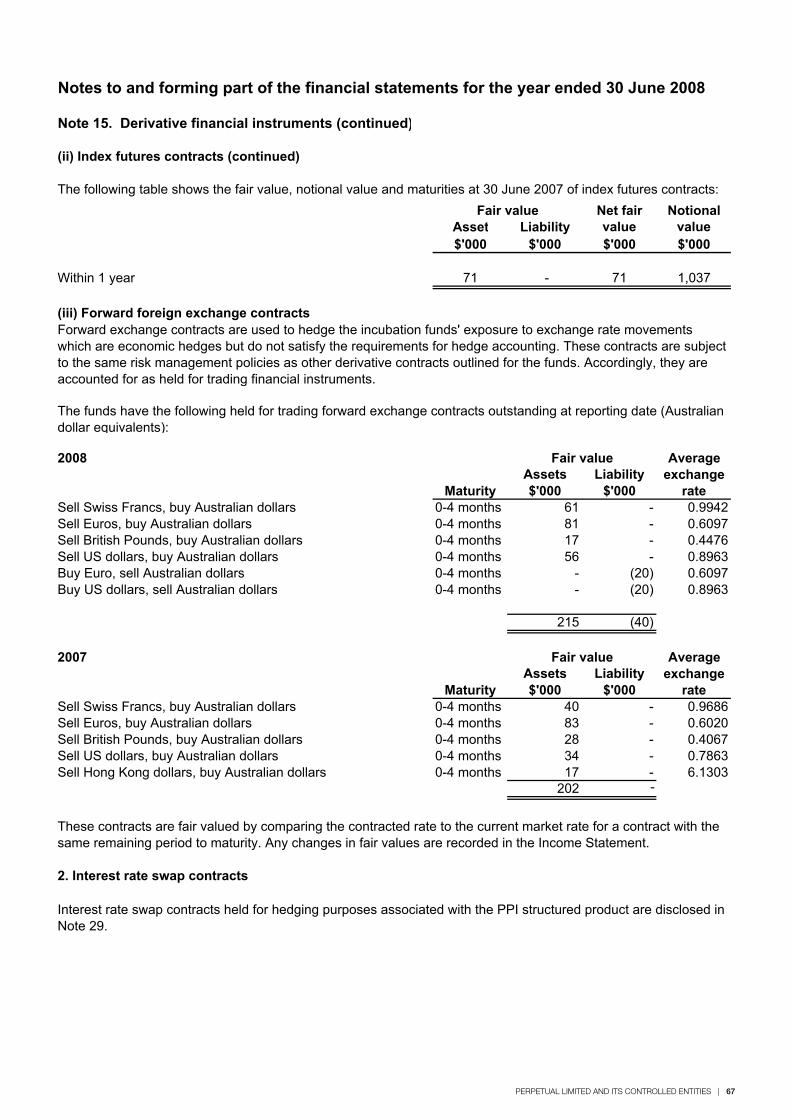
PERPETUAL LIMITED AND ITS CONTROLLED ENTITIES | 67
Notes to and forming part of the financial statements for the year ended 30 June 2008
Note 15. Derivative financial instruments (continued)
(ii) Index futures contracts (continued)
The following table shows the fair value, notional value and maturities at 30 June 2007 of index futures contracts:Net fair Notional
Asset Liability value value$'000 $'000 $'000 $'000
Within 1 year 71 - 71 1,037
(iii) Forward foreign exchange contracts
AverageAssets Liability exchange
Maturity $'000 $'000 rateSell Swiss Francs, buy Australian dollars 0-4 months 61 - 0.9942Sell Euros, buy Australian dollars 0-4 months 81 - 0.6097Sell British Pounds, buy Australian dollars 0-4 months 17 - 0.4476Sell US dollars, buy Australian dollars 0-4 months 56 - 0.8963Buy Euro, sell Australian dollars 0-4 months - (20) 0.6097Buy US dollars, sell Australian dollars 0-4 months - (20) 0.8963
215 (40)
AverageAssets Liability exchange
Maturity $'000 $'000 rateSell Swiss Francs, buy Australian dollars 0-4 months 40 - 0.9686Sell Euros, buy Australian dollars 0-4 months 83 - 0.6020Sell British Pounds, buy Australian dollars 0-4 months 28 - 0.4067Sell US dollars, buy Australian dollars 0-4 months 34 - 0.7863Sell Hong Kong dollars, buy Australian dollars 0-4 months 17 - 6.1303
202 -
2. Interest rate swap contracts
2008
Fair value
Fair value
Interest rate swap contracts held for hedging purposes associated with the PPI structured product are disclosed in Note 29.
Forward exchange contracts are used to hedge the incubation funds' exposure to exchange rate movements which are economic hedges but do not satisfy the requirements for hedge accounting. These contracts are subject to the same risk management policies as other derivative contracts outlined for the funds. Accordingly, they are accounted for as held for trading financial instruments.
These contracts are fair valued by comparing the contracted rate to the current market rate for a contract with the same remaining period to maturity. Any changes in fair values are recorded in the Income Statement.
Fair value
The funds have the following held for trading forward exchange contracts outstanding at reporting date (Australian dollar equivalents):
2007
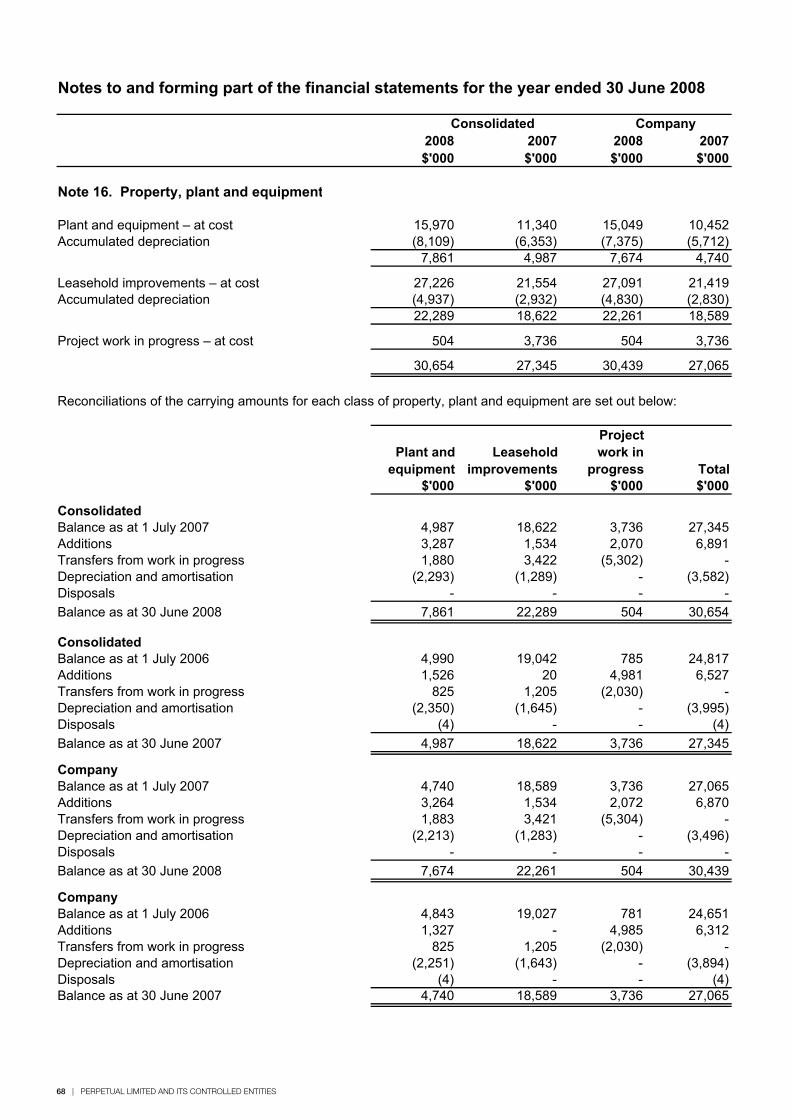
68 | PERPETUAL LIMITED AND ITS CONTROLLED ENTITIES
Notes to and forming part of the financial statements for the year ended 30 June 2008
2008 2007 2008 2007$'000 $'000 $'000 $'000
Note 16. Property, plant and equipment
Plant and equipment – at cost 15,970 11,340 15,049 10,452Accumulated depreciation (8,109) (6,353) (7,375) (5,712)
7,861 4,987 7,674 4,740
Leasehold improvements – at cost 27,226 21,554 27,091 21,419Accumulated depreciation (4,937) (2,932) (4,830) (2,830)
22,289 18,622 22,261 18,589
Project work in progress – at cost 504 3,736 504 3,736
30,654 27,345 30,439 27,065
Plant and equipment
Leaseholdimprovements
Projectwork in
progress Total$'000 $'000 $'000 $'000
ConsolidatedBalance as at 1 July 2007 4,987 18,622 3,736 27,345Additions 3,287 1,534 2,070 6,891Transfers from work in progress 1,880 3,422 (5,302) -Depreciation and amortisation (2,293) (1,289) - (3,582)Disposals - - - -Balance as at 30 June 2008 7,861 22,289 504 30,654
ConsolidatedBalance as at 1 July 2006 4,990 19,042 785 24,817Additions 1,526 20 4,981 6,527Transfers from work in progress 825 1,205 (2,030) -Depreciation and amortisation (2,350) (1,645) - (3,995)Disposals (4) - - (4)Balance as at 30 June 2007 4,987 18,622 3,736 27,345
CompanyBalance as at 1 July 2007 4,740 18,589 3,736 27,065Additions 3,264 1,534 2,072 6,870Transfers from work in progress 1,883 3,421 (5,304) -Depreciation and amortisation (2,213) (1,283) - (3,496)Disposals - - - -Balance as at 30 June 2008 7,674 22,261 504 30,439
CompanyBalance as at 1 July 2006 4,843 19,027 781 24,651Additions 1,327 - 4,985 6,312Transfers from work in progress 825 1,205 (2,030) -Depreciation and amortisation (2,251) (1,643) - (3,894)Disposals (4) - - (4)Balance as at 30 June 2007 4,740 18,589 3,736 27,065
Reconciliations of the carrying amounts for each class of property, plant and equipment are set out below:
CompanyConsolidated
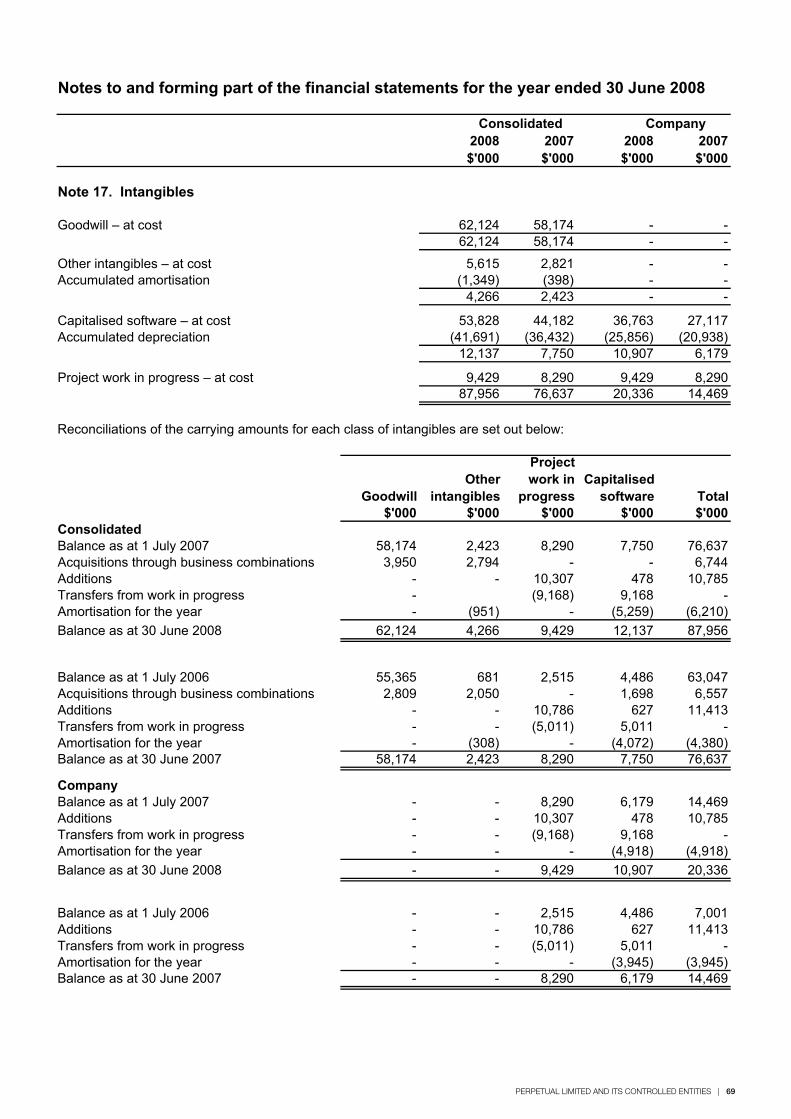
PERPETUAL LIMITED AND ITS CONTROLLED ENTITIES | 69
Notes to and forming part of the financial statements for the year ended 30 June 2008
2008 2007 2008 2007$'000 $'000 $'000 $'000
Note 17. Intangibles
Goodwill – at cost 62,124 58,174 - -62,124 58,174 - -
Other intangibles – at cost 5,615 2,821 - -Accumulated amortisation (1,349) (398) - -
4,266 2,423 - -
Capitalised software – at cost 53,828 44,182 36,763 27,117Accumulated depreciation (41,691) (36,432) (25,856) (20,938)
12,137 7,750 10,907 6,179
Project work in progress – at cost 9,429 8,290 9,429 8,29087,956 76,637 20,336 14,469
GoodwillOther
intangibles
Projectwork in
progressCapitalised
software Total$'000 $'000 $'000 $'000 $'000
ConsolidatedBalance as at 1 July 2007 58,174 2,423 8,290 7,750 76,637Acquisitions through business combinations 3,950 2,794 - - 6,744Additions - - 10,307 478 10,785Transfers from work in progress - (9,168) 9,168 -Amortisation for the year - (951) - (5,259) (6,210)Balance as at 30 June 2008 62,124 4,266 9,429 12,137 87,956
Balance as at 1 July 2006 55,365 681 2,515 4,486 63,047Acquisitions through business combinations 2,809 2,050 - 1,698 6,557Additions - - 10,786 627 11,413Transfers from work in progress - - (5,011) 5,011 -Amortisation for the year - (308) - (4,072) (4,380)Balance as at 30 June 2007 58,174 2,423 8,290 7,750 76,637
CompanyBalance as at 1 July 2007 - - 8,290 6,179 14,469Additions - - 10,307 478 10,785Transfers from work in progress - - (9,168) 9,168 -Amortisation for the year - - - (4,918) (4,918)Balance as at 30 June 2008 - - 9,429 10,907 20,336
Balance as at 1 July 2006 - - 2,515 4,486 7,001Additions - - 10,786 627 11,413Transfers from work in progress - - (5,011) 5,011 -Amortisation for the year - - - (3,945) (3,945)Balance as at 30 June 2007 - - 8,290 6,179 14,469
Reconciliations of the carrying amounts for each class of intangibles are set out below:
CompanyConsolidated
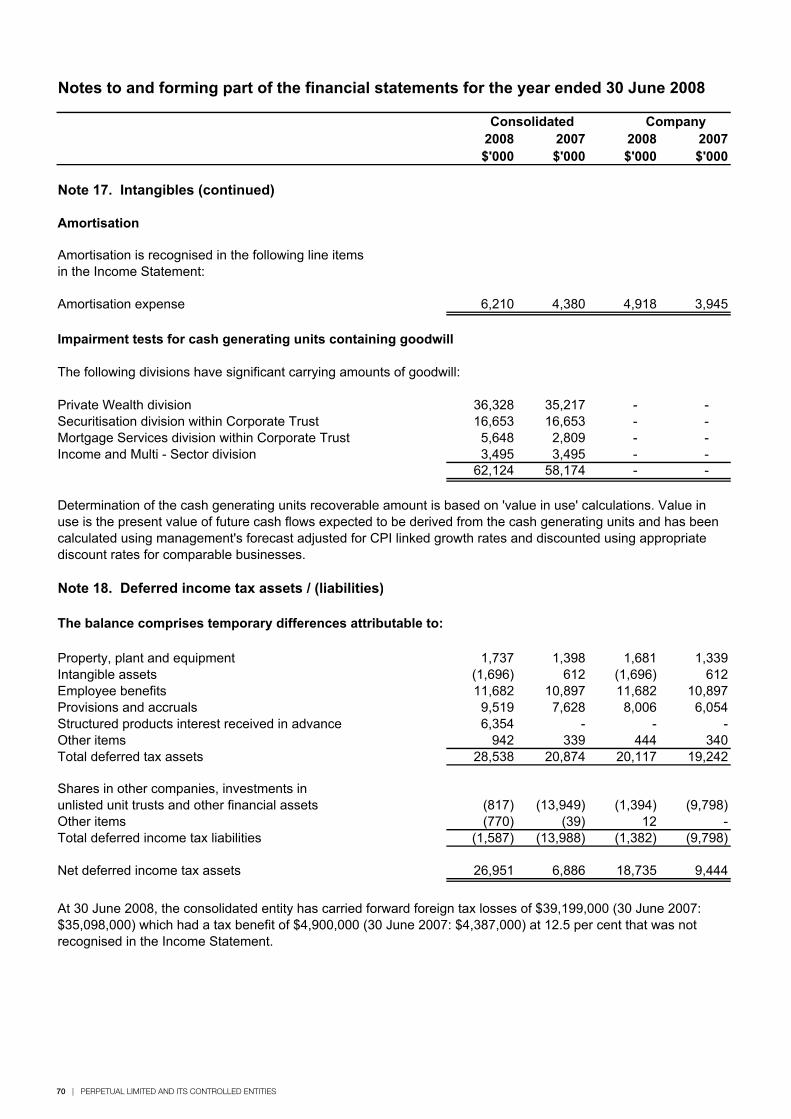
70 | PERPETUAL LIMITED AND ITS CONTROLLED ENTITIES
2008 2007 2008 2007$'000 $'000 $'000 $'000
Note 17. Intangibles (continued)
Amortisation
Amortisation expense 6,210 4,380 4,918 3,945
Impairment tests for cash generating units containing goodwill
The following divisions have significant carrying amounts of goodwill:
Private Wealth division 36,328 35,217 - - Securitisation division within Corporate Trust 16,653 16,653 - - Mortgage Services division within Corporate Trust 5,648 2,809 - - Income and Multi - Sector division 3,495 3,495 - -
62,124 58,174 - -
Note 18. Deferred income tax assets / (liabilities)
The balance comprises temporary differences attributable to:
Property, plant and equipment 1,737 1,398 1,681 1,339Intangible assets (1,696) 612 (1,696) 612Employee benefits 11,682 10,897 11,682 10,897Provisions and accruals 9,519 7,628 8,006 6,054Structured products interest received in advance 6,354 - - -Other items 942 339 444 340Total deferred tax assets 28,538 20,874 20,117 19,242
(817) (13,949) (1,394) (9,798)Other items (770) (39) 12 -Total deferred income tax liabilities (1,587) (13,988) (1,382) (9,798)
Net deferred income tax assets 26,951 6,886 18,735 9,444
At 30 June 2008, the consolidated entity has carried forward foreign tax losses of $39,199,000 (30 June 2007: $35,098,000) which had a tax benefit of $4,900,000 (30 June 2007: $4,387,000) at 12.5 per cent that was not recognised in the Income Statement.
Shares in other companies, investments in unlisted unit trusts and other financial assets
Notes to and forming part of the financial statements for the year ended 30 June 2008
Determination of the cash generating units recoverable amount is based on 'value in use' calculations. Value in use is the present value of future cash flows expected to be derived from the cash generating units and has been calculated using management's forecast adjusted for CPI linked growth rates and discounted using appropriate discount rates for comparable businesses.
Consolidated Company
Amortisation is recognised in the following line items in the Income Statement:
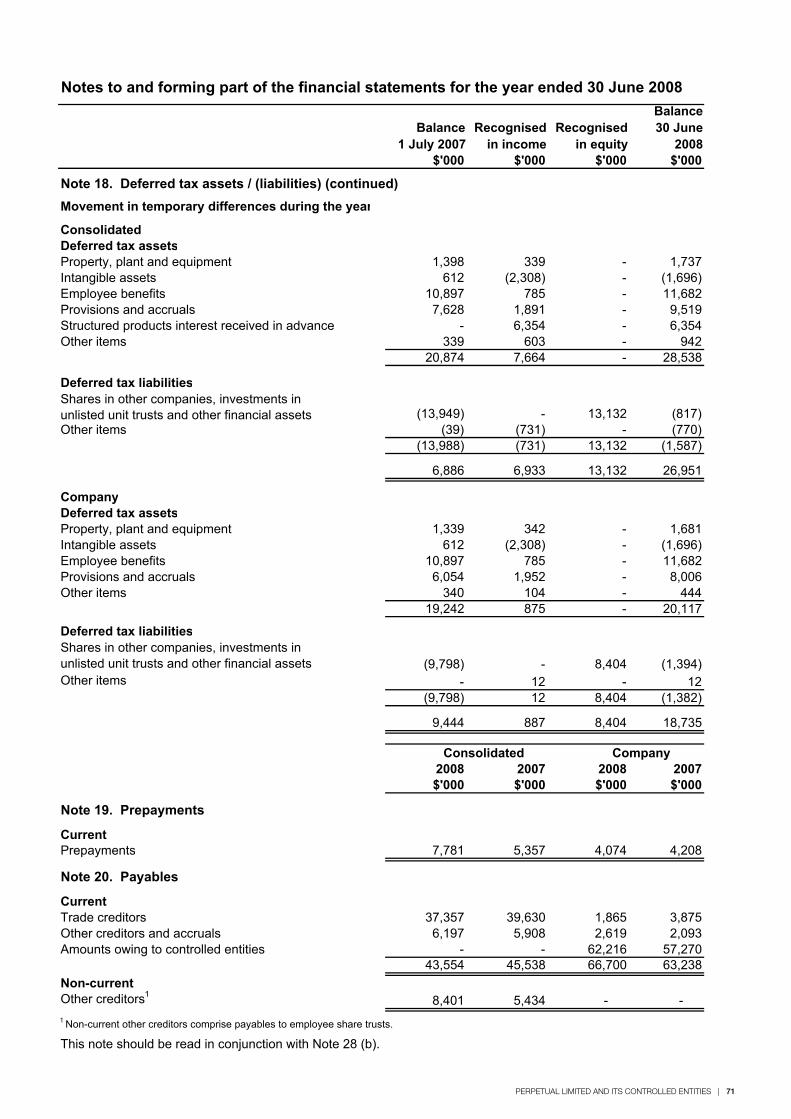
PERPETUAL LIMITED AND ITS CONTROLLED ENTITIES | 71
Balance1 July 2007
Recognisedin income
Recognisedin equity
Balance30 June
2008$'000 $'000 $'000 $'000
Note 18. Deferred tax assets / (liabilities) (continued)Movement in temporary differences during the year
ConsolidatedDeferred tax assetsProperty, plant and equipment 1,398 339 - 1,737Intangible assets 612 (2,308) - (1,696)Employee benefits 10,897 785 - 11,682Provisions and accruals 7,628 1,891 - 9,519Structured products interest received in advance - 6,354 - 6,354Other items 339 603 - 942
20,874 7,664 - 28,538
Deferred tax liabilities
(13,949) - 13,132 (817)Other items (39) (731) - (770)
(13,988) (731) 13,132 (1,587)
6,886 6,933 13,132 26,951
CompanyDeferred tax assetsProperty, plant and equipment 1,339 342 - 1,681Intangible assets 612 (2,308) - (1,696)Employee benefits 10,897 785 - 11,682Provisions and accruals 6,054 1,952 - 8,006Other items 340 104 - 444
19,242 875 - 20,117
Deferred tax liabilities
(9,798) - 8,404 (1,394) - 12 - 12
(9,798) 12 8,404 (1,382)
9,444 887 8,404 18,735
2008 2007 2008 2007$'000 $'000 $'000 $'000
Note 19. Prepayments
CurrentPrepayments 7,781 5,357 4,074 4,208
Note 20. Payables
CurrentTrade creditors 37,357 39,630 1,865 3,875Other creditors and accruals 6,197 5,908 2,619 2,093Amounts owing to controlled entities - - 62,216 57,270
43,554 45,538 66,700 63,238Non-currentOther creditors1 8,401 5,434 - -
This note should be read in conjunction with Note 28 (b).
1 Non-current other creditors comprise payables to employee share trusts.
Notes to and forming part of the financial statements for the year ended 30 June 2008
Consolidated Company
Shares in other companies, investments in unlisted unit trusts and other financial assets
Shares in other companies, investments in unlisted unit trusts and other financial assets Other items
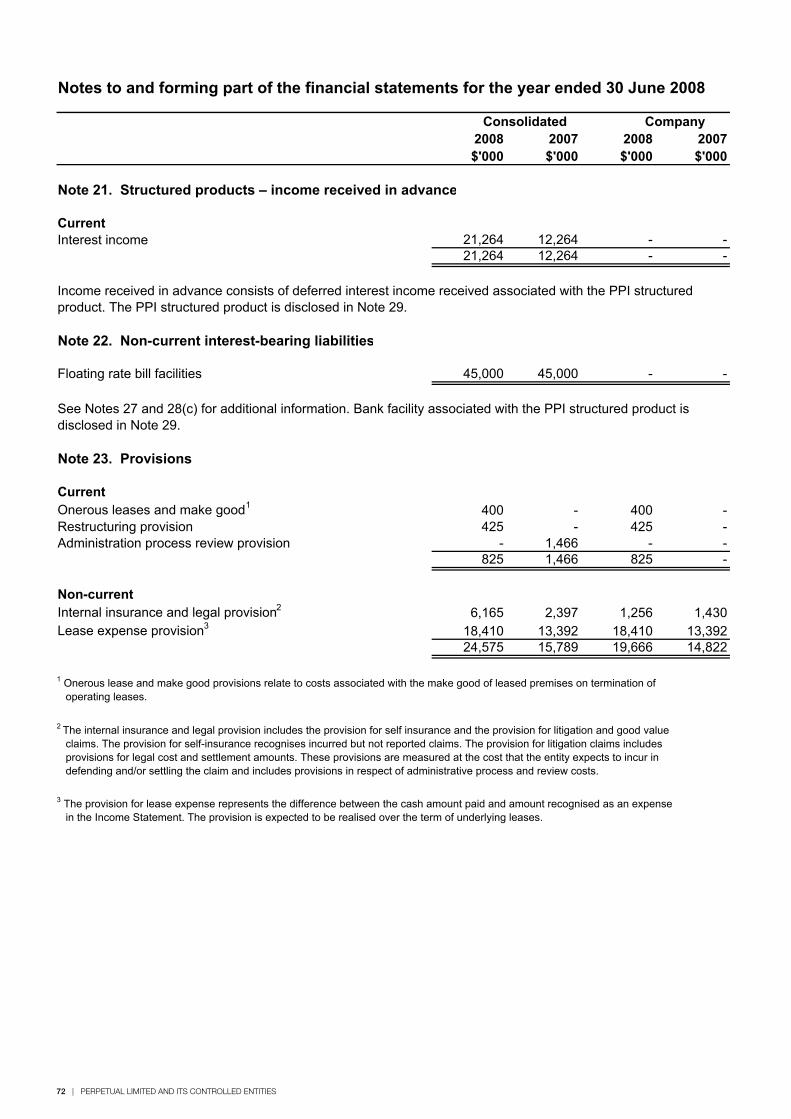
72 | PERPETUAL LIMITED AND ITS CONTROLLED ENTITIES
2008 2007 2008 2007$'000 $'000 $'000 $'000
Note 21. Structured products – income received in advance
CurrentInterest income 21,264 12,264 - -
21,264 12,264 - -
Note 22. Non-current interest-bearing liabilities
Floating rate bill facilities 45,000 45,000 - -
Note 23. Provisions
CurrentOnerous leases and make good1 400 - 400 -Restructuring provision 425 - 425 -Administration process review provision - 1,466 - -
825 1,466 825 -
Non-currentInternal insurance and legal provision2 6,165 2,397 1,256 1,430Lease expense provision3 18,410 13,392 18,410 13,392
24,575 15,789 19,666 14,822
Notes to and forming part of the financial statements for the year ended 30 June 2008
3 The provision for lease expense represents the difference between the cash amount paid and amount recognised as an expense in the Income Statement. The provision is expected to be realised over the term of underlying leases.
Consolidated Company
2 The internal insurance and legal provision includes the provision for self insurance and the provision for litigation and good value claims. The provision for self-insurance recognises incurred but not reported claims. The provision for litigation claims includes provisions for legal cost and settlement amounts. These provisions are measured at the cost that the entity expects to incur in defending and/or settling the claim and includes provisions in respect of administrative process and review costs.
Income received in advance consists of deferred interest income received associated with the PPI structured product. The PPI structured product is disclosed in Note 29.
See Notes 27 and 28(c) for additional information. Bank facility associated with the PPI structured product is disclosed in Note 29.
1 Onerous lease and make good provisions relate to costs associated with the make good of leased premises on termination of operating leases.
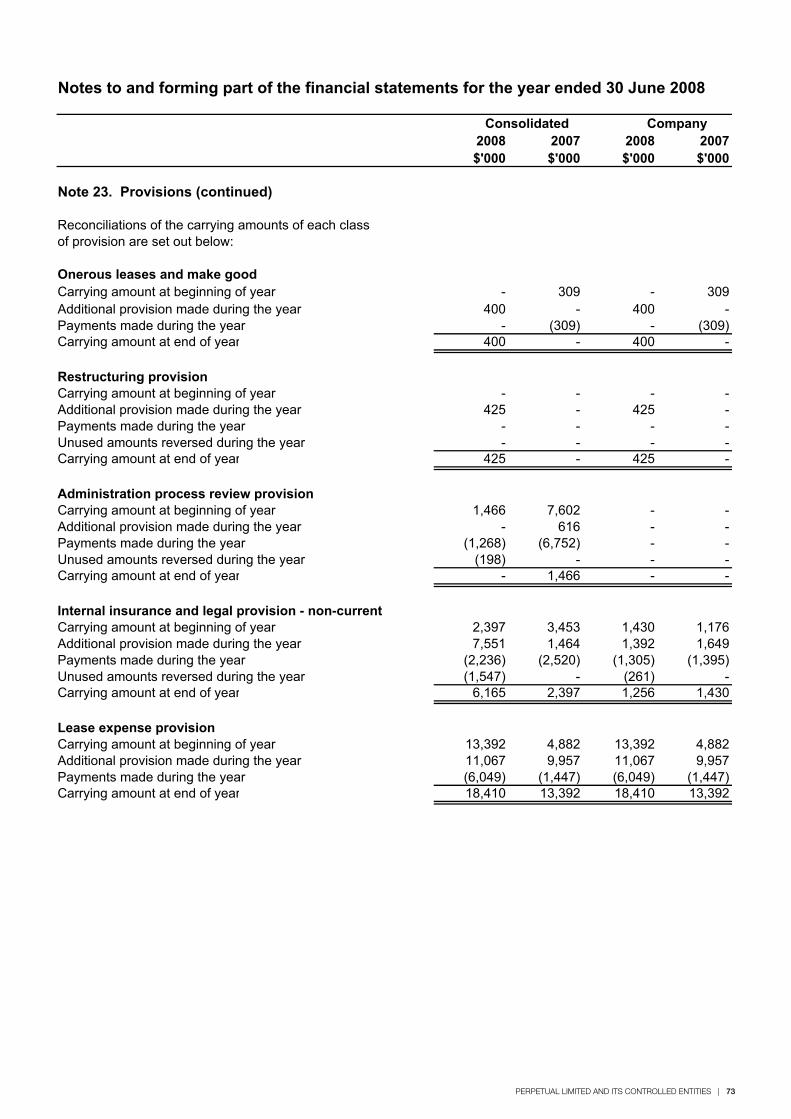
PERPETUAL LIMITED AND ITS CONTROLLED ENTITIES | 73
2008 2007 2008 2007$'000 $'000 $'000 $'000
Note 23. Provisions (continued)
Onerous leases and make good Carrying amount at beginning of year - 309 - 309
400 - 400 - - (309) - (309)
Carrying amount at end of year 400 - 400 -
Restructuring provisionCarrying amount at beginning of year - - - -
425 - 425 - - - - -
Unused amounts reversed during the year - - - -Carrying amount at end of year 425 - 425 -
Carrying amount at beginning of year 1,466 7,602 - -Additional provision made during the year - 616 - -Payments made during the year (1,268) (6,752) - -Unused amounts reversed during the year (198) - - -Carrying amount at end of year - 1,466 - -
Internal insurance and legal provision - non-currentCarrying amount at beginning of year 2,397 3,453 1,430 1,176
7,551 1,464 1,392 1,649(2,236) (2,520) (1,305) (1,395)
Unused amounts reversed during the year (1,547) - (261) -Carrying amount at end of year 6,165 2,397 1,256 1,430
Lease expense provision Carrying amount at beginning of year 13,392 4,882 13,392 4,882
11,067 9,957 11,067 9,957(6,049) (1,447) (6,049) (1,447)
Carrying amount at end of year 18,410 13,392 18,410 13,392
Additional provision made during the yearPayments made during the year
Payments made during the yearAdditional provision made during the year
Notes to and forming part of the financial statements for the year ended 30 June 2008
Reconciliations of the carrying amounts of each class of provision are set out below:
Consolidated Company
Administration process review provision
Payments made during the yearAdditional provision made during the year
Additional provision made during the yearPayments made during the year
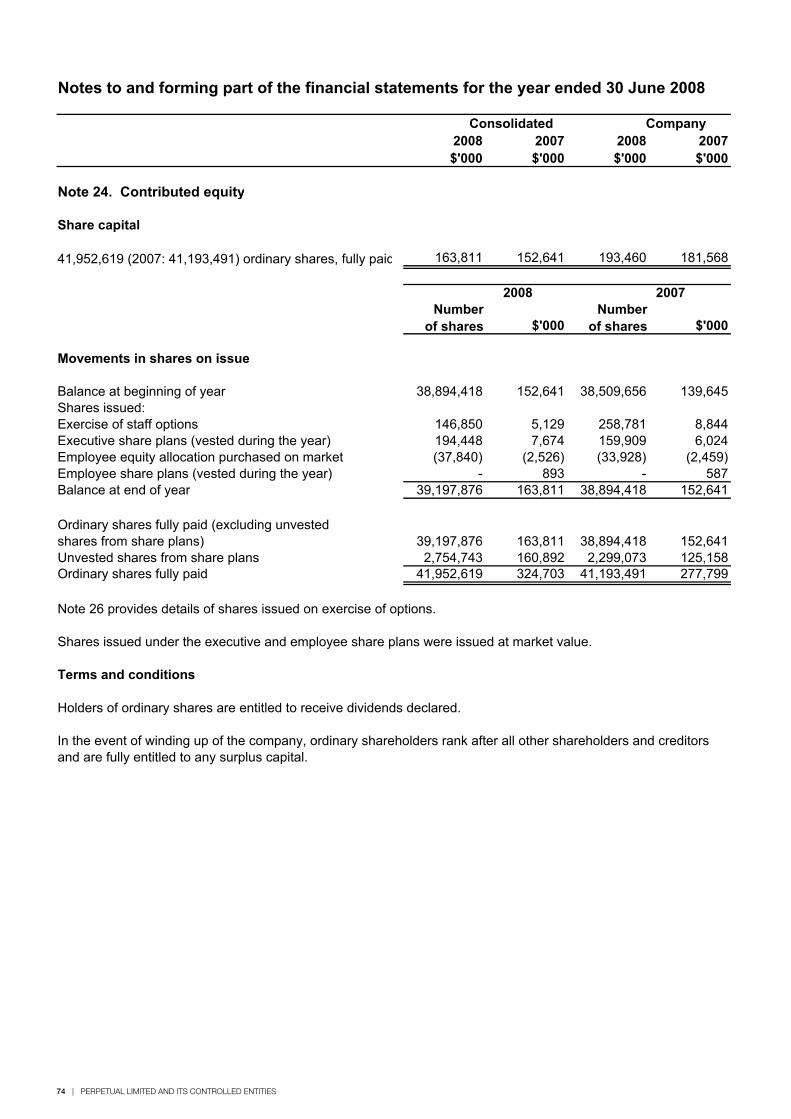
74 | PERPETUAL LIMITED AND ITS CONTROLLED ENTITIES
2008 2007 2008 2007$'000 $'000 $'000 $'000
Note 24. Contributed equity
Share capital
163,811 152,641 193,460 181,568
Numberof shares $'000
Number of shares $'000
Movements in shares on issue
Balance at beginning of year 38,894,418 152,641 38,509,656 139,645Shares issued:Exercise of staff options 146,850 5,129 258,781 8,844Executive share plans (vested during the year) 194,448 7,674 159,909 6,024Employee equity allocation purchased on market (37,840) (2,526) (33,928) (2,459)Employee share plans (vested during the year) - 893 - 587Balance at end of year 39,197,876 163,811 38,894,418 152,641
39,197,876 163,811 38,894,418 152,641Unvested shares from share plans 2,754,743 160,892 2,299,073 125,158Ordinary shares fully paid 41,952,619 324,703 41,193,491 277,799
Note 26 provides details of shares issued on exercise of options.
Shares issued under the executive and employee share plans were issued at market value.
Terms and conditions
Notes to and forming part of the financial statements for the year ended 30 June 2008
In the event of winding up of the company, ordinary shareholders rank after all other shareholders and creditors and are fully entitled to any surplus capital.
Holders of ordinary shares are entitled to receive dividends declared.
Ordinary shares fully paid (excluding unvested shares from share plans)
41,952,619 (2007: 41,193,491) ordinary shares, fully paid
Consolidated Company
2008 2007
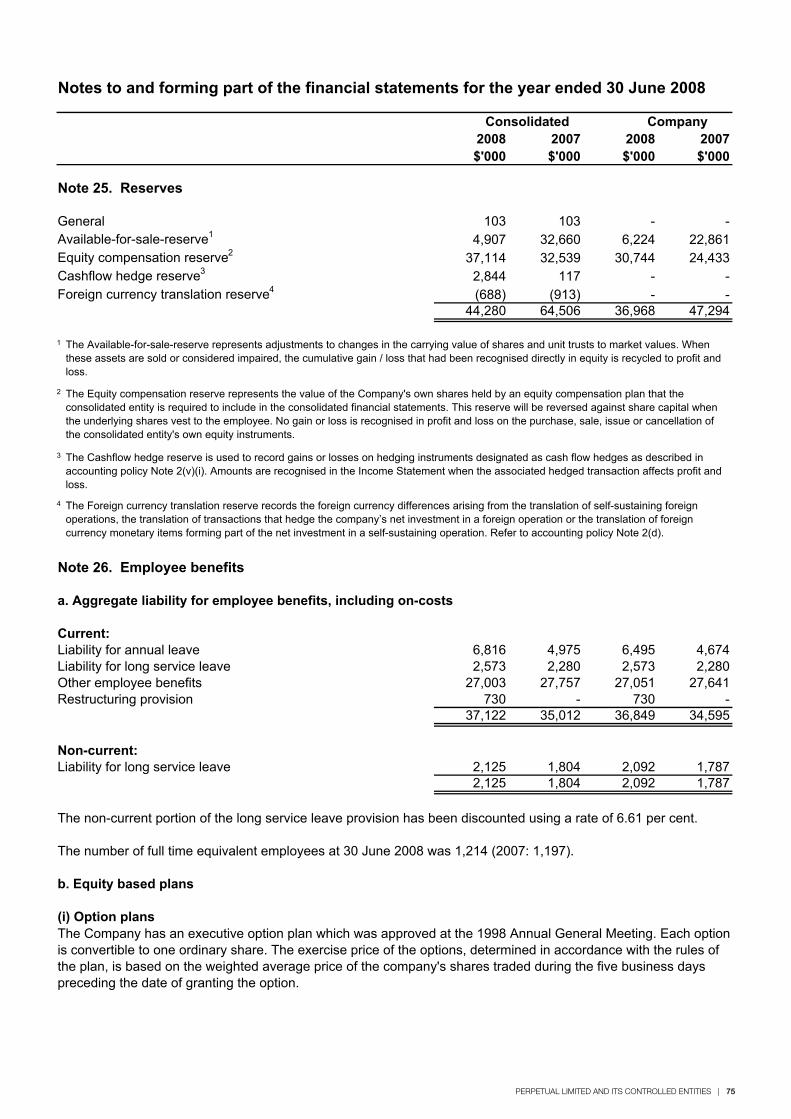
PERPETUAL LIMITED AND ITS CONTROLLED ENTITIES | 75
Notes to and forming part of the financial statements for the year ended 30 June 2008
2008 2007 2008 2007$'000 $'000 $'000 $'000
Note 25. Reserves
General 103 103 - -Available-for-sale-reserve1 4,907 32,660 6,224 22,861Equity compensation reserve2 37,114 32,539 30,744 24,433Cashflow hedge reserve3 2,844 117 - -Foreign currency translation reserve4 (688) (913) - -
44,280 64,506 36,968 47,294
1
2
3
4
Note 26. Employee benefits
a. Aggregate liability for employee benefits, including on-costs
Current:Liability for annual leave 6,816 4,975 6,495 4,674Liability for long service leave 2,573 2,280 2,573 2,280Other employee benefits 27,003 27,757 27,051 27,641Restructuring provision 730 - 730 -
37,122 35,012 36,849 34,595
Non-current:Liability for long service leave 2,125 1,804 2,092 1,787
2,125 1,804 2,092 1,787
The non-current portion of the long service leave provision has been discounted using a rate of 6.61 per cent.
b. Equity based plans
(i) Option plans
Consolidated Company
The Company has an executive option plan which was approved at the 1998 Annual General Meeting. Each option is convertible to one ordinary share. The exercise price of the options, determined in accordance with the rules of the plan, is based on the weighted average price of the company's shares traded during the five business days preceding the date of granting the option.
The Available-for-sale-reserve represents adjustments to changes in the carrying value of shares and unit trusts to market values. When these assets are sold or considered impaired, the cumulative gain / loss that had been recognised directly in equity is recycled to profit and loss.
The Foreign currency translation reserve records the foreign currency differences arising from the translation of self-sustaining foreign operations, the translation of transactions that hedge the company’s net investment in a foreign operation or the translation of foreign currency monetary items forming part of the net investment in a self-sustaining operation. Refer to accounting policy Note 2(d).
The Equity compensation reserve represents the value of the Company's own shares held by an equity compensation plan that the consolidated entity is required to include in the consolidated financial statements. This reserve will be reversed against share capital when the underlying shares vest to the employee. No gain or loss is recognised in profit and loss on the purchase, sale, issue or cancellation of the consolidated entity's own equity instruments.
The Cashflow hedge reserve is used to record gains or losses on hedging instruments designated as cash flow hedges as described in accounting policy Note 2(v)(i). Amounts are recognised in the Income Statement when the associated hedged transaction affects profit and loss.
The number of full time equivalent employees at 30 June 2008 was 1,214 (2007: 1,197).
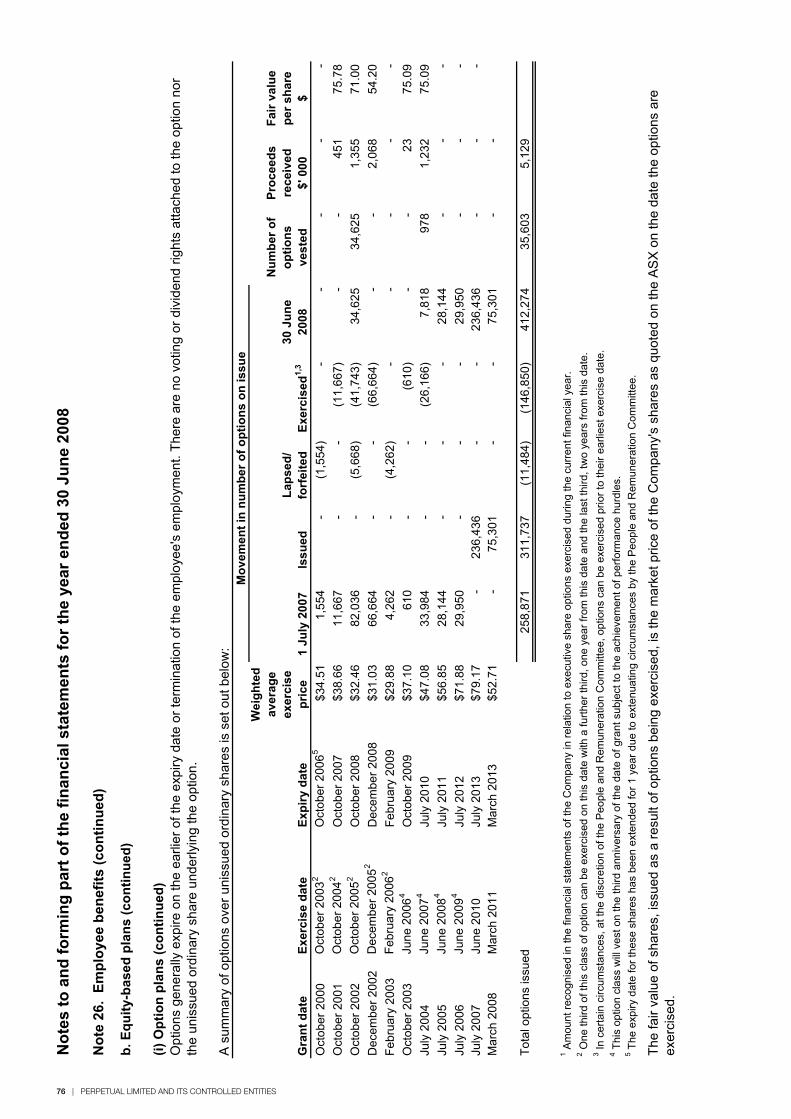
76 | PERPETUAL LIMITED AND ITS CONTROLLED ENTITIES
Not
es to
and
form
ing
part
of t
he fi
nanc
ial s
tate
men
ts fo
r the
yea
r end
ed 3
0 Ju
ne 2
008
Not
e 26
. Em
ploy
ee b
enef
its (c
ontin
ued)
b. E
quity
-bas
ed p
lans
(con
tinue
d)
(i) O
ptio
n pl
ans
(con
tinue
d)
A s
umm
ary
of o
ptio
ns o
ver u
niss
ued
ordi
nary
sha
res
is s
et o
ut b
elow
:M
ovem
ent i
n nu
mbe
r of o
ptio
ns o
n is
sue
Gra
nt d
ate
Exer
cise
dat
eEx
piry
dat
e
Wei
ghte
dav
erag
eex
erci
sepr
ice
1 Ju
ly 2
007
Issu
edLa
psed
/fo
rfei
ted
Exer
cise
d1,3
30 J
une
2008
Num
ber o
f op
tions
vest
ed
Proc
eeds
rece
ived
$' 0
00
Fair
valu
e pe
r sha
re$
Oct
ober
200
0O
ctob
er 2
0032
Oct
ober
200
65$3
4.51
1,55
4-
(1,5
54)
--
- -
-O
ctob
er 2
001
Oct
ober
200
42O
ctob
er 2
007
$38.
6611
,667
--
(11,
667)
--
451
75.7
8O
ctob
er 2
002
Oct
ober
200
52O
ctob
er 2
008
$32.
4682
,036
-(5
,668
)(4
1,74
3)34
,625
34,6
251,
355
71.0
0D
ecem
ber 2
002
Dec
embe
r 200
52D
ecem
ber 2
008
$31.
0366
,664
--
(66,
664)
--
2,06
854
.20
Febr
uary
200
3Fe
brua
ry 2
0062
Febr
uary
200
9$2
9.88
4,26
2-
(4,2
62)
--
- -
-O
ctob
er 2
003
June
200
64O
ctob
er 2
009
$37.
1061
0-
-(6
10)
--
2375
.09
July
200
4Ju
ne 2
0074
July
201
0$4
7.08
33,9
84-
-(2
6,16
6)7,
818
978
1,23
275
.09
July
200
5Ju
ne 2
0084
July
201
1$5
6.85
28,1
44-
--
28,1
44-
--
July
200
6Ju
ne 2
0094
July
201
2$7
1.88
29,9
50-
--
29,9
50-
--
July
200
7Ju
ne 2
010
July
201
3$7
9.17
-23
6,43
6-
-23
6,43
6-
--
Mar
ch 2
008
Mar
ch 2
011
Mar
ch 2
013
$52.
71-
75,3
01-
-75
,301
- -
Tota
l opt
ions
issu
ed25
8,87
131
1,73
7(1
1,48
4)(1
46,8
50)
412,
274
35,6
035,
129
The
fair
valu
e of
sha
res,
issu
ed a
s a
resu
lt of
opt
ions
bei
ng e
xerc
ised
, is
the
mar
ket p
rice
of th
e C
ompa
ny's
sha
res
as q
uote
d on
the
AS
X o
n th
e da
te th
e op
tions
are
ex
erci
sed.
Opt
ions
gen
eral
ly e
xpire
on
the
earli
er o
f the
exp
iry d
ate
or te
rmin
atio
n of
the
empl
oyee
's e
mpl
oym
ent.
Ther
e ar
e no
vot
ing
or d
ivid
end
right
s at
tach
ed to
the
optio
n no
r th
e un
issu
ed o
rdin
ary
shar
e un
derly
ing
the
optio
n.
1 Am
ount
reco
gnis
ed in
the
finan
cial
sta
tem
ents
of t
he C
ompa
ny in
rela
tion
to e
xecu
tive
shar
e op
tions
exe
rcis
ed d
urin
g th
e cu
rren
t fin
anci
al y
ear.
2 One
third
of t
his
clas
s of
opt
ion
can
be e
xerc
ised
on
this
dat
e w
ith a
furth
er th
ird, o
ne y
ear f
rom
this
dat
e an
d th
e la
st th
ird, t
wo
year
s fro
m th
is d
ate.
3 In
cer
tain
circ
umst
ance
s, a
t the
dis
cret
ion
of th
e P
eopl
e an
d R
emun
erat
ion
Com
mitt
ee, o
ptio
ns c
an b
e ex
erci
sed
prio
r to
thei
r ear
liest
exe
rcis
e da
te.
4 Thi
s op
tion
clas
s w
ill v
est o
n th
e th
ird a
nniv
ersa
ry o
f the
dat
e of
gra
nt s
ubje
ct to
the
achi
evem
ent o
f per
form
ance
hur
dles
.5 T
he e
xpiry
dat
e fo
r the
se s
hare
s ha
s be
en e
xten
ded
for 1
yea
r due
to e
xten
uatin
g ci
rcum
stan
ces
by th
e P
eopl
e an
d R
emun
erat
ion
Com
mitt
ee.
PERPETUAL LIMITED AND ITS CONTROLLED ENTITIES | 77
Notes to and forming part of the financial statements for the year ended 30 June 2008
Note 26. Employee benefits (continued)
b. Equity-based plans (continued)
(ii) Executive Share Plan (ESP)
(iii) Employee Share Purchase Plan (ESPP)This plan was discontinued on 10 December 2004 and no further issues have been made under this plan.
(iv) Employee Reward Share Plan (ERSP)
(v) Tax Exempt Share Plan (TESP)
The ESP was approved by shareholders at the company's Annual General Meeting in 1997 and was amended at the 1999 AGM.
The ERSP enables the Company to offer employees shares equivalent in value to $1,000 that vest immediately at no cost in recognition of their contribution to Perpetual's performance over the previous financial year. This plan was first activated in 2002 to acknowledge the contribution by staff to the financial results of the Company in the 2002 financial year. No shares have been issued under this scheme since that year.
Under the TESP, eligible employees will be able to salary sacrifice up to $1,000 of short term incentive to acquire an equivalent value of Perpetual shares. These shares cannot be sold or transferred until the earlier of three years after the date of allocation or the time the participant ceases to be an employee of Perpetual. Shares will be acquired in ordinary trading on the Australian Stock Exchange or issued by Perpetual. Executive directors and executives are not able to participate in this plan.
The ESP forms part of the structure for short and long term variable remuneration components paid to employees. Grants under the plan for short-term performance are made on achievement of specific performance goals whilst long-term grants vest after periods of between three and five years after the date of grant.
The issue price of grants of shares is the weighted average of the prices at which shares were traded on the ASX for the five days up to the date of issue. Shares are either purchased on market or issued by the Company to satisfy the grants made to eligible employees.
While shares are held by the ESP, employees receive dividends and have voting rights.
The ESPP provided eligible employees with a non-recourse interest free loan, for a period not exceeding 10 years, to purchase shares under the plan. The invitation was open to employees who commenced permanent employment with Perpetual prior to 1 June 2004 with an offer to purchase a minimum number of shares equivalent in value to $1,000 and a maximum number of shares equivalent in value to $4,000. The issue price under the plan was the weighted average of the prices at which shares were traded on the ASX for the five days up to the date of issue.
78 | PERPETUAL LIMITED AND ITS CONTROLLED ENTITIES
Notes to and forming part of the financial statements for the year ended 30 June 2008
Note 26. Employee benefits (continued)
b. Equity based plans (continued)
(vi) The Tax Deferred Share Plan (TDSP)
(vii) Deferred Share Plan (DSP)
(viii) Global Employee Share Trust (GEST)
Dividends paid on shares held by the GEST are retained in the GEST for the benefit of the employee until performance hurdles are tested, at which time the dividend accumulated may be distributed to the employee. Voting rights attached to unvested shares that are held in the GEST are exercisable by the trustee of the GEST.
Under the TDSP, eligible employees will be able to salary sacrifice all or part of their short term incentive to acquire an equivalent value of Perpetual shares. Shares will be acquired in the ordinary course of trading on the Australian Stock Exchange. Executive directors and executives have the opportunity to participate in this plan. Shares acquired under this plan by Executive Directors and Executives are not subject to performance hurdles because they are acquired on a salary or bonus sacrifice basis.
The DSP forms part of the structure for short-term and long-term variable remuneration components paid to eligible employees of the Australian business. Grants under the plan vest subject to the achievement of specific performance hurdles.
The issue price of grants is the weighted average of the prices at which shares traded on the Australian Stock Exchange for the five days up to the date of issue. Shares are either purchased on market or issued by the company to satisfy grants made to eligible employees.
While shares are held by the DSP, eligible employees have voting rights and receive dividends directly or reinvest dividends into Perpetual shares.
The GEST forms part of the structure for long-term variable remuneration components paid to eligible employees of the Perpetual Investments Global Equities business.
The issue price of grants is the weighted average of the prices at which shares traded on the Australian Stock Exchange for the five days prior to the date of grant of shares. Shares are either purchased on market or issued by the company to satisfy grants made to eligible employees.
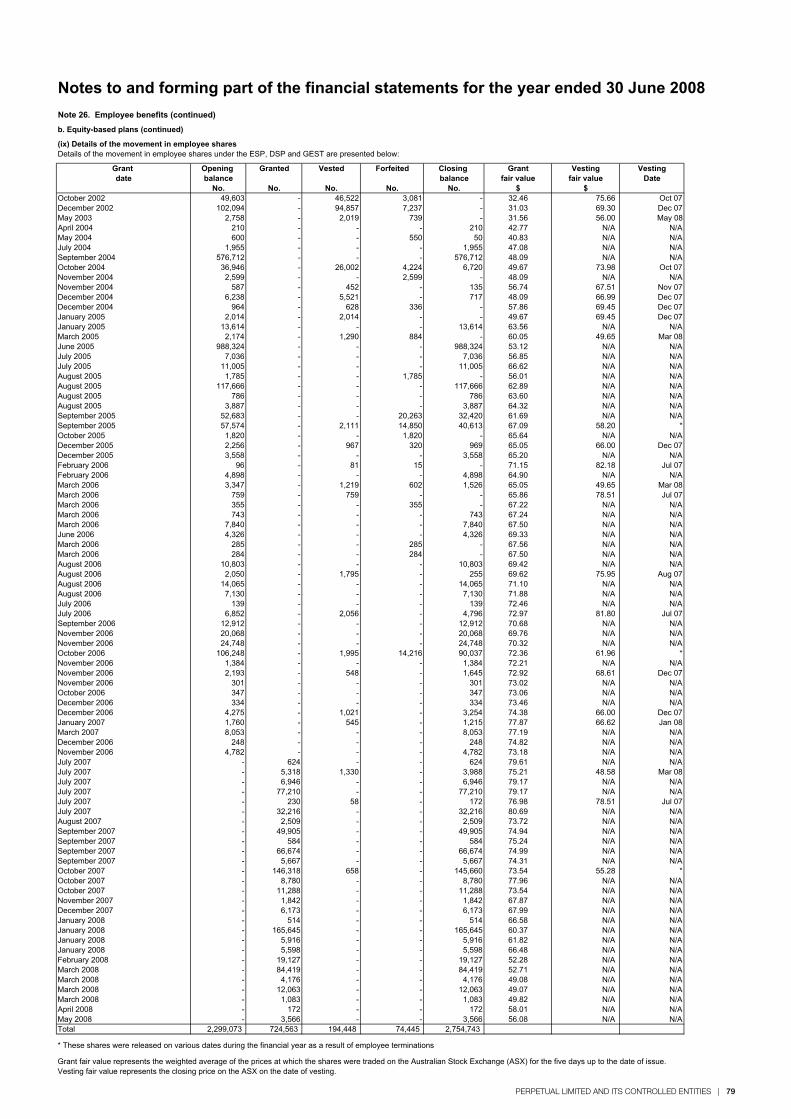
PERPETUAL LIMITED AND ITS CONTROLLED ENTITIES | 79
Notes to and forming part of the financial statements for the year ended 30 June 2008Note 26. Employee benefits (continued)
b. Equity-based plans (continued)
(ix) Details of the movement in employee sharesDetails of the movement in employee shares under the ESP, DSP and GEST are presented below:
Grant Opening Granted Vested Forfeited Closing Grant Vesting Vestingdate balance balance fair value fair value Date
No. No. No. No. No. $ $October 2002 49,603 - 46,522 3,081 - 32.46 75.66 Oct 07December 2002 102,094 - 94,857 7,237 - 31.03 69.30 Dec 07May 2003 2,758 - 2,019 739 - 31.56 56.00 May 08April 2004 210 - - - 210 42.77 N/A N/AMay 2004 600 - - 550 50 40.83 N/A N/AJuly 2004 1,955 - - - 1,955 47.08 N/A N/ASeptember 2004 576,712 - - - 576,712 48.09 N/A N/AOctober 2004 36,946 - 26,002 4,224 6,720 49.67 73.98 Oct 07November 2004 2,599 - - 2,599 - 48.09 N/A N/ANovember 2004 587 - 452 - 135 56.74 67.51 Nov 07December 2004 6,238 - 5,521 - 717 48.09 66.99 Dec 07December 2004 964 - 628 336 - 57.86 69.45 Dec 07January 2005 2,014 - 2,014 - - 49.67 69.45 Dec 07January 2005 13,614 - - - 13,614 63.56 N/A N/AMarch 2005 2,174 - 1,290 884 - 60.05 49.65 Mar 08June 2005 988,324 - - - 988,324 53.12 N/A N/AJuly 2005 7,036 - - - 7,036 56.85 N/A N/AJuly 2005 11,005 - - - 11,005 66.62 N/A N/AAugust 2005 1,785 - - 1,785 - 56.01 N/A N/AAugust 2005 117,666 - - - 117,666 62.89 N/A N/AAugust 2005 786 - - - 786 63.60 N/A N/AAugust 2005 3,887 - - - 3,887 64.32 N/A N/ASeptember 2005 52,683 - - 20,263 32,420 61.69 N/A N/ASeptember 2005 57,574 - 2,111 14,850 40,613 67.09 58.20 *October 2005 1,820 - - 1,820 - 65.64 N/A N/ADecember 2005 2,256 - 967 320 969 65.05 66.00 Dec 07December 2005 3,558 - - - 3,558 65.20 N/A N/AFebruary 2006 96 - 81 15 - 71.15 82.18 Jul 07February 2006 4,898 - - - 4,898 64.90 N/A N/AMarch 2006 3,347 - 1,219 602 1,526 65.05 49.65 Mar 08March 2006 759 - 759 - - 65.86 78.51 Jul 07March 2006 355 - - 355 - 67.22 N/A N/AMarch 2006 743 - - - 743 67.24 N/A N/AMarch 2006 7,840 - - - 7,840 67.50 N/A N/AJune 2006 4,326 - - - 4,326 69.33 N/A N/AMarch 2006 285 - - 285 - 67.56 N/A N/AMarch 2006 284 - - 284 - 67.50 N/A N/AAugust 2006 10,803 - - - 10,803 69.42 N/A N/AAugust 2006 2,050 - 1,795 - 255 69.62 75.95 Aug 07August 2006 14,065 - - - 14,065 71.10 N/A N/AAugust 2006 7,130 - - - 7,130 71.88 N/A N/AJuly 2006 139 - - - 139 72.46 N/A N/AJuly 2006 6,852 - 2,056 - 4,796 72.97 81.80 Jul 07September 2006 12,912 - - - 12,912 70.68 N/A N/ANovember 2006 20,068 - - - 20,068 69.76 N/A N/ANovember 2006 24,748 - - - 24,748 70.32 N/A N/AOctober 2006 106,248 - 1,995 14,216 90,037 72.36 61.96 *November 2006 1,384 - - - 1,384 72.21 N/A N/ANovember 2006 2,193 - 548 - 1,645 72.92 68.61 Dec 07November 2006 301 - - - 301 73.02 N/A N/AOctober 2006 347 - - - 347 73.06 N/A N/ADecember 2006 334 - - - 334 73.46 N/A N/ADecember 2006 4,275 - 1,021 - 3,254 74.38 66.00 Dec 07January 2007 1,760 - 545 - 1,215 77.87 66.62 Jan 08March 2007 8,053 - - - 8,053 77.19 N/A N/ADecember 2006 248 - - - 248 74.82 N/A N/ANovember 2006 4,782 - - - 4,782 73.18 N/A N/AJuly 2007 - 624 - - 624 79.61 N/A N/AJuly 2007 - 5,318 1,330 - 3,988 75.21 48.58 Mar 08July 2007 - 6,946 - - 6,946 79.17 N/A N/AJuly 2007 - 77,210 - - 77,210 79.17 N/A N/AJuly 2007 - 230 58 - 172 76.98 78.51 Jul 07July 2007 - 32,216 - - 32,216 80.69 N/A N/AAugust 2007 - 2,509 - - 2,509 73.72 N/A N/ASeptember 2007 - 49,905 - - 49,905 74.94 N/A N/ASeptember 2007 - 584 - - 584 75.24 N/A N/ASeptember 2007 - 66,674 - - 66,674 74.99 N/A N/ASeptember 2007 - 5,667 - - 5,667 74.31 N/A N/AOctober 2007 - 146,318 658 - 145,660 73.54 55.28 *October 2007 - 8,780 - - 8,780 77.96 N/A N/AOctober 2007 - 11,288 - - 11,288 73.54 N/A N/ANovember 2007 - 1,842 - - 1,842 67.87 N/A N/ADecember 2007 - 6,173 - - 6,173 67.99 N/A N/AJanuary 2008 - 514 - - 514 66.58 N/A N/AJanuary 2008 - 165,645 - - 165,645 60.37 N/A N/AJanuary 2008 - 5,916 - - 5,916 61.82 N/A N/AJanuary 2008 - 5,598 - - 5,598 66.48 N/A N/AFebruary 2008 - 19,127 - - 19,127 52.28 N/A N/AMarch 2008 - 84,419 - - 84,419 52.71 N/A N/AMarch 2008 - 4,176 - - 4,176 49.08 N/A N/AMarch 2008 - 12,063 - - 12,063 49.07 N/A N/AMarch 2008 - 1,083 - - 1,083 49.82 N/A N/AApril 2008 - 172 - - 172 58.01 N/A N/AMay 2008 - 3,566 - - 3,566 56.08 N/A N/ATotal 2,299,073 724,563 194,448 74,445 2,754,743
Grants satisfied as follows:Issue of shares 612,278
On market purchases 37,840 Re issue of shares previously forfeited 74,445
Total grants 724,563
* These shares were released on various dates during the financial year as a result of employee terminations
Grant fair value represents the weighted average of the prices at which the shares were traded on the Australian Stock Exchange (ASX) for the five days up to the date of issue. Vesting fair value represents the closing price on the ASX on the date of vesting.
Notes to and forming part of the financial statements for the year ended 30 June 2008
Note 26. Employee benefits (continued)
b. Equity based plans (continued)
(vi) The Tax Deferred Share Plan (TDSP)
(vii) Deferred Share Plan (DSP)
(viii) Global Employee Share Trust (GEST)
Dividends paid on shares held by the GEST are retained in the GEST for the benefit of the employee until performance hurdles are tested, at which time the dividend accumulated may be distributed to the employee. Voting rights attached to unvested shares that are held in the GEST are exercisable by the trustee of the GEST.
Under the TDSP, eligible employees will be able to salary sacrifice all or part of their short term incentive to acquire an equivalent value of Perpetual shares. Shares will be acquired in the ordinary course of trading on the Australian Stock Exchange. Executive directors and executives have the opportunity to participate in this plan. Shares acquired under this plan by Executive Directors and Executives are not subject to performance hurdles because they are acquired on a salary or bonus sacrifice basis.
The DSP forms part of the structure for short-term and long-term variable remuneration components paid to eligible employees of the Australian business. Grants under the plan vest subject to the achievement of specific performance hurdles.
The issue price of grants is the weighted average of the prices at which shares traded on the Australian Stock Exchange for the five days up to the date of issue. Shares are either purchased on market or issued by the company to satisfy grants made to eligible employees.
While shares are held by the DSP, eligible employees have voting rights and receive dividends directly or reinvest dividends into Perpetual shares.
The GEST forms part of the structure for long-term variable remuneration components paid to eligible employees of the Perpetual Investments Global Equities business.
The issue price of grants is the weighted average of the prices at which shares traded on the Australian Stock Exchange for the five days prior to the date of grant of shares. Shares are either purchased on market or issued by the company to satisfy grants made to eligible employees.
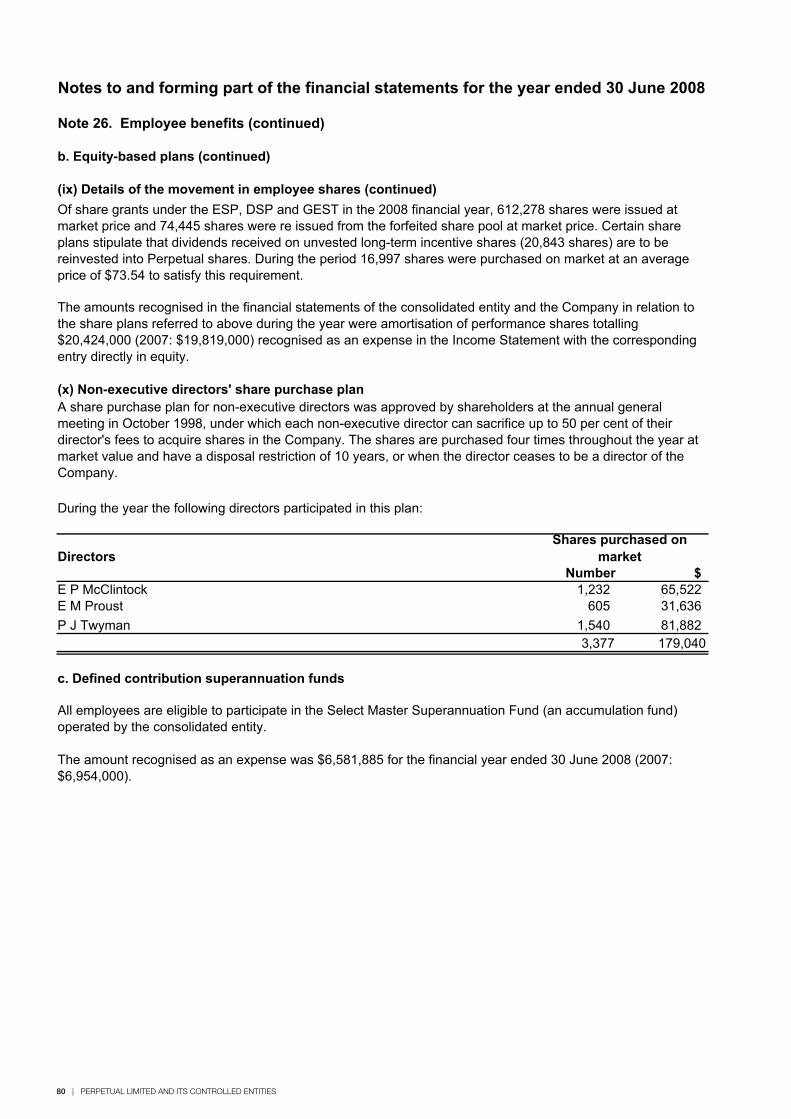
80 | PERPETUAL LIMITED AND ITS CONTROLLED ENTITIES
Notes to and forming part of the financial statements for the year ended 30 June 2008
Note 26. Employee benefits (continued)
b. Equity-based plans (continued)
(ix) Details of the movement in employee shares (continued)
(x) Non-executive directors' share purchase plan
During the year the following directors participated in this plan:
DirectorsNumber $
E P McClintock 1,232 65,522 E M Proust 605 31,636 P J Twyman 1,540 81,882
3,377 179,040
c. Defined contribution superannuation funds
A share purchase plan for non-executive directors was approved by shareholders at the annual general meeting in October 1998, under which each non-executive director can sacrifice up to 50 per cent of their director's fees to acquire shares in the Company. The shares are purchased four times throughout the year at market value and have a disposal restriction of 10 years, or when the director ceases to be a director of the Company.
The amounts recognised in the financial statements of the consolidated entity and the Company in relation to the share plans referred to above during the year were amortisation of performance shares totalling $20,424,000 (2007: $19,819,000) recognised as an expense in the Income Statement with the corresponding entry directly in equity.
Of share grants under the ESP, DSP and GEST in the 2008 financial year, 612,278 shares were issued at market price and 74,445 shares were re issued from the forfeited share pool at market price. Certain share plans stipulate that dividends received on unvested long-term incentive shares (20,843 shares) are to be reinvested into Perpetual shares. During the period 16,997 shares were purchased on market at an average price of $73.54 to satisfy this requirement.
The amount recognised as an expense was $6,581,885 for the financial year ended 30 June 2008 (2007: $6,954,000).
Shares purchased on market
All employees are eligible to participate in the Select Master Superannuation Fund (an accumulation fund) operated by the consolidated entity.
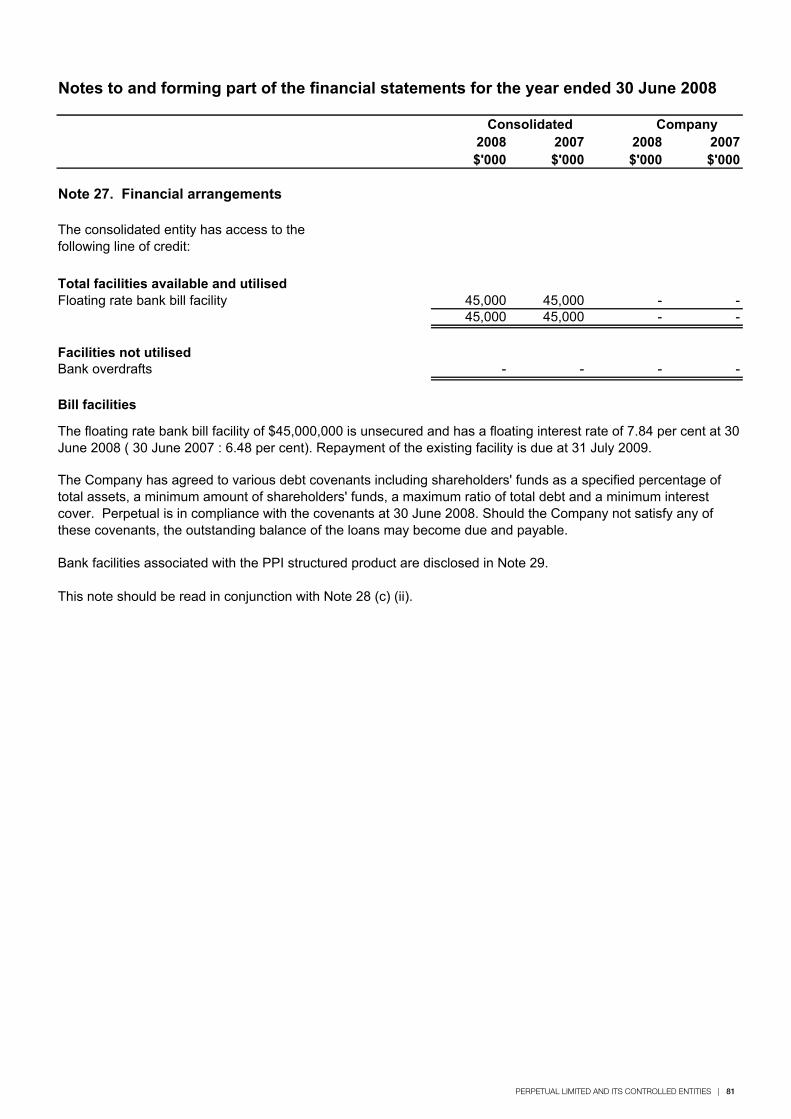
PERPETUAL LIMITED AND ITS CONTROLLED ENTITIES | 81
Notes to and forming part of the financial statements for the year ended 30 June 2008
2008 2007 2008 2007$'000 $'000 $'000 $'000
Note 27. Financial arrangements
Total facilities available and utilisedFloating rate bank bill facility 45,000 45,000 - -
45,000 45,000 - -
Facilities not utilised Bank overdrafts - - - -
Bill facilities
Bank facilities associated with the PPI structured product are disclosed in Note 29.
This note should be read in conjunction with Note 28 (c) (ii).
The Company has agreed to various debt covenants including shareholders' funds as a specified percentage of total assets, a minimum amount of shareholders' funds, a maximum ratio of total debt and a minimum interest cover. Perpetual is in compliance with the covenants at 30 June 2008. Should the Company not satisfy any of these covenants, the outstanding balance of the loans may become due and payable.
Consolidated Company
The consolidated entity has access to the following line of credit:
The floating rate bank bill facility of $45,000,000 is unsecured and has a floating interest rate of 7.84 per cent at 30 June 2008 ( 30 June 2007 : 6.48 per cent). Repayment of the existing facility is due at 31 July 2009.
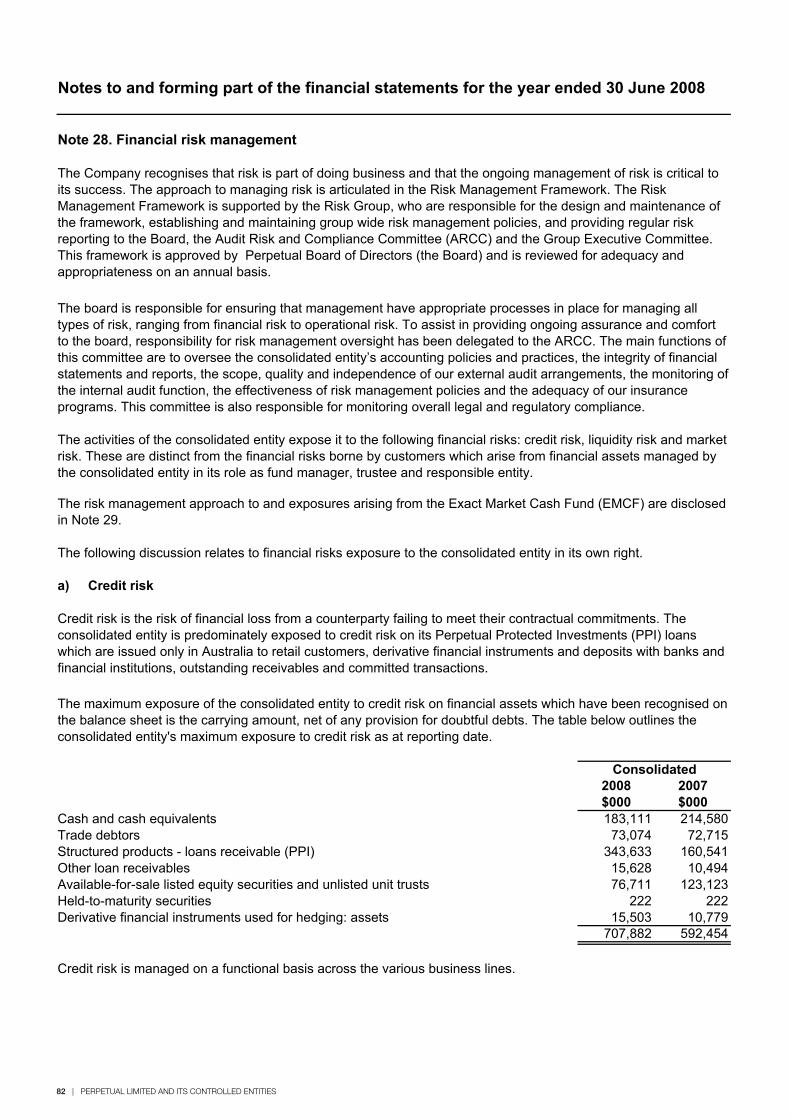
82 | PERPETUAL LIMITED AND ITS CONTROLLED ENTITIES
Notes to and forming part of the financial statements for the year ended 30 June 2008
Note 28. Financial risk management
The following discussion relates to financial risks exposure to the consolidated entity in its own right.
a) Credit risk
2008 2007$000 $000
Cash and cash equivalents 183,111 214,580Trade debtors 73,074 72,715Structured products - loans receivable (PPI) 343,633 160,541Other loan receivables 15,628 10,494Available-for-sale listed equity securities and unlisted unit trusts 76,711 123,123Held-to-maturity securities 222 222Derivative financial instruments used for hedging: assets 15,503 10,779
707,882 592,454
Credit risk is managed on a functional basis across the various business lines.
Consolidated
The Company recognises that risk is part of doing business and that the ongoing management of risk is critical to its success. The approach to managing risk is articulated in the Risk Management Framework. The Risk Management Framework is supported by the Risk Group, who are responsible for the design and maintenance of the framework, establishing and maintaining group wide risk management policies, and providing regular risk reporting to the Board, the Audit Risk and Compliance Committee (ARCC) and the Group Executive Committee. This framework is approved by Perpetual Board of Directors (the Board) and is reviewed for adequacy and appropriateness on an annual basis.
Credit risk is the risk of financial loss from a counterparty failing to meet their contractual commitments. The consolidated entity is predominately exposed to credit risk on its Perpetual Protected Investments (PPI) loans which are issued only in Australia to retail customers, derivative financial instruments and deposits with banks and financial institutions, outstanding receivables and committed transactions.
The maximum exposure of the consolidated entity to credit risk on financial assets which have been recognised on the balance sheet is the carrying amount, net of any provision for doubtful debts. The table below outlines the consolidated entity's maximum exposure to credit risk as at reporting date.
The board is responsible for ensuring that management have appropriate processes in place for managing all types of risk, ranging from financial risk to operational risk. To assist in providing ongoing assurance and comfort to the board, responsibility for risk management oversight has been delegated to the ARCC. The main functions of this committee are to oversee the consolidated entity’s accounting policies and practices, the integrity of financial statements and reports, the scope, quality and independence of our external audit arrangements, the monitoring of the internal audit function, the effectiveness of risk management policies and the adequacy of our insurance programs. This committee is also responsible for monitoring overall legal and regulatory compliance.
The activities of the consolidated entity expose it to the following financial risks: credit risk, liquidity risk and market risk. These are distinct from the financial risks borne by customers which arise from financial assets managed by the consolidated entity in its role as fund manager, trustee and responsible entity.
The risk management approach to and exposures arising from the Exact Market Cash Fund (EMCF) are disclosed in Note 29.
PERPETUAL LIMITED AND ITS CONTROLLED ENTITIES | 83
Notes to and forming part of the financial statements for the year ended 30 June 2008
Note 28 - Financial risk management (continued)
a) Credit risk (continued)
(i) Structured products – Perpetual Protected Investment loans
Officer and recovery initiatives can include litigation if required.
(ii) Investments held by incubation funds
(iii) Other financial assets
Credit risk further arises in relation to financial guarantees given to certain parties (see Note 14(b) for details). Such guarantees are only provided in exceptional circumstances and are subject to specific Board approval and are monitored on a quarterly basis as part of the consolidated entity's regulatory reporting.
Credit risk arising from cash investments are mitigated by ensuring they have a Standard & Poor’s rating of ‘A’ or higher, and transactions involving derivatives are limited to high credit quality financial institutions.
In order to manage the credit risk arising from writing loans to investors in PPI structured product offerings, the consolidated entity has in place a dedicated Credit Office who report to the Chief Risk Officer (CRO). The Credit Office is governed by the Credit Risk Policy which stipulates the criteria that investors are required to meet prior to being granted a loan, and hence ensures that all investors under this arrangement possess the desired level of credit worthiness. The Credit Risk Policy is reviewed annually by the CRO to ensure its continued compliance with the Group’s Risk Management Framework. All loans are secured by the investor’s investment in the product and the consolidated entity has recourse to the investor and the investment in the event of default. A charge over additional collateral is required for loans greater than $2 million. As at 30 June 2008, loans for which Perpetual holds additional collateral is $3.5 million (30 June 2007: $3.5 million). The Credit Office monitors the loan portfolio on a daily basis and provides reports on a monthly basis to Group Finance and the Risk Group for review. Arrears above 45 days are followed up and managed by the Credit
The consolidated entity minimises concentrations of credit risk by imposing a limit on the exposure it can have with each investor. The maximum standard exposure per borrower is set at $1 million. For amounts greater than $1 million, approval from both the CRO and the Chief Financial Officer (CFO) is required.
For an aged analysis of the PPI loans that were past due but not impaired as at the reporting date, refer to Note 28 (a) (iii) Other financial assets below. Further information on the risk management approach to and exposures arising from the PPI structured product offerings is disclosed below in this note and in Note 29.
Perpetual incubates new investment strategies through the establishment of seed funds for the purpose of building investment track records and developing asset management skills before releasing products to Perpetual’s investors. Exposure to credit risk arises on the consolidated entity's financial assets held by the incubation funds mainly being deposits with financial institutions and derivative financial instruments.
The exposure to credit risk is monitored on an ongoing basis by the funds' investment manager and managed in accordance with the investment mandate of the funds.
The consolidated entity's exposure to trade debtors is influenced mainly by the individual characteristic of each customer.
Credit risk is not considered to be significant to the incubation funds as investments held by the funds are predominately equity securities.
Trade debtors are managed by the accounts receivable department. Outstanding fees and receivables are monitored on a daily basis and an aged debtors report is prepared and monitored by Group Finance. Management assesses the credit quality of customers by taking into account their financial position, past experience and other factors.
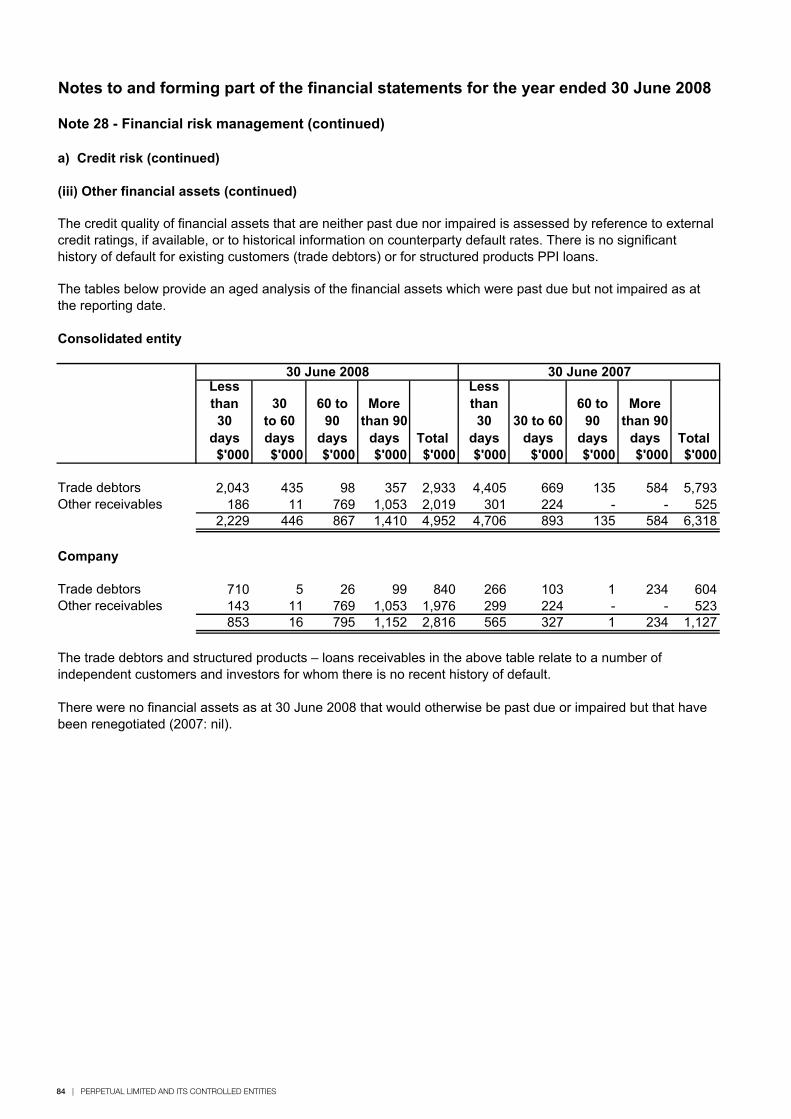
84 | PERPETUAL LIMITED AND ITS CONTROLLED ENTITIES
Notes to and forming part of the financial statements for the year ended 30 June 2008
Note 28 - Financial risk management (continued)
a) Credit risk (continued)
(iii) Other financial assets (continued)
Consolidated entity
Lessthan30
days
30to 60 days
60 to 90
days
Morethan 90
days Total
Lessthan30
days30 to 60
days
60 to 90
days
Morethan 90
days Total$'000 $'000 $'000 $'000 $'000 $'000 $'000 $'000 $'000 $'000
Trade debtors 2,043 435 98 357 2,933 4,405 669 135 584 5,793Other receivables 186 11 769 1,053 2,019 301 224 - - 525
2,229 446 867 1,410 4,952 4,706 893 135 584 6,318
Company
Trade debtors 710 5 26 99 840 266 103 1 234 604Other receivables 143 11 769 1,053 1,976 299 224 - - 523
853 16 795 1,152 2,816 565 327 1 234 1,127
The credit quality of financial assets that are neither past due nor impaired is assessed by reference to external credit ratings, if available, or to historical information on counterparty default rates. There is no significant history of default for existing customers (trade debtors) or for structured products PPI loans.
The trade debtors and structured products – loans receivables in the above table relate to a number of independent customers and investors for whom there is no recent history of default.
There were no financial assets as at 30 June 2008 that would otherwise be past due or impaired but that have been renegotiated (2007: nil).
The tables below provide an aged analysis of the financial assets which were past due but not impaired as at the reporting date.
30 June 2008 30 June 2007
PERPETUAL LIMITED AND ITS CONTROLLED ENTITIES | 85
Notes to and forming part of the financial statements for the year ended 30 June 2008
Note 28 - Financial risk management (continued)
(iii) Other financial assets (continued)
The nominal values of financial assets which were impaired are as follows:
Trade debtors
b) Liquidity risk
Maturities of financial liabilities
The tables below show the maturity profiles of the financial liabilities and gross settled derivative financial instruments for the consolidated entity and the Company. These have been calculated using the contractual undiscounted cash flows, with the exception of the interest rate swaps whose cash flows have been estimated using the current interest rates applicable at the reporting date.
Liquidity risk is the risk that the consolidated entity will not be able to meet its financial obligations as they fall due. The consolidated entity’s approach to managing liquidity is to maintain a level of cash or liquid investments sufficient to meet its ongoing financial obligations. The consolidated entity has a robust liquidity risk framework in place which is principally driven by the Capital Management Review (refer to capital management disclosed below in Note 28 (d) for further details).
The consolidated entity manages liquidity risk by continually monitoring forecast and actual cash flows, and by matching the maturity profiles of financial assets and liabilities. Surplus funds are generally only invested in instruments that are tradeable in highly liquid markets. In addition, a three year forecast of liquid assets, cash flows and balance sheet is reviewed by the Board on a semi-annual basis as part of the Capital Management Review to ensure there is sufficient liquidity within the Group.
The consolidated entity does not have any undrawn facilities at year end. The repayment of the existing facility of $45 million (refer to Note 27) is due on 31 July 2009. Management intends to refinance this facility for a further period after the due date.
The impaired financial assets relate mainly to independent customers and investors who are in unexpectedly difficult economic situations, where the consolidated entity is of the view that the receivable cannot be recovered. The consolidated entity does not hold any collateral against the trade debtors. Collateral held in respect of PPI loans is discussed in Note 28 (a)(i) above. For details of the provisions for impairment refer to Notes 13 and 29.
$'000 $'000 $'000 $'00089 85 89 85
Consolidated Company2008 2007 2008 2007
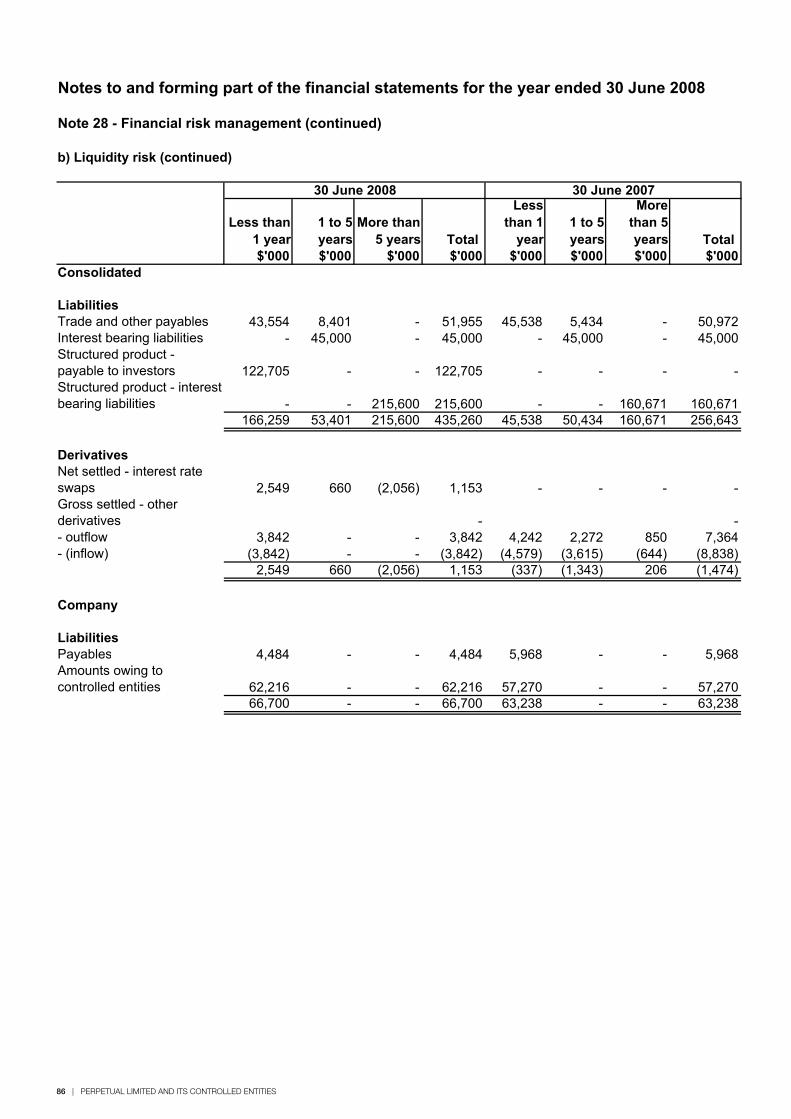
86 | PERPETUAL LIMITED AND ITS CONTROLLED ENTITIES
Notes to and forming part of the financial statements for the year ended 30 June 2008
Note 28 - Financial risk management (continued)
b) Liquidity risk (continued)
Less than 1 year
1 to 5 years
More than 5 years Total
Lessthan 1
year1 to 5 years
Morethan 5 years Total
$'000 $'000 $'000 $'000 $'000 $'000 $'000 $'000Consolidated
LiabilitiesTrade and other payables 43,554 8,401 - 51,955 45,538 5,434 - 50,972Interest bearing liabilities - 45,000 - 45,000 - 45,000 - 45,000Structured product - payable to investors 122,705 - - 122,705 - - - -Structured product - interest bearing liabilities - - 215,600 215,600 - - 160,671 160,671
166,259 53,401 215,600 435,260 45,538 50,434 160,671 256,643
DerivativesNet settled - interest rate swaps 2,549 660 (2,056) 1,153 - - - -Gross settled - other derivatives - -- outflow 3,842 - - 3,842 4,242 2,272 850 7,364- (inflow) (3,842) - - (3,842) (4,579) (3,615) (644) (8,838)
2,549 660 (2,056) 1,153 (337) (1,343) 206 (1,474)
Company
LiabilitiesPayables 4,484 - - 4,484 5,968 - - 5,968Amounts owing to controlled entities 62,216 - - 62,216 57,270 - - 57,270
66,700 - - 66,700 63,238 - - 63,238
30 June 2008 30 June 2007
PERPETUAL LIMITED AND ITS CONTROLLED ENTITIES | 87
Notes to and forming part of the financial statements for the year ended 30 June 2008
Note 28 - Financial risk management (continued)
c) Market risk
(i) Currency risk
(ii) Interest rate risk
(a) Fixed rate assets being financed with floating rate liabilities; and(a) Maturity or duration mismatches.
The consolidated entity is subject to the following market risks:
Investments held in listed securities and unlisted unit trusts including incubation funds are of a non-monetary nature and therefore are not exposed to currency risk as defined in AASB 7 Financial Instruments: Disclosures .The currency risk relating to non-monetary assets and liabilities is a component of price risk and arises as the value of the securities denominated in other currencies fluctuate with changes in exchange rates.
In order to manage the interest rate risk relating to PPI structured products, it is the consolidated entity’s policy to hedge at least 95 per cent of its loan exposure by entering into floating-to-fixed interest rate swaps. The hedging of interest rate exposure is managed by Group Finance and is monitored by the Audit Risk and Compliance Committee on a quarterly basis.
The exposure to currency risk, as defined in AASB 7 Financial Instruments: Disclosures , arises when financial instruments are denominated in a currency that is not the functional currency and are of a monetary nature. Hence the gains/(losses) arising from the translation of the controlled entities’ financial statements into Australian dollars are not considered in this note.
A significant proportion of the monetary financial instruments held by the consolidated entity, being liquid assets, receivables, loans receivables, interest-bearing liabilities and payables, interest rate swaps, are denominated in Australian dollars. Hence fluctuations in exchange rates do not materially impact the profit/(loss) for the year or shareholders' equity.
PPI structured product loans bear interest rates which are either fixed for the term of the product (7 years), fixed annually or variable. The consolidated entity has entered into variable rate banking facilities in order to finance loans provided to investors as a result exposure to interest rate risk arises from:
Interest rate risk is the risk that the fair value or future cash flows of a financial instrument will fluctuate because of changes in market interest rates. The consolidated entity's exposure to interest rate risk arises predominately on investors loans granted under the PPI structured product offering.
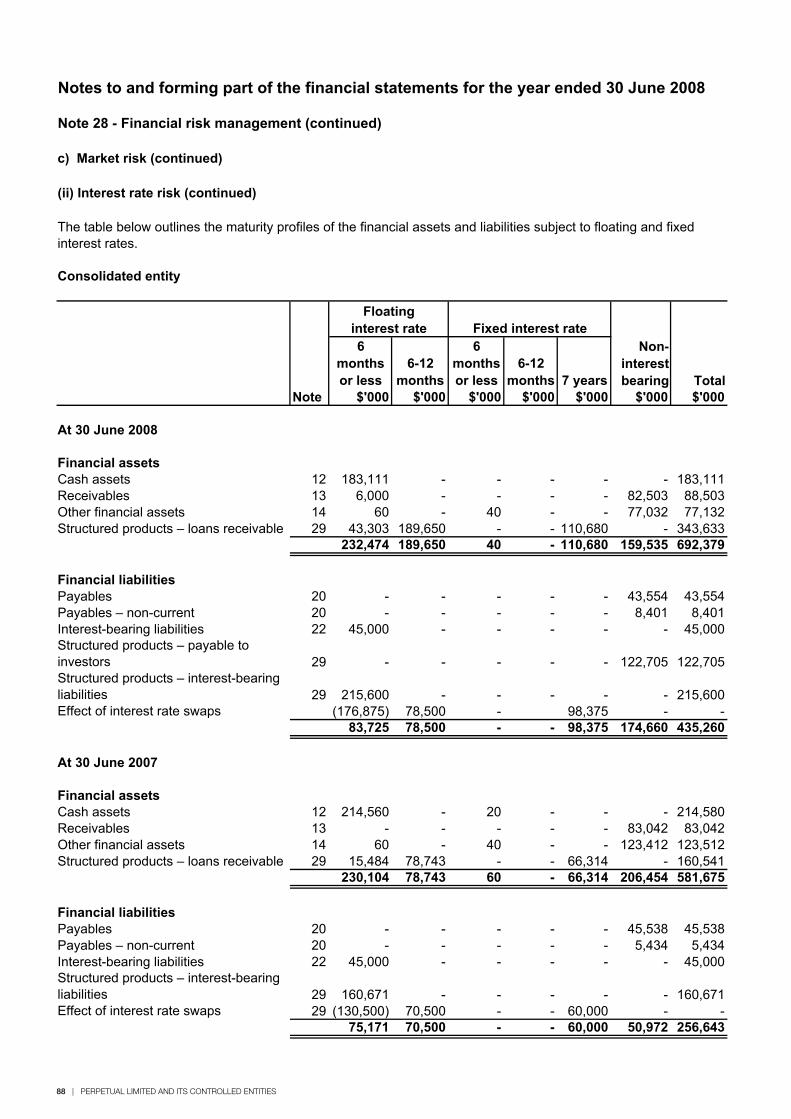
88 | PERPETUAL LIMITED AND ITS CONTROLLED ENTITIES
Notes to and forming part of the financial statements for the year ended 30 June 2008
Note 28 - Financial risk management (continued)
c) Market risk (continued)
(ii) Interest rate risk (continued)
Consolidated entity
6monthsor less
6-12months
6monthsor less
6-12months 7 years
Note $'000 $'000 $'000 $'000 $'000 $'000 $'000
At 30 June 2008
Financial assetsCash assets 12 183,111 - - - - - 183,111Receivables 13 6,000 - - - - 82,503 88,503Other financial assets 14 60 - 40 - - 77,032 77,132Structured products – loans receivable 29 43,303 189,650 - - 110,680 - 343,633
232,474 189,650 40 - 110,680 159,535 692,379
Financial liabilitiesPayables 20 - - - - - 43,554 43,554Payables – non-current 20 - - - - - 8,401 8,401Interest-bearing liabilities 22 45,000 - - - - - 45,000Structured products – payable to investors 29 - - - - - 122,705 122,705Structured products – interest-bearing liabilities 29 215,600 - - - - - 215,600Effect of interest rate swaps (176,875) 78,500 - 98,375 - -
83,725 78,500 - - 98,375 174,660 435,260
At 30 June 2007
Financial assetsCash assets 12 214,560 - 20 - - - 214,580Receivables 13 - - - - - 83,042 83,042Other financial assets 14 60 - 40 - - 123,412 123,512Structured products – loans receivable 29 15,484 78,743 - - 66,314 - 160,541
230,104 78,743 60 - 66,314 206,454 581,675
Financial liabilitiesPayables 20 - - - - - 45,538 45,538Payables – non-current 20 - - - - - 5,434 5,434Interest-bearing liabilities 22 45,000 - - - - - 45,000Structured products – interest-bearing liabilities 29 160,671 - - - - - 160,671Effect of interest rate swaps 29 (130,500) 70,500 - - 60,000 - -
75,171 70,500 - - 60,000 50,972 256,643
Fixed interest rateFloating
interest rate
The table below outlines the maturity profiles of the financial assets and liabilities subject to floating and fixed interest rates.
Total
Non-interestbearing
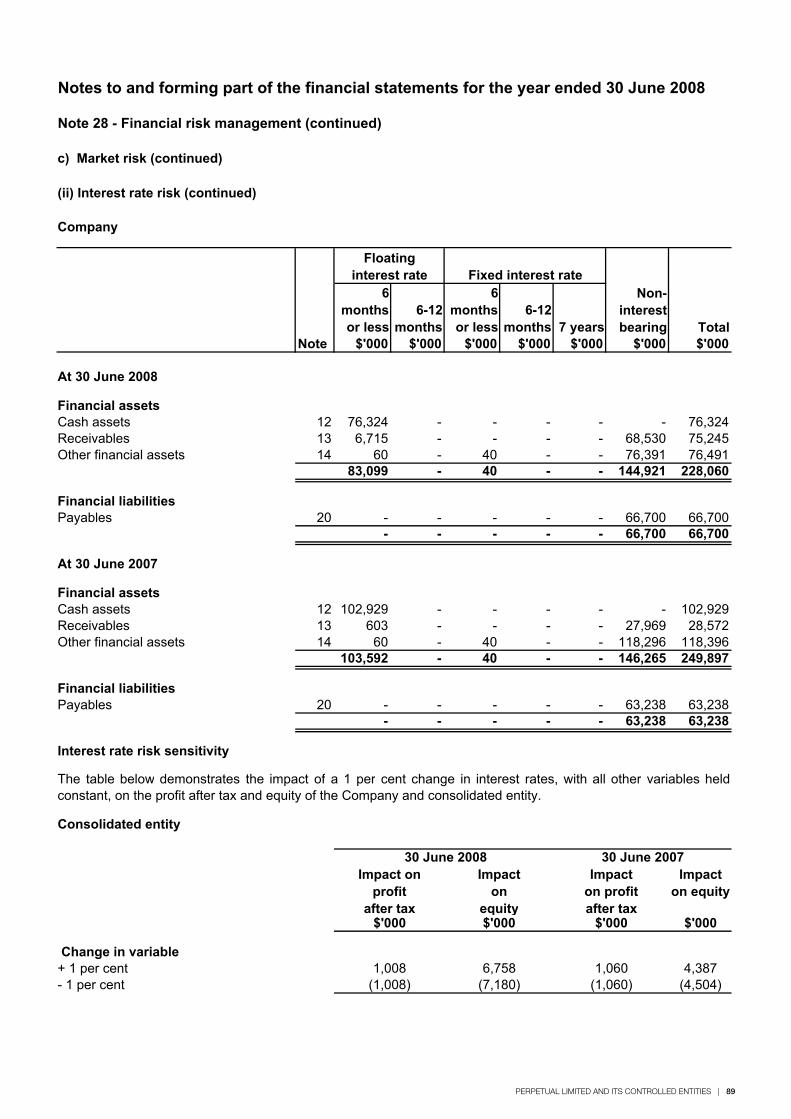
PERPETUAL LIMITED AND ITS CONTROLLED ENTITIES | 89
Notes to and forming part of the financial statements for the year ended 30 June 2008
Note 28 - Financial risk management (continued)
c) Market risk (continued)
(ii) Interest rate risk (continued)
6monthsor less
6-12months
6monthsor less
6-12months 7 years
Note $'000 $'000 $'000 $'000 $'000 $'000 $'000
At 30 June 2008
Financial assetsCash assets 12 76,324 - - - - - 76,324Receivables 13 6,715 - - - - 68,530 75,245Other financial assets 14 60 - 40 - - 76,391 76,491
83,099 - 40 - - 144,921 228,060
Financial liabilitiesPayables 20 - - - - - 66,700 66,700
- - - - - 66,700 66,700
At 30 June 2007
Financial assetsCash assets 12 102,929 - - - - - 102,929Receivables 13 603 - - - - 27,969 28,572Other financial assets 14 60 - 40 - - 118,296 118,396
103,592 - 40 - - 146,265 249,897
Financial liabilitiesPayables 20 - - - - - 63,238 63,238
- - - - - 63,238 63,238
Interest rate risk sensitivity
Consolidated entity
Impacton equity
$'000
Change in variable+ 1 per cent 4,387- 1 per cent (4,504)
Impact on profit
after tax$'000
30 June 2008Impact
on profit after tax
$'000
30 June 2007Impact
onequity$'000
The table below demonstrates the impact of a 1 per cent change in interest rates, with all other variables heldconstant, on the profit after tax and equity of the Company and consolidated entity.
Fixed interest rateFloating
interest rate
Company
Total
Non-interestbearing
1,060(1,060)
1,008(1,008)
6,758(7,180)
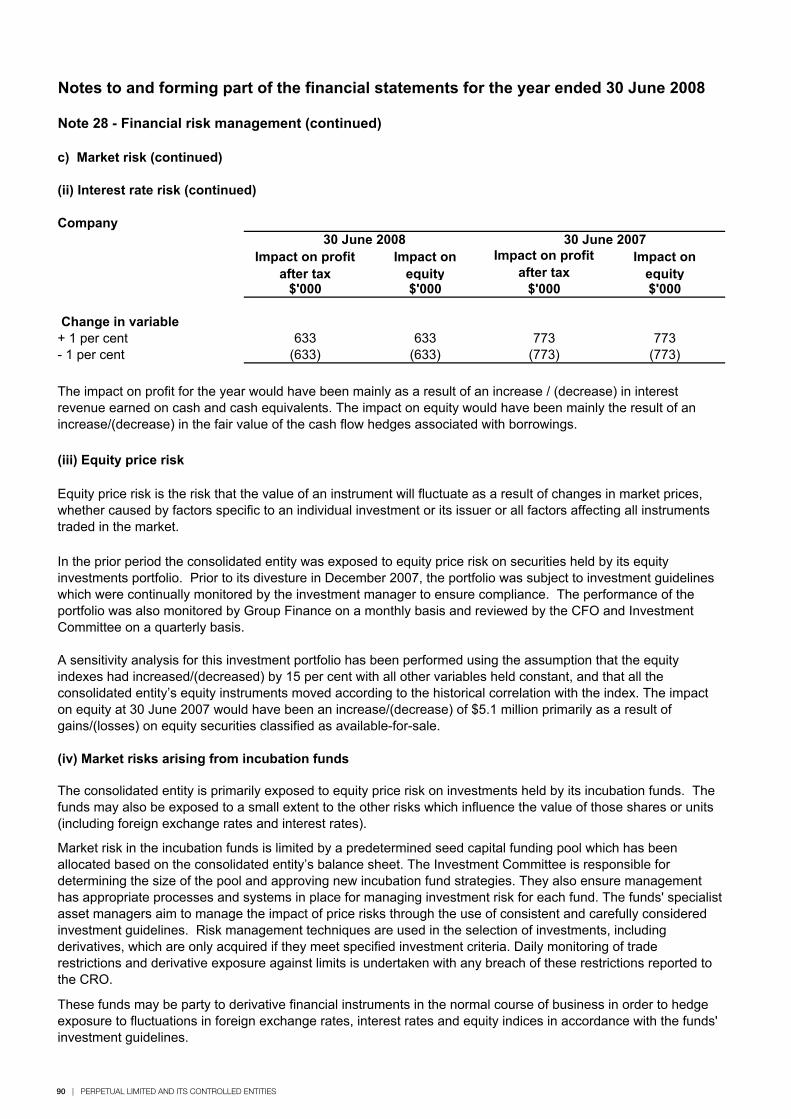
90 | PERPETUAL LIMITED AND ITS CONTROLLED ENTITIES
Notes to and forming part of the financial statements for the year ended 30 June 2008
Note 28 - Financial risk management (continued)
c) Market risk (continued)
(ii) Interest rate risk (continued)
Company
Change in variable+ 1 per cent- 1 per cent
(iii) Equity price risk
(iv) Market risks arising from incubation funds
$'000
A sensitivity analysis for this investment portfolio has been performed using the assumption that the equity indexes had increased/(decreased) by 15 per cent with all other variables held constant, and that all the consolidated entity’s equity instruments moved according to the historical correlation with the index. The impact on equity at 30 June 2007 would have been an increase/(decrease) of $5.1 million primarily as a result of gains/(losses) on equity securities classified as available-for-sale.
The consolidated entity is primarily exposed to equity price risk on investments held by its incubation funds. The funds may also be exposed to a small extent to the other risks which influence the value of those shares or units (including foreign exchange rates and interest rates).
Market risk in the incubation funds is limited by a predetermined seed capital funding pool which has been allocated based on the consolidated entity’s balance sheet. The Investment Committee is responsible for determining the size of the pool and approving new incubation fund strategies. They also ensure management has appropriate processes and systems in place for managing investment risk for each fund. The funds' specialist asset managers aim to manage the impact of price risks through the use of consistent and carefully considered investment guidelines. Risk management techniques are used in the selection of investments, including derivatives, which are only acquired if they meet specified investment criteria. Daily monitoring of trade restrictions and derivative exposure against limits is undertaken with any breach of these restrictions reported to the CRO.
The impact on profit for the year would have been mainly as a result of an increase / (decrease) in interest revenue earned on cash and cash equivalents. The impact on equity would have been mainly the result of an increase/(decrease) in the fair value of the cash flow hedges associated with borrowings.
In the prior period the consolidated entity was exposed to equity price risk on securities held by its equity investments portfolio. Prior to its divesture in December 2007, the portfolio was subject to investment guidelines which were continually monitored by the investment manager to ensure compliance. The performance of the portfolio was also monitored by Group Finance on a monthly basis and reviewed by the CFO and Investment Committee on a quarterly basis.
Equity price risk is the risk that the value of an instrument will fluctuate as a result of changes in market prices, whether caused by factors specific to an individual investment or its issuer or all factors affecting all instruments traded in the market.
633(633)
These funds may be party to derivative financial instruments in the normal course of business in order to hedge exposure to fluctuations in foreign exchange rates, interest rates and equity indices in accordance with the funds' investment guidelines.
30 June 2007Impact on
equity$'000
Impact on profit after tax
$'000
30 June 2008Impact on
equity$'000
Impact on profit after tax
773(773)
633(633)
773(773)
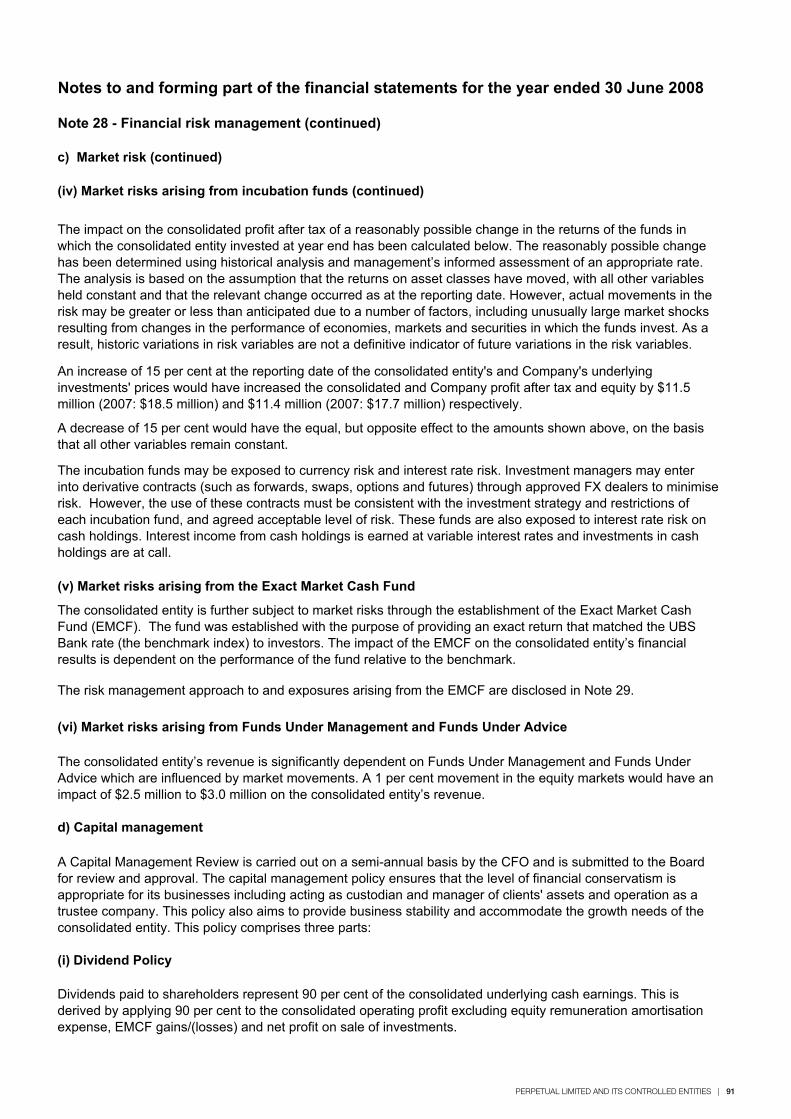
PERPETUAL LIMITED AND ITS CONTROLLED ENTITIES | 91
Notes to and forming part of the financial statements for the year ended 30 June 2008
Note 28 - Financial risk management (continued)
c) Market risk (continued)
(iv) Market risks arising from incubation funds (continued)
(v) Market risks arising from the Exact Market Cash Fund
(vi) Market risks arising from Funds Under Management and Funds Under Advice
d) Capital management
(i) Dividend Policy
Dividends paid to shareholders represent 90 per cent of the consolidated underlying cash earnings. This is derived by applying 90 per cent to the consolidated operating profit excluding equity remuneration amortisation expense, EMCF gains/(losses) and net profit on sale of investments.
A decrease of 15 per cent would have the equal, but opposite effect to the amounts shown above, on the basis that all other variables remain constant.
The consolidated entity’s revenue is significantly dependent on Funds Under Management and Funds Under Advice which are influenced by market movements. A 1 per cent movement in the equity markets would have an impact of $2.5 million to $3.0 million on the consolidated entity’s revenue.
The impact on the consolidated profit after tax of a reasonably possible change in the returns of the funds in which the consolidated entity invested at year end has been calculated below. The reasonably possible change has been determined using historical analysis and management’s informed assessment of an appropriate rate. The analysis is based on the assumption that the returns on asset classes have moved, with all other variables held constant and that the relevant change occurred as at the reporting date. However, actual movements in the risk may be greater or less than anticipated due to a number of factors, including unusually large market shocks resulting from changes in the performance of economies, markets and securities in which the funds invest. As a result, historic variations in risk variables are not a definitive indicator of future variations in the risk variables.
The incubation funds may be exposed to currency risk and interest rate risk. Investment managers may enter into derivative contracts (such as forwards, swaps, options and futures) through approved FX dealers to minimise risk. However, the use of these contracts must be consistent with the investment strategy and restrictions of each incubation fund, and agreed acceptable level of risk. These funds are also exposed to interest rate risk on cash holdings. Interest income from cash holdings is earned at variable interest rates and investments in cash holdings are at call.
An increase of 15 per cent at the reporting date of the consolidated entity's and Company's underlying investments' prices would have increased the consolidated and Company profit after tax and equity by $11.5 million (2007: $18.5 million) and $11.4 million (2007: $17.7 million) respectively.
A Capital Management Review is carried out on a semi-annual basis by the CFO and is submitted to the Board for review and approval. The capital management policy ensures that the level of financial conservatism is appropriate for its businesses including acting as custodian and manager of clients' assets and operation as a trustee company. This policy also aims to provide business stability and accommodate the growth needs of the consolidated entity. This policy comprises three parts:
The consolidated entity is further subject to market risks through the establishment of the Exact Market Cash Fund (EMCF). The fund was established with the purpose of providing an exact return that matched the UBS Bank rate (the benchmark index) to investors. The impact of the EMCF on the consolidated entity’s financial results is dependent on the performance of the fund relative to the benchmark.
The risk management approach to and exposures arising from the EMCF are disclosed in Note 29.
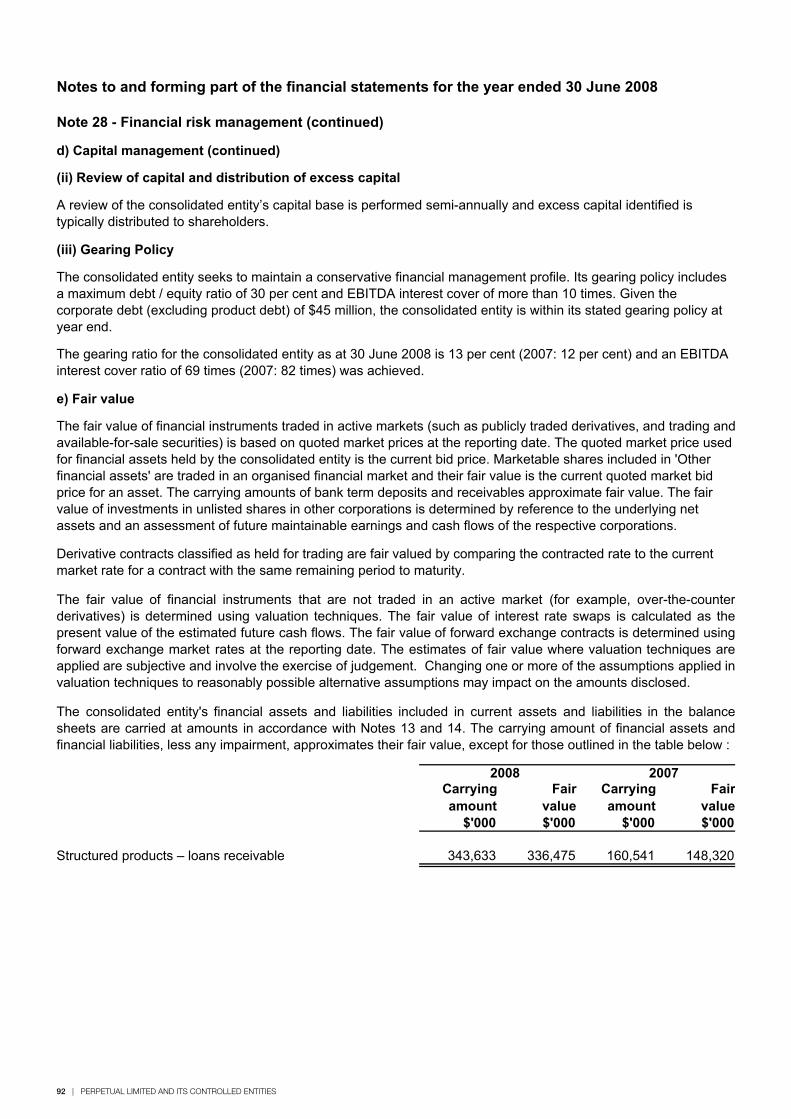
92 | PERPETUAL LIMITED AND ITS CONTROLLED ENTITIES
Note 28 - Financial risk management (continued)
d) Capital management (continued)
(ii) Review of capital and distribution of excess capital
(iii) Gearing Policy
e) Fair value
Carryingamount
Fairvalue
Carryingamount
Fairvalue
$'000 $'000 $'000 $'000
Structured products – loans receivable 343,633 336,475 160,541 148,320
Notes to and forming part of the financial statements for the year ended 30 June 2008
The consolidated entity seeks to maintain a conservative financial management profile. Its gearing policy includes a maximum debt / equity ratio of 30 per cent and EBITDA interest cover of more than 10 times. Given the corporate debt (excluding product debt) of $45 million, the consolidated entity is within its stated gearing policy at year end.
Derivative contracts classified as held for trading are fair valued by comparing the contracted rate to the current market rate for a contract with the same remaining period to maturity.
The gearing ratio for the consolidated entity as at 30 June 2008 is 13 per cent (2007: 12 per cent) and an EBITDA interest cover ratio of 69 times (2007: 82 times) was achieved.
The fair value of financial instruments traded in active markets (such as publicly traded derivatives, and trading and available-for-sale securities) is based on quoted market prices at the reporting date. The quoted market price used for financial assets held by the consolidated entity is the current bid price. Marketable shares included in 'Other financial assets' are traded in an organised financial market and their fair value is the current quoted market bid price for an asset. The carrying amounts of bank term deposits and receivables approximate fair value. The fair value of investments in unlisted shares in other corporations is determined by reference to the underlying net assets and an assessment of future maintainable earnings and cash flows of the respective corporations.
A review of the consolidated entity’s capital base is performed semi-annually and excess capital identified is typically distributed to shareholders.
The fair value of financial instruments that are not traded in an active market (for example, over-the-counterderivatives) is determined using valuation techniques. The fair value of interest rate swaps is calculated as thepresent value of the estimated future cash flows. The fair value of forward exchange contracts is determined usingforward exchange market rates at the reporting date. The estimates of fair value where valuation techniques areapplied are subjective and involve the exercise of judgement. Changing one or more of the assumptions applied invaluation techniques to reasonably possible alternative assumptions may impact on the amounts disclosed.
The consolidated entity's financial assets and liabilities included in current assets and liabilities in the balancesheets are carried at amounts in accordance with Notes 13 and 14. The carrying amount of financial assets andfinancial liabilities, less any impairment, approximates their fair value, except for those outlined in the table below :
2008 2007
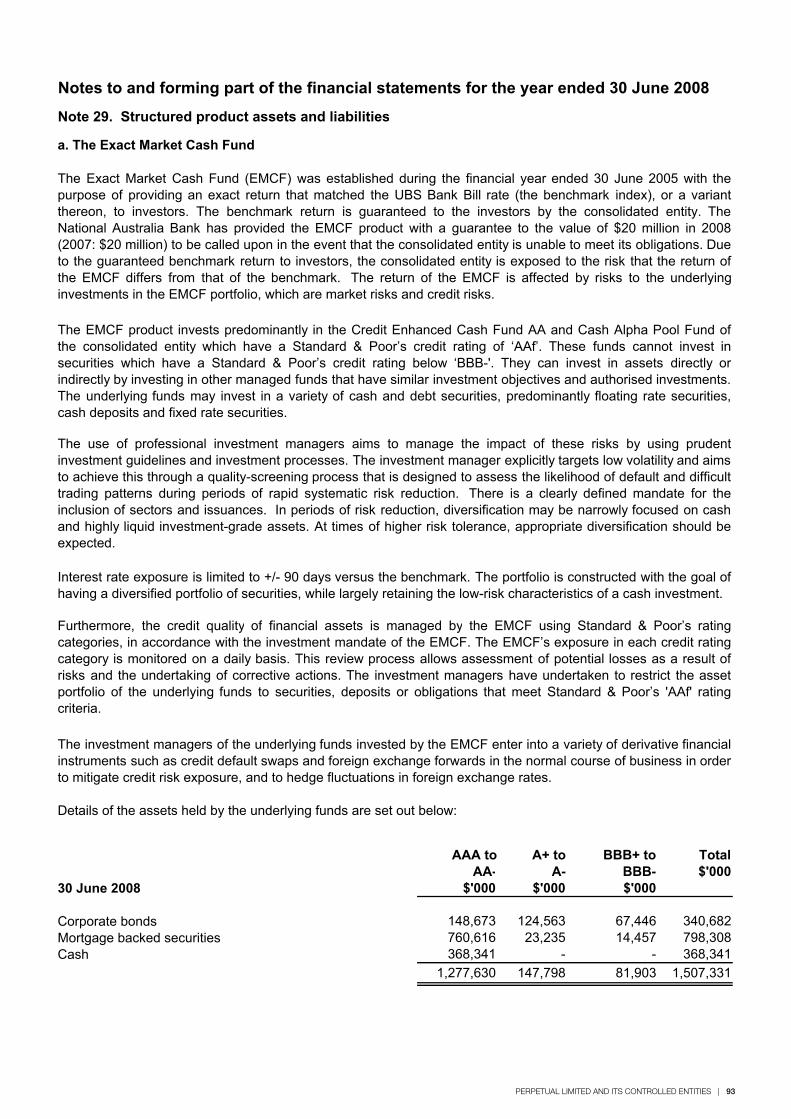
PERPETUAL LIMITED AND ITS CONTROLLED ENTITIES | 93
Note 29. Structured product assets and liabilities
a. The Exact Market Cash Fund
Details of the assets held by the underlying funds are set out below:
AAA to A+ to BBB+ to TotalAA- A- BBB- $'000
$'000 $'000 $'000
Corporate bonds 148,673 124,563 67,446 340,682 Mortgage backed securities 760,616 23,235 14,457 798,308 Cash 368,341 - - 368,341
1,277,630 147,798 81,903 1,507,331
Notes to and forming part of the financial statements for the year ended 30 June 2008
Interest rate exposure is limited to +/- 90 days versus the benchmark. The portfolio is constructed with the goal ofhaving a diversified portfolio of securities, while largely retaining the low-risk characteristics of a cash investment.
The Exact Market Cash Fund (EMCF) was established during the financial year ended 30 June 2005 with thepurpose of providing an exact return that matched the UBS Bank Bill rate (the benchmark index), or a variantthereon, to investors. The benchmark return is guaranteed to the investors by the consolidated entity. TheNational Australia Bank has provided the EMCF product with a guarantee to the value of $20 million in 2008(2007: $20 million) to be called upon in the event that the consolidated entity is unable to meet its obligations. Dueto the guaranteed benchmark return to investors, the consolidated entity is exposed to the risk that the return ofthe EMCF differs from that of the benchmark. The return of the EMCF is affected by risks to the underlyinginvestments in the EMCF portfolio, which are market risks and credit risks.
The EMCF product invests predominantly in the Credit Enhanced Cash Fund AA and Cash Alpha Pool Fund ofthe consolidated entity which have a Standard & Poor’s credit rating of ‘AAf’. These funds cannot invest insecurities which have a Standard & Poor’s credit rating below ‘BBB-'. They can invest in assets directly orindirectly by investing in other managed funds that have similar investment objectives and authorised investments.The underlying funds may invest in a variety of cash and debt securities, predominantly floating rate securities,cash deposits and fixed rate securities.
The use of professional investment managers aims to manage the impact of these risks by using prudentinvestment guidelines and investment processes. The investment manager explicitly targets low volatility and aimsto achieve this through a quality-screening process that is designed to assess the likelihood of default and difficulttrading patterns during periods of rapid systematic risk reduction. There is a clearly defined mandate for theinclusion of sectors and issuances. In periods of risk reduction, diversification may be narrowly focused on cashand highly liquid investment-grade assets. At times of higher risk tolerance, appropriate diversification should beexpected.
The investment managers of the underlying funds invested by the EMCF enter into a variety of derivative financialinstruments such as credit default swaps and foreign exchange forwards in the normal course of business in orderto mitigate credit risk exposure, and to hedge fluctuations in foreign exchange rates.
Furthermore, the credit quality of financial assets is managed by the EMCF using Standard & Poor’s ratingcategories, in accordance with the investment mandate of the EMCF. The EMCF’s exposure in each credit ratingcategory is monitored on a daily basis. This review process allows assessment of potential losses as a result ofrisks and the undertaking of corrective actions. The investment managers have undertaken to restrict the assetportfolio of the underlying funds to securities, deposits or obligations that meet Standard & Poor’s 'AAf' ratingcriteria.
30 June 2008
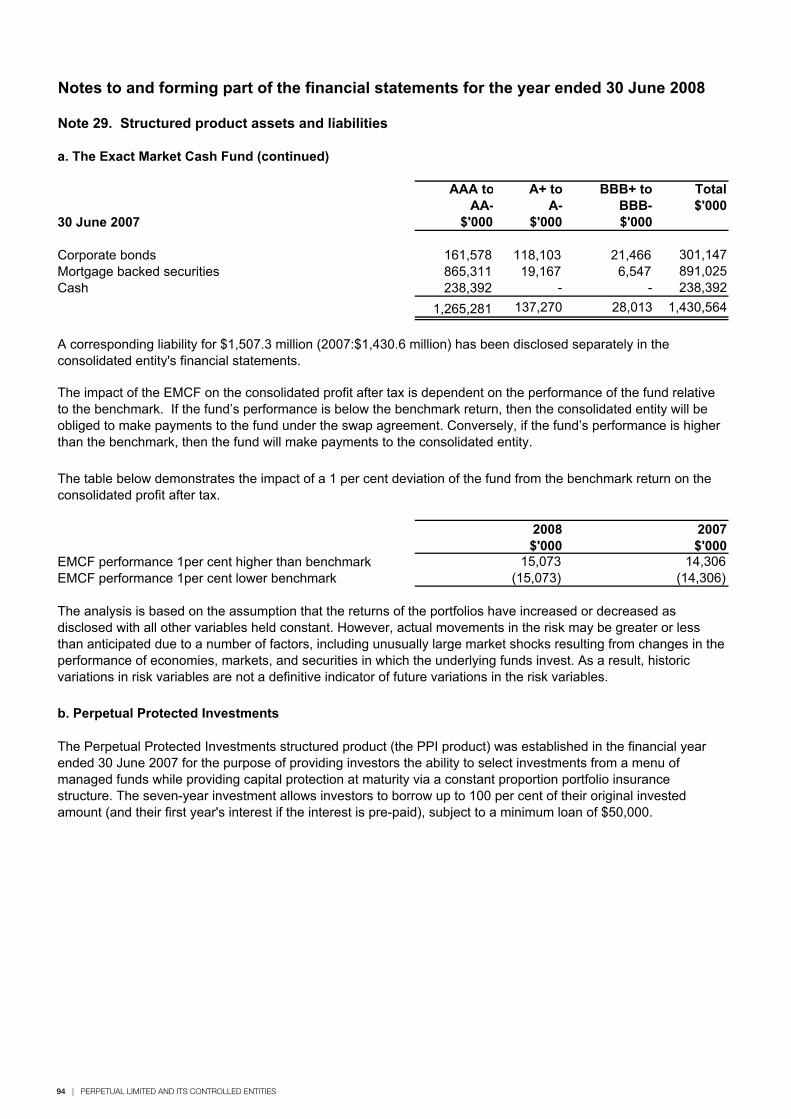
94 | PERPETUAL LIMITED AND ITS CONTROLLED ENTITIES
Note 29. Structured product assets and liabilities
a. The Exact Market Cash Fund (continued)
AAA to A+ to BBB+ to TotalAA- A- BBB- $'000
$'000 $'000 $'000
Corporate bonds 161,578 118,103 21,466 301,147Mortgage backed securities 865,311 19,167 6,547 891,025Cash 238,392 - - 238,392
1,265,281 137,270 28,013 1,430,564
EMCF performance 1per cent higher than benchmarkEMCF performance 1per cent lower benchmark
b. Perpetual Protected Investments
The analysis is based on the assumption that the returns of the portfolios have increased or decreased as disclosed with all other variables held constant. However, actual movements in the risk may be greater or less than anticipated due to a number of factors, including unusually large market shocks resulting from changes in the performance of economies, markets, and securities in which the underlying funds invest. As a result, historic variations in risk variables are not a definitive indicator of future variations in the risk variables.
The Perpetual Protected Investments structured product (the PPI product) was established in the financial year ended 30 June 2007 for the purpose of providing investors the ability to select investments from a menu of managed funds while providing capital protection at maturity via a constant proportion portfolio insurance structure. The seven-year investment allows investors to borrow up to 100 per cent of their original invested amount (and their first year's interest if the interest is pre-paid), subject to a minimum loan of $50,000.
15,073 14,306(15,073) (14,306)
$'000 $'000
Notes to and forming part of the financial statements for the year ended 30 June 2008
The impact of the EMCF on the consolidated profit after tax is dependent on the performance of the fund relative to the benchmark. If the fund’s performance is below the benchmark return, then the consolidated entity will be obliged to make payments to the fund under the swap agreement. Conversely, if the fund’s performance is higher than the benchmark, then the fund will make payments to the consolidated entity.
2008 2007
The table below demonstrates the impact of a 1 per cent deviation of the fund from the benchmark return on the consolidated profit after tax.
30 June 2007
A corresponding liability for $1,507.3 million (2007:$1,430.6 million) has been disclosed separately in the consolidated entity's financial statements.
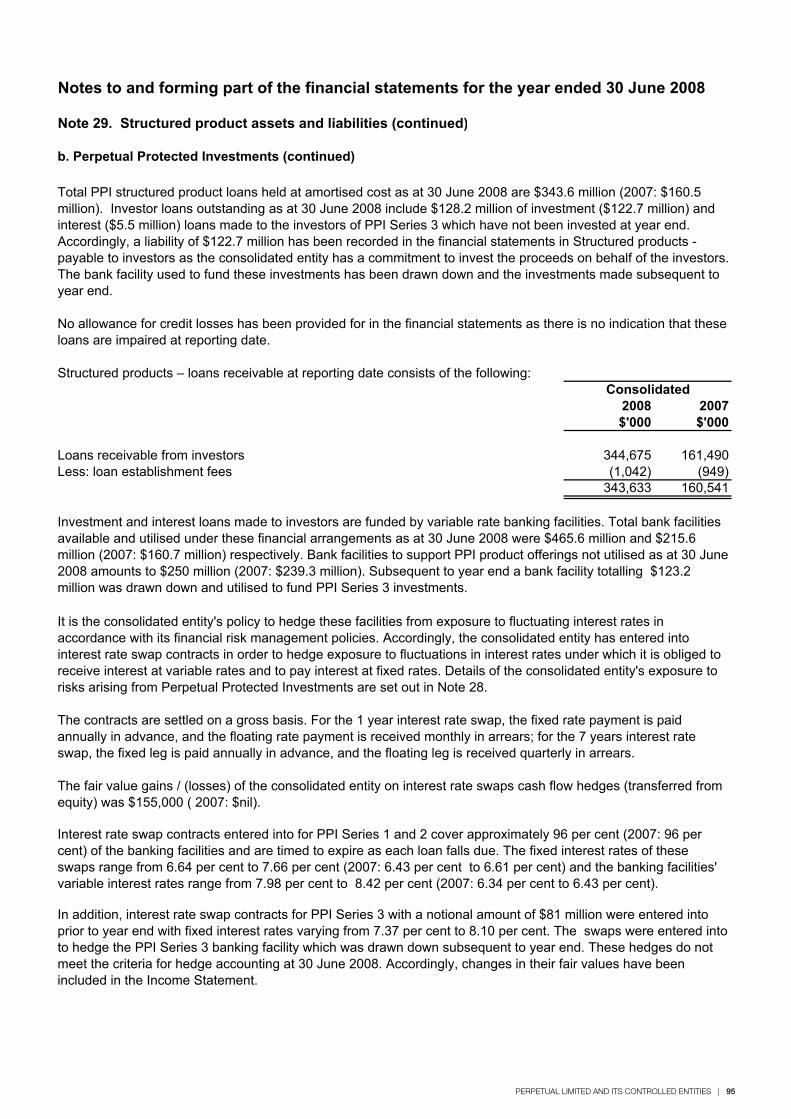
PERPETUAL LIMITED AND ITS CONTROLLED ENTITIES | 95
Note 29. Structured product assets and liabilities (continued)
b. Perpetual Protected Investments (continued)
Structured products – loans receivable at reporting date consists of the following:
2008 2007$'000 $'000
Loans receivable from investors 344,675 161,490Less: loan establishment fees (1,042) (949)
343,633 160,541
Notes to and forming part of the financial statements for the year ended 30 June 2008
It is the consolidated entity's policy to hedge these facilities from exposure to fluctuating interest rates in accordance with its financial risk management policies. Accordingly, the consolidated entity has entered into interest rate swap contracts in order to hedge exposure to fluctuations in interest rates under which it is obliged to receive interest at variable rates and to pay interest at fixed rates. Details of the consolidated entity's exposure to risks arising from Perpetual Protected Investments are set out in Note 28.
Consolidated
Total PPI structured product loans held at amortised cost as at 30 June 2008 are $343.6 million (2007: $160.5 million). Investor loans outstanding as at 30 June 2008 include $128.2 million of investment ($122.7 million) and interest ($5.5 million) loans made to the investors of PPI Series 3 which have not been invested at year end. Accordingly, a liability of $122.7 million has been recorded in the financial statements in Structured products - payable to investors as the consolidated entity has a commitment to invest the proceeds on behalf of the investors. The bank facility used to fund these investments has been drawn down and the investments made subsequent to year end.
Investment and interest loans made to investors are funded by variable rate banking facilities. Total bank facilities available and utilised under these financial arrangements as at 30 June 2008 were $465.6 million and $215.6 million (2007: $160.7 million) respectively. Bank facilities to support PPI product offerings not utilised as at 30 June 2008 amounts to $250 million (2007: $239.3 million). Subsequent to year end a bank facility totalling $123.2 million was drawn down and utilised to fund PPI Series 3 investments.
No allowance for credit losses has been provided for in the financial statements as there is no indication that these loans are impaired at reporting date.
Interest rate swap contracts entered into for PPI Series 1 and 2 cover approximately 96 per cent (2007: 96 per cent) of the banking facilities and are timed to expire as each loan falls due. The fixed interest rates of these swaps range from 6.64 per cent to 7.66 per cent (2007: 6.43 per cent to 6.61 per cent) and the banking facilities' variable interest rates range from 7.98 per cent to 8.42 per cent (2007: 6.34 per cent to 6.43 per cent).
In addition, interest rate swap contracts for PPI Series 3 with a notional amount of $81 million were entered into prior to year end with fixed interest rates varying from 7.37 per cent to 8.10 per cent. The swaps were entered into to hedge the PPI Series 3 banking facility which was drawn down subsequent to year end. These hedges do not meet the criteria for hedge accounting at 30 June 2008. Accordingly, changes in their fair values have been included in the Income Statement.
The contracts are settled on a gross basis. For the 1 year interest rate swap, the fixed rate payment is paid annually in advance, and the floating rate payment is received monthly in arrears; for the 7 years interest rate swap, the fixed leg is paid annually in advance, and the floating leg is received quarterly in arrears.
The fair value gains / (losses) of the consolidated entity on interest rate swaps cash flow hedges (transferred from equity) was $155,000 ( 2007: $nil).
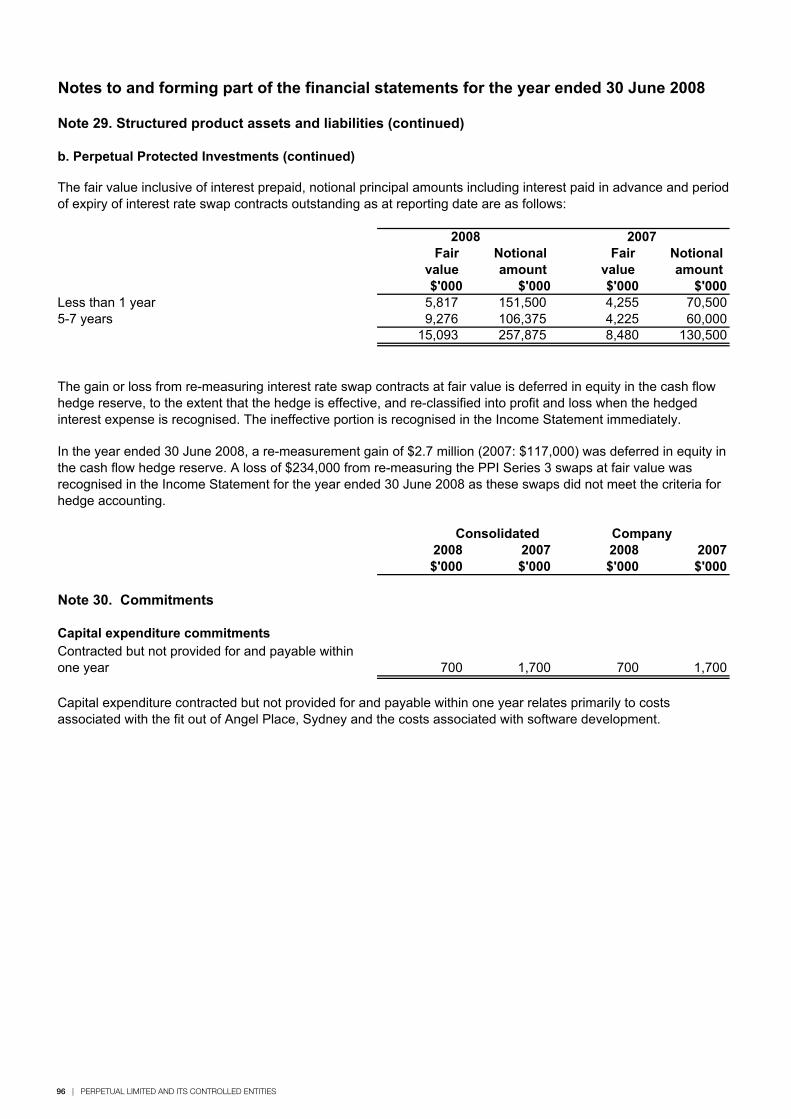
96 | PERPETUAL LIMITED AND ITS CONTROLLED ENTITIES
Note 29. Structured product assets and liabilities (continued)
b. Perpetual Protected Investments (continued)
Fair Notional Fair Notional value amount value amount $'000 $'000 $'000 $'000
Less than 1 year 5,817 151,500 4,255 70,5005-7 years 9,276 106,375 4,225 60,000
15,093 257,875 8,480 130,500
2008 2007 2008 2007$'000 $'000 $'000 $'000
Note 30. Commitments
Capital expenditure commitments
700 1,700 700 1,700
In the year ended 30 June 2008, a re-measurement gain of $2.7 million (2007: $117,000) was deferred in equity in the cash flow hedge reserve. A loss of $234,000 from re-measuring the PPI Series 3 swaps at fair value was recognised in the Income Statement for the year ended 30 June 2008 as these swaps did not meet the criteria for hedge accounting.
2007
Notes to and forming part of the financial statements for the year ended 30 June 2008
The gain or loss from re-measuring interest rate swap contracts at fair value is deferred in equity in the cash flow hedge reserve, to the extent that the hedge is effective, and re-classified into profit and loss when the hedged interest expense is recognised. The ineffective portion is recognised in the Income Statement immediately.
The fair value inclusive of interest prepaid, notional principal amounts including interest paid in advance and period of expiry of interest rate swap contracts outstanding as at reporting date are as follows:
2008
Consolidated
Contracted but not provided for and payable within one year
Company
Capital expenditure contracted but not provided for and payable within one year relates primarily to costs associated with the fit out of Angel Place, Sydney and the costs associated with software development.
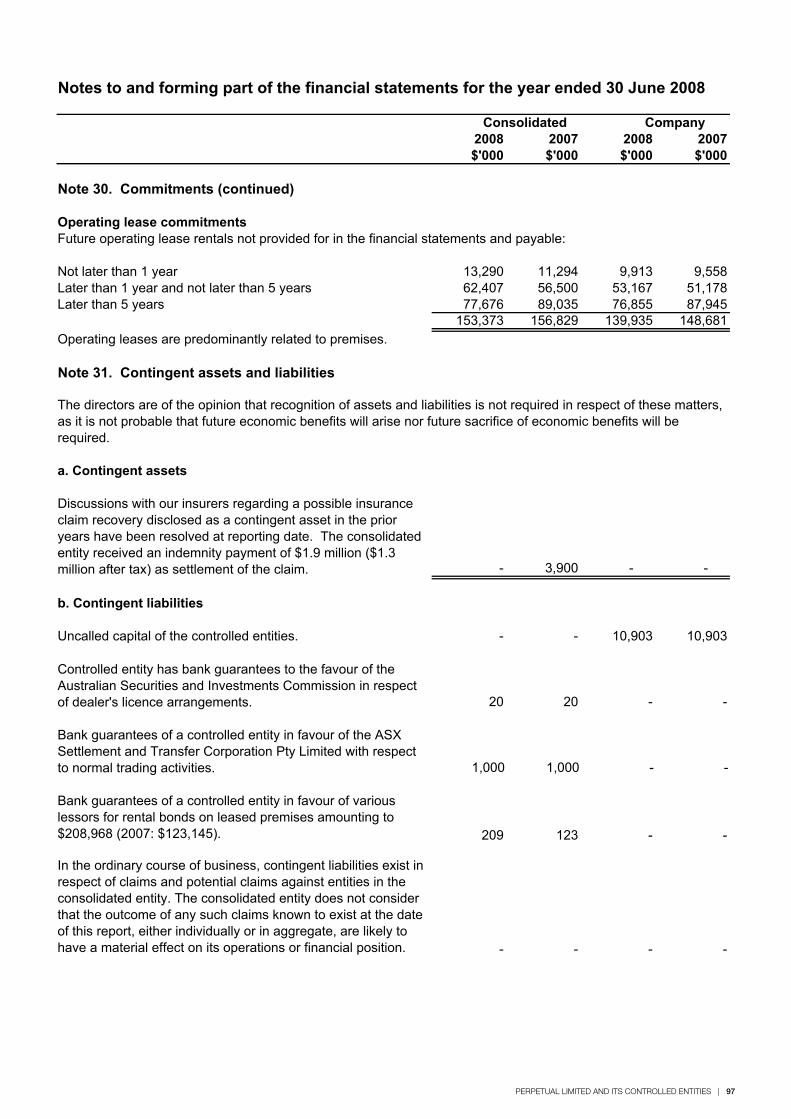
PERPETUAL LIMITED AND ITS CONTROLLED ENTITIES | 97
Notes to and forming part of the financial statements for the year ended 30 June 2008
2008 2007 2008 2007$'000 $'000 $'000 $'000
Note 30. Commitments (continued)
Operating lease commitmentsFuture operating lease rentals not provided for in the financial statements and payable:
Not later than 1 year 13,290 11,294 9,913 9,558Later than 1 year and not later than 5 years 62,407 56,500 53,167 51,178Later than 5 years 77,676 89,035 76,855 87,945
153,373 156,829 139,935 148,681Operating leases are predominantly related to premises.
Note 31. Contingent assets and liabilities
a. Contingent assets
- 3,900 - -
b. Contingent liabilities
Uncalled capital of the controlled entities. - - 10,903 10,903
20 20 - -
209 123 - -
- - - -
-
Bank guarantees of a controlled entity in favour of the ASX Settlement and Transfer Corporation Pty Limited with respect to normal trading activities.
The directors are of the opinion that recognition of assets and liabilities is not required in respect of these matters, as it is not probable that future economic benefits will arise nor future sacrifice of economic benefits will be required.
Discussions with our insurers regarding a possible insurance claim recovery disclosed as a contingent asset in the prior years have been resolved at reporting date. The consolidated entity received an indemnity payment of $1.9 million ($1.3 million after tax) as settlement of the claim.
Consolidated Company
1,000 1,000
In the ordinary course of business, contingent liabilities exist in respect of claims and potential claims against entities in the consolidated entity. The consolidated entity does not consider that the outcome of any such claims known to exist at the date of this report, either individually or in aggregate, are likely to have a material effect on its operations or financial position.
-
Controlled entity has bank guarantees to the favour of the Australian Securities and Investments Commission in respect of dealer's licence arrangements.
Bank guarantees of a controlled entity in favour of various lessors for rental bonds on leased premises amounting to $208,968 (2007: $123,145).
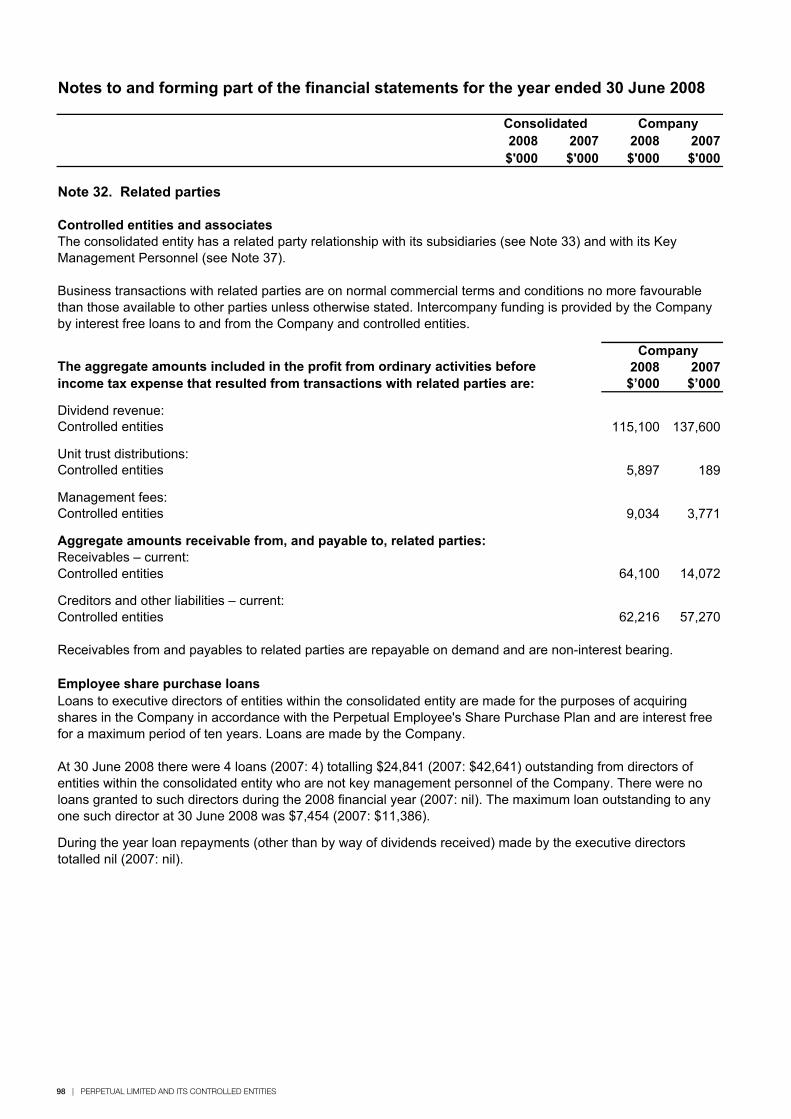
98 | PERPETUAL LIMITED AND ITS CONTROLLED ENTITIES
2008 2007 2008 2007$'000 $'000 $'000 $'000
Note 32. Related parties
Controlled entities and associates
2008 2007$’000 $’000
Dividend revenue:Controlled entities 115,100 137,600
Unit trust distributions:Controlled entities 5,897 189
Management fees:Controlled entities 9,034 3,771
Aggregate amounts receivable from, and payable to, related parties:Receivables – current:Controlled entities 64,100 14,072
Creditors and other liabilities – current:Controlled entities 62,216 57,270
Receivables from and payables to related parties are repayable on demand and are non-interest bearing.
Employee share purchase loans
Notes to and forming part of the financial statements for the year ended 30 June 2008
Business transactions with related parties are on normal commercial terms and conditions no more favourable than those available to other parties unless otherwise stated. Intercompany funding is provided by the Company by interest free loans to and from the Company and controlled entities.
The consolidated entity has a related party relationship with its subsidiaries (see Note 33) and with its Key Management Personnel (see Note 37).
Consolidated Company
The aggregate amounts included in the profit from ordinary activities before income tax expense that resulted from transactions with related parties are:
Company
Loans to executive directors of entities within the consolidated entity are made for the purposes of acquiring shares in the Company in accordance with the Perpetual Employee's Share Purchase Plan and are interest free for a maximum period of ten years. Loans are made by the Company.
At 30 June 2008 there were 4 loans (2007: 4) totalling $24,841 (2007: $42,641) outstanding from directors of entities within the consolidated entity who are not key management personnel of the Company. There were no loans granted to such directors during the 2008 financial year (2007: nil). The maximum loan outstanding to any one such director at 30 June 2008 was $7,454 (2007: $11,386).
During the year loan repayments (other than by way of dividends received) made by the executive directors totalled nil (2007: nil).
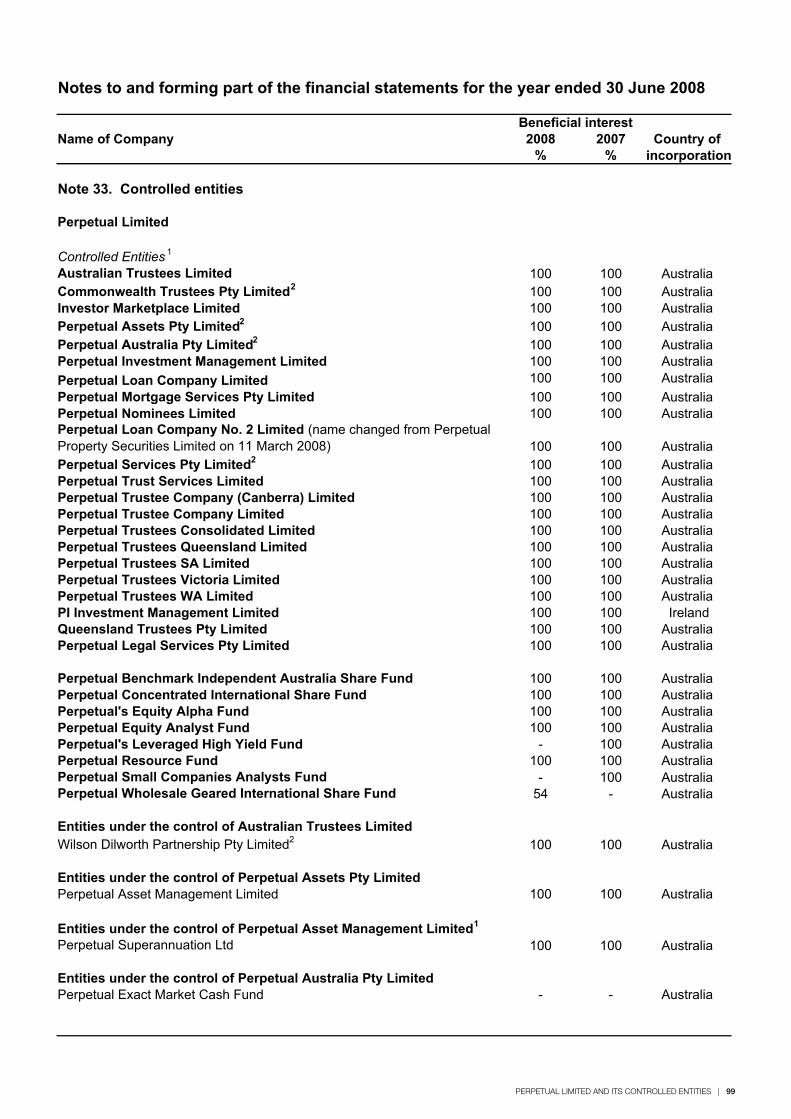
PERPETUAL LIMITED AND ITS CONTROLLED ENTITIES | 99
Notes to and forming part of the financial statements for the year ended 30 June 2008
Name of Company 2008 2007 Country of % % incorporation
Note 33. Controlled entities
Perpetual Limited
Controlled Entities 1
Australian Trustees Limited 100 100 Australia Commonwealth Trustees Pty Limited2 100 100 Australia Investor Marketplace Limited 100 100 Australia Perpetual Assets Pty Limited2 100 100 Australia Perpetual Australia Pty Limited2 100 100 Australia Perpetual Investment Management Limited 100 100 Australia Perpetual Loan Company Limited 100 100 Australia Perpetual Mortgage Services Pty Limited 100 100 Australia Perpetual Nominees Limited 100 100 Australia Perpetual Loan Company No. 2 Limited (name changed from Perpetual Property Securities Limited on 11 March 2008) 100 100 Australia Perpetual Services Pty Limited2 100 100 Australia Perpetual Trust Services Limited 100 100 Australia Perpetual Trustee Company (Canberra) Limited 100 100 Australia Perpetual Trustee Company Limited 100 100 Australia Perpetual Trustees Consolidated Limited 100 100 Australia Perpetual Trustees Queensland Limited 100 100 Australia Perpetual Trustees SA Limited 100 100 Australia Perpetual Trustees Victoria Limited 100 100 Australia Perpetual Trustees WA Limited 100 100 Australia PI Investment Management Limited 100 100 IrelandQueensland Trustees Pty Limited 100 100 Australia Perpetual Legal Services Pty Limited 100 100 Australia
Perpetual Benchmark Independent Australia Share Fund 100 100 Australia Perpetual Concentrated International Share Fund 100 100 Australia Perpetual's Equity Alpha Fund 100 100 Australia Perpetual Equity Analyst Fund 100 100 Australia Perpetual's Leveraged High Yield Fund - 100 Australia Perpetual Resource Fund 100 100 Australia Perpetual Small Companies Analysts Fund - 100 Australia Perpetual Wholesale Geared International Share Fund 54 - Australia
Entities under the control of Australian Trustees Limited Wilson Dilworth Partnership Pty Limited2 100 100 Australia
Entities under the control of Perpetual Assets Pty Limited Perpetual Asset Management Limited 100 100 Australia
Entities under the control of Perpetual Asset Management Limited1
Perpetual Superannuation Ltd 100 100 Australia
Entities under the control of Perpetual Australia Pty LimitedPerpetual Exact Market Cash Fund - - Australia
Beneficial interest
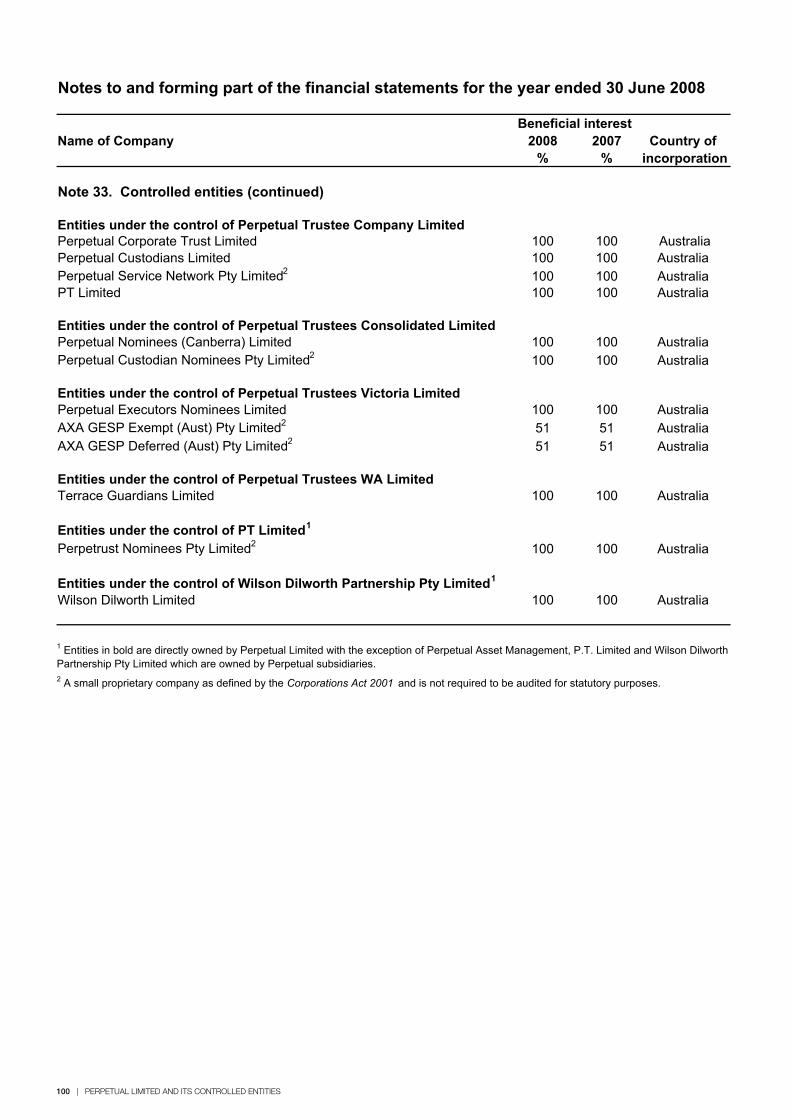
100 | PERPETUAL LIMITED AND ITS CONTROLLED ENTITIES
Name of Company 2008 2007 Country of % % incorporation
Note 33. Controlled entities (continued)
Entities under the control of Perpetual Trustee Company Limited Perpetual Corporate Trust Limited 100 100 AustraliaPerpetual Custodians Limited 100 100 Australia Perpetual Service Network Pty Limited2 100 100 Australia PT Limited 100 100 Australia
Entities under the control of Perpetual Trustees Consolidated LimitedPerpetual Nominees (Canberra) Limited 100 100 Australia Perpetual Custodian Nominees Pty Limited2 100 100 Australia
Entities under the control of Perpetual Trustees Victoria Limited Perpetual Executors Nominees Limited 100 100 Australia AXA GESP Exempt (Aust) Pty Limited2 51 51 Australia AXA GESP Deferred (Aust) Pty Limited2 51 51 Australia
Entities under the control of Perpetual Trustees WA Limited Terrace Guardians Limited 100 100 Australia
Entities under the control of PT Limited1
Perpetrust Nominees Pty Limited2 100 100 Australia
Entities under the control of Wilson Dilworth Partnership Pty Limited1
Wilson Dilworth Limited 100 100 Australia
1 Entities in bold are directly owned by Perpetual Limited with the exception of Perpetual Asset Management, P.T. Limited and Wilson Dilworth Partnership Pty Limited which are owned by Perpetual subsidiaries.2 A small proprietary company as defined by the Corporations Act 2001 and is not required to be audited for statutory purposes.
Beneficial interest
Notes to and forming part of the financial statements for the year ended 30 June 2008
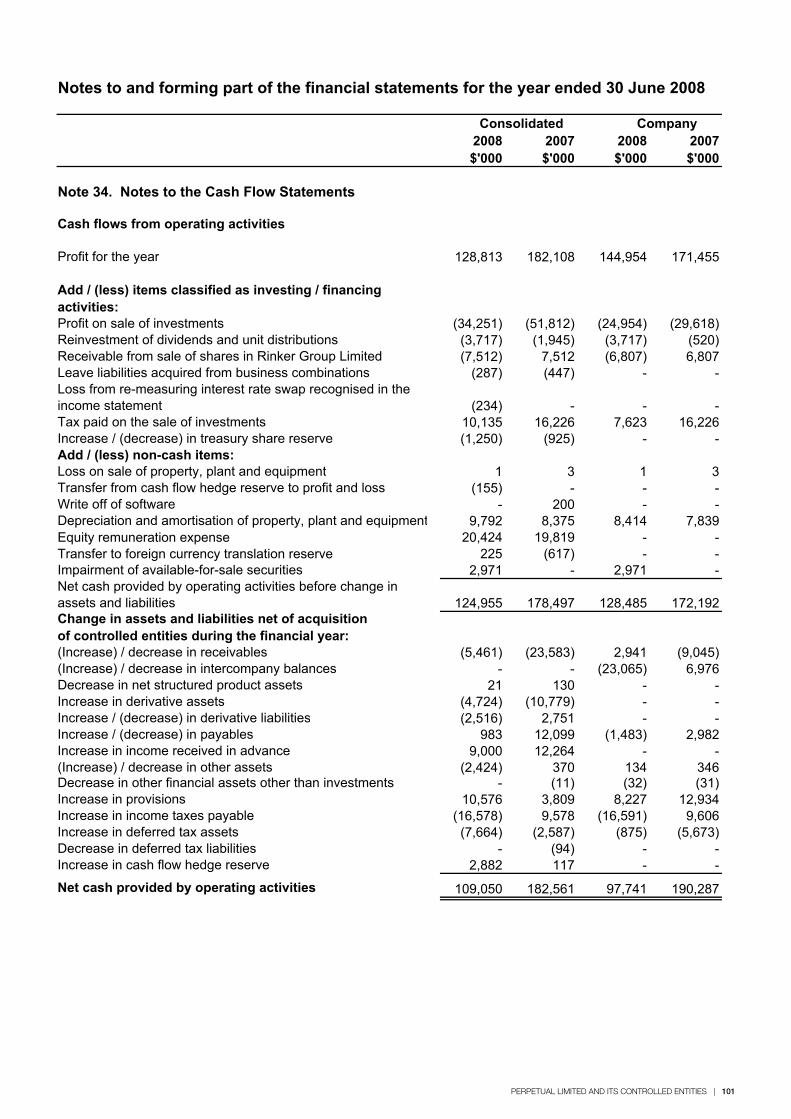
PERPETUAL LIMITED AND ITS CONTROLLED ENTITIES | 101
Notes to and forming part of the financial statements for the year ended 30 June 2008
2008 2007 2008 2007$'000 $'000 $'000 $'000
Note 34. Notes to the Cash Flow Statements
Cash flows from operating activities
Profit for the year 128,813 182,108 144,954 171,455
Add / (less) items classified as investing / financing activities:Profit on sale of investments (34,251) (51,812) (24,954) (29,618)Reinvestment of dividends and unit distributions (3,717) (1,945) (3,717) (520)Receivable from sale of shares in Rinker Group Limited (7,512) 7,512 (6,807) 6,807Leave liabilities acquired from business combinations (287) (447) - -Loss from re-measuring interest rate swap recognised in the income statement (234) - - -Tax paid on the sale of investments 10,135 16,226 7,623 16,226Increase / (decrease) in treasury share reserve (1,250) (925) - -Add / (less) non-cash items:Loss on sale of property, plant and equipment 1 3 1 3Transfer from cash flow hedge reserve to profit and loss (155) - - -Write off of software - 200 - -Depreciation and amortisation of property, plant and equipment 9,792 8,375 8,414 7,839Equity remuneration expense 20,424 19,819 - -Transfer to foreign currency translation reserve 225 (617) - -Impairment of available-for-sale securities 2,971 - 2,971 -Net cash provided by operating activities before change in assets and liabilities 124,955 178,497 128,485 172,192Change in assets and liabilities net of acquisition of controlled entities during the financial year:(Increase) / decrease in receivables (5,461) (23,583) 2,941 (9,045)(Increase) / decrease in intercompany balances - - (23,065) 6,976Decrease in net structured product assets 21 130 - -Increase in derivative assets (4,724) (10,779) - -Increase / (decrease) in derivative liabilities (2,516) 2,751 - -Increase / (decrease) in payables 983 12,099 (1,483) 2,982Increase in income received in advance 9,000 12,264 - -(Increase) / decrease in other assets (2,424) 370 134 346Decrease in other financial assets other than investments - (11) (32) (31)Increase in provisions 10,576 3,809 8,227 12,934Increase in income taxes payable (16,578) 9,578 (16,591) 9,606Increase in deferred tax assets (7,664) (2,587) (875) (5,673)Decrease in deferred tax liabilities - (94) - -Increase in cash flow hedge reserve 2,882 117 - -
Net cash provided by operating activities 109,050 182,561 97,741 190,287
CompanyConsolidated
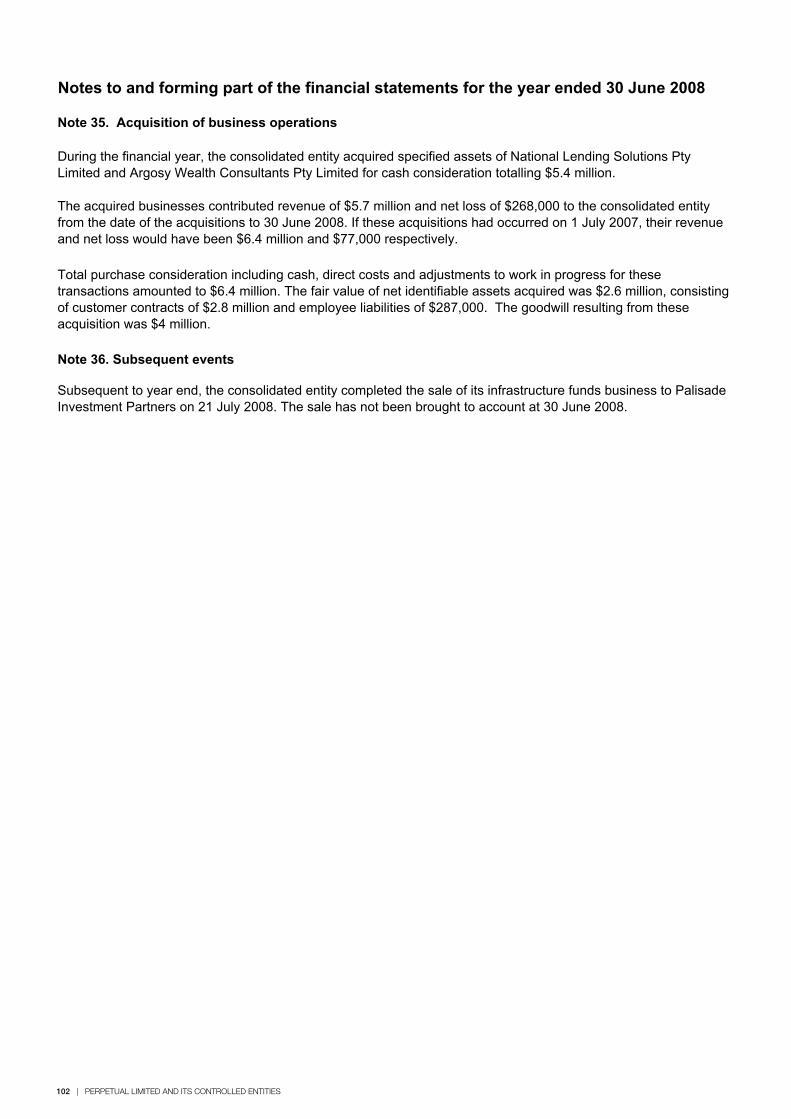
102 | PERPETUAL LIMITED AND ITS CONTROLLED ENTITIES
Note 35. Acquisition of business operations
Note 36. Subsequent events
Subsequent to year end, the consolidated entity completed the sale of its infrastructure funds business to Palisade Investment Partners on 21 July 2008. The sale has not been brought to account at 30 June 2008.
Notes to and forming part of the financial statements for the year ended 30 June 2008
During the financial year, the consolidated entity acquired specified assets of National Lending Solutions Pty Limited and Argosy Wealth Consultants Pty Limited for cash consideration totalling $5.4 million.
The acquired businesses contributed revenue of $5.7 million and net loss of $268,000 to the consolidated entity from the date of the acquisitions to 30 June 2008. If these acquisitions had occurred on 1 July 2007, their revenue and net loss would have been $6.4 million and $77,000 respectively.
Total purchase consideration including cash, direct costs and adjustments to work in progress for these transactions amounted to $6.4 million. The fair value of net identifiable assets acquired was $2.6 million, consisting of customer contracts of $2.8 million and employee liabilities of $287,000. The goodwill resulting from these acquisition was $4 million.
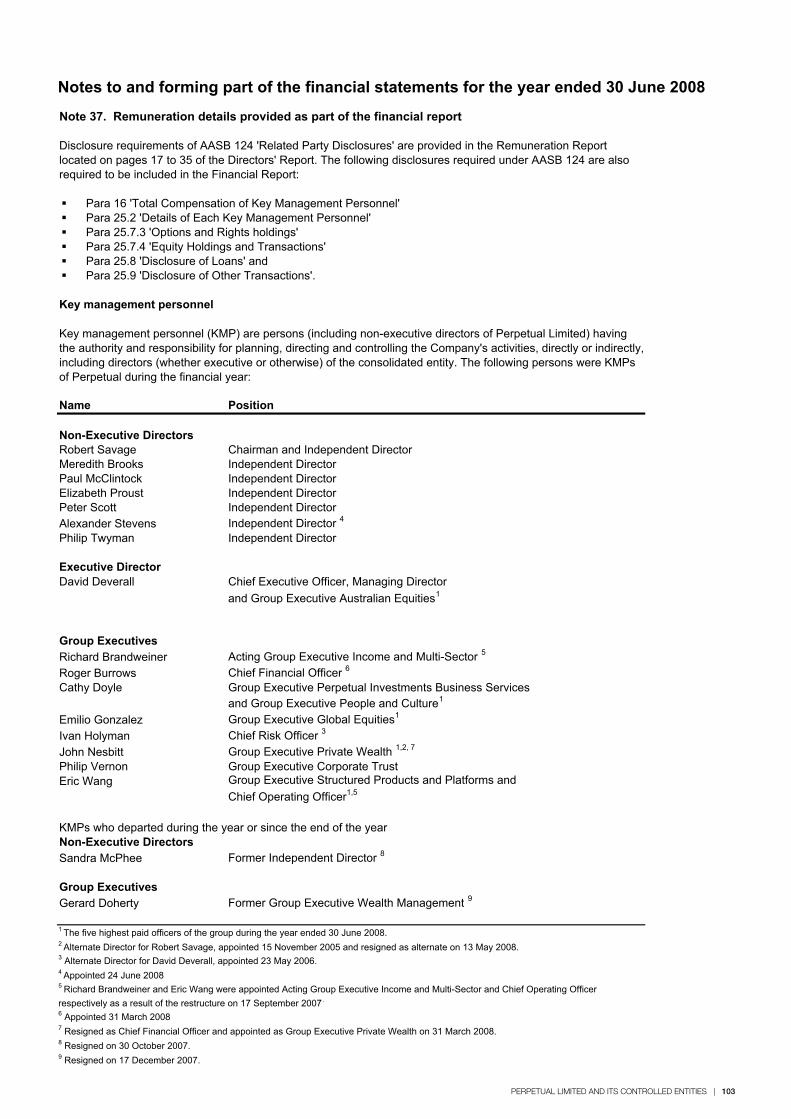
PERPETUAL LIMITED AND ITS CONTROLLED ENTITIES | 103
Note 35. Acquisition of business operations
Note 36. Subsequent events
Subsequent to year end, the consolidated entity completed the sale of its infrastructure funds business to Palisade Investment Partners on 21 July 2008. The sale has not been brought to account at 30 June 2008.
Notes to and forming part of the financial statements for the year ended 30 June 2008
During the financial year, the consolidated entity acquired specified assets of National Lending Solutions Pty Limited and Argosy Wealth Consultants Pty Limited for cash consideration totalling $5.4 million.
The acquired businesses contributed revenue of $5.7 million and net loss of $268,000 to the consolidated entity from the date of the acquisitions to 30 June 2008. If these acquisitions had occurred on 1 July 2007, their revenue and net loss would have been $6.4 million and $77,000 respectively.
Total purchase consideration including cash, direct costs and adjustments to work in progress for these transactions amounted to $6.4 million. The fair value of net identifiable assets acquired was $2.6 million, consisting of customer contracts of $2.8 million and employee liabilities of $287,000. The goodwill resulting from these acquisition was $4 million.
Notes to and forming part of the financial statements for the year ended 30 June 2008
Note 37. Remuneration details provided as part of the financial report
Para 16 'Total Compensation of Key Management Personnel'Para 25.2 'Details of Each Key Management Personnel'Para 25.7.3 'Options and Rights holdings'Para 25.7.4 'Equity Holdings and Transactions'Para 25.8 'Disclosure of Loans' andPara 25.9 'Disclosure of Other Transactions'.
Key management personnel
Name Position
Non-Executive DirectorsRobert Savage Chairman and Independent DirectorMeredith Brooks Independent DirectorPaul McClintock Independent DirectorElizabeth Proust Independent DirectorPeter Scott Independent DirectorAlexander Stevens Independent Director 4
Philip Twyman Independent Director
Executive DirectorDavid Deverall Chief Executive Officer, Managing Director
and Group Executive Australian Equities1
Group ExecutivesRichard Brandweiner Acting Group Executive Income and Multi-Sector 5
Roger Burrows Chief Financial Officer 6
Cathy Doyle Group Executive Perpetual Investments Business Servicesand Group Executive People and Culture1
Emilio Gonzalez Group Executive Global Equities1
Ivan Holyman Chief Risk Officer 3
John Nesbitt Group Executive Private Wealth 1,2, 7
Philip Vernon Group Executive Corporate Trust Eric Wang Group Executive Structured Products and Platforms and
Chief Operating Officer1,5
KMPs who departed during the year or since the end of the yearNon-Executive DirectorsSandra McPhee Former Independent Director 8
Group ExecutivesGerard Doherty Former Group Executive Wealth Management 9
3 Alternate Director for David Deverall, appointed 23 May 2006.4 Appointed 24 June 2008
6 Appointed 31 March 20087 Resigned as Chief Financial Officer and appointed as Group Executive Private Wealth on 31 March 2008.8 Resigned on 30 October 2007.9 Resigned on 17 December 2007.
5 Richard Brandweiner and Eric Wang were appointed Acting Group Executive Income and Multi-Sector and Chief Operating Officer respectively as a result of the restructure on 17 September 2007.
2 Alternate Director for Robert Savage, appointed 15 November 2005 and resigned as alternate on 13 May 2008.
Disclosure requirements of AASB 124 'Related Party Disclosures' are provided in the Remuneration Report located on pages 17 to 35 of the Directors' Report. The following disclosures required under AASB 124 are also required to be included in the Financial Report:
Key management personnel (KMP) are persons (including non-executive directors of Perpetual Limited) having the authority and responsibility for planning, directing and controlling the Company's activities, directly or indirectly, including directors (whether executive or otherwise) of the consolidated entity. The following persons were KMPs of Perpetual during the financial year:
1 The five highest paid officers of the group during the year ended 30 June 2008.
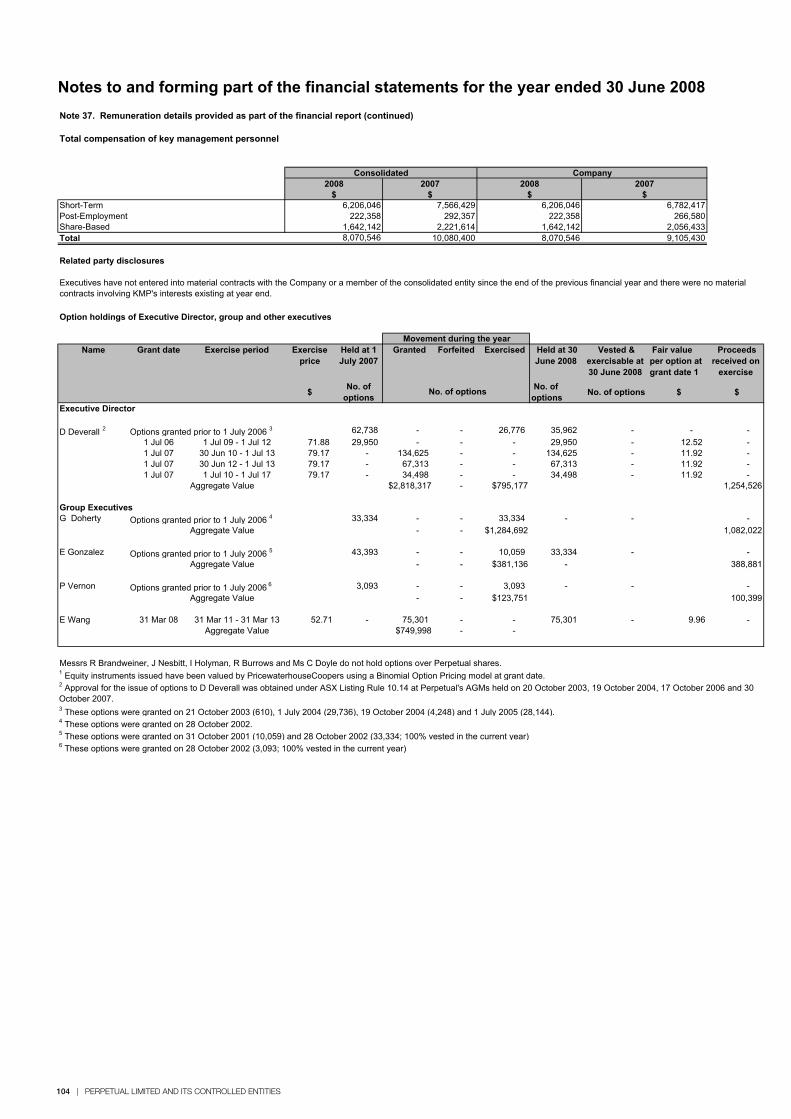
104 | PERPETUAL LIMITED AND ITS CONTROLLED ENTITIES
Notes to and forming part of the financial statements for the year ended 30 June 2008
Note 37. Remuneration details provided as part of the financial report (continued)
Total compensation of key management personnel
Short-TermPost-EmploymentShare-BasedTotal
Related party disclosures
Option holdings of Executive Director, group and other executives
Name Grant date Exercise period Exercise price
Held at 1 July 2007
Granted Forfeited Exercised Held at 30 June 2008
Vested & exercisable at 30 June 2008
Fair value per option at grant date 1
Proceeds received on
exercise
$ No. of options
No. of options No. of options $ $
Executive Director
D Deverall 2 Options granted prior to 1 July 2006 3 62,738 - - 26,776 35,962 - - -1 Jul 06 1 Jul 09 - 1 Jul 12 71.88 29,950 - - - 29,950 - 12.52 -1 Jul 07 30 Jun 10 - 1 Jul 13 79.17 - 134,625 - - 134,625 - 11.92 -1 Jul 07 30 Jun 12 - 1 Jul 13 79.17 - 67,313 - - 67,313 - 11.92 -1 Jul 07 1 Jul 10 - 1 Jul 17 79.17 - 34,498 - - 34,498 - 11.92 -
Aggregate Value $2,818,317 - $795,177 1,254,526
Group ExecutivesG Doherty Options granted prior to 1 July 2006 4 33,334 - - 33,334 - - -
Aggregate Value - - $1,284,692 1,082,022
E Gonzalez Options granted prior to 1 July 2006 5 43,393 - - 10,059 33,334 - -Aggregate Value - - $381,136 - 388,881
P Vernon Options granted prior to 1 July 2006 6 3,093 - - 3,093 - - -Aggregate Value - - $123,751 100,399
E Wang 31 Mar 08 31 Mar 11 - 31 Mar 13 52.71 - 75,301 - - 75,301 - 9.96 -Aggregate Value $749,998 - -
Messrs R Brandweiner, J Nesbitt, I Holyman, R Burrows and Ms C Doyle do not hold options over Perpetual shares.1 Equity instruments issued have been valued by PricewaterhouseCoopers using a Binomial Option Pricing model at grant date.
3 These options were granted on 21 October 2003 (610), 1 July 2004 (29,736), 19 October 2004 (4,248) and 1 July 2005 (28,144).4 These options were granted on 28 October 2002.5 These options were granted on 31 October 2001 (10,059) and 28 October 2002 (33,334; 100% vested in the current year)6 These options were granted on 28 October 2002 (3,093; 100% vested in the current year).
2007$
Executives have not entered into material contracts with the Company or a member of the consolidated entity since the end of the previous financial year and there were no material contracts involving KMP's interests existing at year end.
2 Approval for the issue of options to D Deverall was obtained under ASX Listing Rule 10.14 at Perpetual's AGMs held on 20 October 2003, 19 October 2004, 17 October 2006 and 30 October 2007.
Movement during the year
No. of options
10,080,400
6,206,046222,358
1,642,1428,070,546
2008$
Consolidated2008
$
8,070,546
7,566,429292,357
2,221,614 2,056,4339,105,430
Company2007
$6,782,417
266,5806,206,046
222,3581,642,142
Note 35. Acquisition of business operations
Note 36. Subsequent events
Subsequent to year end, the consolidated entity completed the sale of its infrastructure funds business to Palisade Investment Partners on 21 July 2008. The sale has not been brought to account at 30 June 2008.
Notes to and forming part of the financial statements for the year ended 30 June 2008
During the financial year, the consolidated entity acquired specified assets of National Lending Solutions Pty Limited and Argosy Wealth Consultants Pty Limited for cash consideration totalling $5.4 million.
The acquired businesses contributed revenue of $5.7 million and net loss of $268,000 to the consolidated entity from the date of the acquisitions to 30 June 2008. If these acquisitions had occurred on 1 July 2007, their revenue and net loss would have been $6.4 million and $77,000 respectively.
Total purchase consideration including cash, direct costs and adjustments to work in progress for these transactions amounted to $6.4 million. The fair value of net identifiable assets acquired was $2.6 million, consisting of customer contracts of $2.8 million and employee liabilities of $287,000. The goodwill resulting from these acquisition was $4 million.
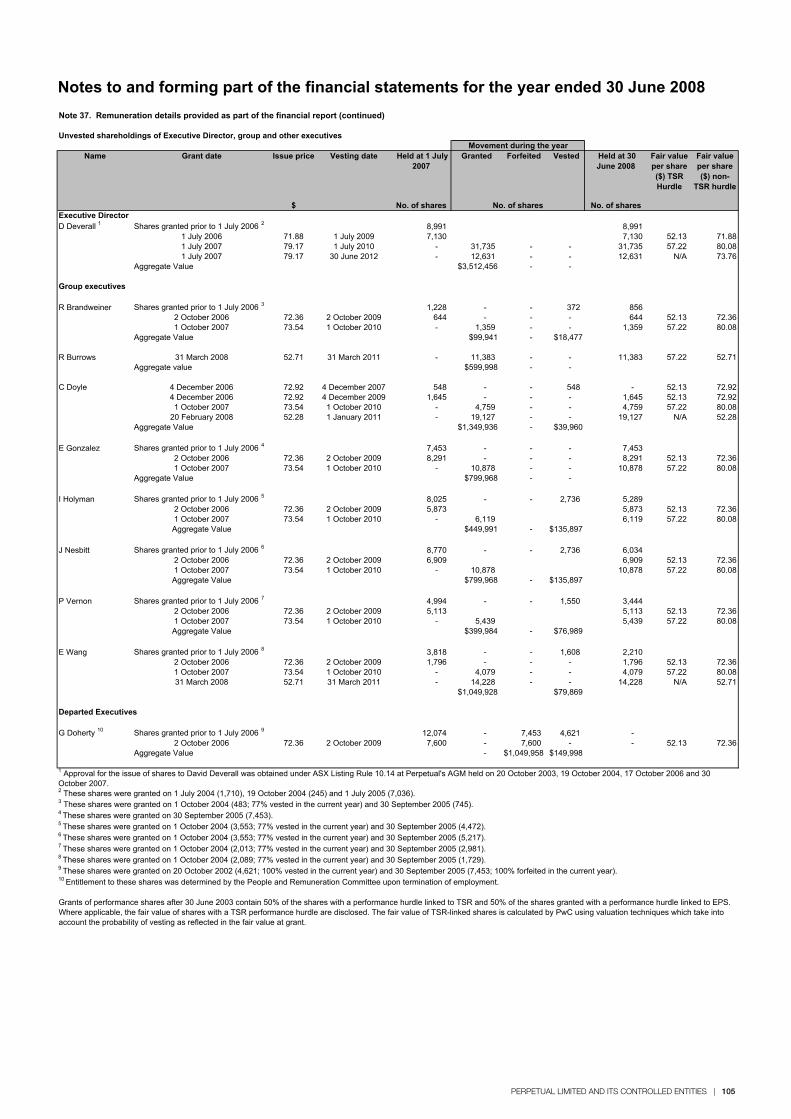
PERPETUAL LIMITED AND ITS CONTROLLED ENTITIES | 105
Notes to and forming part of the financial statements for the year ended 30 June 2008
Note 37. Remuneration details provided as part of the financial report (continued)
Unvested shareholdings of Executive Director, group and other executives
Name Grant date Issue price Vesting date Held at 1 July 2007
Granted Forfeited Vested Held at 30 June 2008
Fair value per share ($) TSR Hurdle
Fair value per share ($) non-
TSR hurdle
$ No. of shares No. of sharesExecutive DirectorD Deverall 1 Shares granted prior to 1 July 2006 2 8,991 8,991
1 July 2006 71.88 1 July 2009 7,130 7,130 52.13 71.881 July 2007 79.17 1 July 2010 - 31,735 - - 31,735 57.22 80.081 July 2007 79.17 30 June 2012 - 12,631 - - 12,631 N/A 73.76
Aggregate Value $3,512,456 - -
Group executives
R Brandweiner Shares granted prior to 1 July 2006 3 1,228 - - 372 856 2 October 2006 72.36 2 October 2009 644 - - - 644 52.13 72.361 October 2007 73.54 1 October 2010 - 1,359 - - 1,359 57.22 80.08
Aggregate Value $99,941 - $18,477
R Burrows 31 March 2008 52.71 31 March 2011 - 11,383 - - 11,383 57.22 52.71Aggregate value $599,998 - -
C Doyle 4 December 2006 72.92 4 December 2007 548 - - 548 - 52.13 72.924 December 2006 72.92 4 December 2009 1,645 - - - 1,645 52.13 72.921 October 2007 73.54 1 October 2010 - 4,759 - - 4,759 57.22 80.08
20 February 2008 52.28 1 January 2011 - 19,127 - - 19,127 N/A 52.28Aggregate Value $1,349,936 - $39,960
E Gonzalez Shares granted prior to 1 July 2006 4 7,453 - - - 7,453 2 October 2006 72.36 2 October 2009 8,291 - - - 8,291 52.13 72.361 October 2007 73.54 1 October 2010 - 10,878 - - 10,878 57.22 80.08
Aggregate Value $799,968 - -
I Holyman Shares granted prior to 1 July 2006 5 8,025 - - 2,736 5,289 2 October 2006 72.36 2 October 2009 5,873 5,873 52.13 72.361 October 2007 73.54 1 October 2010 - 6,119 6,119 57.22 80.08Aggregate Value $449,991 - $135,897
J Nesbitt Shares granted prior to 1 July 2006 6 8,770 - - 2,736 6,034 2 October 2006 72.36 2 October 2009 6,909 6,909 52.13 72.361 October 2007 73.54 1 October 2010 - 10,878 10,878 57.22 80.08Aggregate Value $799,968 - $135,897
P Vernon Shares granted prior to 1 July 2006 7 4,994 - - 1,550 3,444 2 October 2006 72.36 2 October 2009 5,113 5,113 52.13 72.361 October 2007 73.54 1 October 2010 - 5,439 5,439 57.22 80.08Aggregate Value $399,984 - $76,989
E Wang Shares granted prior to 1 July 2006 8 3,818 - - 1,608 2,210 2 October 2006 72.36 2 October 2009 1,796 - - - 1,796 52.13 72.361 October 2007 73.54 1 October 2010 - 4,079 - - 4,079 57.22 80.0831 March 2008 52.71 31 March 2011 - 14,228 - - 14,228 N/A 52.71
$1,049,928 $79,869
Departed Executives
G Doherty 10 Shares granted prior to 1 July 2006 9 12,074 - 7,453 4,621 - 2 October 2006 72.36 2 October 2009 7,600 - 7,600 - - 52.13 72.36
Aggregate Value - $1,049,958 $149,998
3 These shares were granted on 1 October 2004 (483; 77% vested in the current year) and 30 September 2005 (745).4 These shares were granted on 30 September 2005 (7,453).5 These shares were granted on 1 October 2004 (3,553; 77% vested in the current year) and 30 September 2005 (4,472).6 These shares were granted on 1 October 2004 (3,553; 77% vested in the current year) and 30 September 2005 (5,217).7 These shares were granted on 1 October 2004 (2,013; 77% vested in the current year) and 30 September 2005 (2,981). 8 These shares were granted on 1 October 2004 (2,089; 77% vested in the current year) and 30 September 2005 (1,729).9 These shares were granted on 20 October 2002 (4,621; 100% vested in the current year) and 30 September 2005 (7,453; 100% forfeited in the current year).10 Entitlement to these shares was determined by the People and Remuneration Committee upon termination of employment.
Grants of performance shares after 30 June 2003 contain 50% of the shares with a performance hurdle linked to TSR and 50% of the shares granted with a performance hurdle linked to EPS. Where applicable, the fair value of shares with a TSR performance hurdle are disclosed. The fair value of TSR-linked shares is calculated by PwC using valuation techniques which take into account the probability of vesting as reflected in the fair value at grant.
Movement during the year
No. of shares
2 These shares were granted on 1 July 2004 (1,710), 19 October 2004 (245) and 1 July 2005 (7,036).
1 Approval for the issue of shares to David Deverall was obtained under ASX Listing Rule 10.14 at Perpetual's AGM held on 20 October 2003, 19 October 2004, 17 October 2006 and 30 October 2007.
Note 35. Acquisition of business operations
Note 36. Subsequent events
Subsequent to year end, the consolidated entity completed the sale of its infrastructure funds business to Palisade Investment Partners on 21 July 2008. The sale has not been brought to account at 30 June 2008.
Notes to and forming part of the financial statements for the year ended 30 June 2008
During the financial year, the consolidated entity acquired specified assets of National Lending Solutions Pty Limited and Argosy Wealth Consultants Pty Limited for cash consideration totalling $5.4 million.
The acquired businesses contributed revenue of $5.7 million and net loss of $268,000 to the consolidated entity from the date of the acquisitions to 30 June 2008. If these acquisitions had occurred on 1 July 2007, their revenue and net loss would have been $6.4 million and $77,000 respectively.
Total purchase consideration including cash, direct costs and adjustments to work in progress for these transactions amounted to $6.4 million. The fair value of net identifiable assets acquired was $2.6 million, consisting of customer contracts of $2.8 million and employee liabilities of $287,000. The goodwill resulting from these acquisition was $4 million.
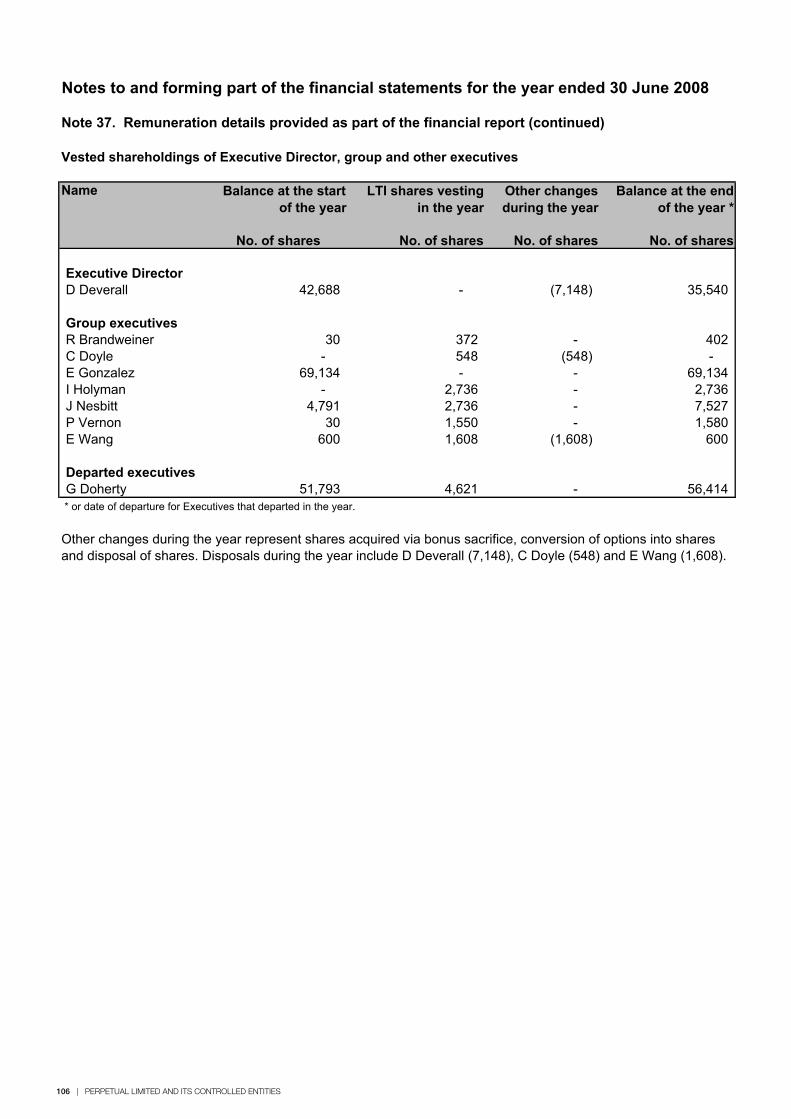
106 | PERPETUAL LIMITED AND ITS CONTROLLED ENTITIES
Notes to and forming part of the financial statements for the year ended 30 June 2008
Note 37. Remuneration details provided as part of the financial report (continued)
Vested shareholdings of Executive Director, group and other executives
Name
Executive DirectorD Deverall 42,688 - (7,148) 35,540
Group executivesR Brandweiner 30 372 - 402 C Doyle - 548 (548) - E Gonzalez 69,134 - - 69,134 I Holyman - 2,736 - 2,736 J Nesbitt 4,791 2,736 - 7,527 P Vernon 30 1,550 - 1,580 E Wang 600 1,608 (1,608) 600
Departed executivesG Doherty 51,793 4,621 - 56,414 * or date of departure for Executives that departed in the year.
Balance at the start of the year
LTI shares vesting in the year
Other changes during the year represent shares acquired via bonus sacrifice, conversion of options into shares and disposal of shares. Disposals during the year include D Deverall (7,148), C Doyle (548) and E Wang (1,608).
Other changes during the year
Balance at the end of the year *
No. of shares No. of shares No. of shares No. of shares
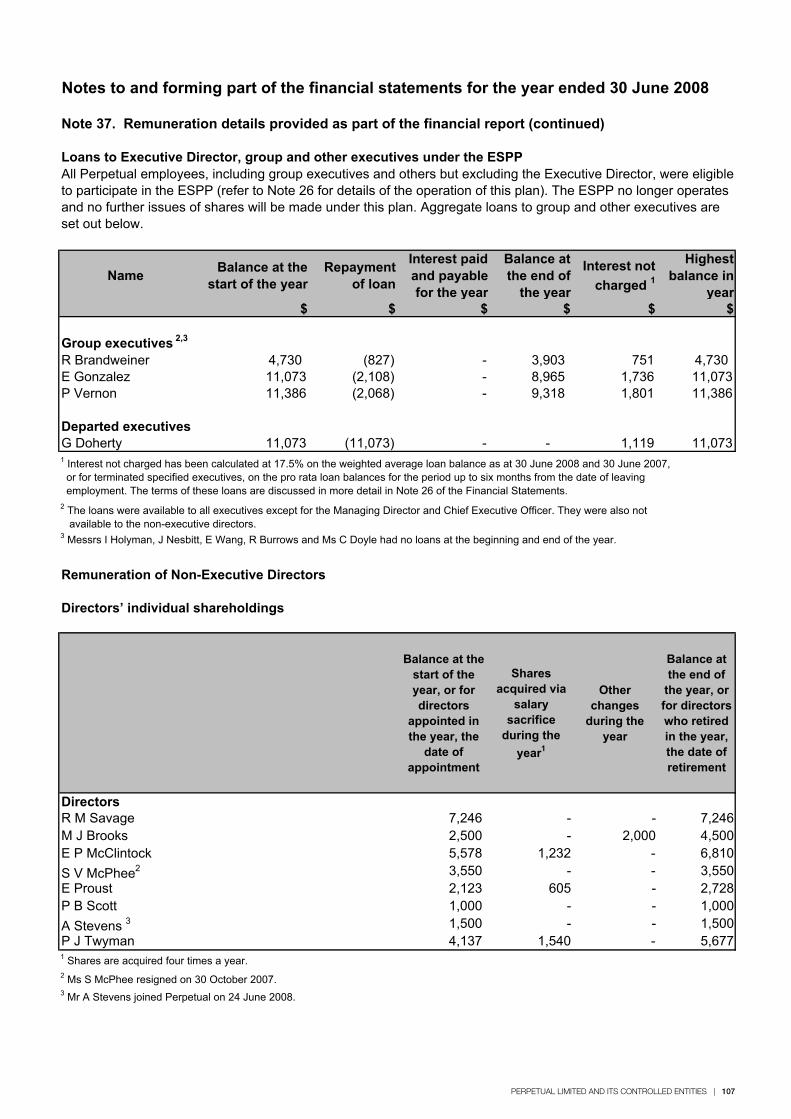
PERPETUAL LIMITED AND ITS CONTROLLED ENTITIES | 107
Notes to and forming part of the financial statements for the year ended 30 June 2008
Note 37. Remuneration details provided as part of the financial report (continued)
Loans to Executive Director, group and other executives under the ESPP
Name Balance at the start of the year
Repaymentof loan
Interest paid and payable for the year
Balance at the end of
the year
Interest not charged 1
Highestbalance in
year$ $ $ $ $ $
Group executives 2,3
R Brandweiner 4,730 (827) - 3,903 751 4,730 E Gonzalez 11,073 (2,108) - 8,965 1,736 11,073P Vernon 11,386 (2,068) - 9,318 1,801 11,386
Departed executivesG Doherty 11,073 (11,073) - - 1,119 11,073
3 Messrs I Holyman, J Nesbitt, E Wang, R Burrows and Ms C Doyle had no loans at the beginning and end of the year.
Remuneration of Non-Executive Directors
Directors’ individual shareholdings
Balance at the start of the year, or for directors
appointed in the year, the
date of appointment
Sharesacquired via
salarysacrifice
during the year1
Otherchanges
during the year
Balance at the end of
the year, or for directors who retired in the year, the date of retirement
7,246 - - 7,2462,500 - 2,000 4,5005,578 1,232 - 6,8103,550 - - 3,5502,123 605 - 2,7281,000 - - 1,000
A Stevens 3 1,500 - - 1,5004,137 1,540 - 5,677
3 Mr A Stevens joined Perpetual on 24 June 2008.
All Perpetual employees, including group executives and others but excluding the Executive Director, were eligible to participate in the ESPP (refer to Note 26 for details of the operation of this plan). The ESPP no longer operates and no further issues of shares will be made under this plan. Aggregate loans to group and other executives are set out below.
Directors
1 Interest not charged has been calculated at 17.5% on the weighted average loan balance as at 30 June 2008 and 30 June 2007, or for terminated specified executives, on the pro rata loan balances for the period up to six months from the date of leaving employment. The terms of these loans are discussed in more detail in Note 26 of the Financial Statements.2 The loans were available to all executives except for the Managing Director and Chief Executive Officer. They were also not available to the non-executive directors.
R M SavageM J BrooksE P McClintockS V McPhee2
P J Twyman1 Shares are acquired four times a year.2 Ms S McPhee resigned on 30 October 2007.
E Proust P B Scott
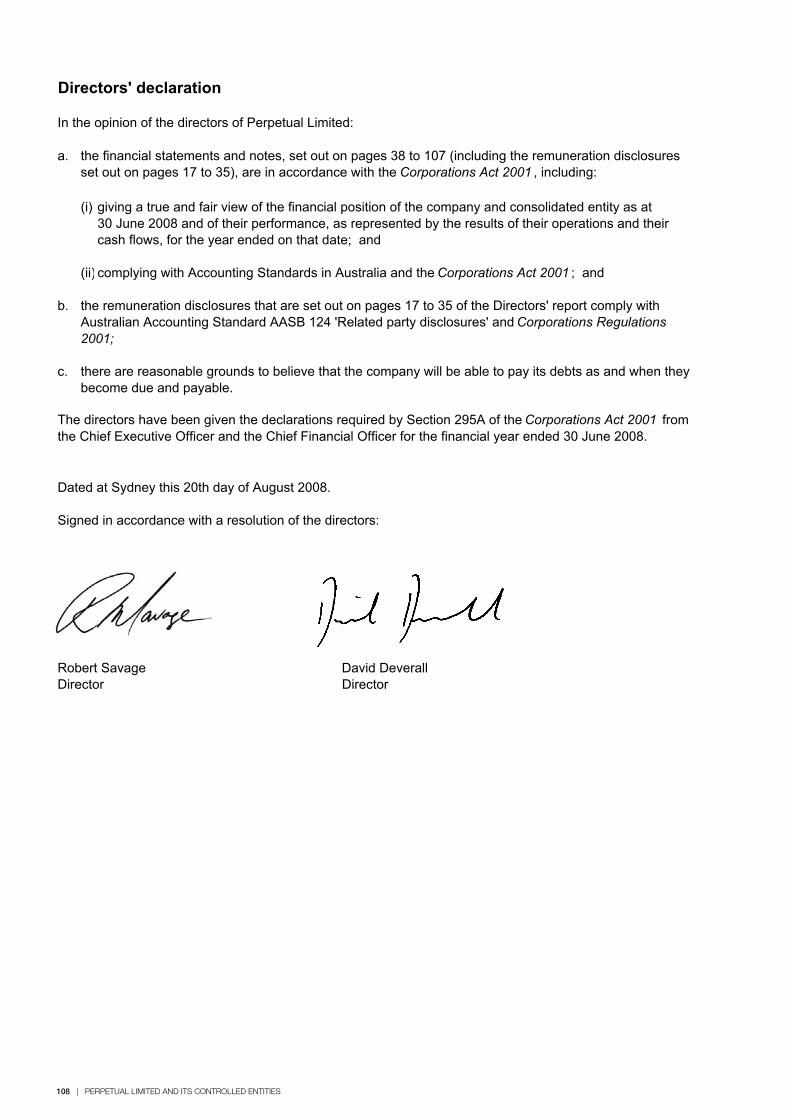
108 | PERPETUAL LIMITED AND ITS CONTROLLED ENTITIES
Directors' declaration
In the opinion of the directors of Perpetual Limited:
a.
(i)
(ii)
b.
c.
Dated at Sydney this 20th day of August 2008.
Signed in accordance with a resolution of the directors:
Robert Savage David DeverallDirector Director
The directors have been given the declarations required by Section 295A of the Corporations Act 2001 fromthe Chief Executive Officer and the Chief Financial Officer for the financial year ended 30 June 2008.
there are reasonable grounds to believe that the company will be able to pay its debts as and when they become due and payable.
the financial statements and notes, set out on pages 38 to 107 (including the remuneration disclosures set out on pages 17 to 35), are in accordance with the Corporations Act 2001 , including:
giving a true and fair view of the financial position of the company and consolidated entity as at 30 June 2008 and of their performance, as represented by the results of their operations and their cash flows, for the year ended on that date; and
complying with Accounting Standards in Australia and the Corporations Act 2001 ; and
the remuneration disclosures that are set out on pages 17 to 35 of the Directors' report comply with Australian Accounting Standard AASB 124 'Related party disclosures' and Corporations Regulations 2001;
PERPETUAL LIMITED AND ITS CONTROLLED ENTITIES | 109
Independent auditor’s report to the members of Perpetual Limited
Report on the financial report and the remuneration disclosures contained in the directors’ report
We have also audited the remuneration report contained on pages 17 to 35 of the directors’ report.
The directors of the Company are responsible for the preparation and fair presentation of the financial report in accordance with Australian Accounting Standards (including the Australian Accounting Interpretations) and the Corporations Act 2001. This responsibility includes establishing and maintaining internal control relevant to the preparation and fair presentation of the financial report that is free from material misstatement, whether due to fraud or error; selecting and applying appropriate accounting policies; and making accounting estimates that are reasonable in the circumstances. In note 2, the directors also state, in accordance with Australian Accounting Standard AASB 101 Presentation of Financial Statements, that the financial report of the Group, comprising the financial statements and notes, complies with International Financial Reporting Standards.
An audit involves performing procedures to obtain audit evidence about the amounts and disclosures in the financial report and the remuneration report contained in the directors’ report. The procedures selected depend on the auditor’s judgement, including the assessment of the risks of material misstatement of the financial report and the remuneration report contained in the directors’ report, whether due to fraud or error. In making those risk assessments, the auditor considers internal control relevant to the entity’s preparation and fair presentation of the financial report and the remuneration report contained in the directors’ report in order to design audit procedures that are appropriate in the circumstances, but not for the purpose of expressing an opinion on the effectiveness of the entity’s internal control.
We have audited the accompanying financial report of Perpetual Limited (the “Company”), which comprises the balance sheets as at 30 June 2008, the income statements, statements of changes in equity and cash flow statements for the year ended on that date, a summary of significant accounting policies and other explanatory notes 1 to 37 and the directors’ declaration set out on pages 38 to 108 of the Group comprising the Company and the entities it controlled at the year’s end or from time to time during the financial year.
Directors’ responsibility for the financial report and the remuneration disclosures contained in the directors’ report
Auditor’s responsibility
Our responsibility is to express an opinion on the financial report based on our audit. We conducted our audit in accordance with Australian Auditing Standards. These Auditing Standards require that we comply with relevant ethical requirements relating to audit engagements and plan and perform the audit to obtain reasonable assurance whether the financial report is free from material misstatement. Our responsibility is also to express an opinion on the remuneration report contained in the directors’ report based on our audit.
The directors of the Company are also responsible for the preparation and presentation of the remuneration report contained in the directors’ report in accordance with Section 300A of the Corporations Act 2001.
110 | PERPETUAL LIMITED AND ITS CONTROLLED ENTITIES
Independent auditor's report to the members of Perpetual Limited (continued)
Auditor’s opinion
In our opinion:
a. the financial report of Perpetual Limited is in accordance with the Corporations Act 2001, including:
(i) giving a true and fair view of the Company’s and the Consolidated Entity's financial position as at 30 June 2008 and of their performance for the year ended on that date; and
(ii) complying with Australian Accounting Standards (including the Australian Accounting Interpretations)and the Corporations Regulations 2001.
b.
c.
KPMG
Dr Andries B TerblanchéPartner
Sydney
20th August 2008
We believe that the audit evidence we have obtained is sufficient and appropriate to provide a basis for our audit opinion.
the remuneration report on pages 17 to 35 of the directors’ report complies with Section 300A of the Corporations Act 2001 .
the financial report of the consolidated entity also complies with International Financial Reporting Standards as disclosed in note 2.
An audit also includes evaluating the appropriateness of accounting policies used and the reasonableness of accounting estimates made by the directors, as well as evaluating the overall presentation of the financial report and the remuneration report contained in the directors’ report.
We performed the procedures to assess whether in all material respects the financial report presents fairly, in accordance with the Corporations Act 2001 and Australian Accounting Standards (including the Australian Accounting Interpretations), a view which is consistent with our understanding of the Company’s and the Consolidated Entity's financial position and of their performance and whether the remuneration report is in accordance with Section 300A of the Corporations Act 2001.
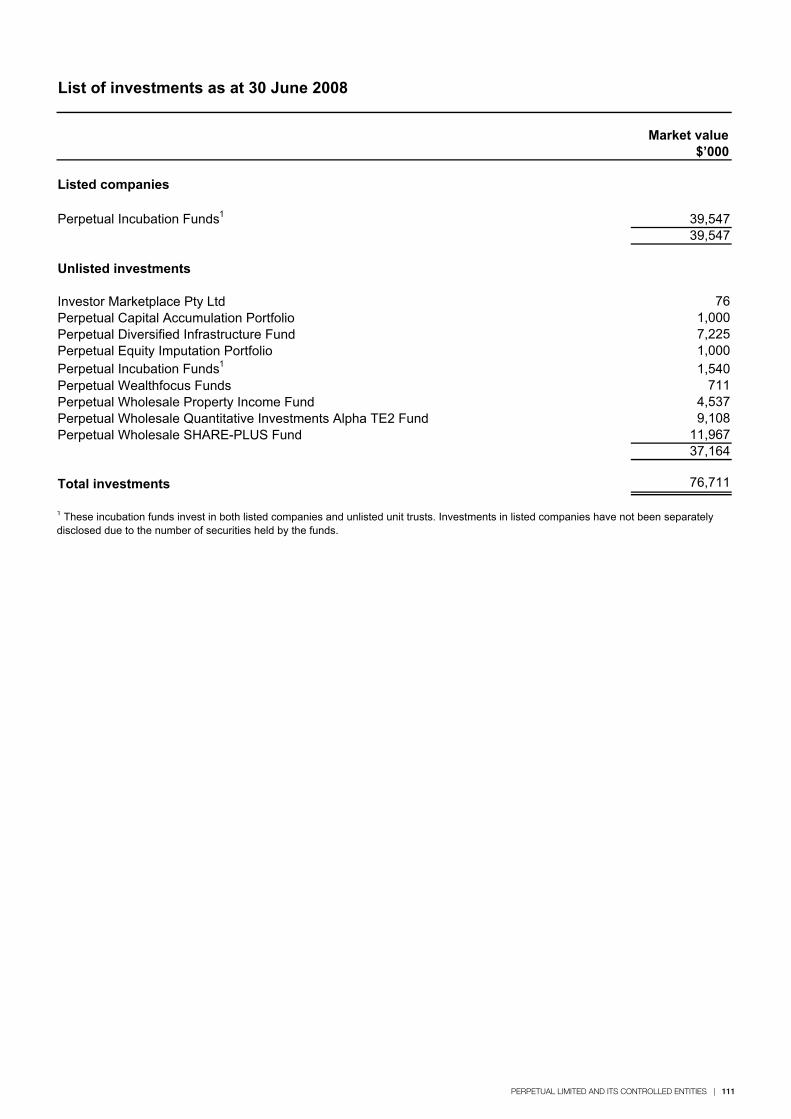
PERPETUAL LIMITED AND ITS CONTROLLED ENTITIES | 111
List of investments as at 30 June 2008
Market value$’000
Listed companies
Perpetual Incubation Funds1 39,54739,547
Unlisted investments
Investor Marketplace Pty Ltd 76Perpetual Capital Accumulation Portfolio 1,000Perpetual Diversified Infrastructure Fund 7,225Perpetual Equity Imputation Portfolio 1,000Perpetual Incubation Funds1 1,540Perpetual Wealthfocus Funds 711Perpetual Wholesale Property Income Fund 4,537Perpetual Wholesale Quantitative Investments Alpha TE2 Fund 9,108Perpetual Wholesale SHARE-PLUS Fund 11,967
37,164
Total investments 76,711
1 These incubation funds invest in both listed companies and unlisted unit trusts. Investments in listed companies have not been separately disclosed due to the number of securities held by the funds.
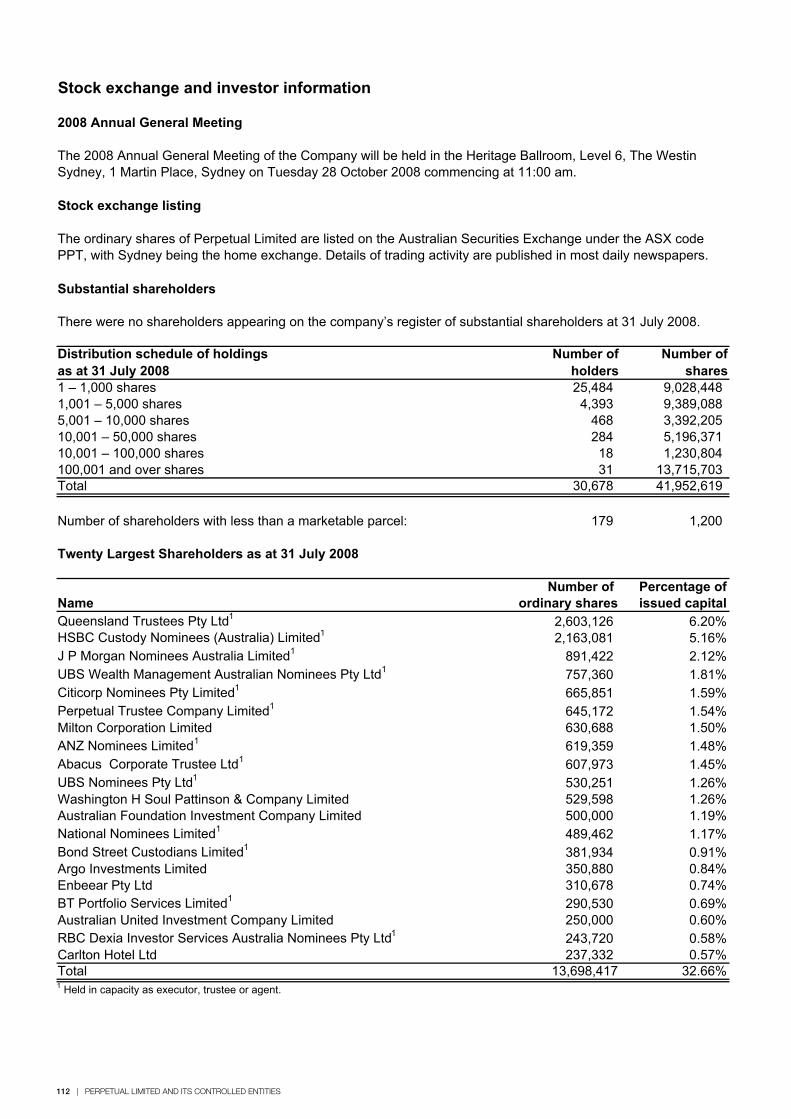
112 | PERPETUAL LIMITED AND ITS CONTROLLED ENTITIES
Stock exchange and investor information
2008 Annual General Meeting
Stock exchange listing
Substantial shareholders
There were no shareholders appearing on the company’s register of substantial shareholders at 31 July 2008.
Distribution schedule of holdingsas at 31 July 2008
Number of holders
Number of shares
1 – 1,000 shares 25,484 9,028,448 1,001 – 5,000 shares 4,393 9,389,088 5,001 – 10,000 shares 468 3,392,205 10,001 – 50,000 shares 284 5,196,371 10,001 – 100,000 shares 18 1,230,804 100,001 and over shares 31 13,715,703 Total 30,678 41,952,619
Number of shareholders with less than a marketable parcel: 179 1,200
Twenty Largest Shareholders as at 31 July 2008
Number of Percentage ofName ordinary shares issued capitalQueensland Trustees Pty Ltd1 2,603,126 6.20%HSBC Custody Nominees (Australia) Limited1 2,163,081 5.16%J P Morgan Nominees Australia Limited1 891,422 2.12%UBS Wealth Management Australian Nominees Pty Ltd1 757,360 1.81%Citicorp Nominees Pty Limited1 665,851 1.59%Perpetual Trustee Company Limited1 645,172 1.54%Milton Corporation Limited 630,688 1.50%ANZ Nominees Limited1 619,359 1.48%Abacus Corporate Trustee Ltd1 607,973 1.45%UBS Nominees Pty Ltd1 530,251 1.26%Washington H Soul Pattinson & Company Limited 529,598 1.26%Australian Foundation Investment Company Limited 500,000 1.19%National Nominees Limited1 489,462 1.17%Bond Street Custodians Limited1 381,934 0.91%Argo Investments Limited 350,880 0.84%Enbeear Pty Ltd 310,678 0.74%BT Portfolio Services Limited1 290,530 0.69%Australian United Investment Company Limited 250,000 0.60%RBC Dexia Investor Services Australia Nominees Pty Ltd1 243,720 0.58%Carlton Hotel Ltd 237,332 0.57%Total 13,698,417 32.66%1 Held in capacity as executor, trustee or agent.
The 2008 Annual General Meeting of the Company will be held in the Heritage Ballroom, Level 6, The Westin Sydney, 1 Martin Place, Sydney on Tuesday 28 October 2008 commencing at 11:00 am.
The ordinary shares of Perpetual Limited are listed on the Australian Securities Exchange under the ASX code PPT, with Sydney being the home exchange. Details of trading activity are published in most daily newspapers.
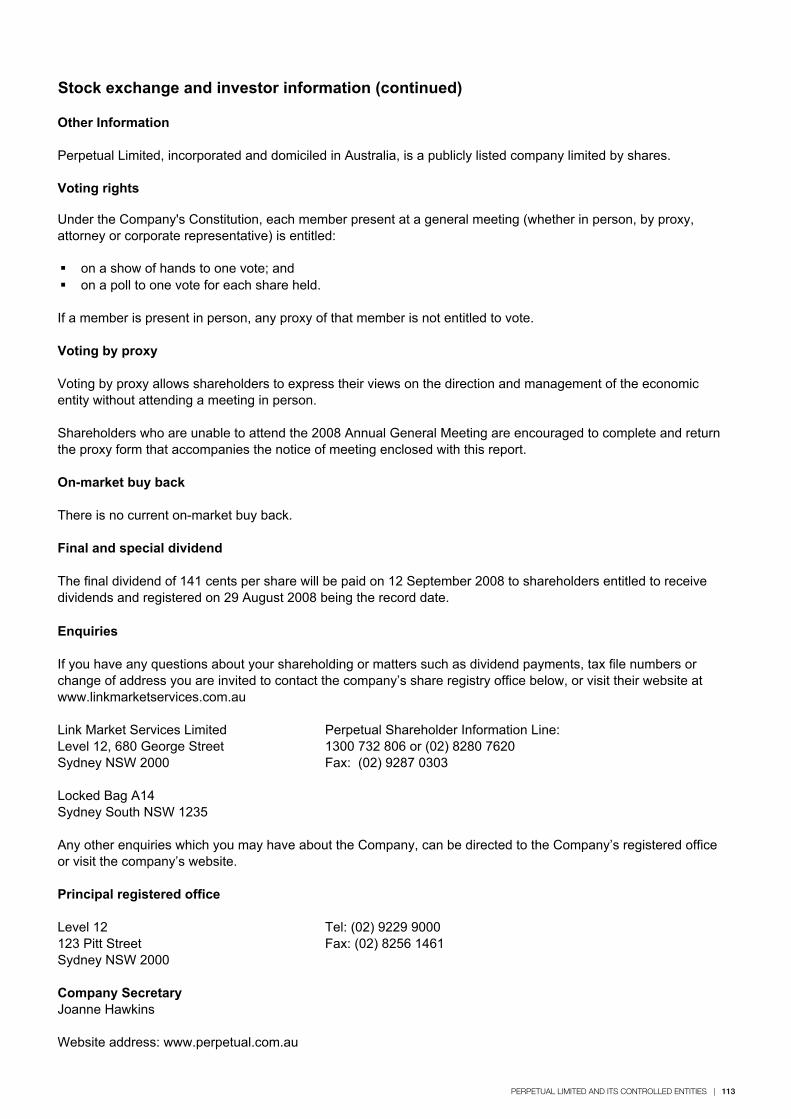
PERPETUAL LIMITED AND ITS CONTROLLED ENTITIES | 113
Stock exchange and investor information (continued)
Other Information
Perpetual Limited, incorporated and domiciled in Australia, is a publicly listed company limited by shares.
Voting rights
on a show of hands to one vote; and
If a member is present in person, any proxy of that member is not entitled to vote.
Voting by proxy
On-market buy back
There is no current on-market buy back.
Final and special dividend
Enquiries
Link Market Services Limited Perpetual Shareholder Information Line:Level 12, 680 George Street 1300 732 806 or (02) 8280 7620Sydney NSW 2000 Fax: (02) 9287 0303
Locked Bag A14Sydney South NSW 1235
Principal registered office
Level 12 Tel: (02) 9229 9000123 Pitt Street Fax: (02) 8256 1461Sydney NSW 2000
Company Secretary Joanne Hawkins
Website address: www.perpetual.com.au
If you have any questions about your shareholding or matters such as dividend payments, tax file numbers or change of address you are invited to contact the company’s share registry office below, or visit their website at www.linkmarketservices.com.au
Any other enquiries which you may have about the Company, can be directed to the Company’s registered office or visit the company’s website.
Under the Company's Constitution, each member present at a general meeting (whether in person, by proxy, attorney or corporate representative) is entitled:
Voting by proxy allows shareholders to express their views on the direction and management of the economic entity without attending a meeting in person.
Shareholders who are unable to attend the 2008 Annual General Meeting are encouraged to complete and return the proxy form that accompanies the notice of meeting enclosed with this report.
The final dividend of 141 cents per share will be paid on 12 September 2008 to shareholders entitled to receive dividends and registered on 29 August 2008 being the record date.
on a poll to one vote for each share held.
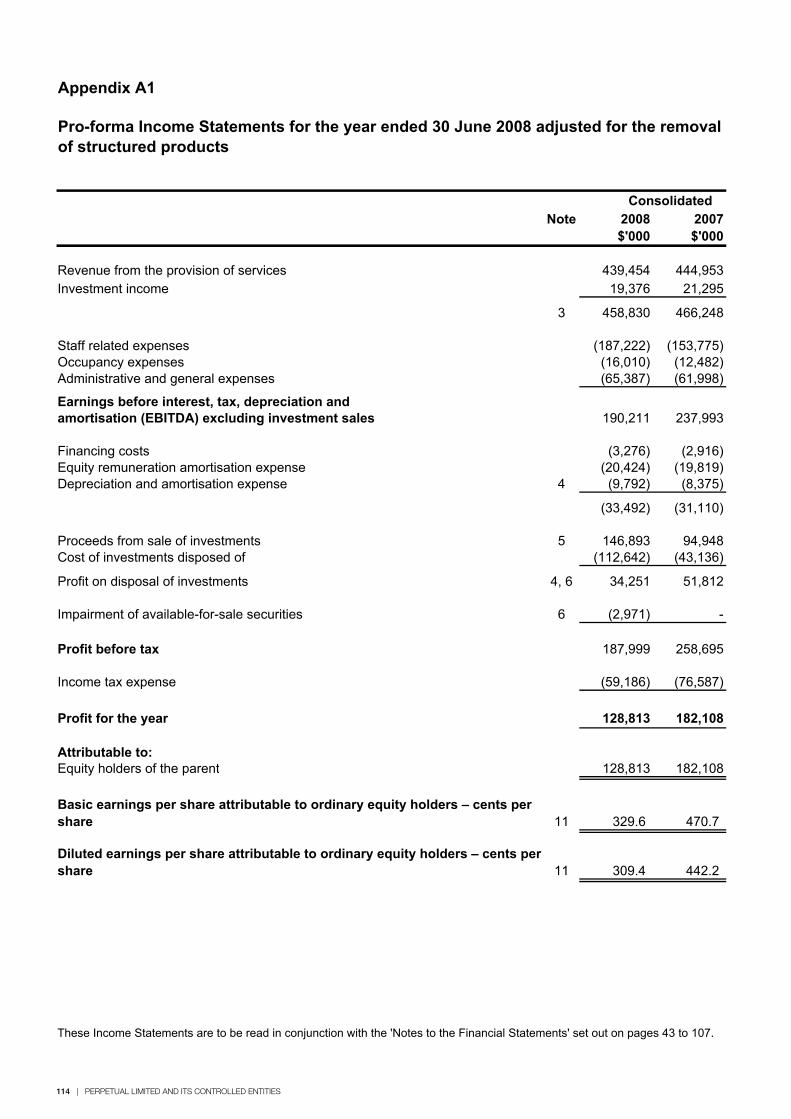
114 | PERPETUAL LIMITED AND ITS CONTROLLED ENTITIES
Appendix A1
Note 2008 2007$'000 $'000
Revenue from the provision of services 439,454 444,953Investment income 19,376 21,295
3 458,830 466,248
Staff related expenses (187,222) (153,775)Occupancy expenses (16,010) (12,482)Administrative and general expenses (65,387) (61,998)
Earnings before interest, tax, depreciation and amortisation (EBITDA) excluding investment sales 190,211 237,993
Financing costs (3,276) (2,916)Equity remuneration amortisation expense (20,424) (19,819)Depreciation and amortisation expense 4 (9,792) (8,375)
(33,492) (31,110)
Proceeds from sale of investments 5 146,893 94,948Cost of investments disposed of (112,642) (43,136)
Profit on disposal of investments 4, 6 34,251 51,812
Impairment of available-for-sale securities 6 (2,971) -
Profit before tax 187,999 258,695
Income tax expense (59,186) (76,587)
Profit for the year 128,813 182,108
Attributable to:Equity holders of the parent 128,813 182,108
11 329.6 470.7
11 309.4 442.2
Pro-forma Income Statements for the year ended 30 June 2008 adjusted for the removal of structured products
Basic earnings per share attributable to ordinary equity holders – cents per share
Diluted earnings per share attributable to ordinary equity holders – cents per share
These Income Statements are to be read in conjunction with the 'Notes to the Financial Statements' set out on pages 43 to 107.
Consolidated
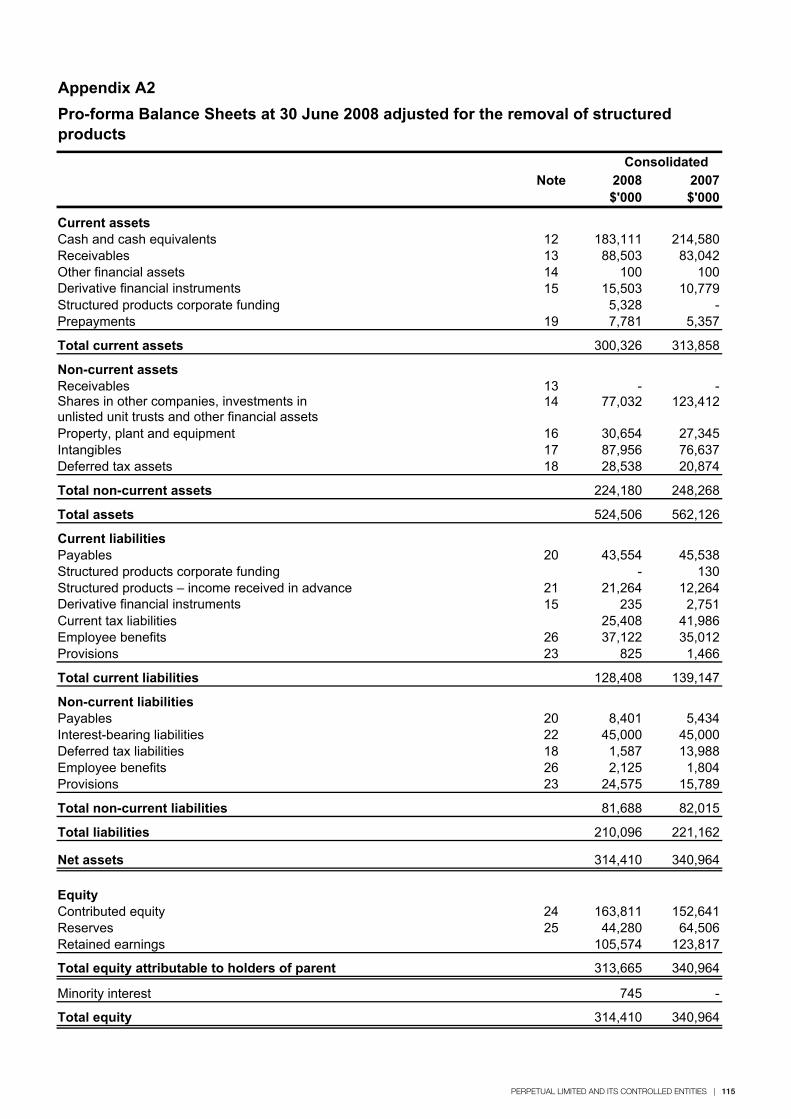
PERPETUAL LIMITED AND ITS CONTROLLED ENTITIES | 115
Appendix A2
Note 2008 2007$'000 $'000
Current assetsCash and cash equivalents 12 183,111 214,580Receivables 13 88,503 83,042Other financial assets 14 100 100Derivative financial instruments 15 15,503 10,779Structured products corporate funding 5,328 -Prepayments 19 7,781 5,357
Total current assets 300,326 313,858
Non-current assetsReceivables 13 - -Shares in other companies, investments in 14 77,032 123,412unlisted unit trusts and other financial assets Property, plant and equipment 16 30,654 27,345Intangibles 17 87,956 76,637Deferred tax assets 18 28,538 20,874
Total non-current assets 224,180 248,268
Total assets 524,506 562,126
Current liabilitiesPayables 20 43,554 45,538Structured products corporate funding - 130Structured products – income received in advance 21 21,264 12,264Derivative financial instruments 15 235 2,751Current tax liabilities 25,408 41,986Employee benefits 26 37,122 35,012Provisions 23 825 1,466
Total current liabilities 128,408 139,147
Non-current liabilitiesPayables 20 8,401 5,434Interest-bearing liabilities 22 45,000 45,000Deferred tax liabilities 18 1,587 13,988Employee benefits 26 2,125 1,804Provisions 23 24,575 15,789
Total non-current liabilities 81,688 82,015
Total liabilities 210,096 221,162
Net assets 314,410 340,964
EquityContributed equity 24 163,811 152,641Reserves 25 44,280 64,506Retained earnings 105,574 123,817
Total equity attributable to holders of parent 313,665 340,964
Minority interest 745 -
Total equity 314,410 340,964
Consolidated
These Balance Sheets are to be read in conjunction with the 'Notes to the Financial Statements' set out on pages 43 to 107.
Pro-forma Balance Sheets at 30 June 2008 adjusted for the removal of structured products
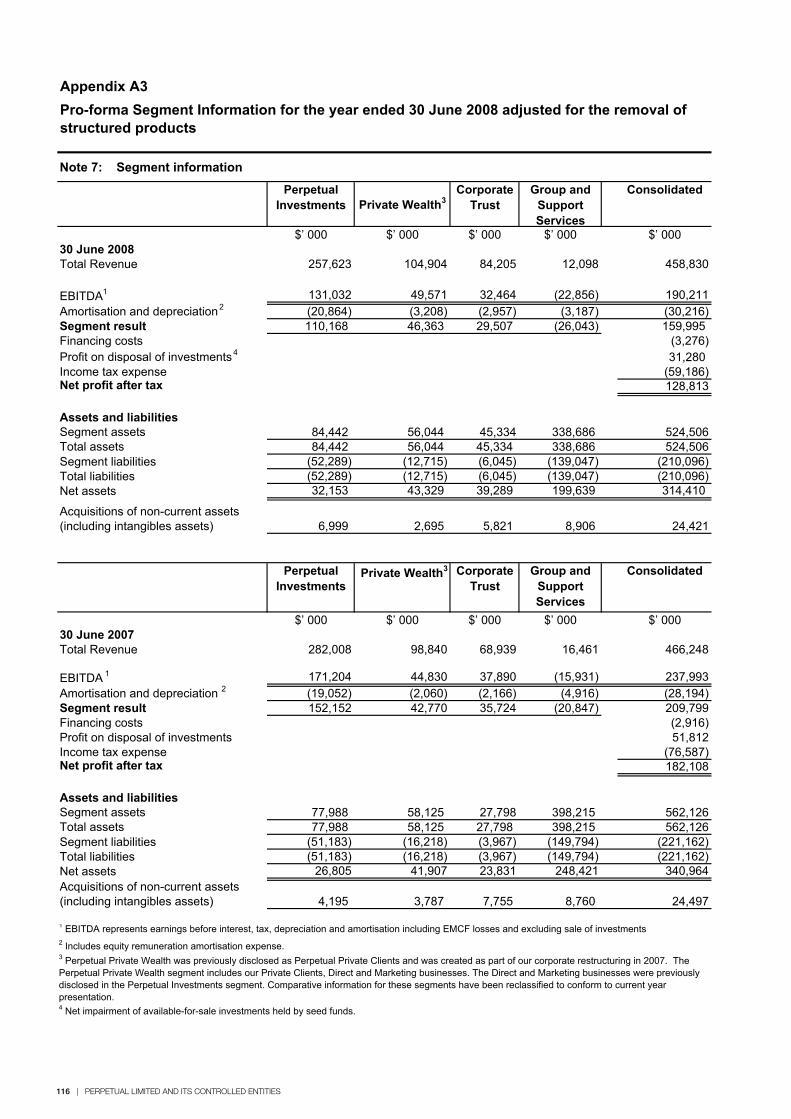
116 | PERPETUAL LIMITED AND ITS CONTROLLED ENTITIES
Appendix A3
Note 7: Segment information
$’ 000 $’ 000 $’ 000 $’ 000 $’ 00030 June 2008Total Revenue 257,623 104,904 84,205 12,098 458,830
EBITDA1 131,032 49,571 32,464 (22,856) 190,211(20,864) (3,208) (2,957) (3,187) (30,216)
Segment result 110,168 46,363 29,507 (26,043) 159,995 Financing costs (3,276)Profit on disposal of investments4 31,280Income tax expense (59,186)Net profit after tax 128,813
Assets and liabilitiesSegment assets 84,442 56,044 45,334 338,686 524,506Total assets 84,442 56,044 45,334 338,686 524,506Segment liabilities (52,289) (12,715) (6,045) (139,047) (210,096)Total liabilities (52,289) (12,715) (6,045) (139,047) (210,096)Net assets 32,153 43,329 39,289 199,639 314,410
6,999 2,695 5,821 8,906 24,421
$’ 000 $’ 000 $’ 000 $’ 000 $’ 00030 June 2007Total Revenue 282,008 98,840 68,939 16,461 466,248
EBITDA 1 171,204 44,830 37,890 (15,931) 237,993(19,052) (2,060) (2,166) (4,916) (28,194)
Segment result 152,152 42,770 35,724 (20,847) 209,799Financing costs (2,916)Profit on disposal of investments 51,812Income tax expense (76,587)Net profit after tax 182,108
Assets and liabilitiesSegment assets 77,988 58,125 27,798 398,215 562,126Total assets 77,988 58,125 27,798 398,215 562,126Segment liabilities (51,183) (16,218) (3,967) (149,794) (221,162)Total liabilities (51,183) (16,218) (3,967) (149,794) (221,162)Net assets 26,805 41,907 23,831 248,421 340,964
4,195 3,787 7,755 8,760 24,497
1 EBITDA represents earnings before interest, tax, depreciation and amortisation including EMCF losses and excluding sale of investments
4 Net impairment of available-for-sale investments held by seed funds.
Acquisitions of non-current assets (including intangibles assets)
Amortisation and depreciation2
Pro-forma Segment Information for the year ended 30 June 2008 adjusted for the removal of structured products
Consolidated
3 Perpetual Private Wealth was previously disclosed as Perpetual Private Clients and was created as part of our corporate restructuring in 2007. The Perpetual Private Wealth segment includes our Private Clients, Direct and Marketing businesses. The Direct and Marketing businesses were previously disclosed in the Perpetual Investments segment. Comparative information for these segments have been reclassified to conform to current year presentation.
Acquisitions of non-current assets (including intangibles assets)
2 Includes equity remuneration amortisation expense.
PerpetualInvestments Private Wealth3
CorporateTrust
Group and SupportServices
PerpetualInvestments
Group and SupportServices
Consolidated
Amortisation and depreciation 2
Private Wealth3 CorporateTrust

2407
7_B
CP
GA
R1_
B_0
808
Experience. The difference.