Embed Size (px)
Citation preview
Experiences using a local AVHRR receiving station to assist monitoring of Central
American volcanoes
Peter Webley KCL
AVHRR Real time Volcano Monitoring Project AVHRR Real time Volcano Monitoring Project
ObjectivesObjectives Improve geological and geotechnical hazard avoidance capacity Improve capacity for low cost, rapid hazard, risk and vulnerability assessment Development systems for maintaining and improving national geoscience
information Assess the capability of remote sensing for enhancing operational volcano
monitoring Incorporates both geophysical and social science components
AVHRR Real time Volcano Monitoring Project AVHRR Real time Volcano Monitoring Project Accomplishments
Installation of the AVHRR receiving station Provided the software to allow the INETER staff to capture the data in real time Designed and installed automated capture and analysis system Carried out extensive case studies into the application of AVHRR to monitor and detect
thermal volcanic activity Designed analysis system to monitor volcanoes in Nicaragua, Guatemala, El Salvador
and Costa Rica Development of web based interface for data download and thermal monitoring Multi-National Workshop in Nicaragua during March 2004
Developments Thermal fingerprint to detect eruption E-mail alert system Assessment of operational use of system Ash cloud monitoring system
Co-operating Countries and PartnersCo-operating Countries and Partners
CountriesCountries Nicaragua, Guatemala, Costa Rica and El SalvadorNicaragua, Guatemala, Costa Rica and El Salvador UK, USA and JapanUK, USA and Japan
PartnersPartners BURS – Bradford University Remote SensingBURS – Bradford University Remote Sensing KCL – Kings College LondonKCL – Kings College London INETER - Instituto Nicaraguense de Estudios Territoriales INETER - Instituto Nicaraguense de Estudios Territoriales CONRED - Comisión Nacional para Reducción de Desastres CONRED - Comisión Nacional para Reducción de Desastres INSIVUMEH – Instituto Nacional de Sismologia, Vulcanologia, Meteorologia e Hidrologia. INSIVUMEH – Instituto Nacional de Sismologia, Vulcanologia, Meteorologia e Hidrologia. SNET - Servicio Nacional de Estudios TerritorialesSNET - Servicio Nacional de Estudios Territoriales OVSICORI - Observatorio Vulcanológico y Sismológico de Costa Rica OVSICORI - Observatorio Vulcanológico y Sismológico de Costa Rica MTU – Michigan Technology UniversityMTU – Michigan Technology University University of TokyoUniversity of Tokyo
AVHRR Receiving Station and DataAVHRR Receiving Station and Data
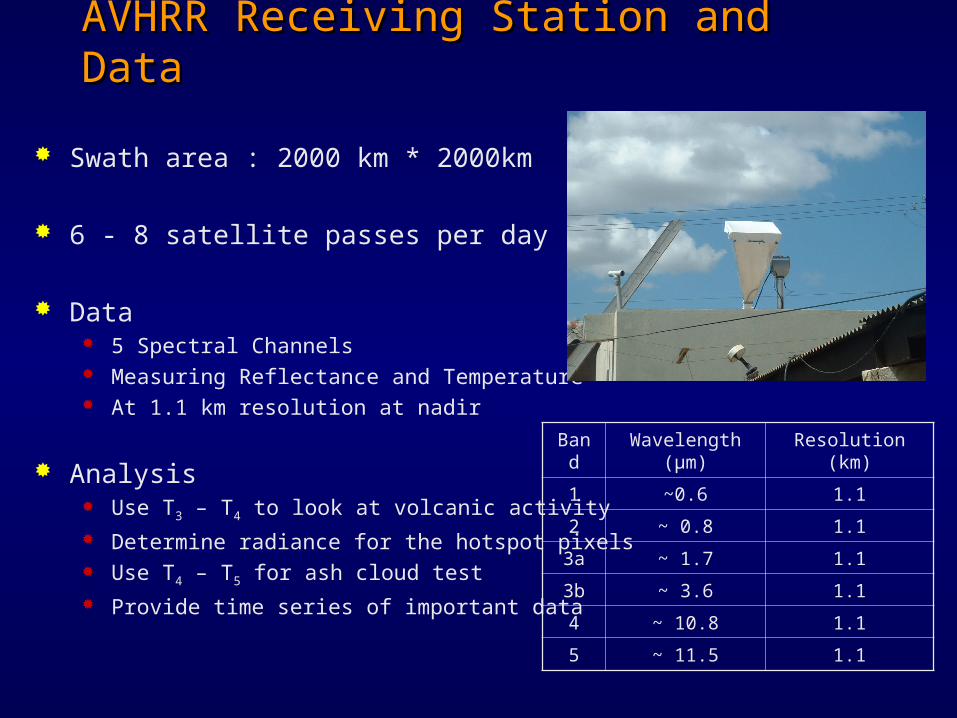
Swath area : 2000 km * 2000km
6 - 8 satellite passes per day
Data 5 Spectral Channels Measuring Reflectance and Temperature At 1.1 km resolution at nadir
Analysis Use T3 – T4 to look at volcanic activity Determine radiance for the hotspot pixels Use T4 – T5 for ash cloud test Provide time series of important data
Band Wavelength (μm)
Resolution (km)
1 ~0.6 1.1
2 ~ 0.8 1.1
3a ~ 1.7 1.1
3b ~ 3.6 1.1
4 ~ 10.8 1.1
5 ~ 11.5 1.1
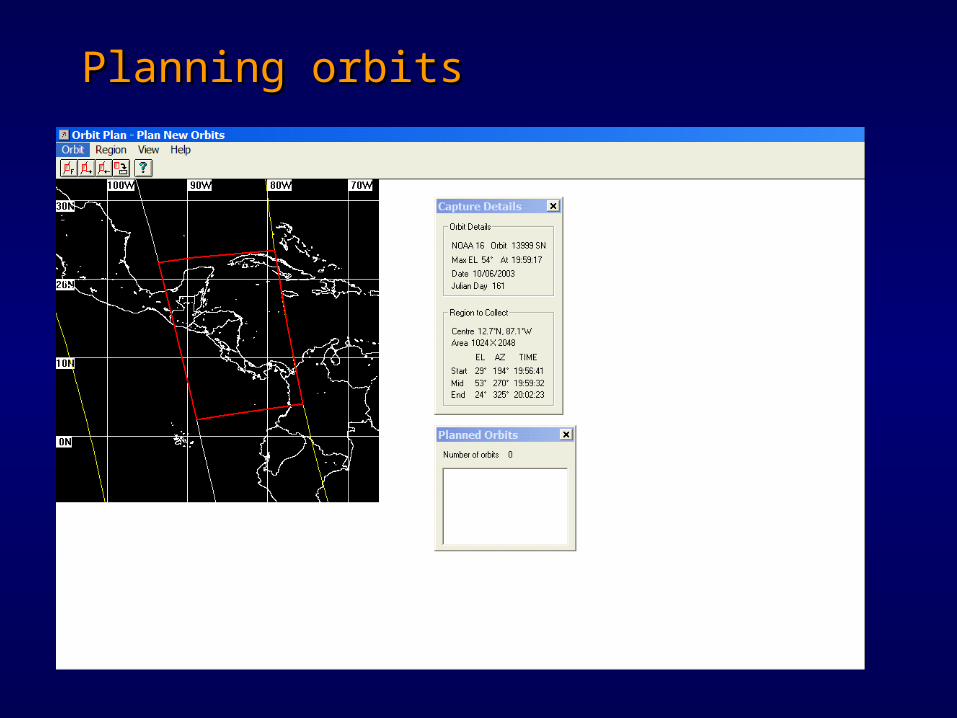
Planning orbitsPlanning orbits
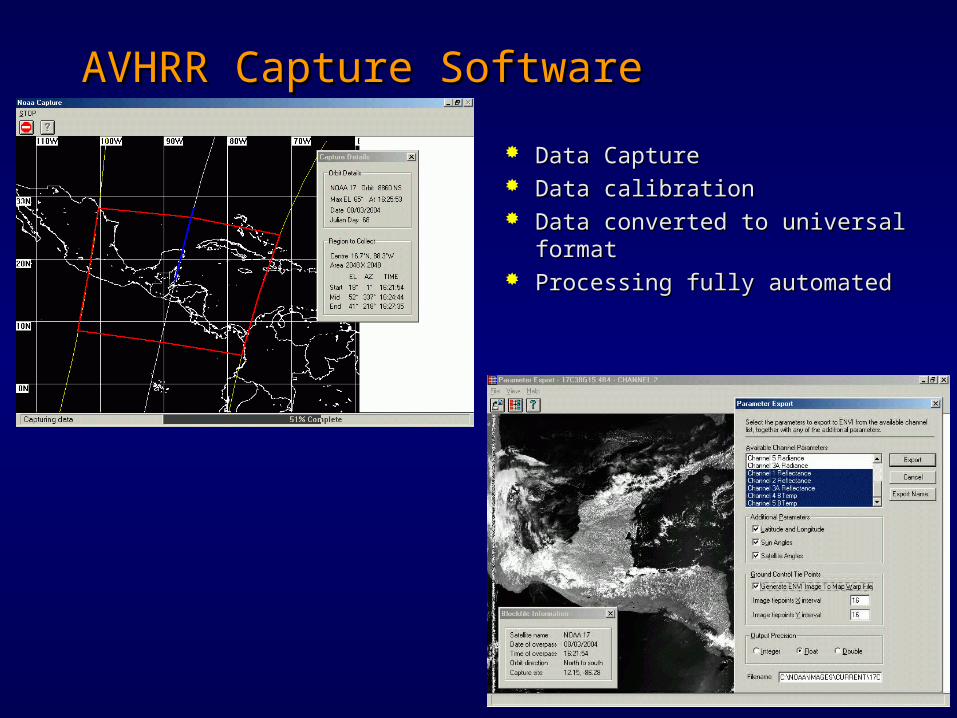
AVHRR Capture SoftwareAVHRR Capture Software
Data CaptureData Capture Data calibrationData calibration Data converted to universal formatData converted to universal format Processing fully automatedProcessing fully automated
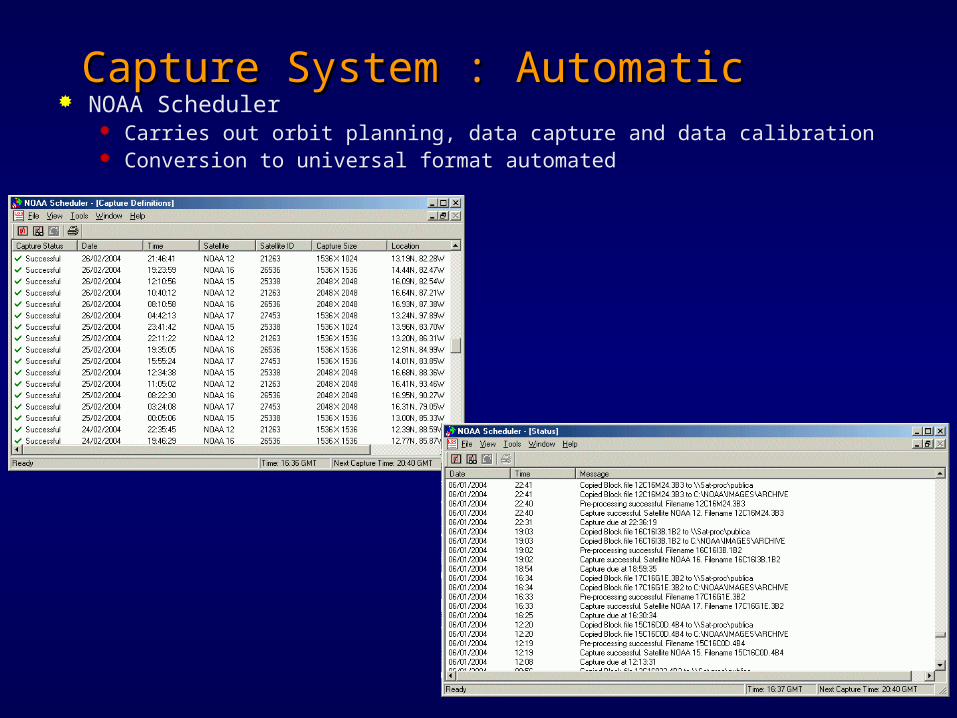
Capture System : AutomaticCapture System : Automatic NOAA Scheduler
Carries out orbit planning, data capture and data calibration Conversion to universal format automated
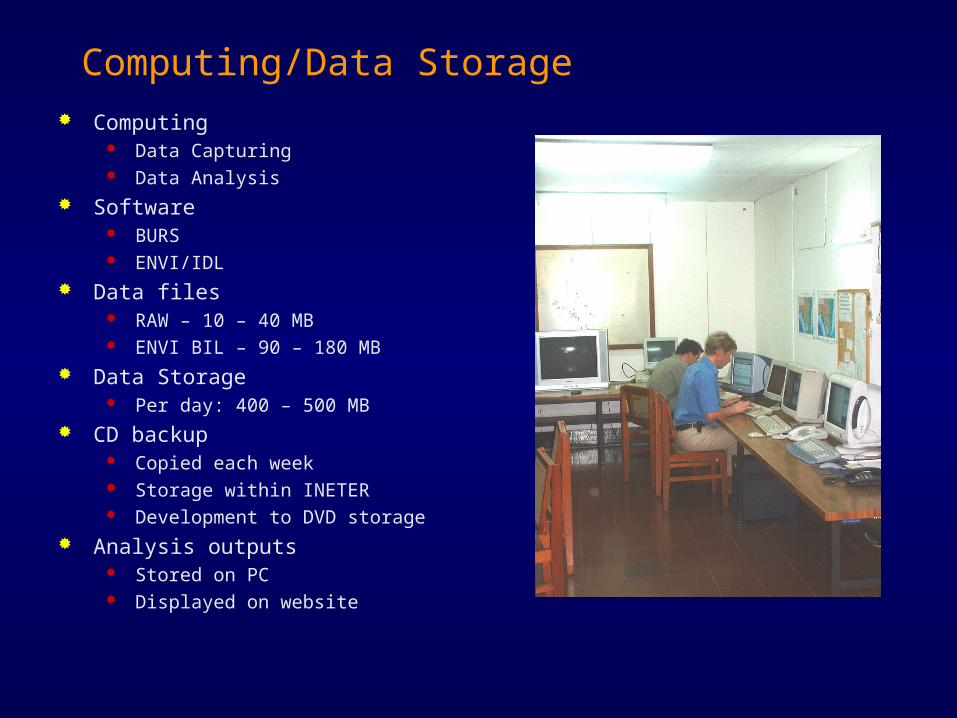
Computing/Data Storage Computing
Data Capturing Data Analysis
Software BURS ENVI/IDL
Data files RAW – 10 – 40 MB ENVI BIL – 90 – 180 MB
Data Storage Per day: 400 – 500 MB
CD backup Copied each week Storage within INETER Development to DVD storage
Analysis outputs Stored on PC Displayed on website
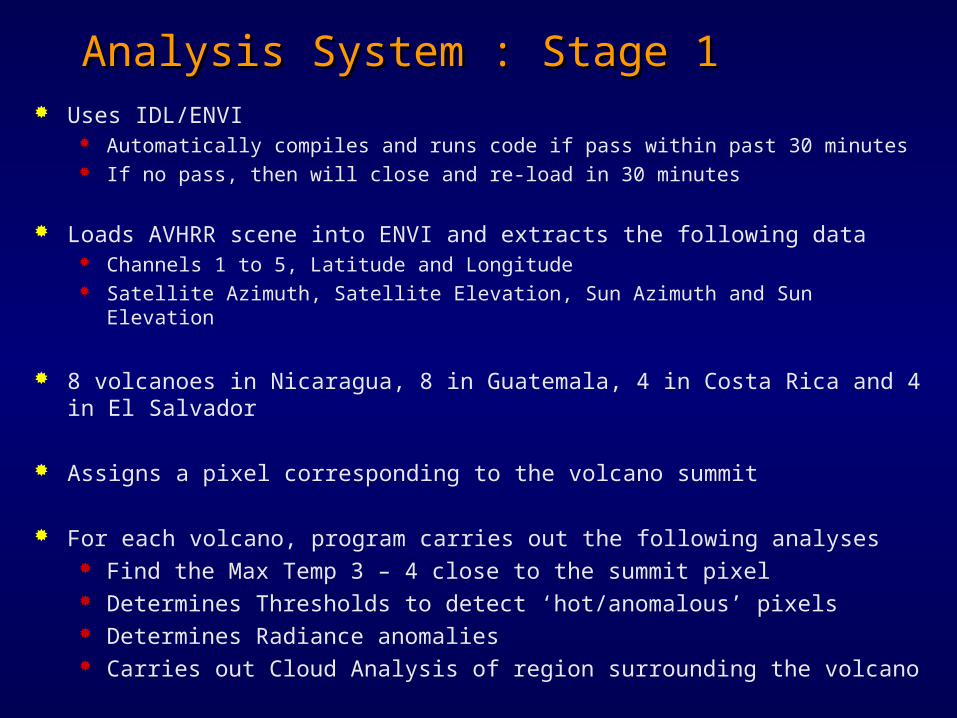
Analysis System : Stage 1Analysis System : Stage 1 Uses IDL/ENVI
Automatically compiles and runs code if pass within past 30 minutes If no pass, then will close and re-load in 30 minutes
Loads AVHRR scene into ENVI and extracts the following data Channels 1 to 5, Latitude and Longitude Satellite Azimuth, Satellite Elevation, Sun Azimuth and Sun Elevation
8 volcanoes in Nicaragua, 8 in Guatemala, 4 in Costa Rica and 4 in El Salvador
Assigns a pixel corresponding to the volcano summit
For each volcano, program carries out the following analyses Find the Max Temp 3 – 4 close to the summit pixel Determines Thresholds to detect ‘hot/anomalous’ pixels Determines Radiance anomalies Carries out Cloud Analysis of region surrounding the volcano

Analysis System : Stage 2Analysis System : Stage 2 Finds the Maximum Temp 3 – 4 value in a 7 by 7 grid from summit pixel
Determines this is be an anomalous pixel and creates 7 by 7 grid around hotspot pixel
Determines the mean and standard deviation of this new array
Analyses to determine which pixels are anomalous. If none, then no radiance calculations
Uses these anomalous pixels in Radiance calculations
2*434343
TTT
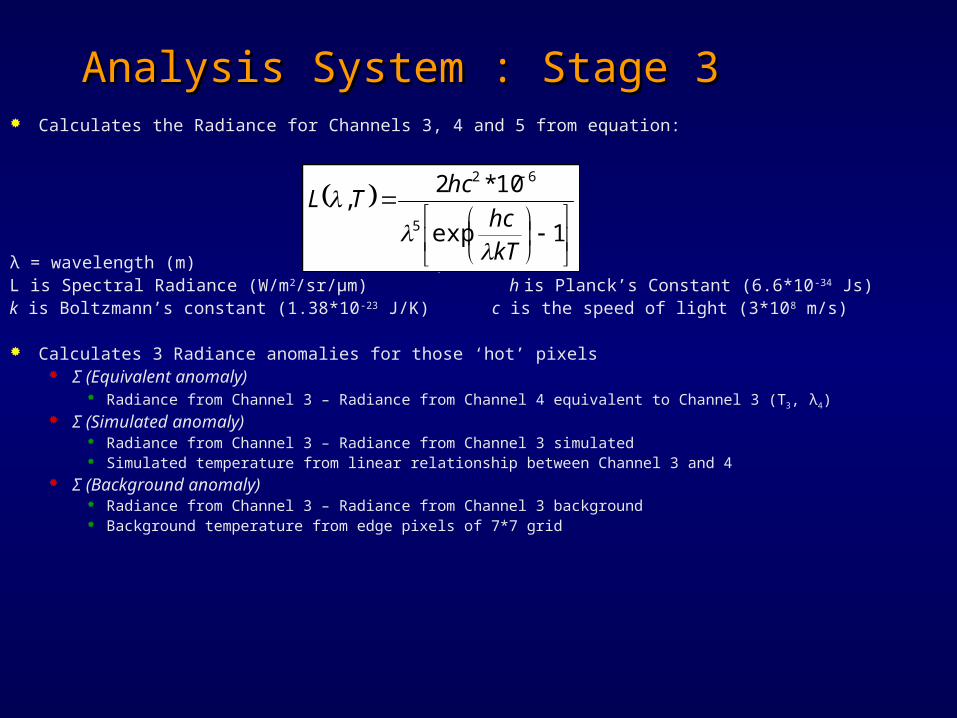
Analysis System : Stage 3Analysis System : Stage 3 Calculates the Radiance for Channels 3, 4 and 5 from equation:
λ = wavelength (m) T is temperature (K)L is Spectral Radiance (W/m2/sr/μm) h is Planck’s Constant (6.6*10-34 Js)k is Boltzmann’s constant (1.38*10-23 J/K) c is the speed of light (3*108 m/s)
Calculates 3 Radiance anomalies for those ‘hot’ pixels Σ (Equivalent anomaly)
Radiance from Channel 3 – Radiance from Channel 4 equivalent to Channel 3 (T3, λ4) Σ (Simulated anomaly)
Radiance from Channel 3 – Radiance from Channel 3 simulated Simulated temperature from linear relationship between Channel 3 and 4
Σ (Background anomaly) Radiance from Channel 3 – Radiance from Channel 3 background Background temperature from edge pixels of 7*7 grid
1exp
10*2,
5
62
kThc
hcTL
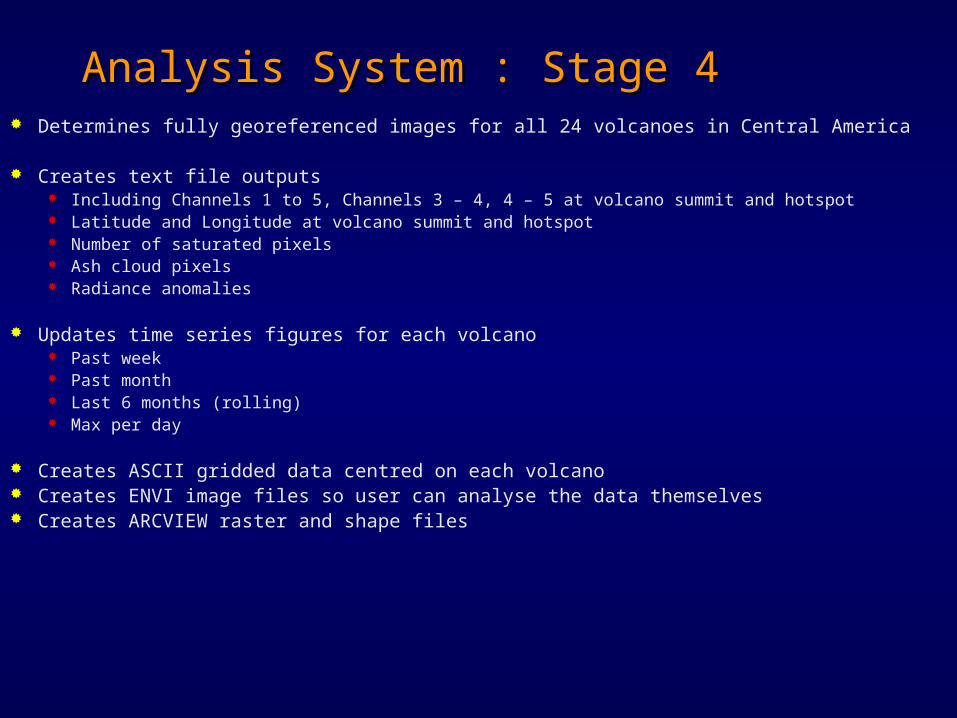
Analysis System : Stage 4Analysis System : Stage 4 Determines fully georeferenced images for all 24 volcanoes in Central America
Creates text file outputs Including Channels 1 to 5, Channels 3 – 4, 4 – 5 at volcano summit and hotspot Latitude and Longitude at volcano summit and hotspot Number of saturated pixels Ash cloud pixels Radiance anomalies
Updates time series figures for each volcano Past week Past month Last 6 months (rolling) Max per day
Creates ASCII gridded data centred on each volcano Creates ENVI image files so user can analyse the data themselves Creates ARCVIEW raster and shape files
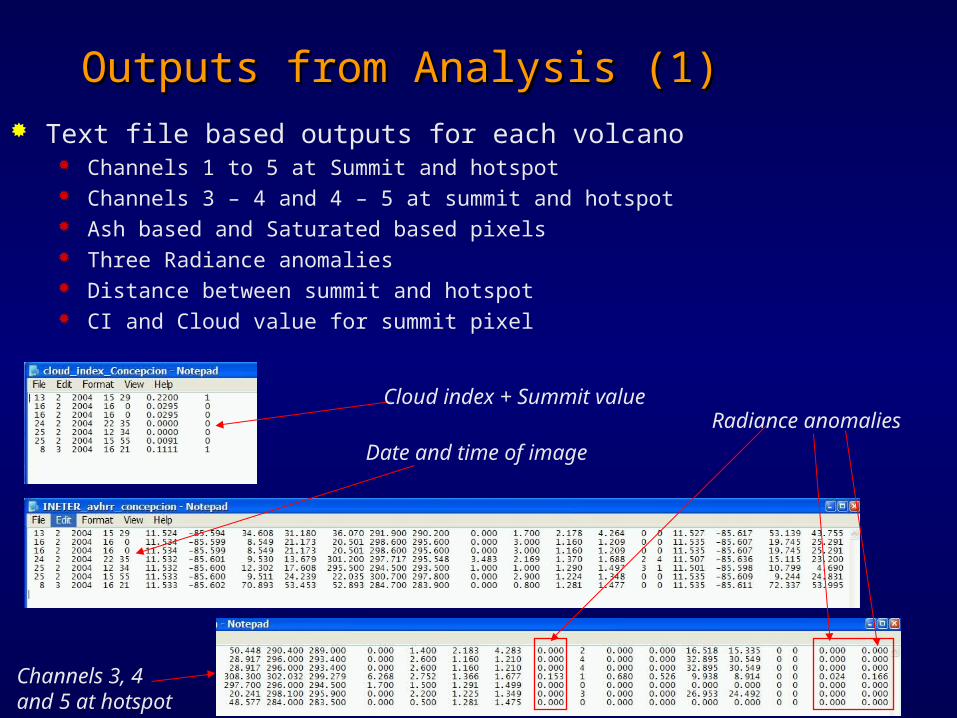
Outputs from Analysis (1)Outputs from Analysis (1) Text file based outputs for each volcano
Channels 1 to 5 at Summit and hotspot Channels 3 – 4 and 4 – 5 at summit and hotspot Ash based and Saturated based pixels Three Radiance anomalies Distance between summit and hotspot CI and Cloud value for summit pixel
Cloud index + Summit value
Date and time of image
Radiance anomalies
Channels 3, 4 and 5 at hotspot
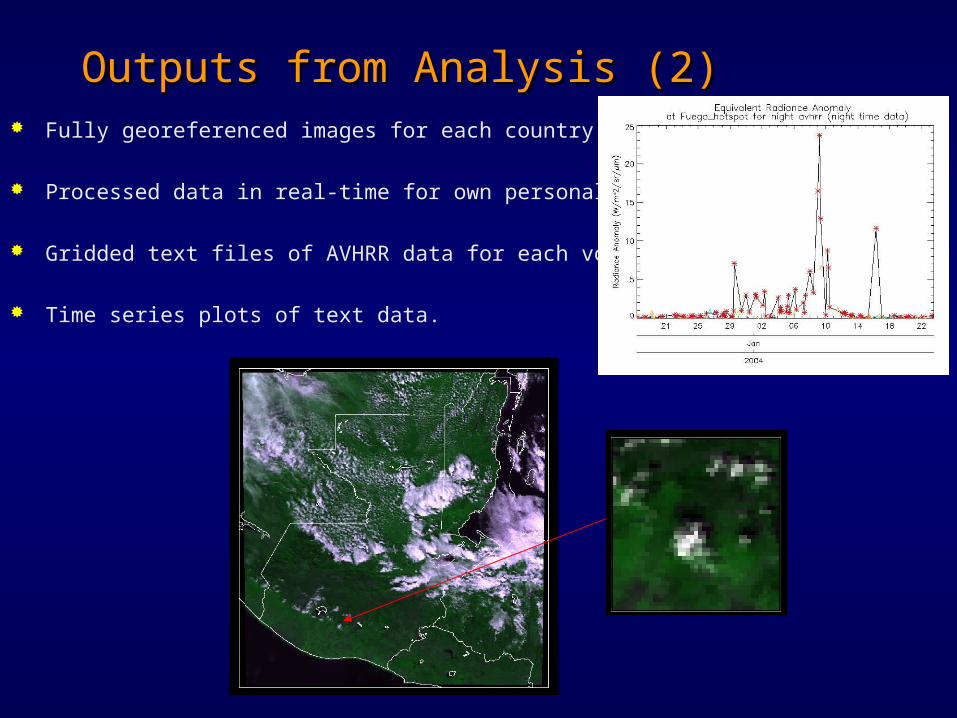
Outputs from Analysis (2)Outputs from Analysis (2) Fully georeferenced images for each country and volcano
Processed data in real-time for own personal analysis
Gridded text files of AVHRR data for each volcano
Time series plots of text data.
Data Availability Data Availability Real-time data accessible from website
Fully georeferenced imagery Time series of Radiance anomalies Gridded data around each volcano Image files to allow users to carry own analysis. Access to data by web site for all volcanoes by end of Sept 2004
Data for Research Access provided so user can order past data for research purposes. Data available from March 2003 until present Process for ordering and sending data being developed
Software required BURS. Will be supplied to interested parties ENVI. To analyse ‘img’ files. (www.rsi.com)
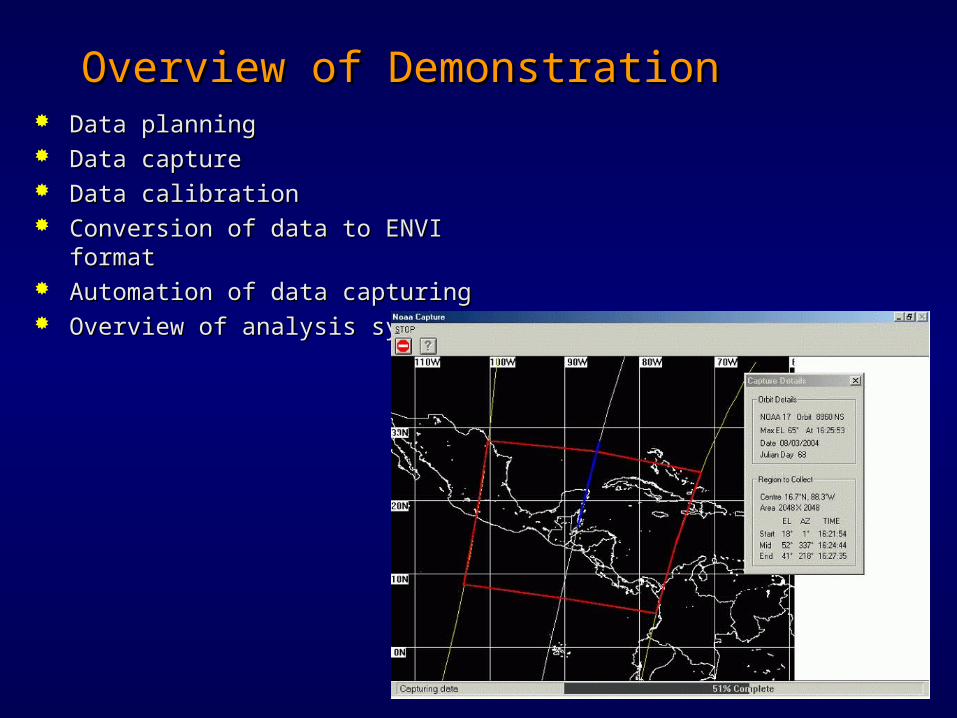
Overview of DemonstrationOverview of Demonstration Data planningData planning Data captureData capture Data calibrationData calibration Conversion of data to ENVI formatConversion of data to ENVI format Automation of data capturingAutomation of data capturing Overview of analysis systemOverview of analysis system
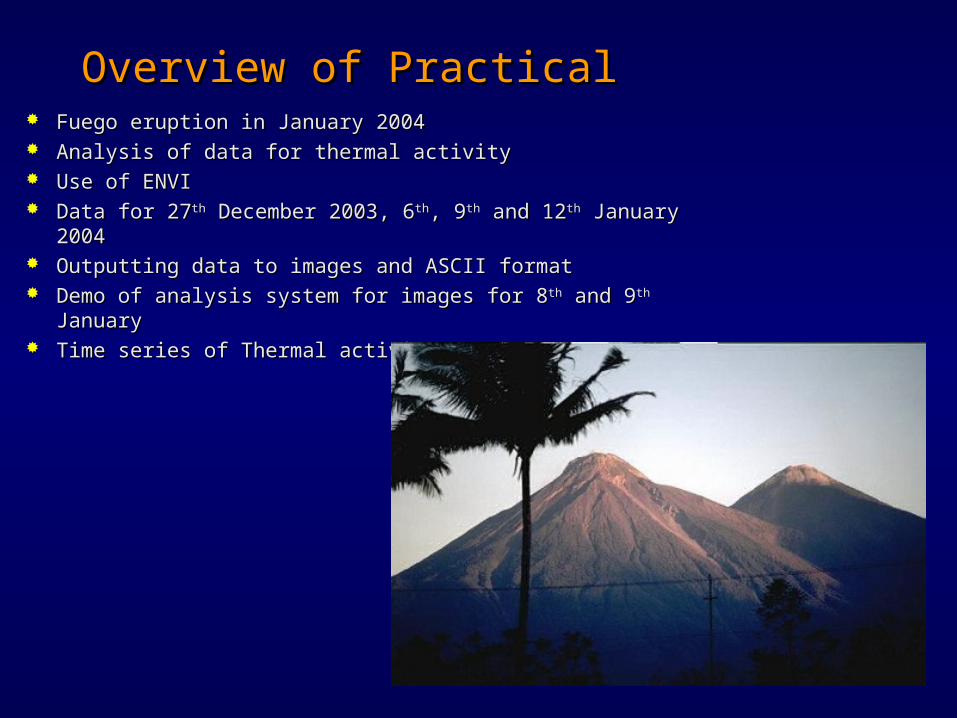
Overview of PracticalOverview of Practical Fuego eruption in January 2004Fuego eruption in January 2004 Analysis of data for thermal activityAnalysis of data for thermal activity Use of ENVIUse of ENVI Data for 27Data for 27thth December 2003, 6 December 2003, 6thth, 9, 9thth and 12 and 12thth January 2004 January 2004 Outputting data to images and ASCII formatOutputting data to images and ASCII format Demo of analysis system for images for 8Demo of analysis system for images for 8thth and 9 and 9thth January January Time series of Thermal activityTime series of Thermal activity