Embed Size (px)
Citation preview
Experiment 20. Beta Decay
Updated RWH February 13, 2017
1 Objectives
By measuring the beta energy spectrum of promethium-147 (147Pm) you will estimate themaximum energy of the beta particle in this three-body decay. In addition, you will use theelectron spectrometer to measure the momentum-energy relationship for electrons as a meansof testing the laws of special relativity.
2 Safety issues
In this experiment we are using radioactive sources. All sources are of low intensity and wellshielded. Nevertheless, you should avoid any unnecessary exposure by keeping away from thesources (r−2 dependence) and limiting the handling time. If not in use, radioactive sourcesshould stay in the lead container provided. Another safety concern is the high voltage powersupply used to power the detector. Under no circumstances switch on the high voltage powersupply if the detector unit is not under vacuum. If you noticeany exposed or damaged electricalwires, please notify laboratory staff immediately.
20–2 SENIOR PHYSICS LABORATORY
3 Introduction
3.1 Beta decay
Radioactivity can be viewed as a particular type of nuclear reaction in which the product par-ticle(s) are not emitted promptly. The average time interval between emissions can be longerthan1020 years, or as short as10−15 s. In this experiment the time interval between beta decaysis typically on the order of milliseconds.
At the beginning of the 20th century the phenomenon of radioactive decay was investigated ingreat detail and classified into three categories: alpha, beta and gamma. In the course of thiswork it was discovered that alpha and gamma were both two-body decays: an alpha particle(or gamma photon) was emitted and a recoil nucleus produced.By using the conservationof energy and momentum it can easily be shown that the sharingof the disintegration energybetween the alpha particle (or gamma photon) and the recoil nucleus is unique. Because of themass of the nucleus, most of the energy goes into the alpha (orgamma) and a tiny fraction goesinto the recoil nucleus.
The situation with beta decay is quite different because theprocess is a three-body decay. Thetwo possible decay paths are as follows:
AZXN → A
Z+1 YN−1 + e− + νe (β−)
AZXN → A
Z−1 YN+1 + e+ + νe (β+)
A process similar toβ+ decay is electron captureAZXN + e− → AZ−1 YN+1 + νe; see section 5.
As well as the beta particle (e− or e+), there must be the product nucleus of course. Howeverthere is a mysterious third particle: the electron neutrinoor electron antineutrino (depending onwhether it is a positron or electron decay). The neutrino is aneutral particle with very small orzero rest mass; see Section 6.1 It is a fermion like the electron (it has a spin of 1/2) and belongsto theleptonfamily of particles shown below.
(
e− µ− τ−
νe νµ ντ
)
The three columns denote particles of different flavours. Inthe second and third columns wehave the muon and its neutrino and the tau particle and its neutrino. All the neutrinos (in thesecond row) are uncharged and their counterparts in the top row are charged negatively. Foreach of these six particles there is an antiparticle with opposite charge; the antiparticles to theneutrinos have zero charge.1
The kinematics of a three-body decay means that the sharing of the disintegration energy amongthe three particles varies from decay to decay. Most of the disintegration energy goes to thetwo light particles and not to the heavy recoil nucleus. Conservation of momentum guarantees
1The antineutrinos observed so far all have right-handed helicity (i.e., only one of the two possible spinstates has ever been seen), while the neutrinos are left-handed. Because antineutrinos and neutrinos areneutral particles it has been suggested that they are actually the same particle, i.e., a Majorana particle(http://en.wikipedia.org/wiki/Majoranafermion).
BETA DECAY 20–3
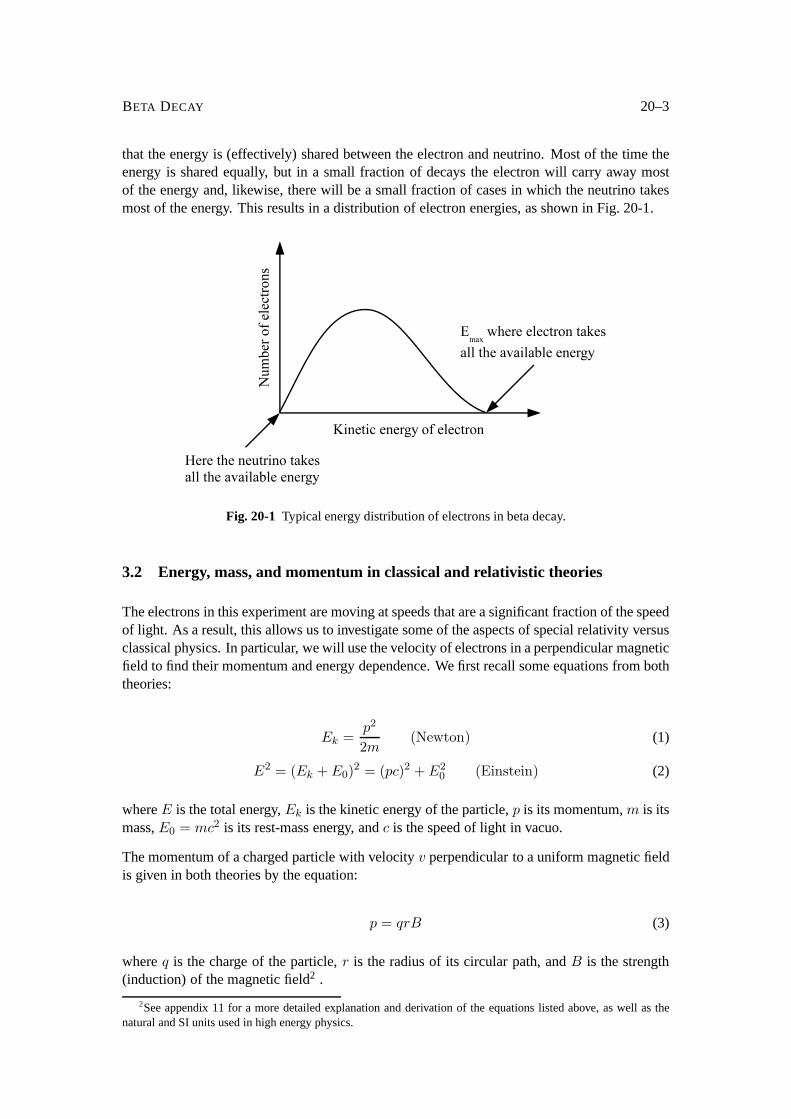
that the energy is (effectively) shared between the electron and neutrino. Most of the time theenergy is shared equally, but in a small fraction of decays the electron will carry away mostof the energy and, likewise, there will be a small fraction ofcases in which the neutrino takesmost of the energy. This results in a distribution of electron energies, as shown in Fig. 20-1.
Fig. 20-1 Typical energy distribution of electrons in beta decay.
3.2 Energy, mass, and momentum in classical and relativistic theories
The electrons in this experiment are moving at speeds that are a significant fraction of the speedof light. As a result, this allows us to investigate some of the aspects of special relativity versusclassical physics. In particular, we will use the velocity of electrons in a perpendicular magneticfield to find their momentum and energy dependence. We first recall some equations from boththeories:
Ek =p2
2m(Newton) (1)
E2 = (Ek + E0)2 = (pc)2 + E2
0 (Einstein) (2)
whereE is the total energy,Ek is the kinetic energy of the particle,p is its momentum,m is itsmass,E0 = mc2 is its rest-mass energy, andc is the speed of light in vacuo.
The momentum of a charged particle with velocityv perpendicular to a uniform magnetic fieldis given in both theories by the equation:
p = qrB (3)
whereq is the charge of the particle,r is the radius of its circular path, andB is the strength(induction) of the magnetic field2 .
2See appendix 11 for a more detailed explanation and derivation of the equations listed above, as well as thenatural and SI units used in high energy physics.
20–4 SENIOR PHYSICS LABORATORY
4 Apparatus
The electrons are detected using a surface-barrier semiconductor detector with a depletion layerof 500µm. The amplified pulses from this detector are processed by a UCS30 computer spec-trometer to produce an electron energy spectrum. Energy calibration of the UCS30 is carriedout using the internal electron conversion spectrum of207Bi; see Section 5.
In the beta particle spectrometer used later in the experiment, the electrons are accelerated by aperpendicular magnetic field. Electrons within a narrow momentum range are counted by theUCS30 spectrometer and their energy measured. This allows adirect comparison of electronenergy and momentum, enabling the electron’s mass to be measured and the effects of specialrelativity to be observed.
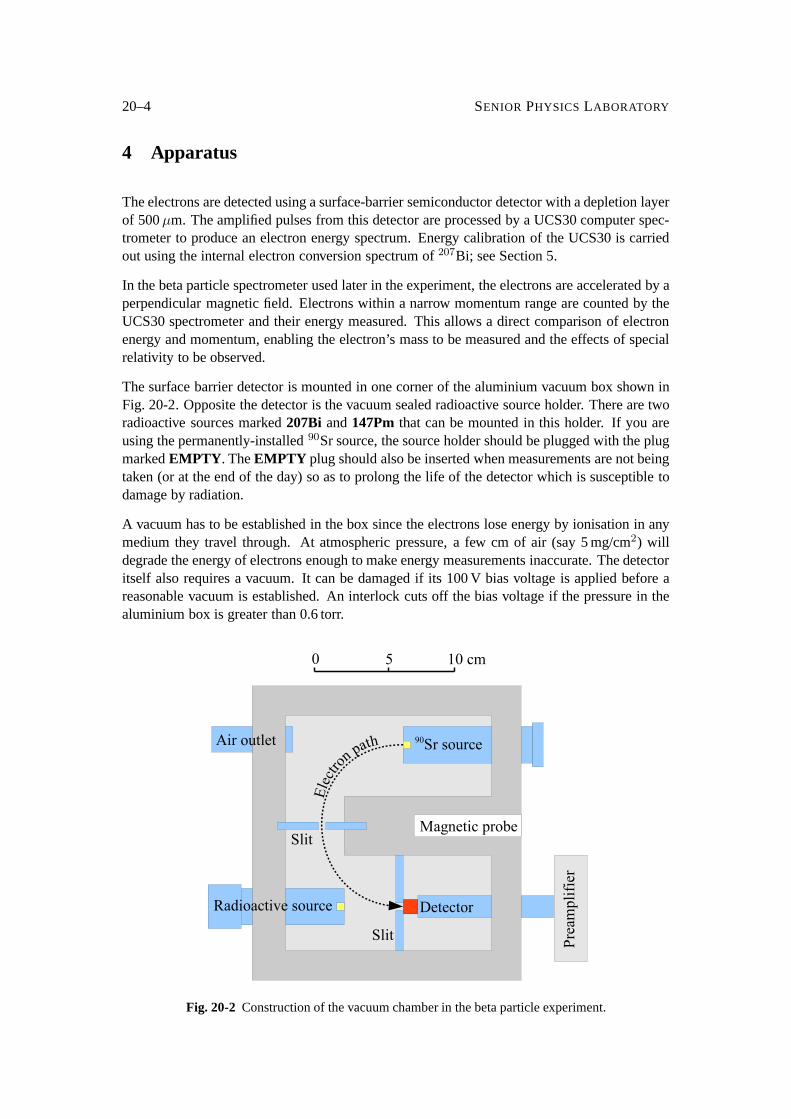
The surface barrier detector is mounted in one corner of the aluminium vacuum box shown inFig. 20-2. Opposite the detector is the vacuum sealed radioactive source holder. There are tworadioactive sources marked207Bi and147Pm that can be mounted in this holder. If you areusing the permanently-installed90Sr source, the source holder should be plugged with the plugmarkedEMPTY . TheEMPTY plug should also be inserted when measurements are not beingtaken (or at the end of the day) so as to prolong the life of the detector which is susceptible todamage by radiation.
A vacuum has to be established in the box since the electrons lose energy by ionisation in anymedium they travel through. At atmospheric pressure, a few cm of air (say 5 mg/cm2) willdegrade the energy of electrons enough to make energy measurements inaccurate. The detectoritself also requires a vacuum. It can be damaged if its 100 V bias voltage is applied before areasonable vacuum is established. An interlock cuts off thebias voltage if the pressure in thealuminium box is greater than 0.6 torr.
Fig. 20-2 Construction of the vacuum chamber in the beta particle experiment.
BETA DECAY 20–5
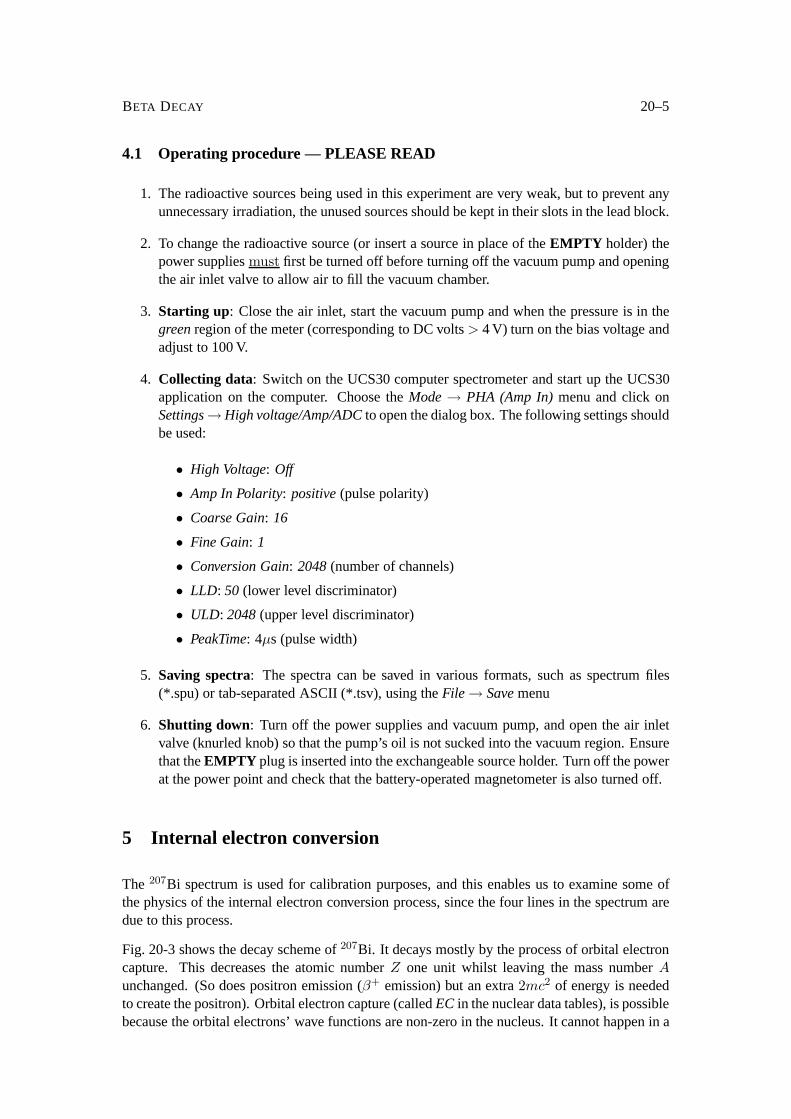
4.1 Operating procedure — PLEASE READ
1. The radioactive sources being used in this experiment arevery weak, but to prevent anyunnecessary irradiation, the unused sources should be keptin their slots in the lead block.
2. To change the radioactive source (or insert a source in place of theEMPTY holder) thepower suppliesmust first be turned off before turning off the vacuum pump and openingthe air inlet valve to allow air to fill the vacuum chamber.
3. Starting up: Close the air inlet, start the vacuum pump and when the pressure is in thegreenregion of the meter (corresponding to DC volts> 4 V) turn on the bias voltage andadjust to 100 V.
4. Collecting data: Switch on the UCS30 computer spectrometer and start up the UCS30application on the computer. Choose theMode→ PHA (Amp In)menu and click onSettings→ High voltage/Amp/ADCto open the dialog box. The following settings shouldbe used:
• High Voltage: Off
• Amp In Polarity: positive(pulse polarity)
• Coarse Gain: 16
• Fine Gain: 1
• Conversion Gain: 2048(number of channels)
• LLD: 50 (lower level discriminator)
• ULD: 2048(upper level discriminator)
• PeakTime: 4µs (pulse width)
5. Saving spectra: The spectra can be saved in various formats, such as spectrum files(*.spu) or tab-separated ASCII (*.tsv), using theFile → Savemenu
6. Shutting down: Turn off the power supplies and vacuum pump, and open the airinletvalve (knurled knob) so that the pump’s oil is not sucked intothe vacuum region. Ensurethat theEMPTY plug is inserted into the exchangeable source holder. Turn off the powerat the power point and check that the battery-operated magnetometer is also turned off.
5 Internal electron conversion
The 207Bi spectrum is used for calibration purposes, and this enables us to examine some ofthe physics of the internal electron conversion process, since the four lines in the spectrum aredue to this process.
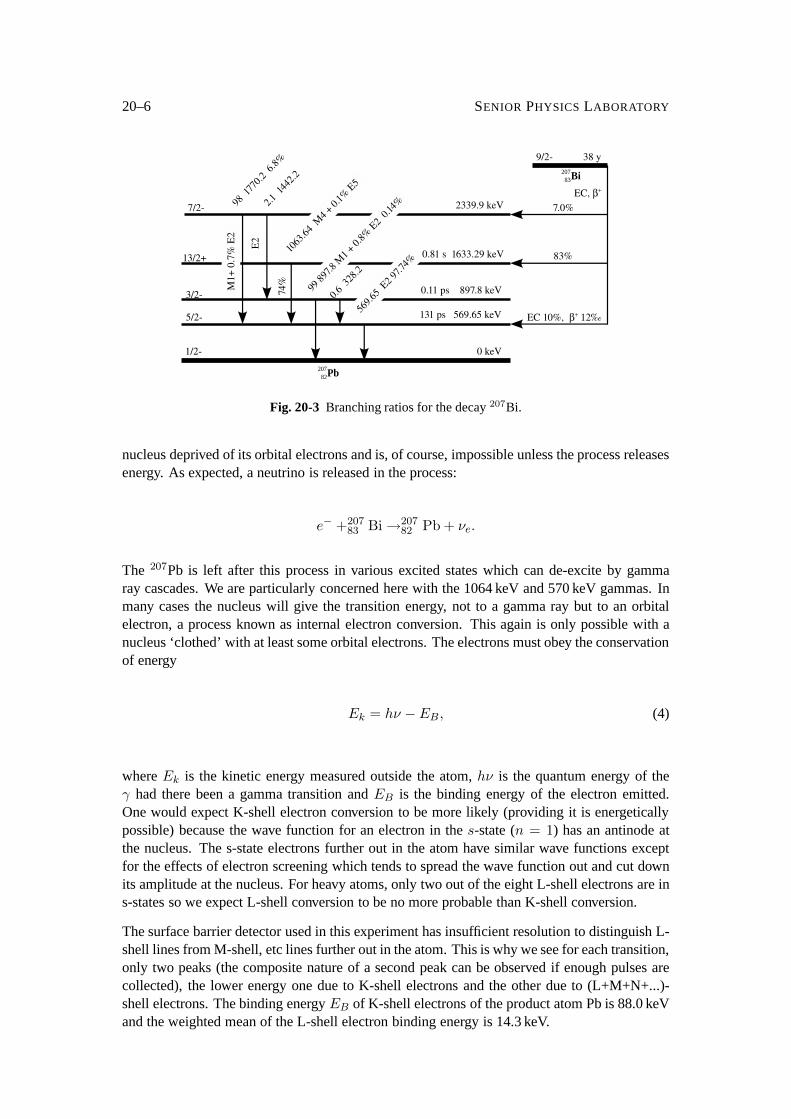
Fig. 20-3 shows the decay scheme of207Bi. It decays mostly by the process of orbital electroncapture. This decreases the atomic numberZ one unit whilst leaving the mass numberAunchanged. (So does positron emission (β+ emission) but an extra2mc2 of energy is neededto create the positron). Orbital electron capture (calledEC in the nuclear data tables), is possiblebecause the orbital electrons’ wave functions are non-zeroin the nucleus. It cannot happen in a
20–6 SENIOR PHYSICS LABORATORY
Fig. 20-3 Branching ratios for the decay207Bi.
nucleus deprived of its orbital electrons and is, of course,impossible unless the process releasesenergy. As expected, a neutrino is released in the process:
e− +20783 Bi →207
82 Pb + νe.
The 207Pb is left after this process in various excited states whichcan de-excite by gammaray cascades. We are particularly concerned here with the 1064 keV and 570 keV gammas. Inmany cases the nucleus will give the transition energy, not to a gamma ray but to an orbitalelectron, a process known as internal electron conversion.This again is only possible with anucleus ‘clothed’ with at least some orbital electrons. Theelectrons must obey the conservationof energy
Ek = hν − EB , (4)
whereEk is the kinetic energy measured outside the atom,hν is the quantum energy of theγ had there been a gamma transition andEB is the binding energy of the electron emitted.One would expect K-shell electron conversion to be more likely (providing it is energeticallypossible) because the wave function for an electron in thes-state (n = 1) has an antinode atthe nucleus. The s-state electrons further out in the atom have similar wave functions exceptfor the effects of electron screening which tends to spread the wave function out and cut downits amplitude at the nucleus. For heavy atoms, only two out ofthe eight L-shell electrons are ins-states so we expect L-shell conversion to be no more probable than K-shell conversion.
The surface barrier detector used in this experiment has insufficient resolution to distinguish L-shell lines from M-shell, etc lines further out in the atom. This is why we see for each transition,only two peaks (the composite nature of a second peak can be observed if enough pulses arecollected), the lower energy one due to K-shell electrons and the other due to (L+M+N+...)-shell electrons. The binding energyEB of K-shell electrons of the product atom Pb is 88.0 keVand the weighted mean of the L-shell electron binding energyis 14.3 keV.
BETA DECAY 20–7
6 The Kurie plot
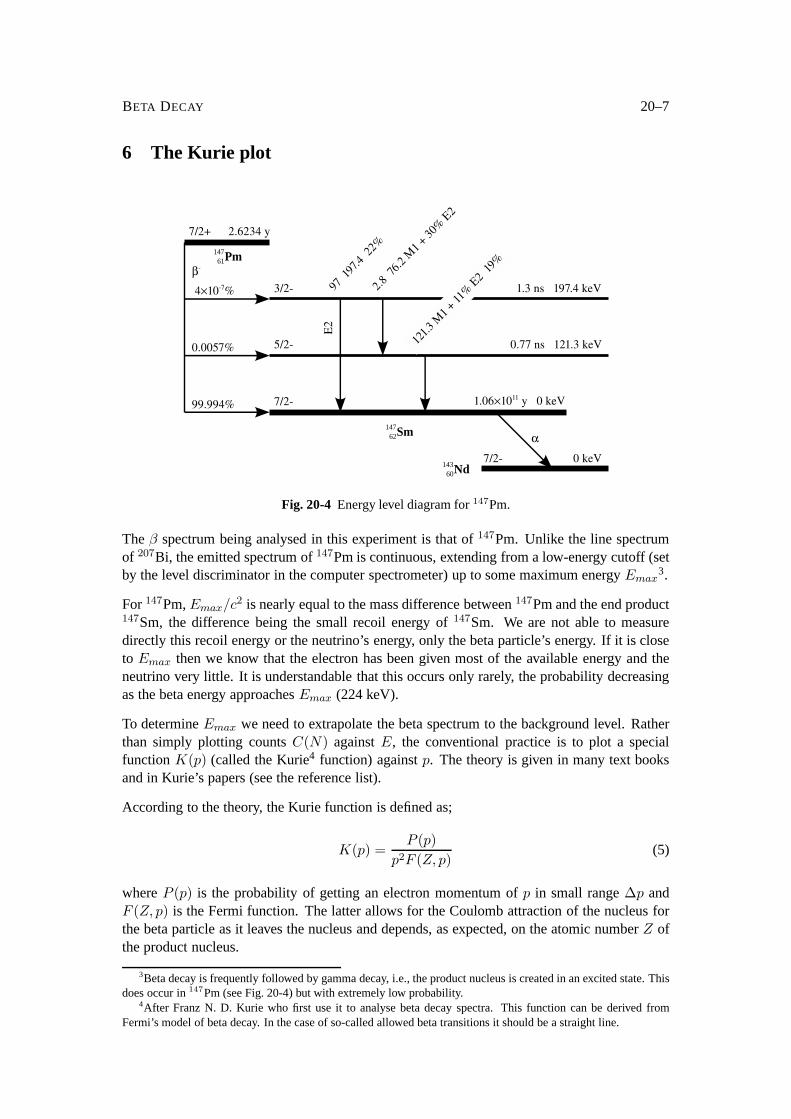
Fig. 20-4 Energy level diagram for147Pm.
Theβ spectrum being analysed in this experiment is that of147Pm. Unlike the line spectrumof 207Bi, the emitted spectrum of147Pm is continuous, extending from a low-energy cutoff (setby the level discriminator in the computer spectrometer) upto some maximum energyEmax
3.
For 147Pm,Emax/c2 is nearly equal to the mass difference between147Pm and the end product147Sm, the difference being the small recoil energy of147Sm. We are not able to measuredirectly this recoil energy or the neutrino’s energy, only the beta particle’s energy. If it is closeto Emax then we know that the electron has been given most of the available energy and theneutrino very little. It is understandable that this occursonly rarely, the probability decreasingas the beta energy approachesEmax (224 keV).
To determineEmax we need to extrapolate the beta spectrum to the background level. Ratherthan simply plotting countsC(N) againstE, the conventional practice is to plot a specialfunction K(p) (called the Kurie4 function) againstp. The theory is given in many text booksand in Kurie’s papers (see the reference list).
According to the theory, the Kurie function is defined as;
K(p) =P (p)
p2F (Z, p)(5)
whereP (p) is the probability of getting an electron momentum ofp in small range∆p andF (Z, p) is the Fermi function. The latter allows for the Coulomb attraction of the nucleus forthe beta particle as it leaves the nucleus and depends, as expected, on the atomic numberZ ofthe product nucleus.
3Beta decay is frequently followed by gamma decay, i.e., the product nucleus is created in an excited state. Thisdoes occur in147Pm (see Fig. 20-4) but with extremely low probability.
4After Franz N. D. Kurie who first use it to analyse beta decay spectra. This function can be derived fromFermi’s model of beta decay. In the case of so-called allowedbeta transitions it should be a straight line.
20–8 SENIOR PHYSICS LABORATORY
In this experiment we are interested in electron energy cutoff rather than momentum. Accord-ingly we use the energy form of the Kurie function (see [3], page 234)
K(E) =
√
P (E)
pcEF (Z, p), (6)
whereE is the total energy of the electron (kinetic energy plus restenergy). P (E) can beapproximated byC(N), the count in channelN . In 147Pm the Fermi functionF (Z, p) variesslowly in the region ofEmax so we set it to a constant.
The electron momentump and total energyE are calculated from Equation (2) to give
K(Ek) ∝
√
√
√
√
C(N)
(Ek + E0)√
E2k + 2EkE0
. (7)
The rest energy of the electron isE0 = 511 keV andEk is calculated from the calibrationequation. The constant Fermi functionF (Z, p) has been omitted for simplicity.
6.1 Neutrino mass
The possibility of a non-zero neutrino mass has been intriguing physicists for many years now.Currently there is an international collaboration planning a new experiment to investigate theend point of the tritiumβ-decay spectrum called KATRIN. The KATRIN experiment is de-signed to measure the rest mass of the electron neutrino directly with a sensitivity of 0.2 eV/c2.
7 Prework
1. An electron is moving perpendicular to a uniform magneticfield (B = 0.1 T) in a circularpath of radius 0.10 m. The rest-mass energy of the electron is0.511 MeV. Using specialrelativity, calculate the
• momentum,
• total energy,
• kinetic energy, and
• speed of the electron.
Express your results in both SI and natural (usinge andc) units; see Section 11.2.
2. Why is a semiconductor detector that is used to detectα particles of kinetic energy 5 MeVnot suitable for detecting 1 MeVβ particles?
3. Calculate the energies of the four207Bi internal conversion electrons used in the calibra-tion process; see Section 5.
C 1 ⊲
BETA DECAY 20–9
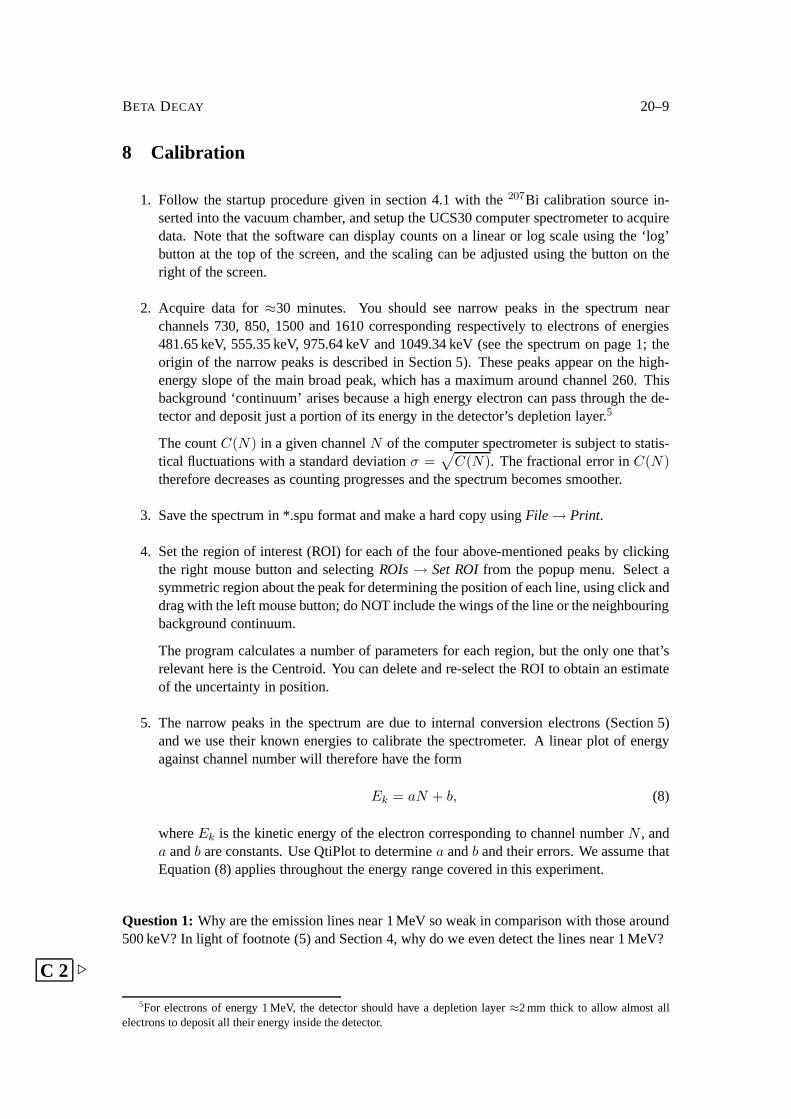
8 Calibration
1. Follow the startup procedure given in section 4.1 with the207Bi calibration source in-serted into the vacuum chamber, and setup the UCS30 computerspectrometer to acquiredata. Note that the software can display counts on a linear orlog scale using the ‘log’button at the top of the screen, and the scaling can be adjusted using the button on theright of the screen.
2. Acquire data for≈30 minutes. You should see narrow peaks in the spectrum nearchannels 730, 850, 1500 and 1610 corresponding respectively to electrons of energies481.65 keV, 555.35 keV, 975.64 keV and 1049.34 keV (see the spectrum on page 1; theorigin of the narrow peaks is described in Section 5). These peaks appear on the high-energy slope of the main broad peak, which has a maximum around channel 260. Thisbackground ‘continuum’ arises because a high energy electron can pass through the de-tector and deposit just a portion of its energy in the detector’s depletion layer.5
The countC(N) in a given channelN of the computer spectrometer is subject to statis-tical fluctuations with a standard deviationσ =
√
C(N). The fractional error inC(N)therefore decreases as counting progresses and the spectrum becomes smoother.
3. Save the spectrum in *.spu format and make a hard copy usingFile → Print.
4. Set the region of interest (ROI) for each of the four above-mentioned peaks by clickingthe right mouse button and selectingROIs→ Set ROIfrom the popup menu. Select asymmetric region about the peak for determining the position of each line, using click anddrag with the left mouse button; do NOT include the wings of the line or the neighbouringbackground continuum.
The program calculates a number of parameters for each region, but the only one that’srelevant here is the Centroid. You can delete and re-select the ROI to obtain an estimateof the uncertainty in position.
5. The narrow peaks in the spectrum are due to internal conversion electrons (Section 5)and we use their known energies to calibrate the spectrometer. A linear plot of energyagainst channel number will therefore have the form
Ek = aN + b, (8)
whereEk is the kinetic energy of the electron corresponding to channel numberN , anda andb are constants. Use QtiPlot to determinea andb and their errors. We assume thatEquation (8) applies throughout the energy range covered inthis experiment.
Question 1:Why are the emission lines near 1 MeV so weak in comparison with those around500 keV? In light of footnote (5) and Section 4, why do we even detect the lines near 1 MeV?
C 2 ⊲
5For electrons of energy 1 MeV, the detector should have a depletion layer≈2 mm thick to allow almost allelectrons to deposit all their energy inside the detector.
20–10 SENIOR PHYSICS LABORATORY
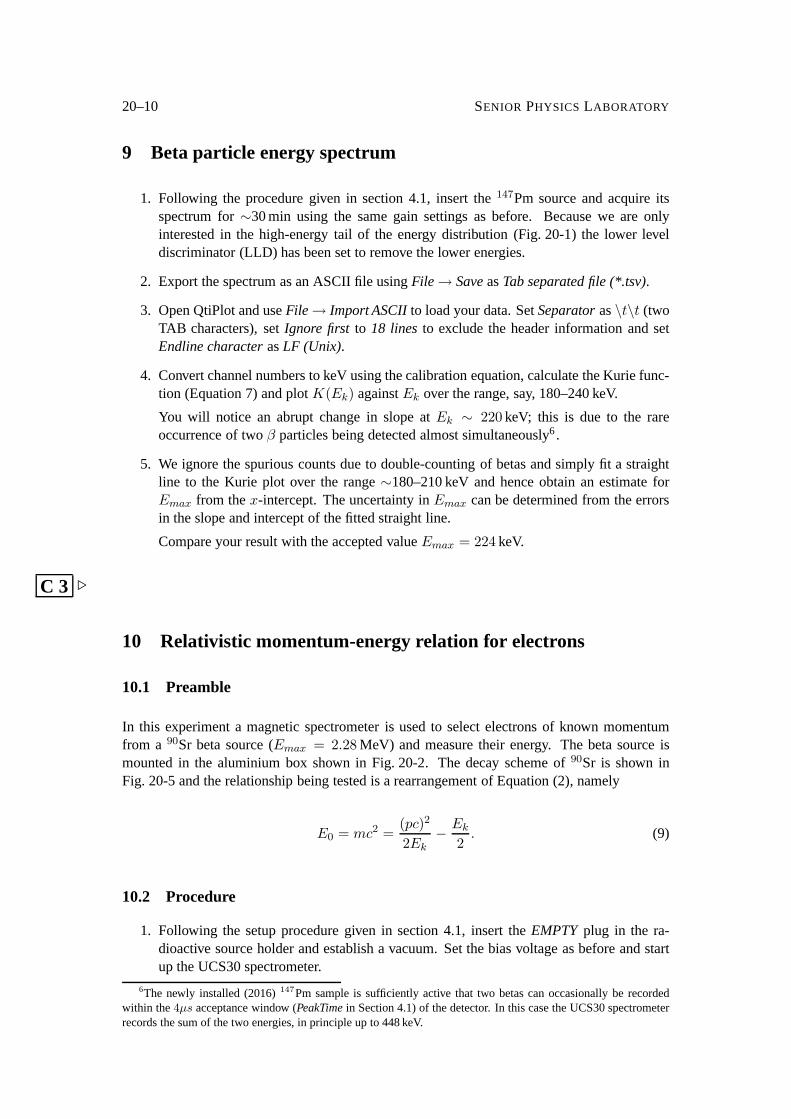
9 Beta particle energy spectrum
1. Following the procedure given in section 4.1, insert the147Pm source and acquire itsspectrum for∼30 min using the same gain settings as before. Because we are onlyinterested in the high-energy tail of the energy distribution (Fig. 20-1) the lower leveldiscriminator (LLD) has been set to remove the lower energies.
2. Export the spectrum as an ASCII file usingFile → SaveasTab separated file (*.tsv).
3. Open QtiPlot and useFile → Import ASCIIto load your data. SetSeparatoras\t\t (twoTAB characters), setIgnore first to 18 linesto exclude the header information and setEndline characterasLF (Unix).
4. Convert channel numbers to keV using the calibration equation, calculate the Kurie func-tion (Equation 7) and plotK(Ek) againstEk over the range, say, 180–240 keV.
You will notice an abrupt change in slope atEk ∼ 220 keV; this is due to the rareoccurrence of twoβ particles being detected almost simultaneously6.
5. We ignore the spurious counts due to double-counting of betas and simply fit a straightline to the Kurie plot over the range∼180–210 keV and hence obtain an estimate forEmax from thex-intercept. The uncertainty inEmax can be determined from the errorsin the slope and intercept of the fitted straight line.
Compare your result with the accepted valueEmax = 224 keV.
C 3 ⊲
10 Relativistic momentum-energy relation for electrons
10.1 Preamble
In this experiment a magnetic spectrometer is used to selectelectrons of known momentumfrom a 90Sr beta source (Emax = 2.28 MeV) and measure their energy. The beta source ismounted in the aluminium box shown in Fig. 20-2. The decay scheme of90Sr is shown inFig. 20-5 and the relationship being tested is a rearrangement of Equation (2), namely
E0 = mc2 =(pc)2
2Ek
−Ek
2. (9)
10.2 Procedure
1. Following the setup procedure given in section 4.1, insert the EMPTYplug in the ra-dioactive source holder and establish a vacuum. Set the biasvoltage as before and startup the UCS30 spectrometer.
6The newly installed (2016)147Pm sample is sufficiently active that two betas can occasionally be recordedwithin the4µs acceptance window (PeakTimein Section 4.1) of the detector. In this case the UCS30 spectrometerrecords the sum of the two energies, in principle up to 448 keV.
BETA DECAY 20–11
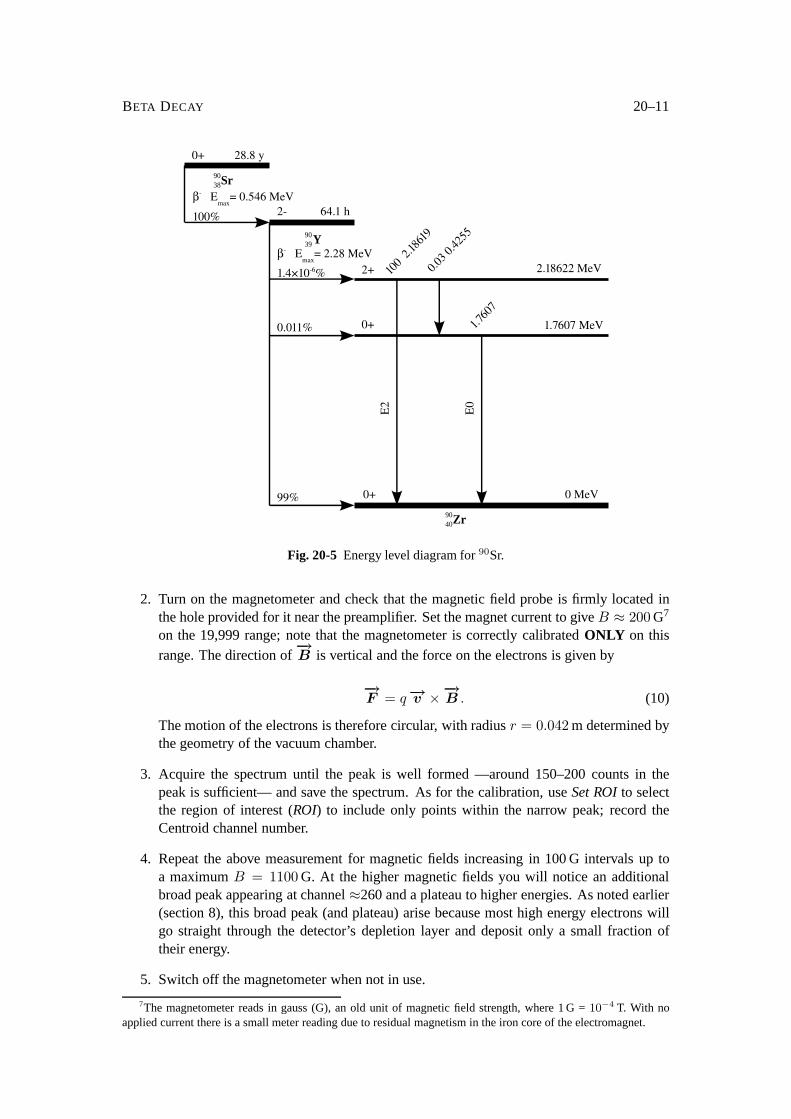
Fig. 20-5 Energy level diagram for90Sr.
2. Turn on the magnetometer and check that the magnetic field probe is firmly located inthe hole provided for it near the preamplifier. Set the magnetcurrent to giveB ≈ 200 G7
on the 19,999 range; note that the magnetometer is correctlycalibratedONLY on thisrange. The direction of
−→
B is vertical and the force on the electrons is given by
−→
F = q −→v ×
−→
B . (10)
The motion of the electrons is therefore circular, with radiusr = 0.042 m determined bythe geometry of the vacuum chamber.
3. Acquire the spectrum until the peak is well formed —around150–200 counts in thepeak is sufficient— and save the spectrum. As for the calibration, useSet ROIto selectthe region of interest (ROI) to include only points within the narrow peak; record theCentroid channel number.
4. Repeat the above measurement for magnetic fields increasing in 100 G intervals up toa maximumB = 1100 G. At the higher magnetic fields you will notice an additionalbroad peak appearing at channel≈260 and a plateau to higher energies. As noted earlier(section 8), this broad peak (and plateau) arise because most high energy electrons willgo straight through the detector’s depletion layer and deposit only a small fraction oftheir energy.
5. Switch off the magnetometer when not in use.
7The magnetometer reads in gauss (G), an old unit of magnetic field strength, where 1 G =10−4 T. With noapplied current there is a small meter reading due to residual magnetism in the iron core of the electromagnet.
20–12 SENIOR PHYSICS LABORATORY
6. Enter the values ofB and Centroid channel number into QtiPlot. Use your calibrationequation to convert Centroid channels toEk in keV, and Equation (3) to determinepc,also in keV. Assume a 1% error inB; with 150–200 counts in the spectral peak, theuncertainty in the Centroid positions should be≤ 1 channel. The uncertainty in theradiusr is not known; if significant, it will show up as a systematic error in the fit.
7. Plot (pc)2/(2Ek) versusEk and make a weighted linear fit to the data, recording theslope and intercept. Comment on the agreement (or otherwise) with the expected valuesfrom equation (9).
Question 2: Calculate the speed of the electrons you detected atB = 1000 G in terms of thespeed of lightc.
C 4 ⊲
11 Appendix
11.1 Classical (Newton’s) theory
Definition of energy and momentum:
E = Ek =mv2
2(11)
−→p = m−→v , (12)
whereE is total energy,Ek is kinetic energy, and−→p denotes momentum of a body with massm moving with a speed−→v .
If this body has a chargeq and is moving perpendicular to magnetic field−→
B , then its trajectorywill be circular with radius−→r , where−→r vector is directed towards the centre of the circle.By comparing acceleration from circular movement and electromagnetic force we can writeequation:
−→
F = q −→v ×
−→
B =d−→p
dt=
d(m−→v )
dt= m
d(−→v )
dt= m
v2
r
−→r
r. (13)
By taking absolute values of all vectors (we know the directions) in Equation (13), we have
qvB = mv2
r⇒ mv = qrB ⇒ p = qrB. (14)
11.2 Relativistic (Einstein’s) theory
According to special relativity theory, energy and momentum can be expressed as follows:
E = Ek + mc2 = γmc2 (15)−→p = γm−→
v (16)
BETA DECAY 20–13
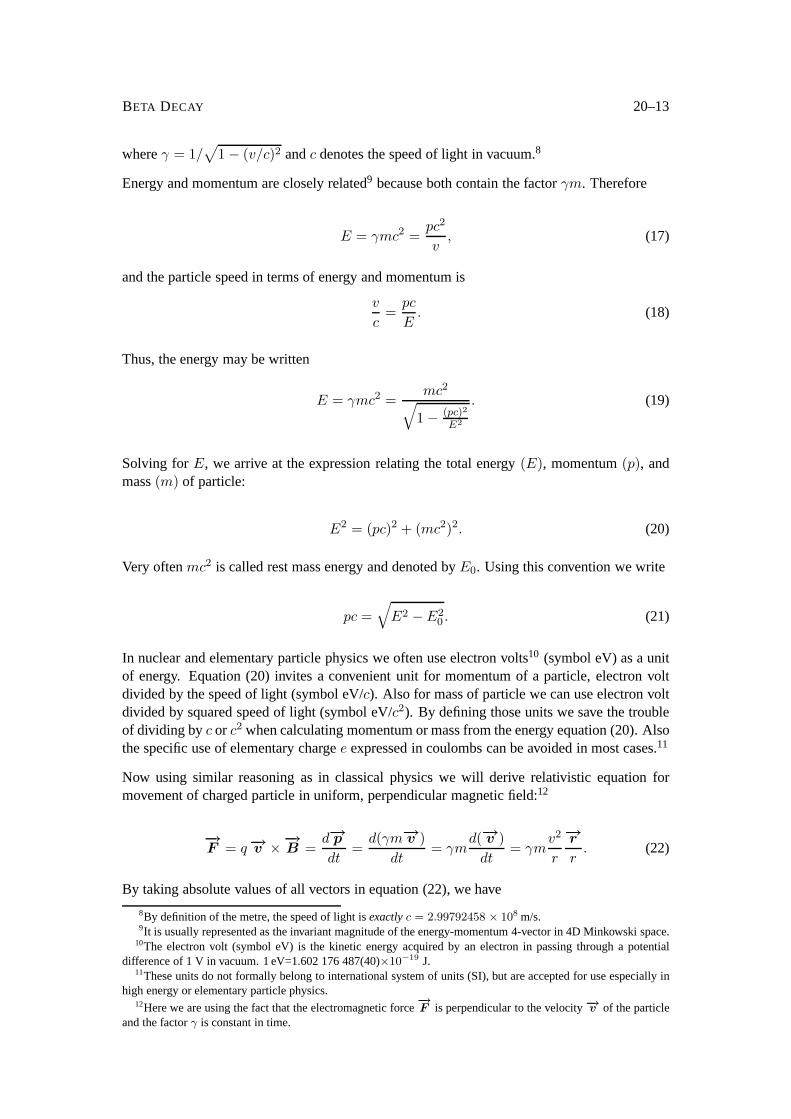
whereγ = 1/√
1 − (v/c)2 andc denotes the speed of light in vacuum.8
Energy and momentum are closely related9 because both contain the factorγm. Therefore
E = γmc2 =pc2
v, (17)
and the particle speed in terms of energy and momentum is
v
c=
pc
E. (18)
Thus, the energy may be written
E = γmc2 =mc2
√
1 − (pc)2
E2
. (19)
Solving forE, we arrive at the expression relating the total energy(E), momentum(p), andmass(m) of particle:
E2 = (pc)2 + (mc2)2. (20)
Very oftenmc2 is called rest mass energy and denoted byE0. Using this convention we write
pc =√
E2 − E20 . (21)
In nuclear and elementary particle physics we often use electron volts10 (symbol eV) as a unitof energy. Equation (20) invites a convenient unit for momentum of a particle, electron voltdivided by the speed of light (symbol eV/c). Also for mass of particle we can use electron voltdivided by squared speed of light (symbol eV/c2). By defining those units we save the troubleof dividing byc or c2 when calculating momentum or mass from the energy equation (20). Alsothe specific use of elementary chargee expressed in coulombs can be avoided in most cases.11
Now using similar reasoning as in classical physics we will derive relativistic equation formovement of charged particle in uniform, perpendicular magnetic field:12
−→
F = q −→v ×
−→
B =d−→p
dt=
d(γm−→v )
dt= γm
d(−→v )
dt= γm
v2
r
−→r
r. (22)
By taking absolute values of all vectors in equation (22), wehave
8By definition of the metre, the speed of light isexactlyc = 2.99792458 × 10⁸ m/s.
9It is usually represented as the invariant magnitude of the energy-momentum 4-vector in 4D Minkowski space.10The electron volt (symbol eV) is the kinetic energy acquiredby an electron in passing through a potential
difference of 1 V in vacuum. 1 eV=1.602 176 487(40)×10−19 J.
11These units do not formally belong to international system of units (SI), but are accepted for use especially inhigh energy or elementary particle physics.
12Here we are using the fact that the electromagnetic force−→
F is perpendicular to the velocity−→v of the particleand the factorγ is constant in time.
20–14 SENIOR PHYSICS LABORATORY
qvB = γmv2
r⇒ γmv = qrB ⇒ p = qrB. (23)
This equation is identical to the classical one!
References
[1] G.F. Knoll, Radiation Detection and Measurement, 2000, 3rd ed, New York:Wiley(539.77 96A)
[2] William E. Burcham,Nuclear Physics: an Introduction, 1963, Longmans (539.7 29)
[3] Robert Howard,Nuclear Physics, 1963, Wadsworth Pub Co (539.7 113)
[4] C.M. Lederer et al.,Table of Isotopes, 1978, 7th ed, New York:Wiley (DG 49055)
[5] E.J. Konopinski & G.E. Uhlenbeck, 1935, Phys Rev 48, 7
[6] F.N.D. Kurie, J.R. Richardson & H.C. Paxton, 1936, Phys Rev 49, 368
[7] F.N.D. Kurie, 1948, Phys Rev 73, 1207


![Beta Decay[1]](https://img.pdfslide.net/doc/110x75/577d23191a28ab4e1e98f7ae/beta-decay1.jpg)
