Embed Size (px)
Citation preview
EXPERIMENT (6)
FLOW OVER WEIRS
By:Eng. Motasem M. Abushaban.
Eng. Fedaa M. Fayyad.
1
INTRODUCTION
Weir is defined as a barrier over which the water
flows in an open channel
A weir is a notch on a larger scale – usually found
in rivers.
It is used as both a flow measuring device and a
device to raise water levels. 2
INTRODUCTION
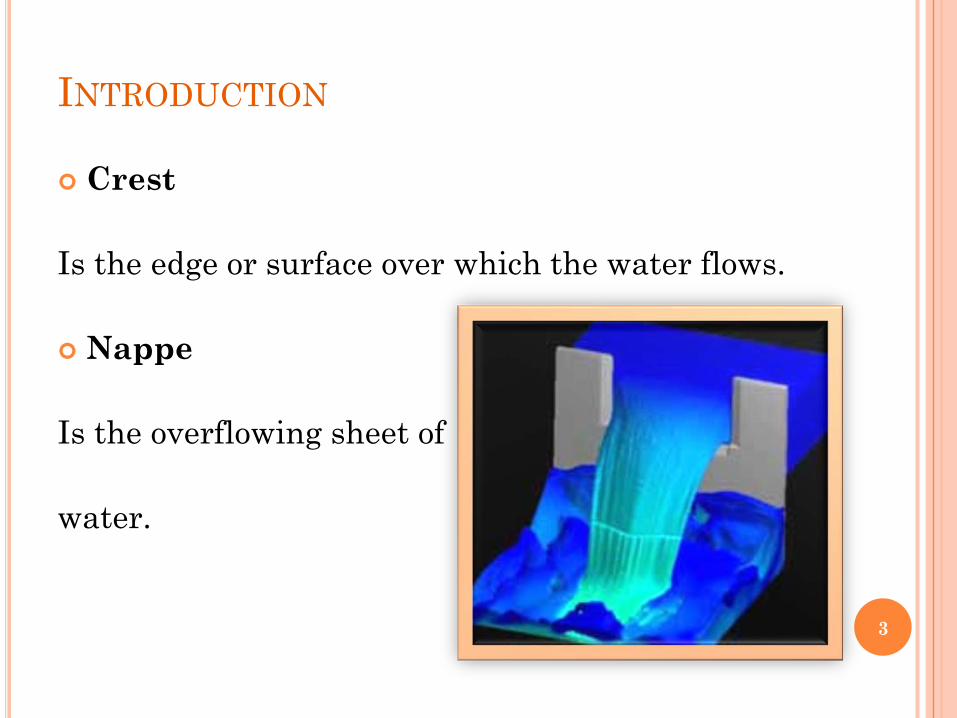
Crest
Is the edge or surface over which the water flows.
Nappe
Is the overflowing sheet of
water.
3
INTRODUCTION
4
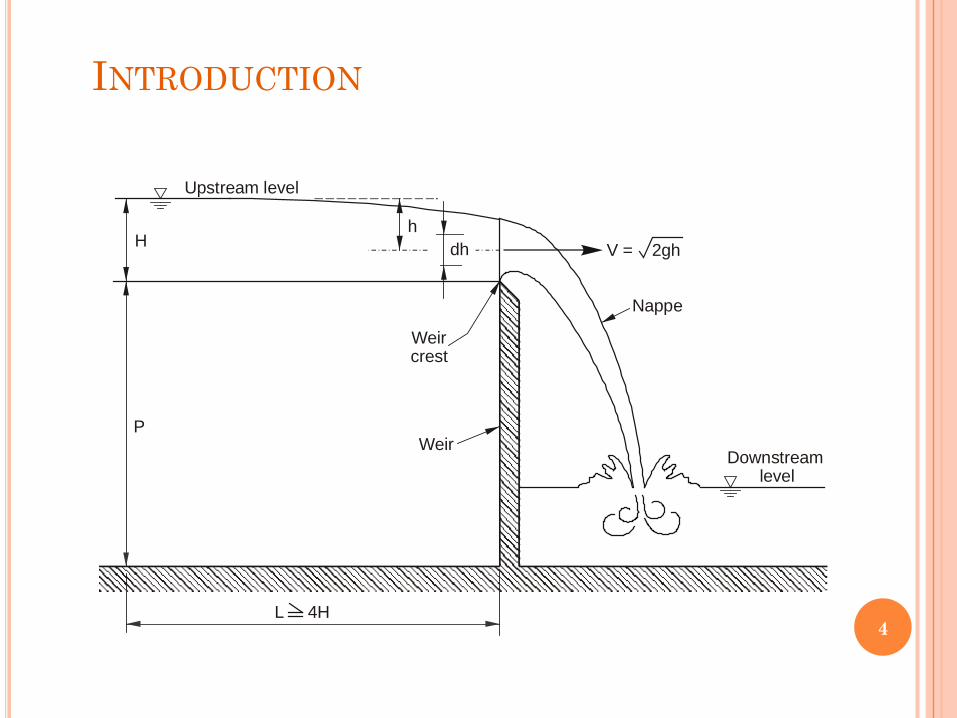
levelDownstream
Upstream levelH
P
Weircrest
Weir
NappeV = 2gh
L 4H
dhh
levelDownstream
Upstream level
H
P
Weircrest
Weir
Nappe
V = 2gh
L 4H
dhh
INTRODUCTION
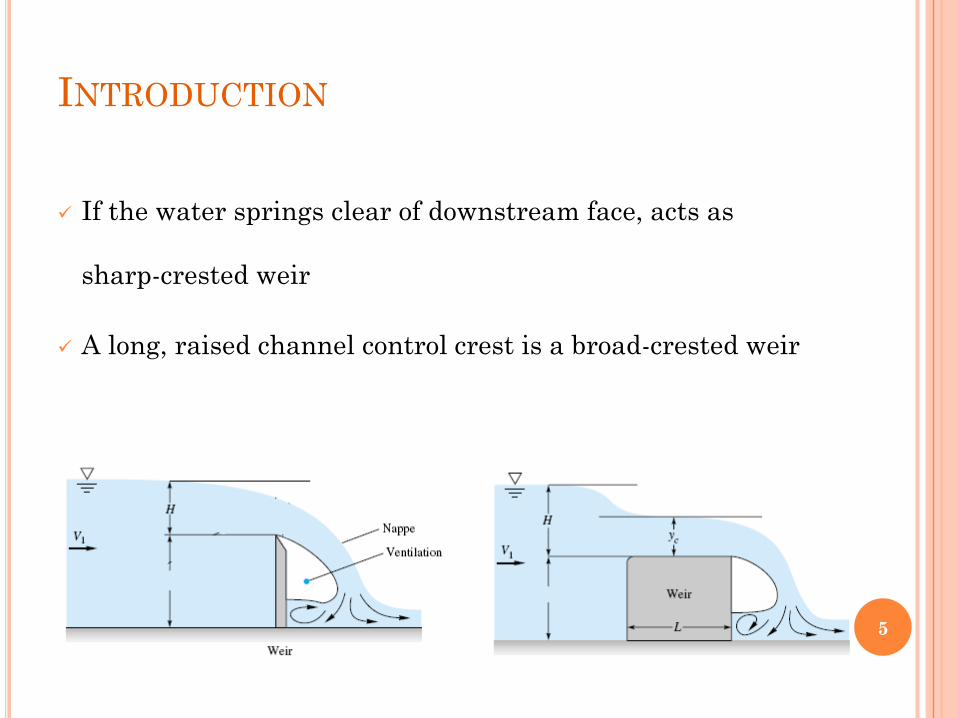
If the water springs clear of downstream face, acts as
sharp-crested weir
A long, raised channel control crest is a broad-crested weir
5
INTRODUCTION
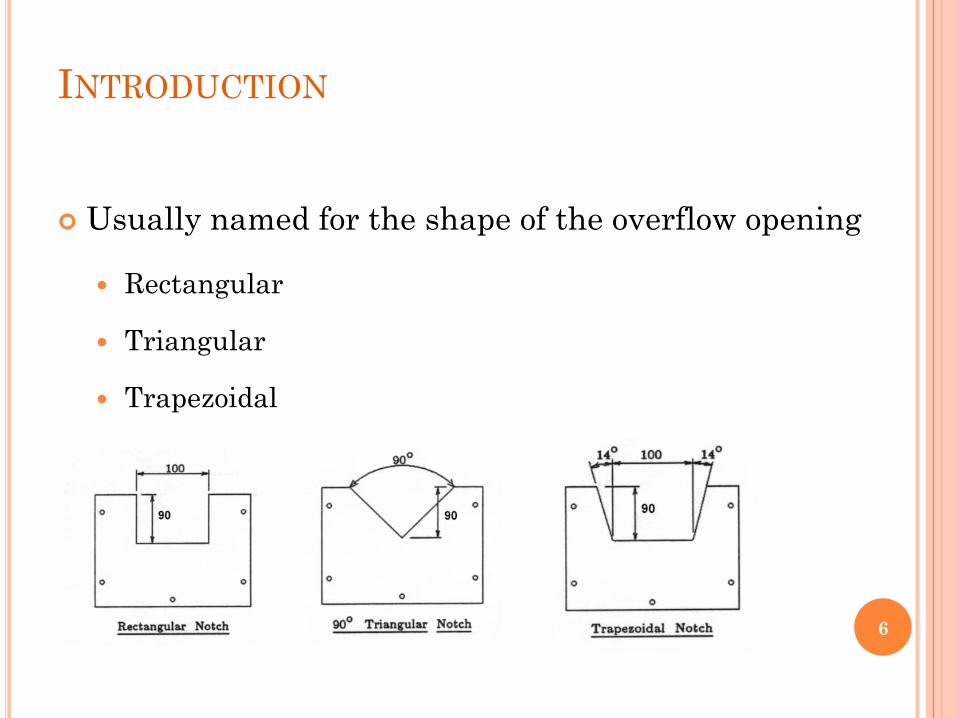
Usually named for the shape of the overflow opening
Rectangular
Triangular
Trapezoidal
6
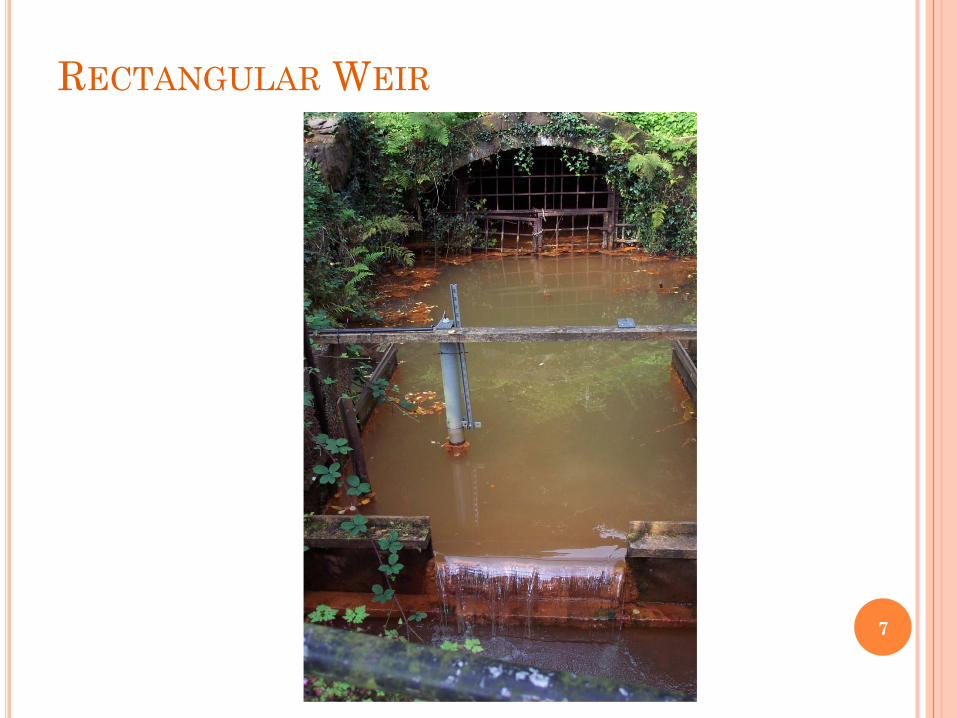
RECTANGULAR WEIR
7
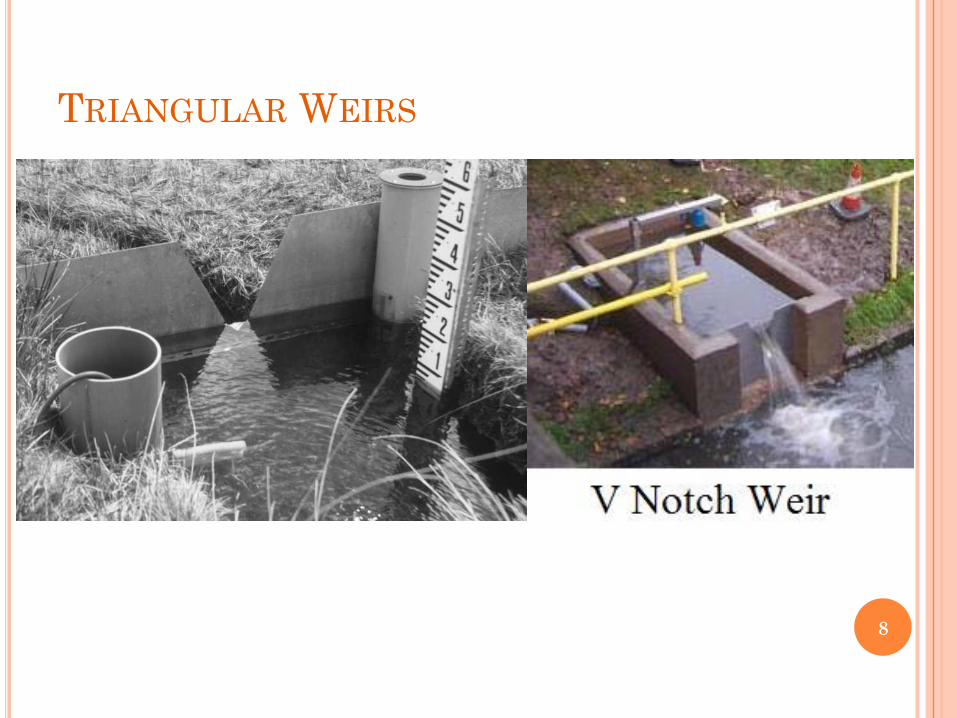
TRIANGULAR WEIRS
8
PURPOSE
To observe characteristics of flow over a weir.
To determine the head-discharge relationship of
two different shapes of weirs, and to compare the
experimental results with their corresponding
theoretical expressions.
Calculating the coefficient of discharge (Cd).9
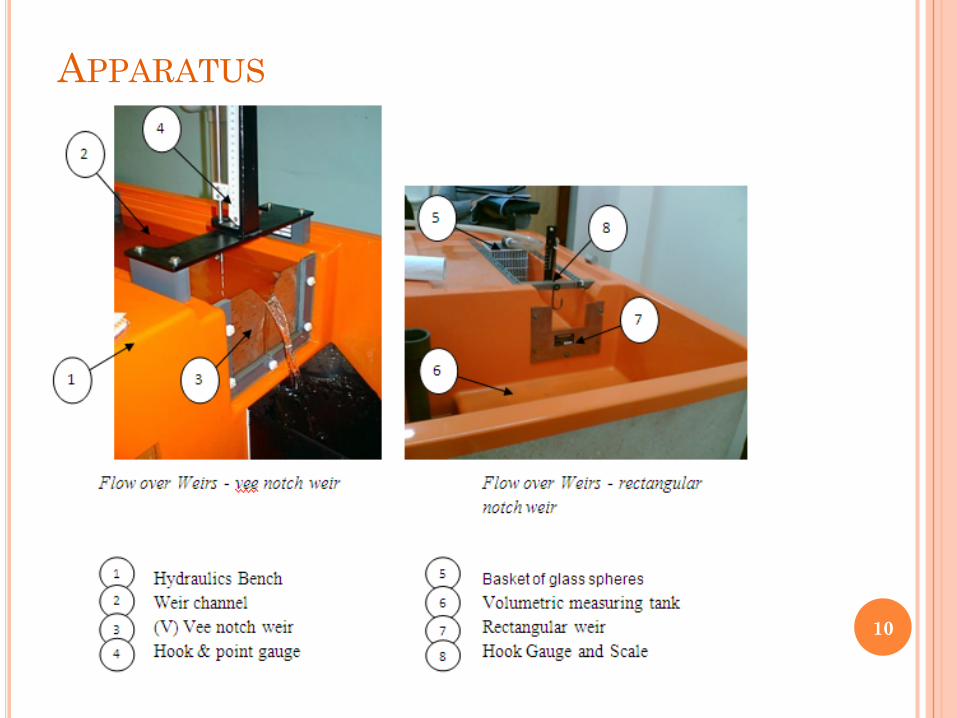
APPARATUS
10
11
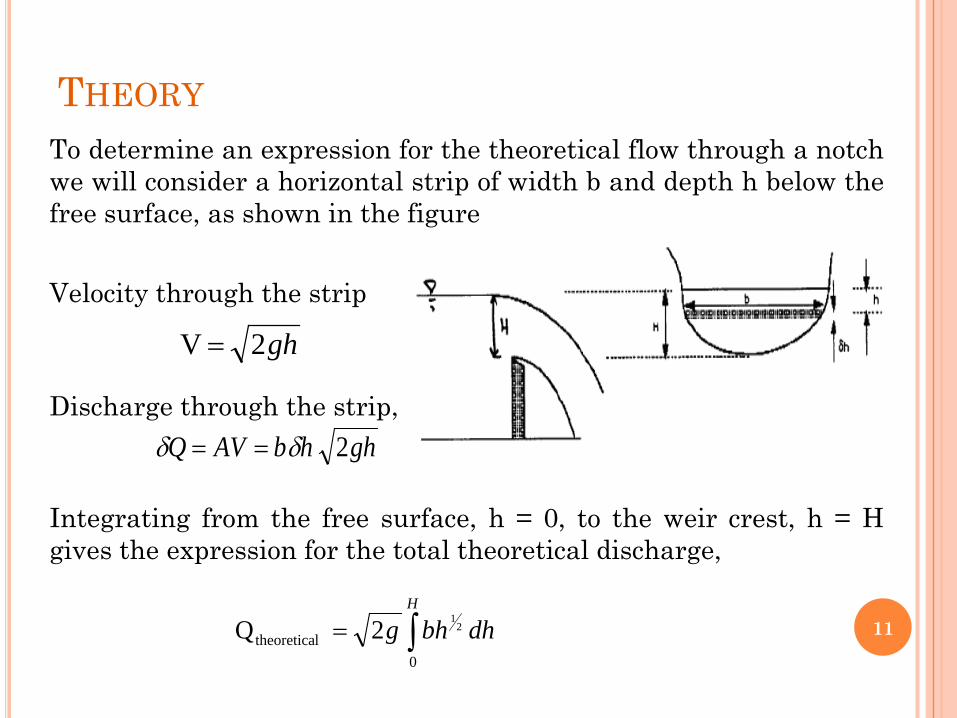
To determine an expression for the theoretical flow through a notchwe will consider a horizontal strip of width b and depth h below thefree surface, as shown in the figure
Velocity through the strip
Discharge through the strip,
Integrating from the free surface, h = 0, to the weir crest, h = Hgives the expression for the total theoretical discharge,
gh2 V =
ghhbAVQ 2δδ ==
dhbhgH
∫=0
ltheoretica2
12 Q
THEORY
12
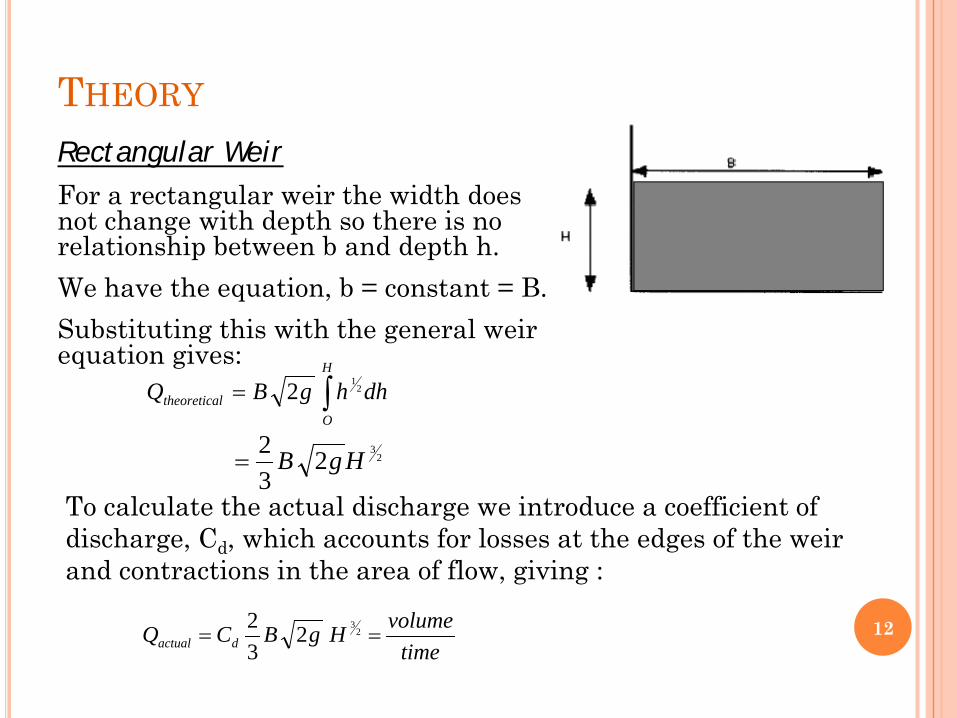
Rectangular WeirFor a rectangular weir the width does not change with depth so there is no relationship between b and depth h.We have the equation, b = constant = B.Substituting this with the general weir equation gives:
dhhgBQH
Oltheoretica ∫= 2
12
232
32 HgB=
To calculate the actual discharge we introduce a coefficient of discharge, Cd, which accounts for losses at the edges of the weir and contractions in the area of flow, giving :
timevolumeHgBCQ dactual == 2
3232
THEORY
THEORY
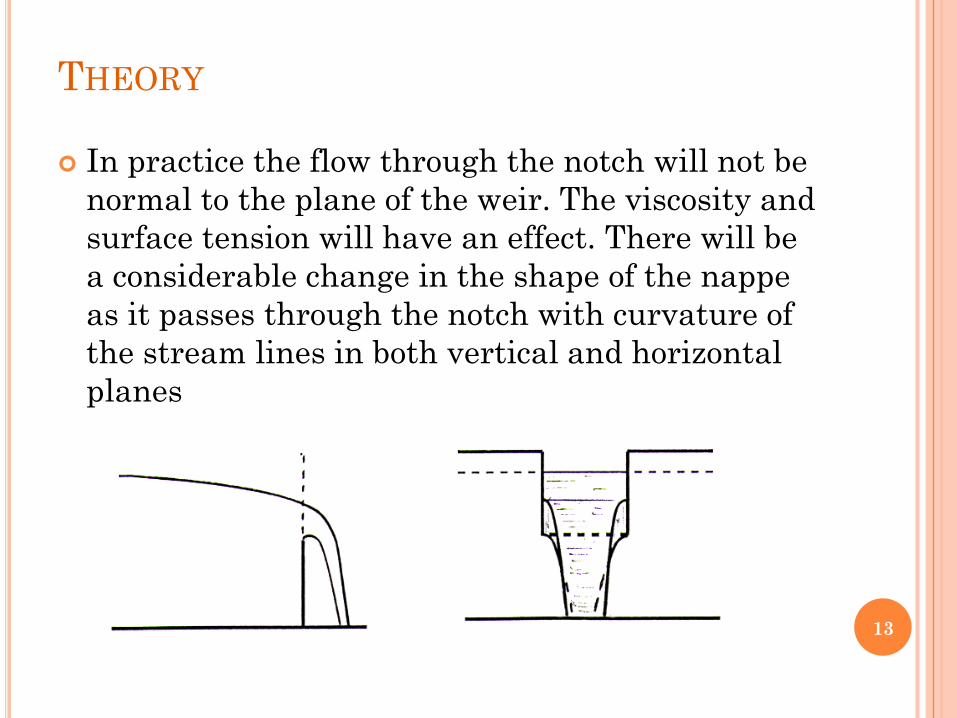
In practice the flow through the notch will not be normal to the plane of the weir. The viscosity and surface tension will have an effect. There will be a considerable change in the shape of the nappeas it passes through the notch with curvature of the stream lines in both vertical and horizontal planes
13
THEORY
The discharge from a rectangular notch will be considerably less.
14
)H 2gB 32ln(Cd=)ln(Q 3/2
act
)ln(H)2gB 32ln(Cd=)ln(Q 3/2
act +
)ln(H23)2g
32ln(Cd=)ln(Qact +
axisy−+intercept=y axis-
)232ln(int gBCercept d=
gB
eCercept
d
232
int
=
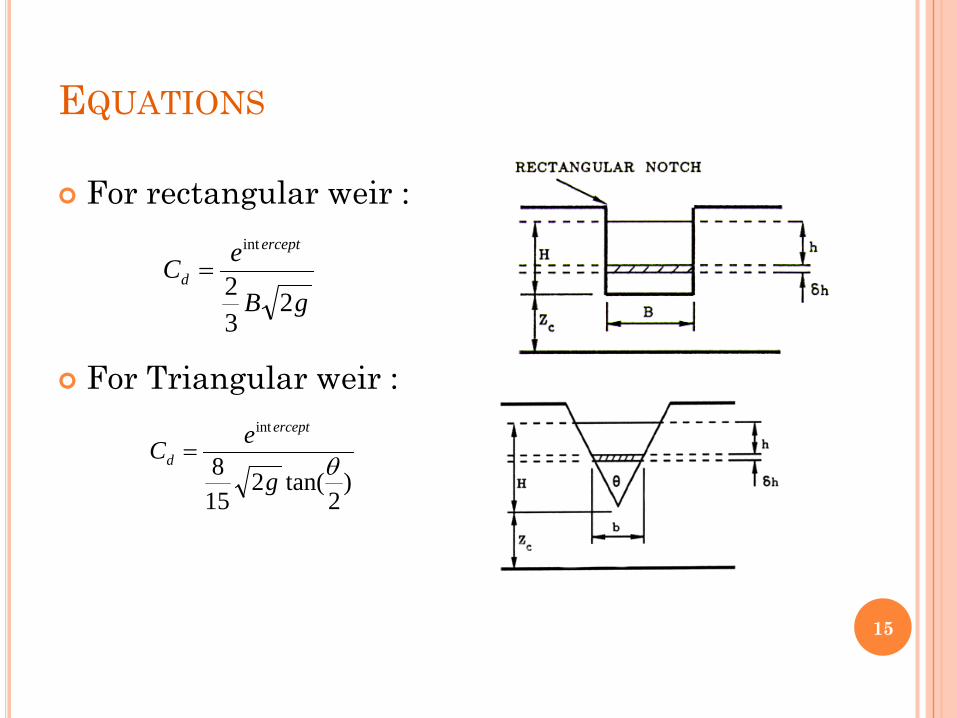
EQUATIONS
For rectangular weir :
For Triangular weir :
15
gB
eCercept
d
232
int
=
)2
tan(2158
int
θg
eCercept
d =
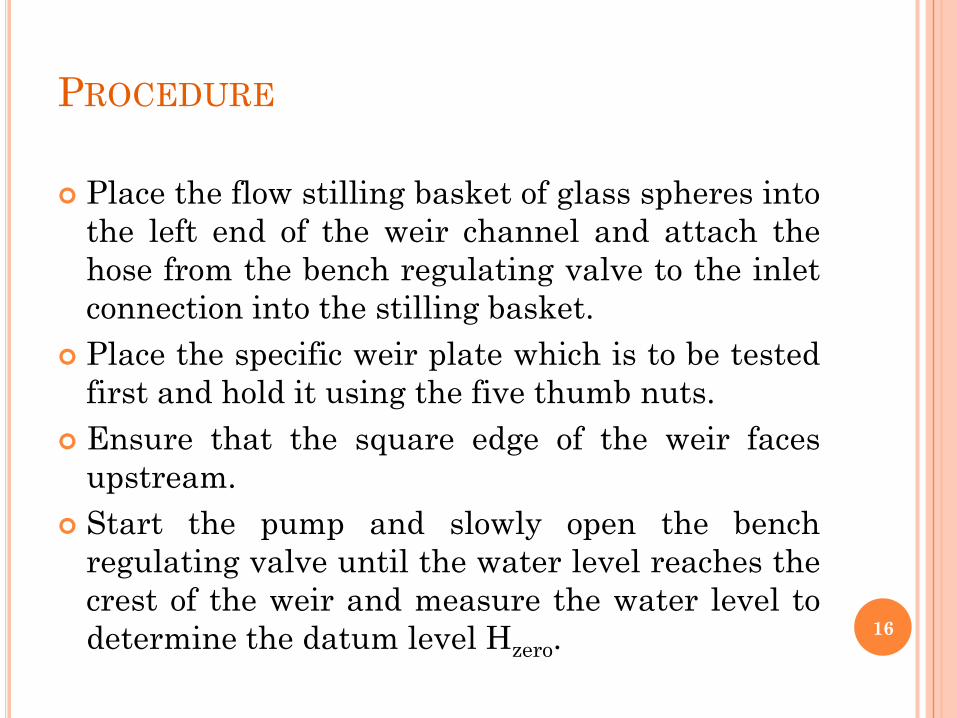
PROCEDURE
Place the flow stilling basket of glass spheres intothe left end of the weir channel and attach thehose from the bench regulating valve to the inletconnection into the stilling basket.
Place the specific weir plate which is to be testedfirst and hold it using the five thumb nuts.
Ensure that the square edge of the weir facesupstream.
Start the pump and slowly open the benchregulating valve until the water level reaches thecrest of the weir and measure the water level todetermine the datum level Hzero. 16
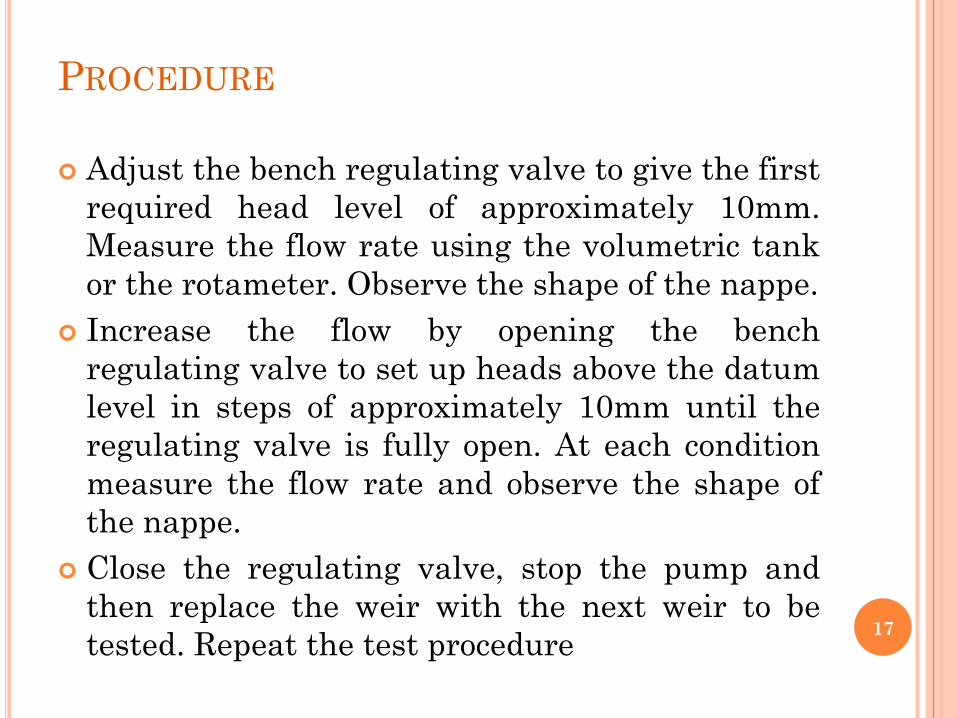
Adjust the bench regulating valve to give the firstrequired head level of approximately 10mm.Measure the flow rate using the volumetric tankor the rotameter. Observe the shape of the nappe.
Increase the flow by opening the benchregulating valve to set up heads above the datumlevel in steps of approximately 10mm until theregulating valve is fully open. At each conditionmeasure the flow rate and observe the shape ofthe nappe.
Close the regulating valve, stop the pump andthen replace the weir with the next weir to betested. Repeat the test procedure 17
PROCEDURE
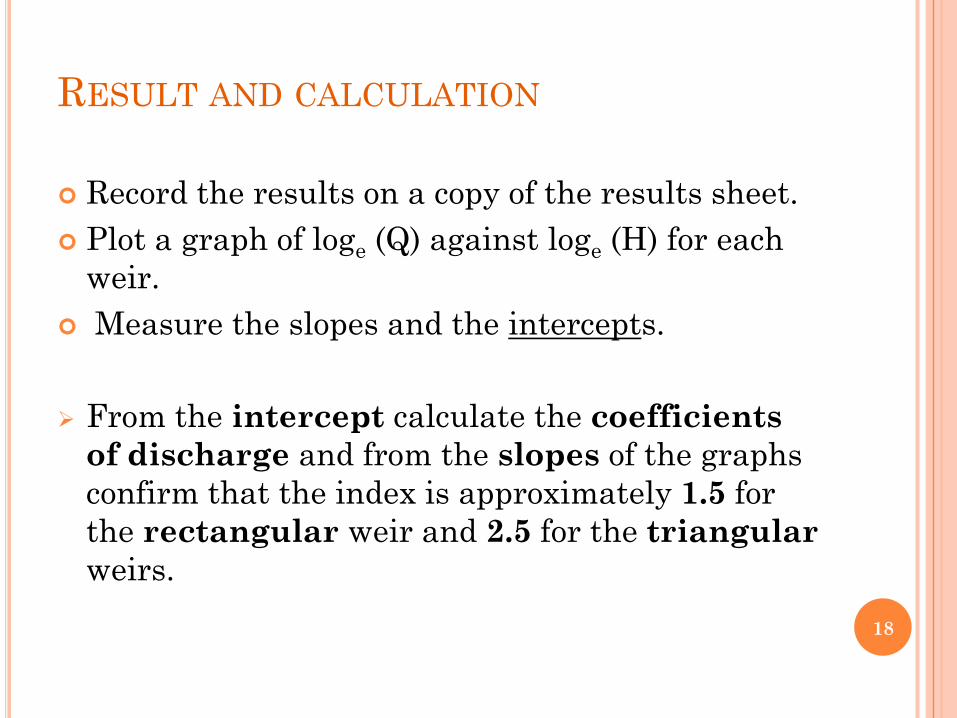
RESULT AND CALCULATION
18
Record the results on a copy of the results sheet. Plot a graph of loge (Q) against loge (H) for each
weir. Measure the slopes and the intercepts.
From the intercept calculate the coefficients of discharge and from the slopes of the graphs confirm that the index is approximately 1.5 for the rectangular weir and 2.5 for the triangular weirs.
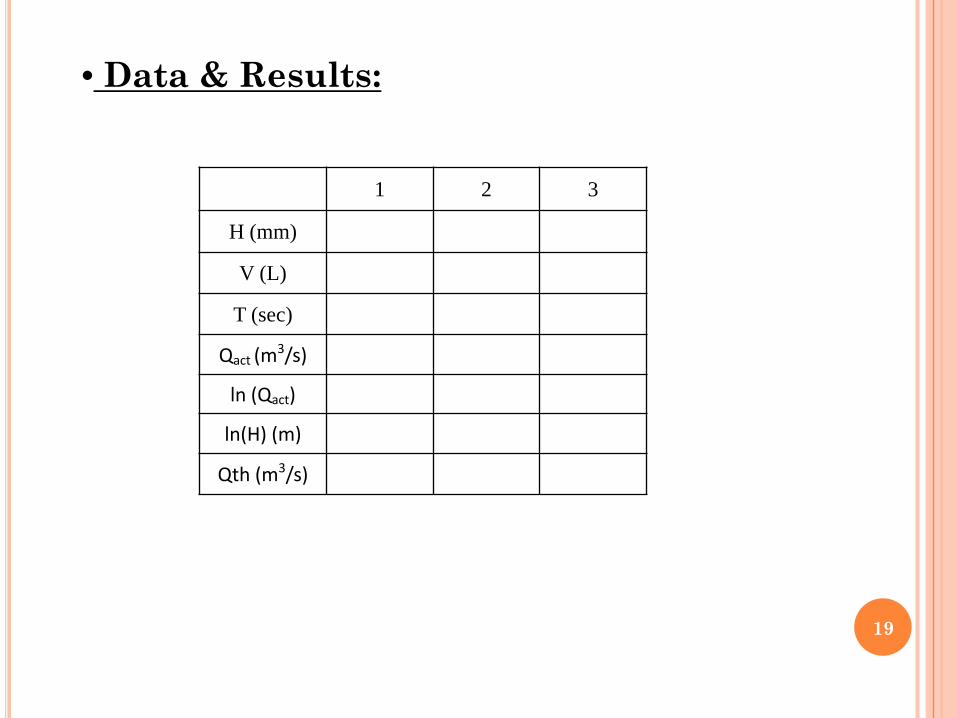
• Data & Results:
19
1 2 3
H (mm)
V (L)
T (sec)
Qact (m3/s)
ln (Qact)
ln(H) (m)
Qth (m3/s)

20
QUESTIONS