Embed Size (px)
Citation preview
Institute of Industrial Science, University of Tokyo Bulletin of ERS, No. 47(2014)
EXPERIMENT STUDY ON REDUCTION OF PP-BAND MESH CONNECTIVITY FOR
RETROFITTING OF MASONRY STRUCTURE
Adnan Mahmood DAR1, Saleem M.UMAIR2 , Muneyoshi NUMADA3
and Kimiro MEGURO4
ABSTRACT: Masonry construction is a very attractive and popular construction in different continents of the world. Polypropylene band (PP-band) retrofitting has been proposed as the retrofitting method for masonry structures in many under developing countries. In this paper, we have tested the effects of reduced numbers of connecting points of PP-band mesh by ¼ scale-models on shake table test. The fully connected (PPF) and the non-connected cases (PPN) were compared. The PPN model showed the effectiveness as for the retrofitting method. Key Words: Unreinforced Masonry, Polypropylene, retrofitting and connectivity
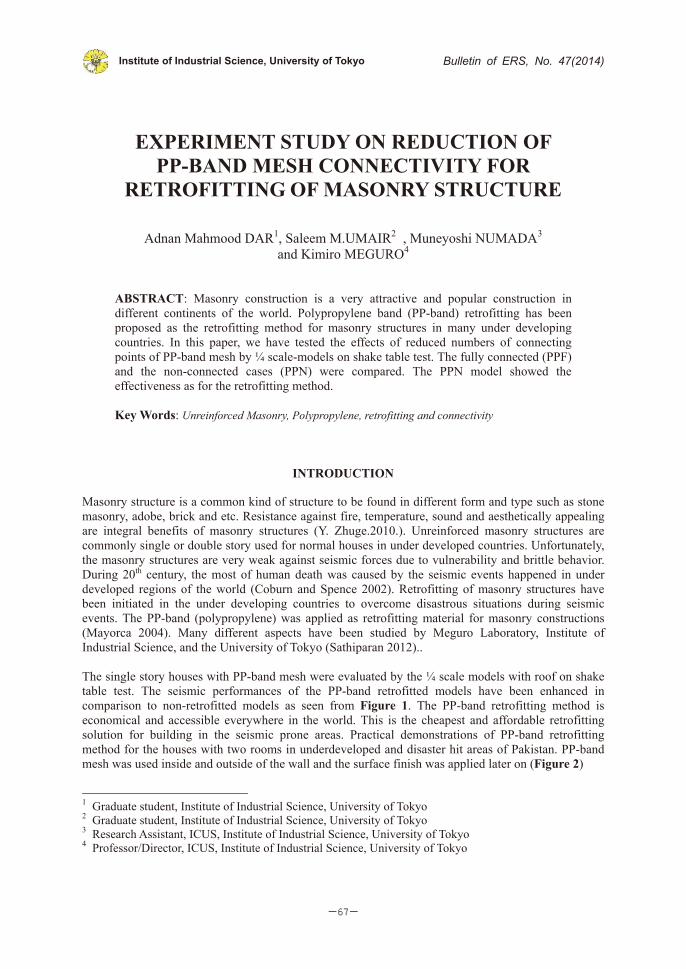
INTRODUCTION Masonry structure is a common kind of structure to be found in different form and type such as stone masonry, adobe, brick and etc. Resistance against fire, temperature, sound and aesthetically appealing are integral benefits of masonry structures (Y. Zhuge.2010.). Unreinforced masonry structures are commonly single or double story used for normal houses in under developed countries. Unfortunately, the masonry structures are very weak against seismic forces due to vulnerability and brittle behavior. During 20th century, the most of human death was caused by the seismic events happened in under developed regions of the world (Coburn and Spence 2002). Retrofitting of masonry structures have been initiated in the under developing countries to overcome disastrous situations during seismic events. The PP-band (polypropylene) was applied as retrofitting material for masonry constructions (Mayorca 2004). Many different aspects have been studied by Meguro Laboratory, Institute of Industrial Science, and the University of Tokyo (Sathiparan 2012).. The single story houses with PP-band mesh were evaluated by the ¼ scale models with roof on shake table test. The seismic performances of the PP-band retrofitted models have been enhanced in comparison to non-retrofitted models as seen from Figure 1. The PP-band retrofitting method is economical and accessible everywhere in the world. This is the cheapest and affordable retrofitting solution for building in the seismic prone areas. Practical demonstrations of PP-band retrofitting method for the houses with two rooms in underdeveloped and disaster hit areas of Pakistan. PP-band mesh was used inside and outside of the wall and the surface finish was applied later on (Figure 2)
1 Graduate student, Institute of Industrial Science, University of Tokyo 2 Graduate student, Institute of Industrial Science, University of Tokyo 3 Research Assistant, ICUS, Institute of Industrial Science, University of Tokyo 4 Professor/Director, ICUS, Institute of Industrial Science, University of Tokyo
67
a) Non-retrofitted model b) PP-band retrofitted model
Figure 1 Damaged condition of model house at frequency 5 Hz and acceleration 0.4 g
a) PP-band attached b) Completed house
Figure 2 PP-band retrofitted house in Pakistan
Connecting PP-band mesh at every intersections requires significant time and cost for retrofitting. If we can reduce the number of connecting points of PP-band mesh, this method will be more effective. In this paper, the effects of reduction of PP-band mesh connectivity for fully connected and non-connected PP-band mesh has been investigated. Three brick masonry model houses of ¼ scale with unreinforced masonry (URM), fully connected PP-band mesh (PPF) and non-connected PP-band mesh (PPN) were tested on shake table test by input motions of varying frequency and acceleration. Same locations of PP-band connectivity and mesh pitch were used on the wall for both PPF and PPN models. Surface finishing for the both models was applied.
PREPARATION OF MODEL HOUSES
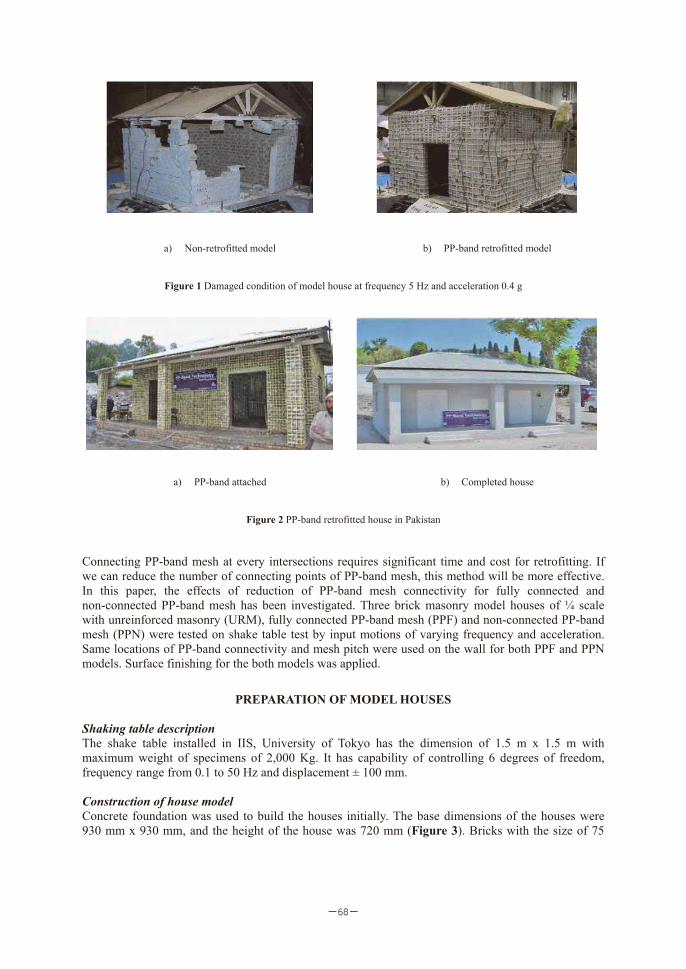
Shaking table description The shake table installed in IIS, University of Tokyo has the dimension of 1.5 m x 1.5 m with maximum weight of specimens of 2,000 Kg. It has capability of controlling 6 degrees of freedom, frequency range from 0.1 to 50 Hz and displacement ± 100 mm. Construction of house model Concrete foundation was used to build the houses initially. The base dimensions of the houses were 930 mm x 930 mm, and the height of the house was 720 mm (Figure 3). Bricks with the size of 75
68
mm x 50 mm x 37.5 mm were placed in 18 layers and the wall thickness of the houses was 50 mm. Mortar having cement, lime, sand ratio as (1: 7.9: 20) with w/c as 0.4 (water to cement ratio) was used.
Figure 3 Model house after completion of brick work
Wooden lintel was placed above the door and window with the dimension and 245 mm x 325 mm respectively. Straws were placed at the bottom layer and after every fourth layer for out of plane connections to bind PP-band with both inside and outside of brick wall (Figure 4). These connections were made by inserting steel wire into whole and perforated steel plate to bind PP-band with the wall (Figure 5). These mesh connections help in avoiding sliding and removing looseness of PP-band.
Figure 4 Straws for out of plane connection Figure 5 Out of plane connection for PP-band
Encountered limitations to decide the model scale factor were dimensions and load capacity due to the limitations of the used shake table capacity. To consider the scale effects of model houses, the additional weight, the weak strength of material, the bigger amplitude or the higher frequency of the input motions and so on can be considered. In these experiments, the low mortal strength was applied due to the limitations of used material and the capacity of the shake table. To set up the wooden roof truss, we used cement block with bolts on top layer (Figure 3). The form work was removed after 7 days and water was sprinkled for same duration. The 28 days were given to the houses to gain strength. Wooden pieces of 30 mm x 50 mm were placed at the top layer of the brick wall to provide level surface for setting up the wooden roof truss.
69
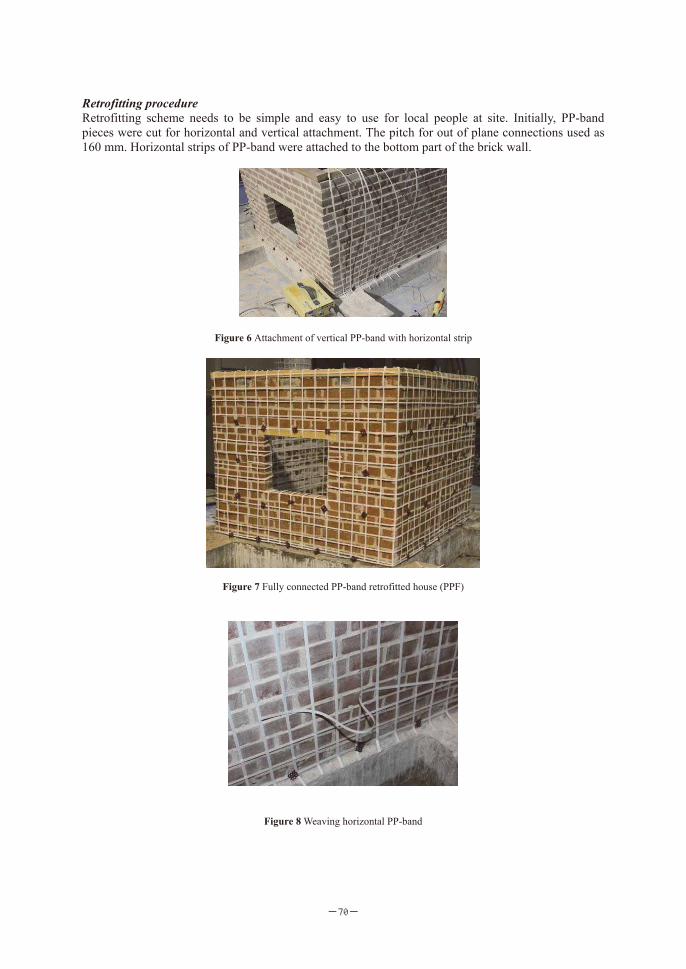
Retrofitting procedure Retrofitting scheme needs to be simple and easy to use for local people at site. Initially, PP-band pieces were cut for horizontal and vertical attachment. The pitch for out of plane connections used as 160 mm. Horizontal strips of PP-band were attached to the bottom part of the brick wall.
Figure 6 Attachment of vertical PP-band with horizontal strip
Figure 7 Fully connected PP-band retrofitted house (PPF)
Figure 8 Weaving horizontal PP-band
70
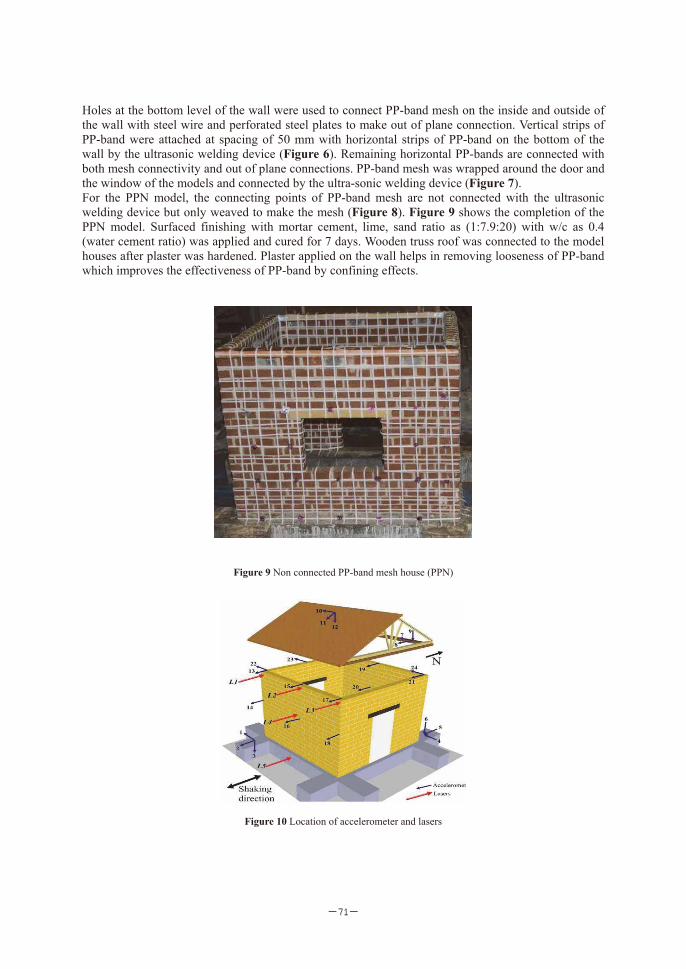
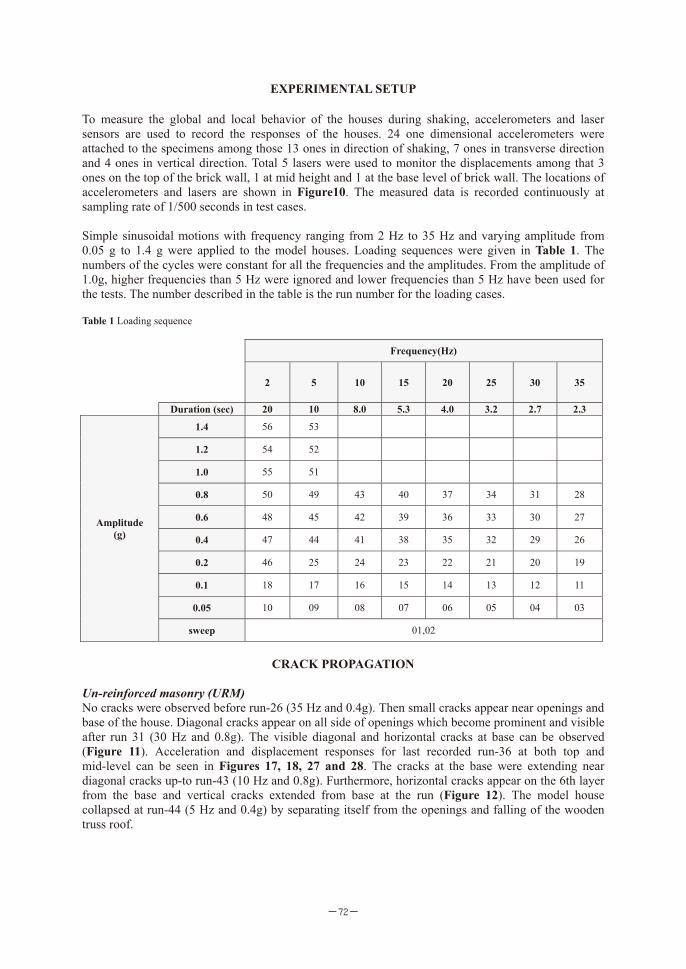
Holes at the bottom level of the wall were used to connect PP-band mesh on the inside and outside of the wall with steel wire and perforated steel plates to make out of plane connection. Vertical strips of PP-band were attached at spacing of 50 mm with horizontal strips of PP-band on the bottom of the wall by the ultrasonic welding device (Figure 6). Remaining horizontal PP-bands are connected with both mesh connectivity and out of plane connections. PP-band mesh was wrapped around the door and the window of the models and connected by the ultra-sonic welding device (Figure 7). For the PPN model, the connecting points of PP-band mesh are not connected with the ultrasonic welding device but only weaved to make the mesh (Figure 8). Figure 9 shows the completion of the PPN model. Surfaced finishing with mortar cement, lime, sand ratio as (1:7.9:20) with w/c as 0.4 (water cement ratio) was applied and cured for 7 days. Wooden truss roof was connected to the model houses after plaster was hardened. Plaster applied on the wall helps in removing looseness of PP-band which improves the effectiveness of PP-band by confining effects.
Figure 9 Non connected PP-band mesh house (PPN)
Figure 10 Location of accelerometer and lasers
71
EXPERIMENTAL SETUP To measure the global and local behavior of the houses during shaking, accelerometers and laser sensors are used to record the responses of the houses. 24 one dimensional accelerometers were attached to the specimens among those 13 ones in direction of shaking, 7 ones in transverse direction and 4 ones in vertical direction. Total 5 lasers were used to monitor the displacements among that 3 ones on the top of the brick wall, 1 at mid height and 1 at the base level of brick wall. The locations of accelerometers and lasers are shown in Figure10. The measured data is recorded continuously at sampling rate of 1/500 seconds in test cases. Simple sinusoidal motions with frequency ranging from 2 Hz to 35 Hz and varying amplitude from 0.05 g to 1.4 g were applied to the model houses. Loading sequences were given in Table 1. The numbers of the cycles were constant for all the frequencies and the amplitudes. From the amplitude of 1.0g, higher frequencies than 5 Hz were ignored and lower frequencies than 5 Hz have been used for the tests. The number described in the table is the run number for the loading cases. Table 1 Loading sequence
CRACK PROPAGATION
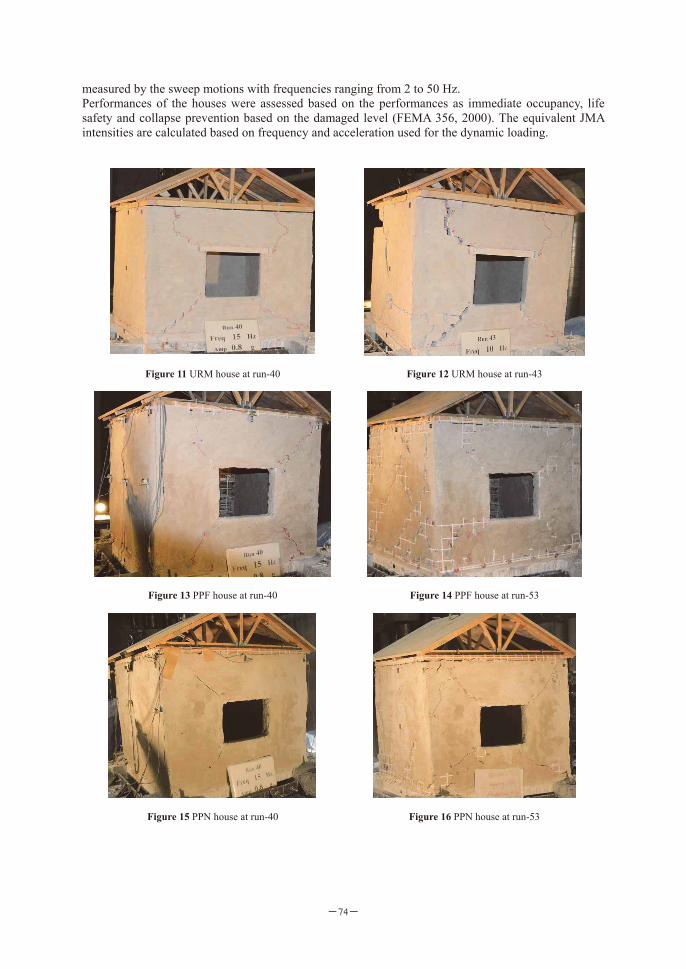
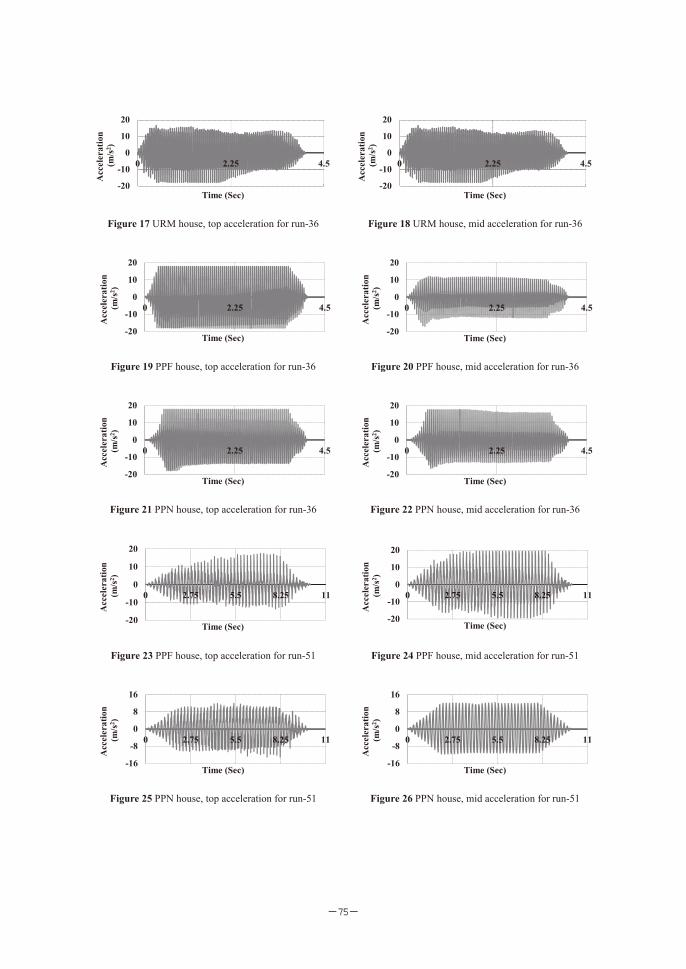
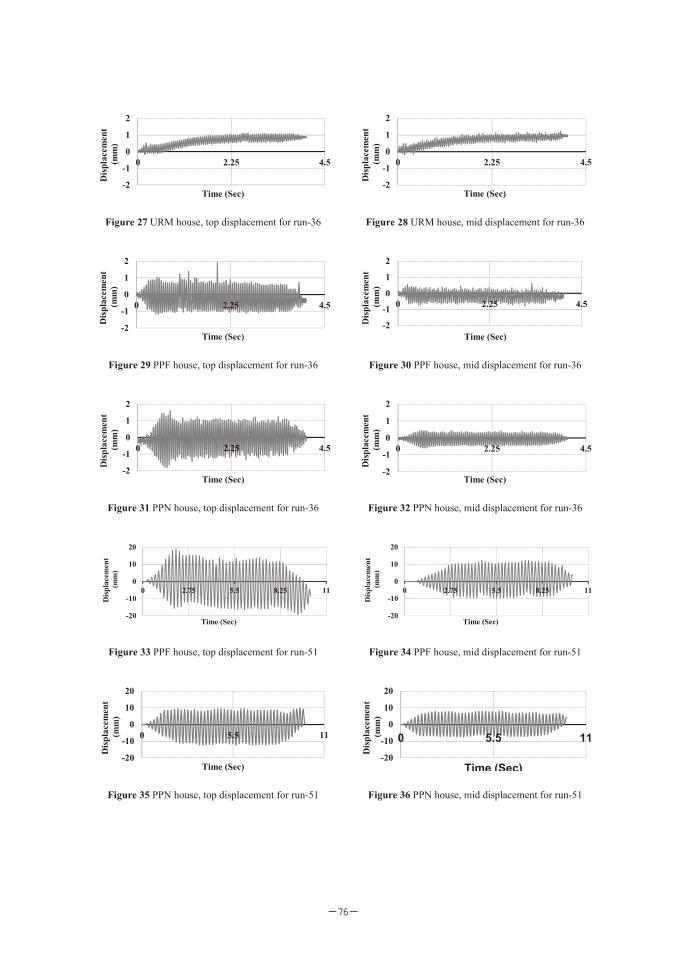
Un-reinforced masonry (URM) No cracks were observed before run-26 (35 Hz and 0.4g). Then small cracks appear near openings and base of the house. Diagonal cracks appear on all side of openings which become prominent and visible after run 31 (30 Hz and 0.8g). The visible diagonal and horizontal cracks at base can be observed (Figure 11). Acceleration and displacement responses for last recorded run-36 at both top and mid-level can be seen in Figures 17, 18, 27 and 28. The cracks at the base were extending near diagonal cracks up-to run-43 (10 Hz and 0.8g). Furthermore, horizontal cracks appear on the 6th layer from the base and vertical cracks extended from base at the run (Figure 12). The model house collapsed at run-44 (5 Hz and 0.4g) by separating itself from the openings and falling of the wooden truss roof.
Frequency(Hz)
2 5 10 15 20 25 30 35
Duration (sec) 20 10 8.0 5.3 4.0 3.2 2.7 2.3
Amplitude (g)
1.4 56 53
1.2 54 52
1.0 55 51
0.8 50 49 43 40 37 34 31 28
0.6 48 45 42 39 36 33 30 27
0.4 47 44 41 38 35 32 29 26
0.2 46 25 24 23 22 21 20 19
0.1 18 17 16 15 14 13 12 11
0.05 10 09 08 07 06 05 04 03
sweep 01,02
72
Fully connected PP-band (PPF) Any significant damage before run-28 (35 Hz and 0.8g) was not observed for the fully connected PP-band house (PPF). After that, cracks from top of opening have initiated. The observed length of hair line cracks were around 90mm ~ 240mm for run-28. Small diagonal cracks near openings appeared after run-32 (25Hz and 0.4g). Acceleration and displacement responses for run-36 at both top and mid-level can be seen in Figs. 19, 20, 29 and 30. Then, diagonal and horizontal cracks at the base were seen at run-37 (20 Hz and 0.8g). The lengths of hair cracks were around 100 mm ~ 250 mm and categorized as slightly non- structural cracked at this run. Clear diagonal cracks at the base and openings were observed at run-40 (Figure 13). The model was categorized as slightly non-structural damage having hair line cracks up to this run. At run-45 (5Hz and 0.6g) out of plane cracks were observed. The observed cracks were not only in the inclined length of wall but also there were vertical cracks around the wall corner. At this run, the observed lengths of cracks were around 300 mm ~ 1,000 mm and the width of cracks were around 4 mm ~ 6 mm seen in the model. The model was classified as slightly structural cracks at this stage of experiment. Acceleration and displacement for last recorded responses for PPF model at top and mid-level of brick wall can be seen in Figures 23, 24, 33 and 34. At run-53 (5Hz and 0.8g) the top part of opening has been damaged and plaster on the wall has fallen (Figure 14). At this run, observed of lengths of crack were around 100 mm ~ 1,000 mm and widths of cracks were 8 mm ~ 14 mm for model. Cracks can be classified as moderate structural cracked for PPF model. New cracks are observed due to the presence of PP-band mesh. The connections of PP-band were slightly broken. Then the run-54 (2 Hz and 1.2g) was the last loading sequence, PPF house collapsed by breaking of PP-band connections from the base. Non connected PP-band (PPN) No cracks observed for the non-connected PP-band house before run-27 (35 Hz and 0.6g). At this run, observed lengths of hair line cracks were 70 mm ~ 225 mm for PPN model. At run-28 (35 Hz and 0.8g) horizontal cracks appeared at the base and opening above door. At this run, observed lengths of hair line cracks were 100 mm ~ 400 mm for model. The model can be categorized as slightly non-structural cracks. Acceleration and displacement responses for run-36 at both top and mid-level can be seen in Figures 21, 22, 31 and 32. At run-37 (20 Hz and 0.8g) cracks keep on extending near the door opening. The length of hair line cracks of 100 mm~300 mm were observed at this run. At run-40 (15Hz and 0.8 g) there were diagonal cracks around door and window openings of PPN model (Figure 15). The observed lengths of hair line were around 150 mm ~ 300 mm. The model can be categorized as slightly non-structural cracks. Out of plane cracks are observed at run-46 (2 Hz and 0.2g) for the house. The cracks were prominent and visible at this run. Small cracks were length of 400 mm ~ 700 mm and width of 4 ~ 6 mm at this run. Cracks were classified as moderate structural cracks at this run. Acceleration and displacement responses for last recorded run-51 at both top and mid-level of brick wall can be seen in Figures 25, 26, 35 and 36. Plaster on the wall fall down from the crack parts of the base at this run. The model was mostly damaged at run-53 (5Hz and 1.2 g) (Figure 16). The observed crack widths were around 8mm ~ 14 mm and length were around 100 mm ~ 800 mm at this run. The cracks for out of plane walls were mostly around corners and base of the model. The length and width of cracks around openings are small in comparison to PPF model. The house collapsed at run-54 (2 Hz and 1.2g) in similarity to PPF model by detachment of PP-band from the base.
PERFORMANCE EVALUATION The initial dynamic characteristics for different model houses were summarized in Table 2. This is
73
measured by the sweep motions with frequencies ranging from 2 to 50 Hz. Performances of the houses were assessed based on the performances as immediate occupancy, life safety and collapse prevention based on the damaged level (FEMA 356, 2000). The equivalent JMA intensities are calculated based on frequency and acceleration used for the dynamic loading.
Figure 11 URM house at run-40
Figure 12 URM house at run-43
Figure 13 PPF house at run-40
Figure 14 PPF house at run-53
Figure 15 PPN house at run-40
Figure 16 PPN house at run-53
74
-20
-10
0
10
20
0 2.25 4.5
Time (Sec)
Acc
eler
atio
n(m
/s2 )
-20
-10
0
10
20
0 2.25 4.5
Time (Sec)
Acc
eler
atio
n(m
/s2 )
Figure 17 URM house, top acceleration for run-36
Figure 18 URM house, mid acceleration for run-36
-20
-10
0
10
20
0 2.25 4.5
Time (Sec)
Acc
eler
atio
n(m
/s2 )
-20
-10
0
10
20
0 2.25 4.5
Time (Sec)
Acc
eler
atio
n(m
/s2 )
Figure 19 PPF house, top acceleration for run-36
Figure 20 PPF house, mid acceleration for run-36
-20
-10
0
10
20
0 2.25 4.5
Time (Sec)
Acc
eler
atio
n(m
/s2 )
-20
-10
0
10
20
0 2.25 4.5
Time (Sec)
Acc
eler
atio
n(m
/s2 )
Figure 21 PPN house, top acceleration for run-36
Figure 22 PPN house, mid acceleration for run-36
-20
-10
0
10
20
0 2.75 5.5 8.25 11
Time (Sec)
Acc
eler
atio
n(m
/s2 )
-20
-10
0
10
20
0 2.75 5.5 8.25 11
Acc
eler
atio
n(m
/s2 )
Time (Sec)
Figure 23 PPF house, top acceleration for run-51
Figure 24 PPF house, mid acceleration for run-51
-16
-8
0
8
16
0 2.75 5.5 8.25 11
Time (Sec)
Acc
eler
atio
n(m
/s2 )
-16
-8
0
8
16
0 2.75 5.5 8.25 11
Time (Sec)
Acc
eler
atio
n(m
/s2 )
Figure 25 PPN house, top acceleration for run-51
Figure 26 PPN house, mid acceleration for run-51
75
-2
-1
0
1
2
0 2.25 4.5
Time (Sec)
Dis
plac
emen
t(m
m)
-2
-1
0
1
2
0 2.25 4.5
Time (Sec)
Dis
plac
emen
t(m
m)
Figure 27 URM house, top displacement for run-36
Figure 28 URM house, mid displacement for run-36
-2
-1
0
1
2
0 2.25 4.5
Time (Sec)
Dis
plac
emen
t(m
m)
-2
-1
0
1
2
0 2.25 4.5
Time (Sec)
Dis
plac
emen
t(m
m)
Figure 29 PPF house, top displacement for run-36
Figure 30 PPF house, mid displacement for run-36
-2
-1
0
1
2
0 2.25 4.5
Time (Sec)
Dis
plac
emen
t(m
m)
-2
-1
0
1
2
0 2.25 4.5
Time (Sec)
Dis
plac
emen
t(m
m)
Figure 31 PPN house, top displacement for run-36
Figure 32 PPN house, mid displacement for run-36
-20
-10
0
10
20
0 2.75 5.5 8.25 11
Time (Sec)
Dis
plac
emen
t(m
m)
-20
-10
0
10
20
0 2.75 5.5 8.25 11
Time (Sec)
Dis
plac
emen
t(m
m)
Figure 33 PPF house, top displacement for run-51
Figure 34 PPF house, mid displacement for run-51
-20
-10
0
10
20
0 5.5 11
Time (Sec)
Dis
plac
emen
t(m
m)
-20
-10
0
10
20
0 5.5 11
Time (Sec)
Dis
plac
emen
t(m
m)
Figure 35 PPN house, top displacement for run-51
Figure 36 PPN house, mid displacement for run-51
76
Table 2 Initial Dynamic properties of models Model House Frequency(Hz) Damping ratio (%)
URM 50 4.8
PPF 51 4.6
PPN 50.8 4.3
Table 3 Performance of URM house model with JMA Intensities
Amplitude
(g) Frequency (Hz)
2 5 10 15 20 25 30 35 1.4 1.2 1.0 0.8 PC LS LS LS IO IO 0.6 TC LS LS LS IO IO IO 0.4 PC LS LS LS IO IO IO 0.2 IO IO IO IO IO IO IO 0.1 IO IO IO IO IO IO IO IO 0.05 IO IO IO IO IO IO IO IO
IO: Immediate occupancy PC: Partially collapsed LS: Life safety TC: Totally collapsed
Index JMA~4 JMA5- JMA5+ JMA6- JMA6+ JMA7 Table 4 Performance of PPF & PPN house model with JMA Intensities
Amplitude (g)
2 5 10 15 20 25 30 35
1.4 LS 1.2 TC LS 1.0 LS 0.8 LS LS IO IO IO IO IO IO 0.6 LS LS IO IO IO IO IO IO 0.4 LS LS IO IO IO IO IO IO 0.2 LS IO IO IO IO IO IO IO 0.1 IO IO IO IO IO IO IO IO 0.05 IO IO IO IO IO IO IO IO
IO: Immediate occupancy LS: Life safety TC: Totally collapsed
Index JMA~4 JMA5- JMA5+ JMA6- JMA6+ JMA7
Table 3 shows the performance of non-retrofitted model (URM) house with different JMA intensity. Lower frequencies are more divesting and JMA intensity is not affected by the duration of loading. Initial cracks were observed at run-26, partially collapse was observed at run-43 and total collapse was observed at run-44 at JMA intensity 5-.The fully connected (PPF) and non-connected (PPN) PP-band retrofitted houses were observed at similar damage level as shown in Table 4. Both houses maintained the level of immediate occupancy whereas the URM partially collapsed. FEMA (FEMA 356, 2000) has defined the performance level and damaged condition by drift limit and damaged level. Drift limit specified for reinforced masonry wall are 0.6% for life safety and 1.5% for collapse prevention. Damaged levels for life safety are extensive cracking distribution throughout the wall, isolated crushing, cracking around corners and openings. Collapse prevention is crushing, extensive cracking, some fallen units and damages around corners and openings.
77
-30
-20
-10
0
10
20
30
-2 -1 0 1 2
Base Shear ''Kn''
Displacement ''mm''
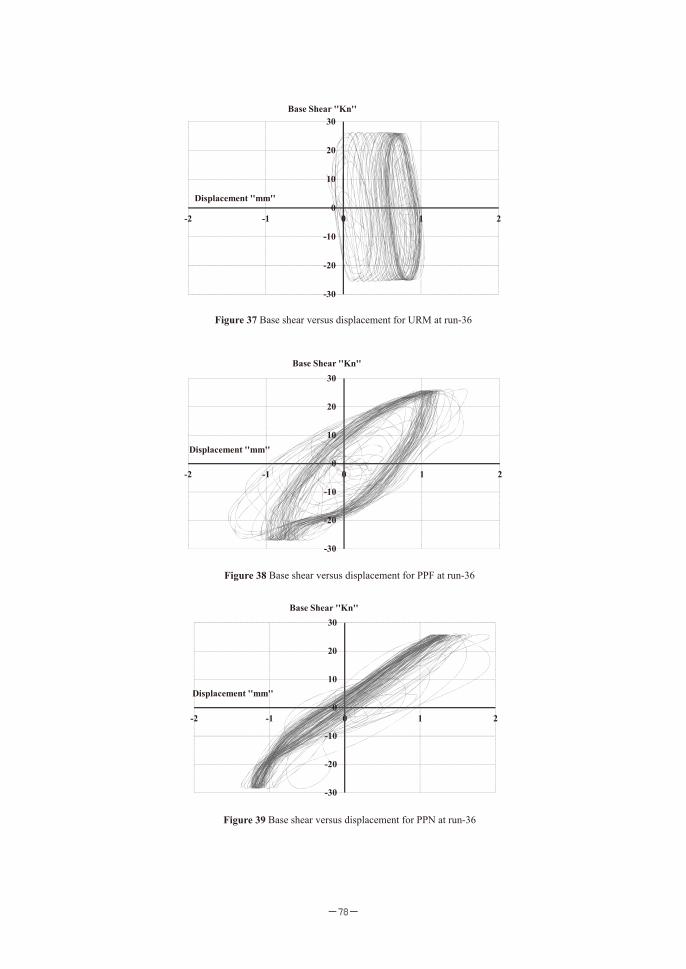
Figure 37 Base shear versus displacement for URM at run-36
-30
-20
-10
0
10
20
30
-2 -1 0 1 2
Displacement ''mm''
Base Shear ''Kn''
Figure 38 Base shear versus displacement for PPF at run-36
-30
-20
-10
0
10
20
30
-2 -1 0 1 2
Displacement ''mm''
Base Shear ''Kn''
Figure 39 Base shear versus displacement for PPN at run-36
78
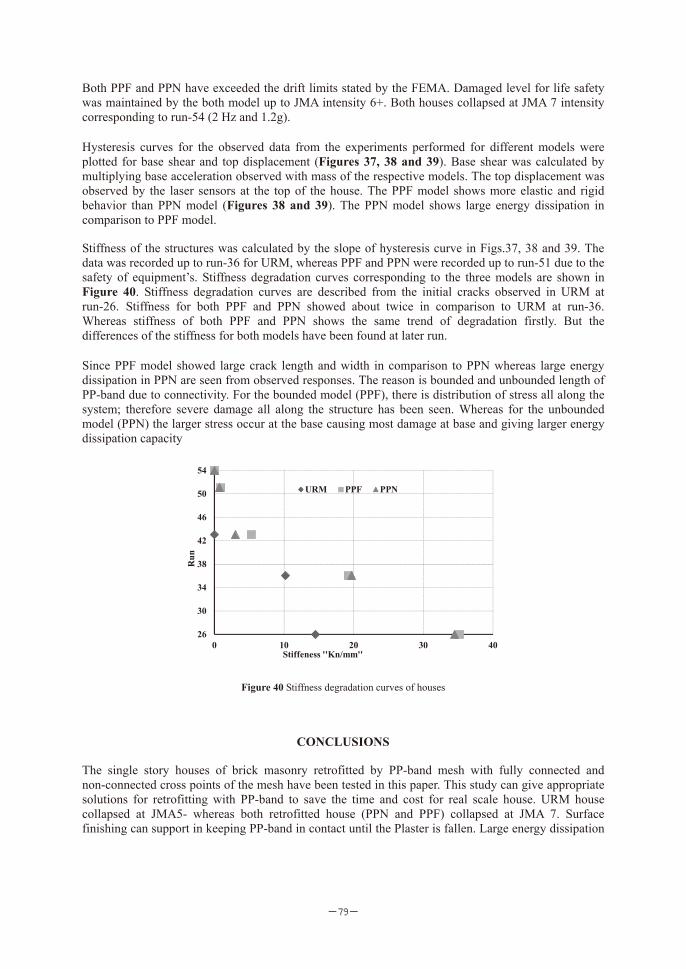
Both PPF and PPN have exceeded the drift limits stated by the FEMA. Damaged level for life safety was maintained by the both model up to JMA intensity 6+. Both houses collapsed at JMA 7 intensity corresponding to run-54 (2 Hz and 1.2g). Hysteresis curves for the observed data from the experiments performed for different models were plotted for base shear and top displacement (Figures 37, 38 and 39). Base shear was calculated by multiplying base acceleration observed with mass of the respective models. The top displacement was observed by the laser sensors at the top of the house. The PPF model shows more elastic and rigid behavior than PPN model (Figures 38 and 39). The PPN model shows large energy dissipation in comparison to PPF model. Stiffness of the structures was calculated by the slope of hysteresis curve in Figs.37, 38 and 39. The data was recorded up to run-36 for URM, whereas PPF and PPN were recorded up to run-51 due to the safety of equipment’s. Stiffness degradation curves corresponding to the three models are shown in Figure 40. Stiffness degradation curves are described from the initial cracks observed in URM at run-26. Stiffness for both PPF and PPN showed about twice in comparison to URM at run-36. Whereas stiffness of both PPF and PPN shows the same trend of degradation firstly. But the differences of the stiffness for both models have been found at later run. Since PPF model showed large crack length and width in comparison to PPN whereas large energy dissipation in PPN are seen from observed responses. The reason is bounded and unbounded length of PP-band due to connectivity. For the bounded model (PPF), there is distribution of stress all along the system; therefore severe damage all along the structure has been seen. Whereas for the unbounded model (PPN) the larger stress occur at the base causing most damage at base and giving larger energy dissipation capacity
26
30
34
38
42
46
50
54
0 10 20 30 40
URM PPF PPN
Stiffeness ''Kn/mm''
Run
Figure 40 Stiffness degradation curves of houses
CONCLUSIONS The single story houses of brick masonry retrofitted by PP-band mesh with fully connected and non-connected cross points of the mesh have been tested in this paper. This study can give appropriate solutions for retrofitting with PP-band to save the time and cost for real scale house. URM house collapsed at JMA5- whereas both retrofitted house (PPN and PPF) collapsed at JMA 7. Surface finishing can support in keeping PP-band in contact until the Plaster is fallen. Large energy dissipation
79
for PPN and PPF can be seen from hysteresis curve. The length and width of cracks observed more severe in PPF than PPN. Although the performance of model houses during the dynamic test for both fully and non-connectivity PP-band gives similar damage level and stiffness degradation but observed length and width of cracks were more severe in PPF than PPN models. The PPN can be shown to save life safety and human casualties. The PPN showed for the appropriate solution for masonry structure retrofitting with existing and new constructions
REFERENCES Y. Zhuge. (2010). FRP-Retrofitted URM Walls under in Plane Shear: Review and Assessment of Available Models. ASCE Journal of Composites for Construction, 14: 6, 743-753. Coburn, A. and Spence, R. 2002.Earthquake Protection. West Sussex: John Wiley & Sons Ltd. ISBN 0-471-49614-6 Mayorca, P. and Meguro, K. (2004) Proposal of an Efficient Technique for Retrofitting Unreinforced Masonry Dwelling Proceedings on 13th World Conference on Earthquake Engineering, Vancouver, Canada Sathiparan, N. and Meguro, K. (2012). “Seismic behavior of low earthquake-resistant arch shaped roof masonry houses retrofitted by PP-band meshes.” ASCE Practice Periodical on Structural Design and Construction. 17(2), 54-64. FEMA 356, 2000. Prestandard and Commentary of the Seismic Rehabilitation of Building. Federal Emergency Management Agency.
80


![MARINE DIESEL ENGINES Yanmar Saildrive SD20 Yanmar ...€¦ · Yanmar Saildrive Type SD25 Reduction gear system Constant mesh gear with dog clutch Reduction ratio [fwd/asn] 2.64/2.64](https://img.pdfslide.net/doc/110x75/6079f2b58c534c4ae36adf4c/marine-diesel-engines-yanmar-saildrive-sd20-yanmar-yanmar-saildrive-type-sd25.jpg)