Embed Size (px)
Citation preview

1
Experimental analysis of energy performance of modified single-stage CO2 transcritical vapour compression cycles based
on vapour injection in the suction line
Ramón Cabello a *, Daniel Sánchez a, Jorge Patiño a,
Rodrigo Llopis a, Enrique Torrella b
aDepartment of Mechanical Engineering and Construction, Campus de Riu Sec. Jaume I University, E-
12071 Castellón, Spain.
bDepartment of Applied Thermodynamics, Camino de Vera, 14. Polytechnic University of Valencia, E-
46022 Valencia, Spain
*Corresponding Author: [email protected] ; Tel. +34 964 728135; Fax: +34 964 728106
Abstract. This work presents the experimental evaluation of the energy performance of a modified single-stage CO2 transcritical refrigeration plant with an internal heat exchanger (IHX) based on vapour injection in suction line. This modification, which is only applicable to refrigeration plants with an expansion process divided in two stages with a liquid receiver between them, consists of extracting saturated vapour from the liquid receiver in order to: decrease the vapour quality at the evaporator inlet, and reduce the superheating degree at the compressor suction by means of the expansion and following injection of the extracted refrigerant. Three different injection points have been evaluated experimentally: before the IHX, after the IHX and just before the suction chamber of the compressor. The experimental measurements show that the cooling capacity and COP can be enhanced in 9.81% and 7.01%, respectively. Furthermore, a reduction in the discharge temperature of the compressor up to 14.7ºC has been measured inside the evaluation range. KEYWORDS transcritical cycle CO2 vapour injection suction line COP

2
Nomenclature
COP coefficient of performance h enthalpy (kJ·kg-1)
IHX internal heat exchanger
m mass flow rate (kg·s-1) N compressor speed (rpm) P pressure (MPa) PC power consumption (kW)
Q heat transfer rate (kW)
q volumetric flow rate (m3·h-1)
SH superheating degree (ºC) T temperature (ºC)
TSH total superheating degree (ºC) W specific compression work (kJ · kg-1)
Greek Symbols
Increment
C compression efficiency
Subscripts
BP back-pressure C compressor
Dis discharge ev evaporator GC gas-cooler Glic water-ethylenglycol mixture (50% by vol.) in inlet
IHX internal heat exchanger Inj injection
Liq Rec liquid receiver Sat_Liq saturated liquid
out Outlet s isentropic
SC semi-hermetic compressor SL suction line
Suc suction Sat_Vap saturated vapour
W water x vapour quality

3
1. Introduction. One of the most important drawbacks for CO2 transcritical vapour compression cycles is its lower COP in comparison with the values achieved by conventional subcritical cycles using HFCs or HC as working fluids when the heat is rejected to medium and hot environmental temperatures. However, its safety and environmental properties [1] and its high heat transfer coefficients [2] make CO2 one of the possible alternatives to the HFCs, especially in heat pumps [3] or in applications with important leakage rates, such as mobile air conditioning and commercial refrigeration [4]. Efficiency improvement of CO2 transcritical vapour compression cycles has been tackled from two points of view: First, focusing on the optimization of the components of the plants, such as compressors [5], heat exchangers, expansion devices [6], etc... Second, trying to improve the COP by means of modifications of the basic thermodynamic cycle, for example the introduction of IHXs, as done by Torrella et al. [7], Aprea and Mariorino [8] or Zhang et al. [9] which all demonstrated its possibilities, or using two-stage compression systems [10] to benefit the compression process. The aim of this work is to present the experimental evaluation of a modified CO2 single-stage transcritical vapour compression cycle, with a two-stage expansion system (Figure 1). The modification, consists of extracting saturated vapour from the liquid receiver placed between expansion stages (point 7, Figure 1), and the subsequent injection of the expanded vapour in suction line. The effect of this cycle modification on the Ph diagram is shown in Figure 1.
Figure 1 – Layout and Ph diagram of CO2 transcritical cycle with injection system
As can it be deduced from the Ph diagram (Figure 1), as more quantity of vapour is extracted from the receiver, lower the liquid receiver pressure, lower the evaporator inlet enthalpy and lower the compressor suction temperature will be. However, all those positive effects are counteracted by a reduction of the refrigerant mass flow rate through the evaporator, since a part of them is extracted from the receiver. The interaction between these opposite effects will lead to an increase or to a reduction of the cooling capacity and the COP of the refrigeration cycle. This experimental study intends to contribute to the understanding of the possibilities of enhancing the performance of CO2 single-stage transcritical vapour compression cycles with small cycle modifications. For the first time, this study focuses on the analysis of a modified CO2 transcritical single-stage double expansion cycle based on the extraction of refrigerant from the intermediate liquid receiver. In this work, three different injection points of the

4
extracted refrigerant have been analysed experimentally over a wide range of operating conditions, and from the experimental data, the best energetic solution has been determined. As discussed in the paper, this cycle modification has proven to be interesting, since allows to enhance the COP and the capacity of the cycle with a simple modification.

5
2. Experimental plant and evaluation tests The experimental refrigeration plant and the evaluation tests performed are presented in this section. All the average cycle parameters measured in the evaluation process are gathered in Table 3.
2.1 Experimental plant The scheme of the refrigeration plant is shown in Figure 2, where the main components are denoted with capital letters and the location of pressure and temperature sensors are indicated with ‘P’ and ‘T’, respectively. The plant, which corresponds to a CO2 single-stage transcritical plant, is driven by a semi-hermetic reciprocating compressor (A) (displacement of 3.5m3·h-1 at 1450 rpm). Two coaxial counter-current heat exchangers are used as gas-cooler (B) and evaporator (G), using water and an ethylene-glycol/water mixture (50% in vol.) as secondary fluids, respectively. A two-stage expansion system with a liquid receiver between stages (E) is installed in order to control the gas-cooler high pressure (with a pressostatic expansion valve, D) and to allow the evaporating process to be regulated (with a thermostatic electronic expansion valve, F). The operation of this two-stage system was analysed in detail in the work of Cabello et al. [11]. A coaxial internal heat exchanger (IHX) in counter-current layout (C) is placed at the exit of the gas-cooler to enhance the performance of the experimental facility, as demonstrated experimentally by Torrella et al. [7] and Aprea and Maiorino [8]. Finally, a second pressostatic expansion valve (D’) is installed to control the liquid receiver pressure through the extraction of saturated vapour from its upper part. All the components and their inter-connection lines, with the exception of the compressor and the discharge line, are thermally isolated with a flexible insulation material with an average thermal conductivity of 0.037W·m-1·ºC-1. The different injection points in the suction line evaluated in the present work, are denoted by (a), (b) and (c) in Figure 2. Point (a) corresponds to the exit of the evaporator, point (b) to the exit of the IHX and point (c) to just before the suction chamber of the compressor (Figure 3).
Figure 2 – Experimental facility diagram
6
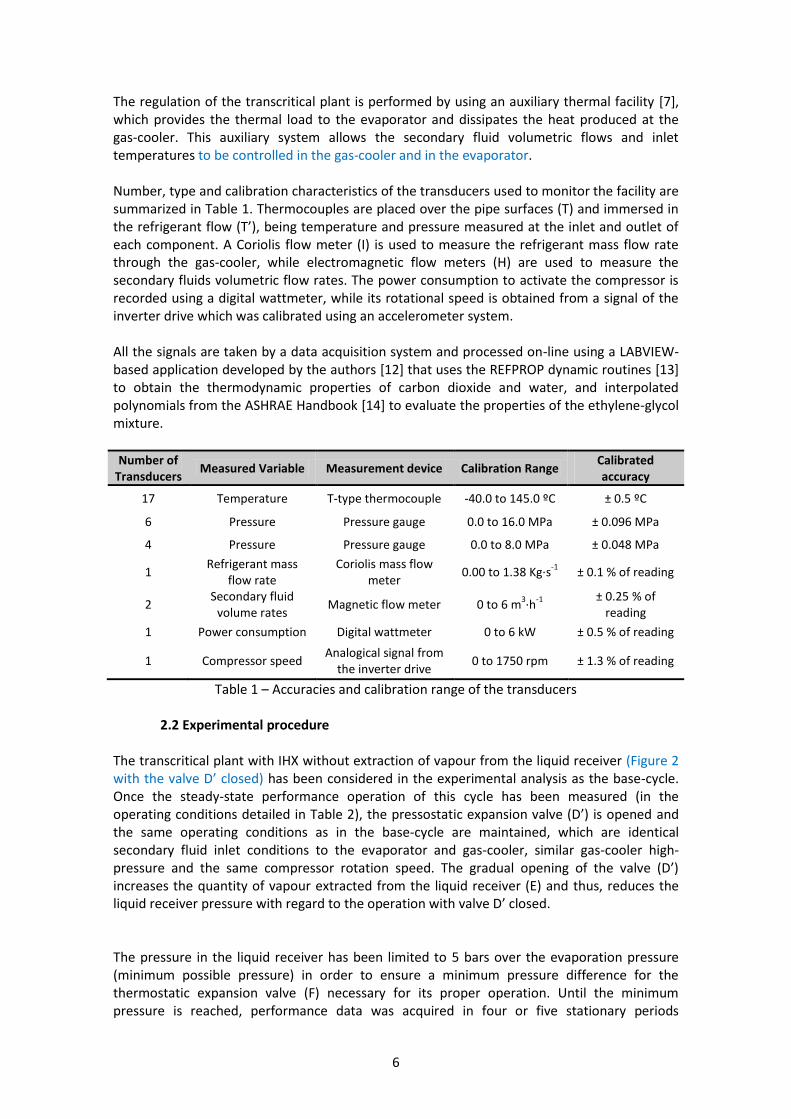
The regulation of the transcritical plant is performed by using an auxiliary thermal facility [7], which provides the thermal load to the evaporator and dissipates the heat produced at the gas-cooler. This auxiliary system allows the secondary fluid volumetric flows and inlet temperatures to be controlled in the gas-cooler and in the evaporator. Number, type and calibration characteristics of the transducers used to monitor the facility are summarized in Table 1. Thermocouples are placed over the pipe surfaces (T) and immersed in the refrigerant flow (T’), being temperature and pressure measured at the inlet and outlet of each component. A Coriolis flow meter (I) is used to measure the refrigerant mass flow rate through the gas-cooler, while electromagnetic flow meters (H) are used to measure the secondary fluids volumetric flow rates. The power consumption to activate the compressor is recorded using a digital wattmeter, while its rotational speed is obtained from a signal of the inverter drive which was calibrated using an accelerometer system. All the signals are taken by a data acquisition system and processed on-line using a LABVIEW-based application developed by the authors [12] that uses the REFPROP dynamic routines [13] to obtain the thermodynamic properties of carbon dioxide and water, and interpolated polynomials from the ASHRAE Handbook [14] to evaluate the properties of the ethylene-glycol mixture.
Number of Transducers
Measured Variable Measurement device Calibration Range Calibrated accuracy
17 Temperature T-type thermocouple -40.0 to 145.0 ºC ± 0.5 ºC
6 Pressure Pressure gauge 0.0 to 16.0 MPa ± 0.096 MPa
4 Pressure Pressure gauge 0.0 to 8.0 MPa ± 0.048 MPa
1 Refrigerant mass
flow rate Coriolis mass flow
meter 0.00 to 1.38 Kg·s
-1 ± 0.1 % of reading
2 Secondary fluid
volume rates Magnetic flow meter 0 to 6 m
3·h
-1
± 0.25 % of reading
1 Power consumption Digital wattmeter 0 to 6 kW ± 0.5 % of reading
1 Compressor speed Analogical signal from
the inverter drive 0 to 1750 rpm ± 1.3 % of reading
Table 1 – Accuracies and calibration range of the transducers
2.2 Experimental procedure The transcritical plant with IHX without extraction of vapour from the liquid receiver (Figure 2 with the valve D’ closed) has been considered in the experimental analysis as the base-cycle. Once the steady-state performance operation of this cycle has been measured (in the operating conditions detailed in Table 2), the pressostatic expansion valve (D’) is opened and the same operating conditions as in the base-cycle are maintained, which are identical secondary fluid inlet conditions to the evaporator and gas-cooler, similar gas-cooler high-pressure and the same compressor rotation speed. The gradual opening of the valve (D’) increases the quantity of vapour extracted from the liquid receiver (E) and thus, reduces the liquid receiver pressure with regard to the operation with valve D’ closed. The pressure in the liquid receiver has been limited to 5 bars over the evaporation pressure (minimum possible pressure) in order to ensure a minimum pressure difference for the thermostatic expansion valve (F) necessary for its proper operation. Until the minimum pressure is reached, performance data was acquired in four or five stationary periods
7
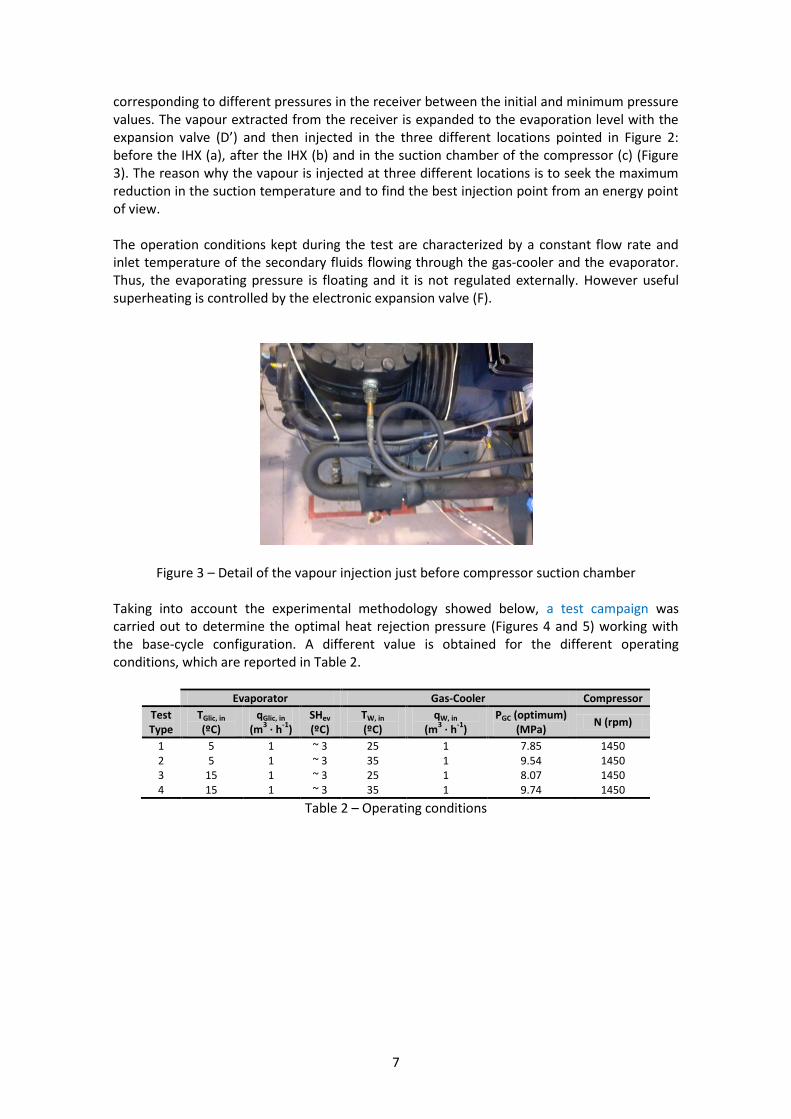
corresponding to different pressures in the receiver between the initial and minimum pressure values. The vapour extracted from the receiver is expanded to the evaporation level with the expansion valve (D’) and then injected in the three different locations pointed in Figure 2: before the IHX (a), after the IHX (b) and in the suction chamber of the compressor (c) (Figure 3). The reason why the vapour is injected at three different locations is to seek the maximum reduction in the suction temperature and to find the best injection point from an energy point of view. The operation conditions kept during the test are characterized by a constant flow rate and inlet temperature of the secondary fluids flowing through the gas-cooler and the evaporator. Thus, the evaporating pressure is floating and it is not regulated externally. However useful superheating is controlled by the electronic expansion valve (F).
Figure 3 – Detail of the vapour injection just before compressor suction chamber Taking into account the experimental methodology showed below, a test campaign was carried out to determine the optimal heat rejection pressure (Figures 4 and 5) working with the base-cycle configuration. A different value is obtained for the different operating conditions, which are reported in Table 2.
Evaporator Gas-Cooler Compressor
Test Type
TGlic, in (ºC)
qGlic, in (m
3 · h
-1)
SHev
(ºC) TW, in (ºC)
qW, in (m
3 · h
-1)
PGC (optimum) (MPa)
N (rpm)
1 5 1 ~ 3 25 1 7.85 1450 2 5 1 ~ 3 35 1 9.54 1450 3 15 1 ~ 3 25 1 8.07 1450 4 15 1 ~ 3 35 1 9.74 1450
Table 2 – Operating conditions

8
Figure 4 – Evolution of COP with Gas-Cooler pressure (TGlic, in: 5ºC)
Figure 5 – Evolution of COP with Gas-Cooler pressure (TGlic, in: 15ºC)
Results depicted in Figures 4 and 5, in reference to the optimum heat rejection pressure, are in accordance with the performance of this kind of refrigeration facilities, as reported by Sarkar et al. [15], Liao et al. [16] and Kauf [17], which were discussed in a previous work of Cabello et al. [11].
2.3 Experimental tests
Considering the operating conditions shown in Table 2, a series of tests were carried out for the three possible injection points, which covered the pressure range of the liquid receiver from the value obtained with the valve (D’) closed to a pressure five bar upon the evaporating pressure. In summary, eighty-six stationary periods with fourteen minutes of duration each were done. In Table 3, all the tests are summarized, where the variation range of the different parameters is shown. The variables with asterisk represent the average value during the entire test.

9
Evaporator Gas-Cooler Liquid
receiver Compressor
Test Type
Number of repetitions
TGlic,
in*
(ºC)
qGlic, in*
(m3 · h
-1)
PO (MPa) (max ÷ min)
SHev*
(ºC) TW, in
*
(ºC) qW, in
*
(m3 · h
-1)
PGC*
(MPa) PLiq Rec (MPa) (max ÷ min)
N*
(rpm)
Base cycle
1 8 5.02 1.00 2.58 ÷ 2.49 2.25 24.99 1.05 10.50 ÷ 7.26 7.25 ÷ 5.24 1451.93 2 5 5.09 1.01 2.64 ÷ 2.61 2.32 35.03 1.01 10.49 ÷ 9.01 7.10 ÷ 6.40 1448.78 3 7 14.98 1.01 3.13 ÷ 3.07 2.54 25.02 1.01 10.50 ÷ 7.50 6.98 ÷ 5.48 1449.63 4 5 15.03 1.01 3.35 ÷ 3.26 0.52 35.08 1.01 10.51 ÷ 8.98 7.32 ÷ 6.64 1449.05
Cycle with injection before IHX
1 5 5.06 1.01 2.59 ÷ 2.48 1.33 24.96 1.01 7.79 5.81 ÷ 3.03 1450.88 2 4 5.02 1.02 2.73 ÷ 2.62 2.68 35.00 1.02 9.50 6.73 ÷ 4.10 1448.94 3 4 15.04 1.02 3.21 ÷ 3.13 1.04 25.03 1.02 8.03 6.45 ÷ 4.01 1451.10 4 4 15.00 1.00 3.38 ÷ 3.29 2.24 34.86 1.00 9.69 6.94 ÷ 4.07 1448.43
Cycle with injection after IHX
1 5 4.92 1.01 2.59 ÷ 2.49 1.20 25.02 1.02 7.79 5.84 ÷ 3.04 1451.36 2 6 5.05 0.99 2.76 ÷ 2.64 2.48 35.11 1.02 9.50 6.82 ÷ 3.22 1449.81 3 4 15.06 1.02 3.21 ÷ 3.13 1.02 25.02 1.02 8.06 6.36 ÷ 3.97 1450.44 4 4 14.99 1.02 3.44 ÷ 3.30 2.04 35.02 1.00 9.71 6.79 ÷ 4.10 1448.85
Cycle with injection just before compressor suction chamber
1 5 4.93 1.02 2.59 ÷ 2.48 1.28 25.01 1.02 7.80 5.81 ÷ 3.02 1451.66 2 9 4.99 1.02 2.75 ÷ 2.63 2.23 35.00 1.02 9.50 6.75 ÷ 3.25 1449.51 3 6 15.04 1.01 3.22 ÷ 3.13 1.14 25.00 1.02 7.99 6.36 ÷ 3.81 1450.79 4 5 15.01 1.01 3.46 ÷ 3.30 6.11 34.99 1.01 9.71 6.95 ÷ 3.85 1448.63
Table 3 – Test range 3. Energy analysis The energy analysis has been based on the evaluation of the COP and cooling capacity provided by the mentioned cycle modifications. Expressions (1) and (2) are used to calculate those energy parameters as function of the refrigerant mass flow rate through the evaporator,
evm , which depends on the injected refrigerant mass flow rate, Injm (3).
out ev,in ev,evev hhmQ (1)
C
ev
P
QCOP
(2)
InjGCev mmm (3)
The injected refrigerant mass flow rate is calculated by means of expression (4). This equation results from the mass and energy balances in the liquid receiver (E), considering an isenthalpic expansion process in valve (D’) and neglecting heat exchange with the environment, since the receiver is thermally isolated.
Sat_LiqSat_Vap
Sat_Liqin BP,GCInj
hh
hhmm
(4)
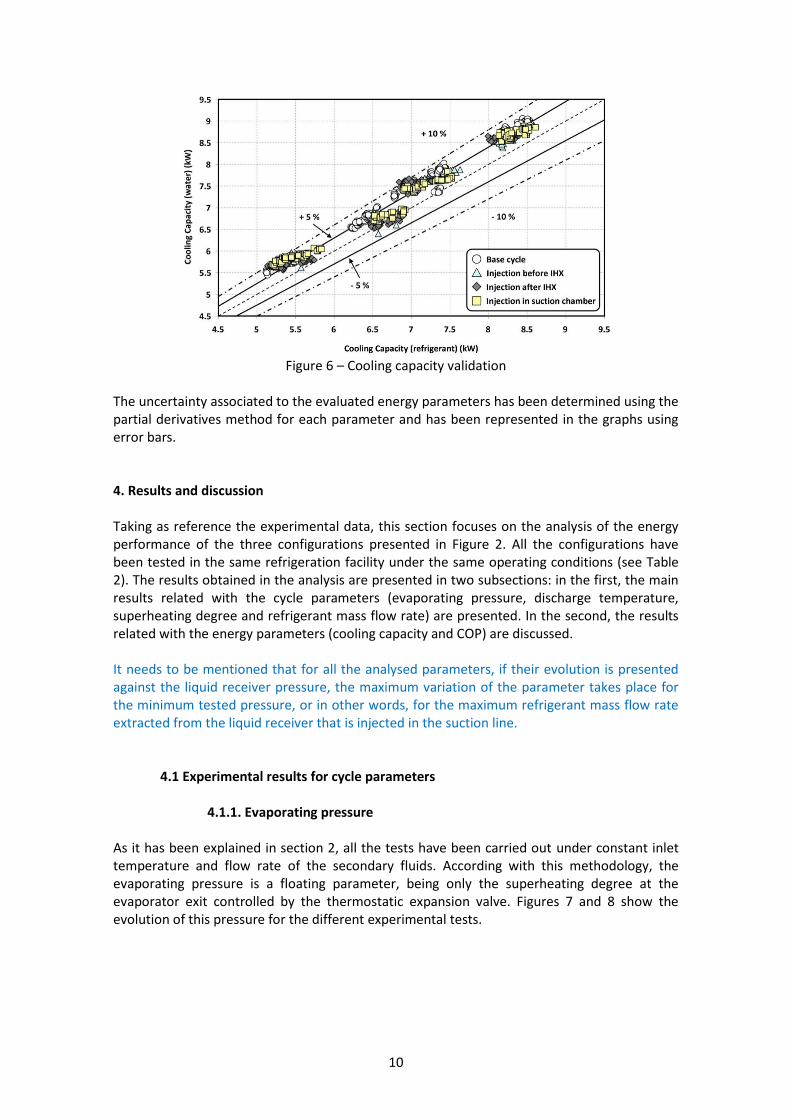
In Figure 6, the validation of the evaluated cooling capacity with equation (1) and the measured heat transfer rate in the secondary fluid through the evaporator is presented. The maximum deviation showed by the measurements in Figure 6 is lower than 10%, with a deviation under 7% for the 83.1% of the evaluation points, what can be considered as an appropriate accuracy for the analysis of this work.
10
Figure 6 – Cooling capacity validation
The uncertainty associated to the evaluated energy parameters has been determined using the partial derivatives method for each parameter and has been represented in the graphs using error bars. 4. Results and discussion Taking as reference the experimental data, this section focuses on the analysis of the energy performance of the three configurations presented in Figure 2. All the configurations have been tested in the same refrigeration facility under the same operating conditions (see Table 2). The results obtained in the analysis are presented in two subsections: in the first, the main results related with the cycle parameters (evaporating pressure, discharge temperature, superheating degree and refrigerant mass flow rate) are presented. In the second, the results related with the energy parameters (cooling capacity and COP) are discussed. It needs to be mentioned that for all the analysed parameters, if their evolution is presented against the liquid receiver pressure, the maximum variation of the parameter takes place for the minimum tested pressure, or in other words, for the maximum refrigerant mass flow rate extracted from the liquid receiver that is injected in the suction line.
4.1 Experimental results for cycle parameters
4.1.1. Evaporating pressure
As it has been explained in section 2, all the tests have been carried out under constant inlet temperature and flow rate of the secondary fluids. According with this methodology, the evaporating pressure is a floating parameter, being only the superheating degree at the evaporator exit controlled by the thermostatic expansion valve. Figures 7 and 8 show the evolution of this pressure for the different experimental tests.

11
Figure 7 – Evaporating pressure for different injection conditions (TGlic, in: 5ºC)
Figure 8 – Evaporating pressure for different injection conditions (TGlic, in: 15ºC)
As can be observed for all the tests in Figure 7 and 8, there is an increase of the evaporating pressure, up to a 5%, when the pressure of the liquid receiver is reduced. The increase of the evaporating pressure results in a reduction of the compression ratio, which consequence is an increase of the refrigerant mass flow rate displaced by the compressor.
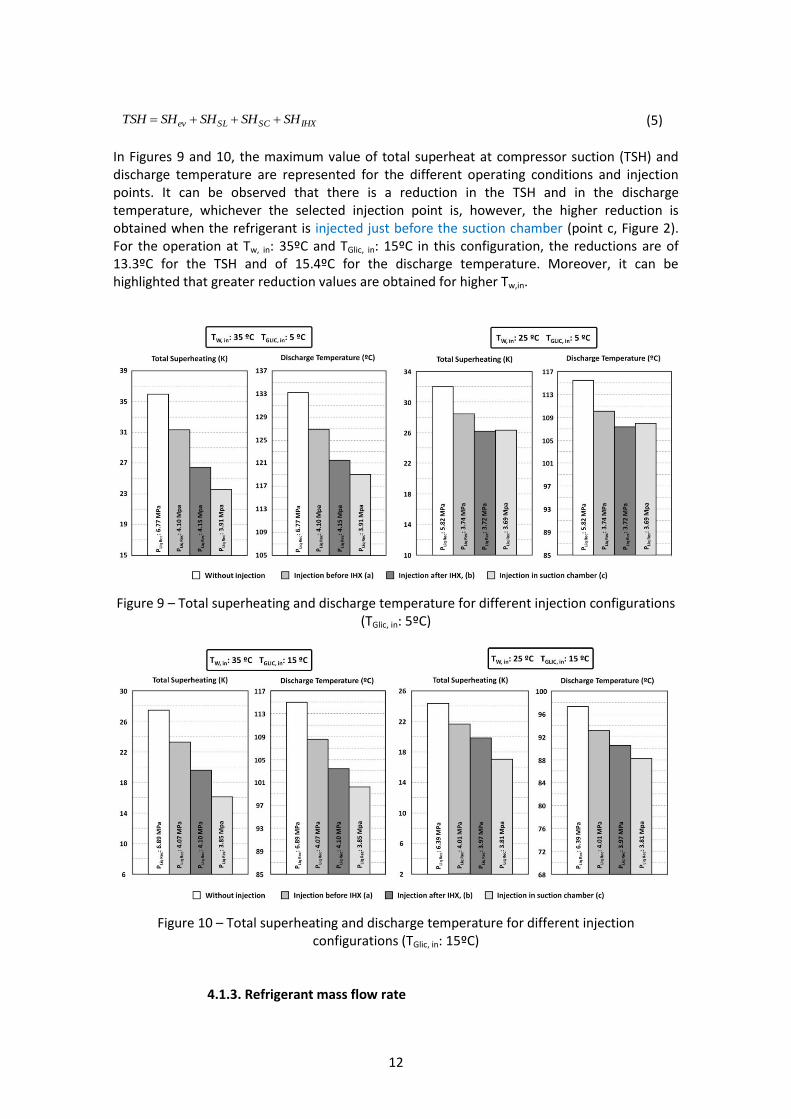
4.1.2. Total superheating degree and discharge temperature The energy efficiency of a vapour compression cycle is strongly penalized by the increase of the superheat at the compressor suction, especially in CO2 due to its thermophysical properties, as analysed in detail for a semihermetic compressor by Sánchez et al. [5]. This superheat at the compressor suction affects the discharge temperature, the refrigerant mass flow rate and the specific compression work. Accordingly, the injection of the vapour extracted from the liquid receiver allows this suction superheat (TSH) to be reduced. In the analysed configurations, the reduction will depend on the selected injection point, either (a), (b) or (c) (Figure 2). The relation used to calculate the total superheat at the compression suction is show by expression (5).
12
IHXSCSLev SHSHSHSHTSH (5)
In Figures 9 and 10, the maximum value of total superheat at compressor suction (TSH) and discharge temperature are represented for the different operating conditions and injection points. It can be observed that there is a reduction in the TSH and in the discharge temperature, whichever the selected injection point is, however, the higher reduction is obtained when the refrigerant is injected just before the suction chamber (point c, Figure 2). For the operation at Tw, in: 35ºC and TGlic, in: 15ºC in this configuration, the reductions are of 13.3ºC for the TSH and of 15.4ºC for the discharge temperature. Moreover, it can be highlighted that greater reduction values are obtained for higher Tw,in.
Figure 9 – Total superheating and discharge temperature for different injection configurations (TGlic, in: 5ºC)
Figure 10 – Total superheating and discharge temperature for different injection configurations (TGlic, in: 15ºC)
4.1.3. Refrigerant mass flow rate
13
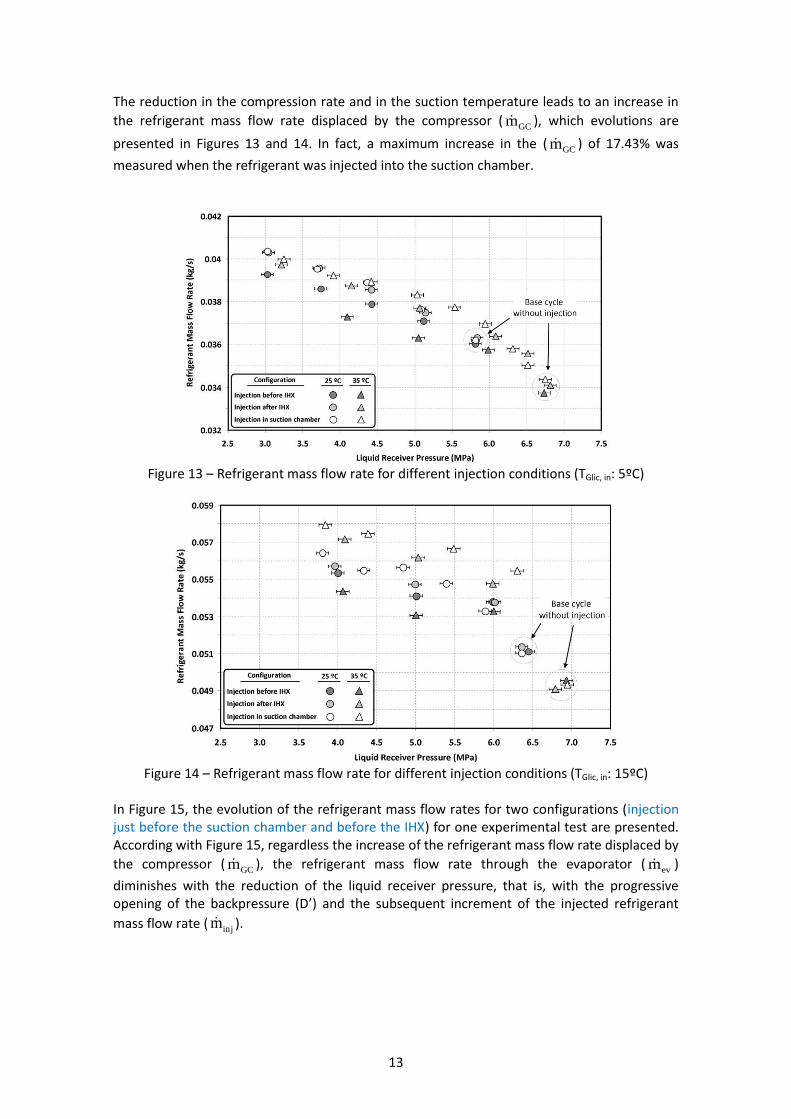
The reduction in the compression rate and in the suction temperature leads to an increase in
the refrigerant mass flow rate displaced by the compressor (GCm ), which evolutions are
presented in Figures 13 and 14. In fact, a maximum increase in the (GCm ) of 17.43% was
measured when the refrigerant was injected into the suction chamber.
Figure 13 – Refrigerant mass flow rate for different injection conditions (TGlic, in: 5ºC)
Figure 14 – Refrigerant mass flow rate for different injection conditions (TGlic, in: 15ºC)
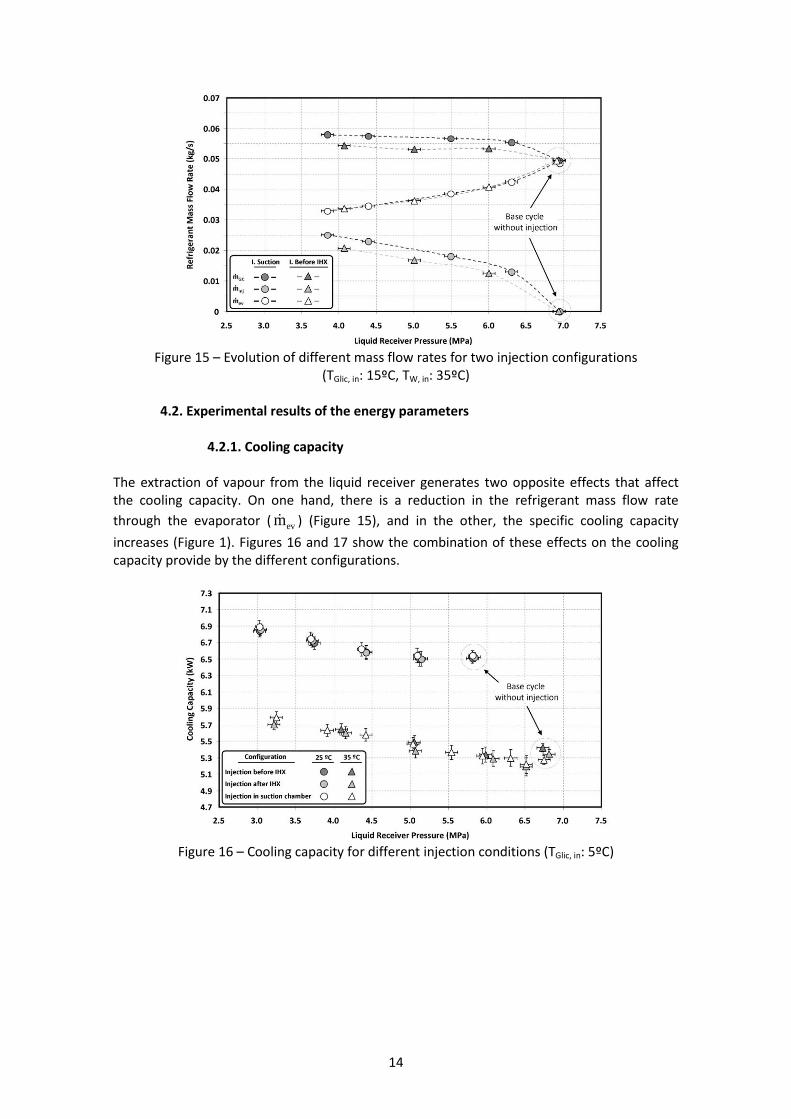
In Figure 15, the evolution of the refrigerant mass flow rates for two configurations (injection just before the suction chamber and before the IHX) for one experimental test are presented. According with Figure 15, regardless the increase of the refrigerant mass flow rate displaced by
the compressor (GCm ), the refrigerant mass flow rate through the evaporator (
evm )
diminishes with the reduction of the liquid receiver pressure, that is, with the progressive opening of the backpressure (D’) and the subsequent increment of the injected refrigerant
mass flow rate ( injm ).
14
Figure 15 – Evolution of different mass flow rates for two injection configurations
(TGlic, in: 15ºC, TW, in: 35ºC)
4.2. Experimental results of the energy parameters
4.2.1. Cooling capacity The extraction of vapour from the liquid receiver generates two opposite effects that affect the cooling capacity. On one hand, there is a reduction in the refrigerant mass flow rate
through the evaporator ( evm ) (Figure 15), and in the other, the specific cooling capacity
increases (Figure 1). Figures 16 and 17 show the combination of these effects on the cooling capacity provide by the different configurations.
Figure 16 – Cooling capacity for different injection conditions (TGlic, in: 5ºC)
15
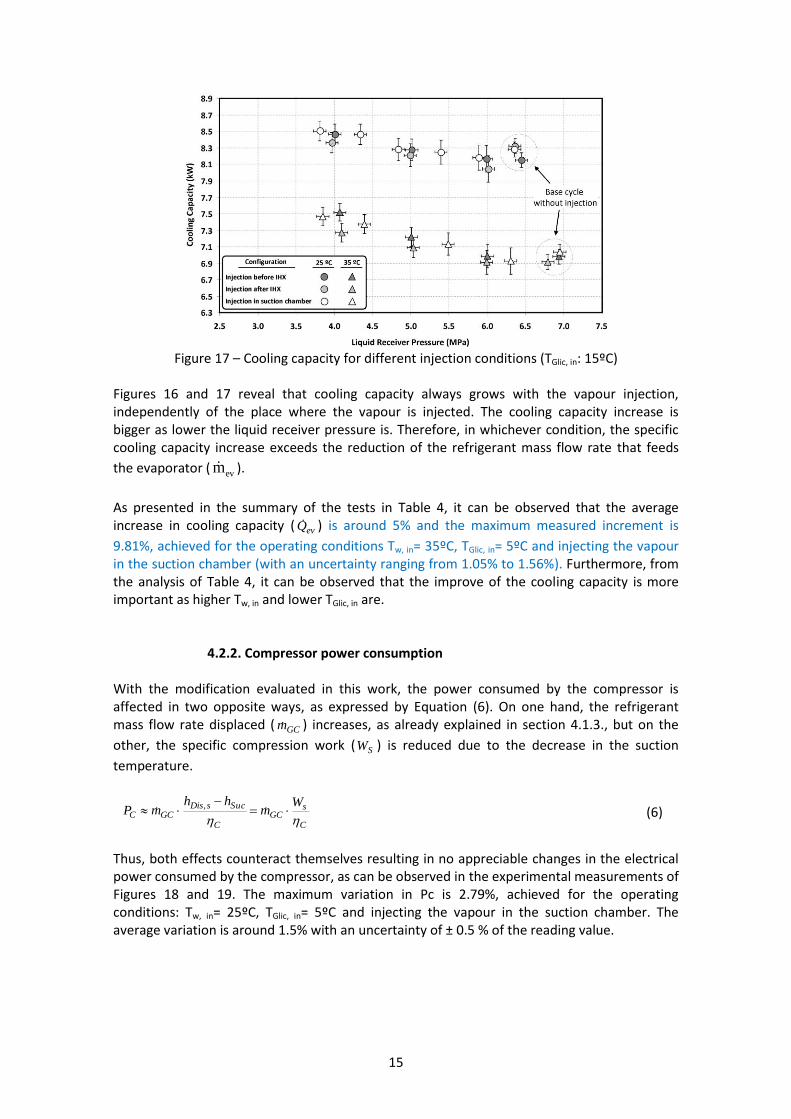
Figure 17 – Cooling capacity for different injection conditions (TGlic, in: 15ºC)
Figures 16 and 17 reveal that cooling capacity always grows with the vapour injection, independently of the place where the vapour is injected. The cooling capacity increase is bigger as lower the liquid receiver pressure is. Therefore, in whichever condition, the specific cooling capacity increase exceeds the reduction of the refrigerant mass flow rate that feeds
the evaporator ( evm ).
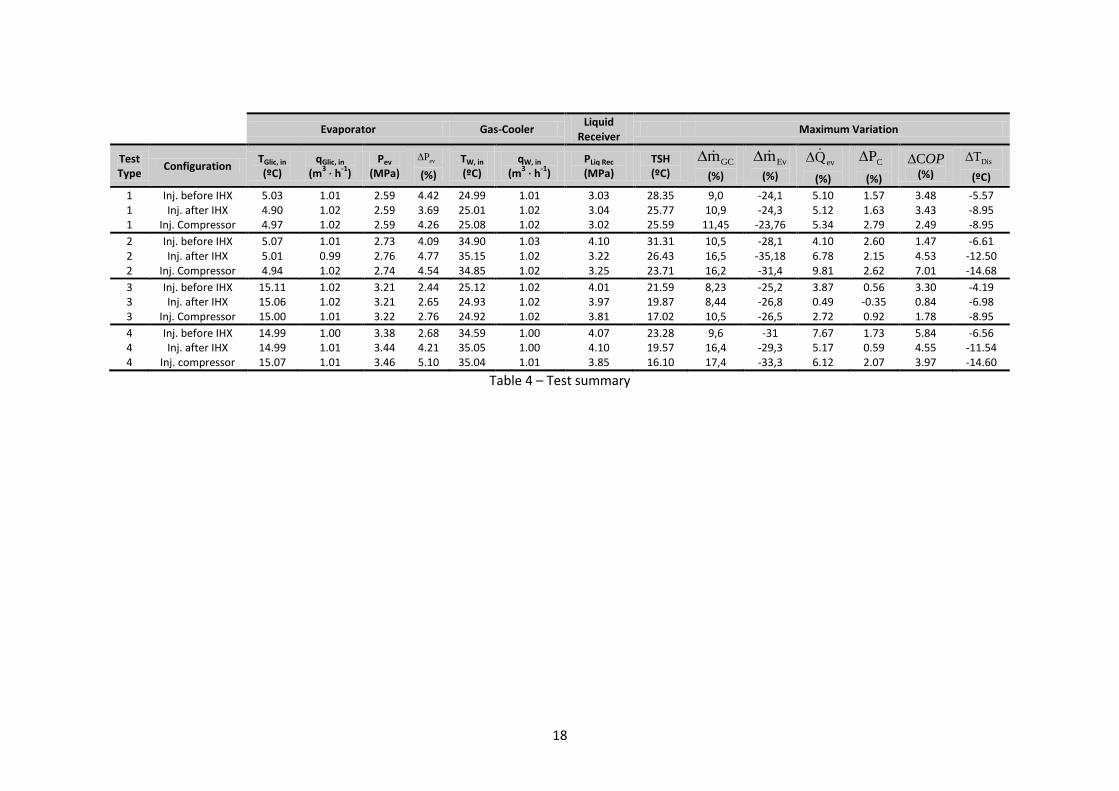
As presented in the summary of the tests in Table 4, it can be observed that the average increase in cooling capacity ( evQ ) is around 5% and the maximum measured increment is
9.81%, achieved for the operating conditions Tw, in= 35ºC, TGlic, in= 5ºC and injecting the vapour in the suction chamber (with an uncertainty ranging from 1.05% to 1.56%). Furthermore, from the analysis of Table 4, it can be observed that the improve of the cooling capacity is more important as higher Tw, in and lower TGlic, in are.
4.2.2. Compressor power consumption With the modification evaluated in this work, the power consumed by the compressor is affected in two opposite ways, as expressed by Equation (6). On one hand, the refrigerant mass flow rate displaced ( GCm ) increases, as already explained in section 4.1.3., but on the
other, the specific compression work ( SW ) is reduced due to the decrease in the suction
temperature.
C
sGC
C
Suc sDis,GCC
Wm
hhmP
(6)
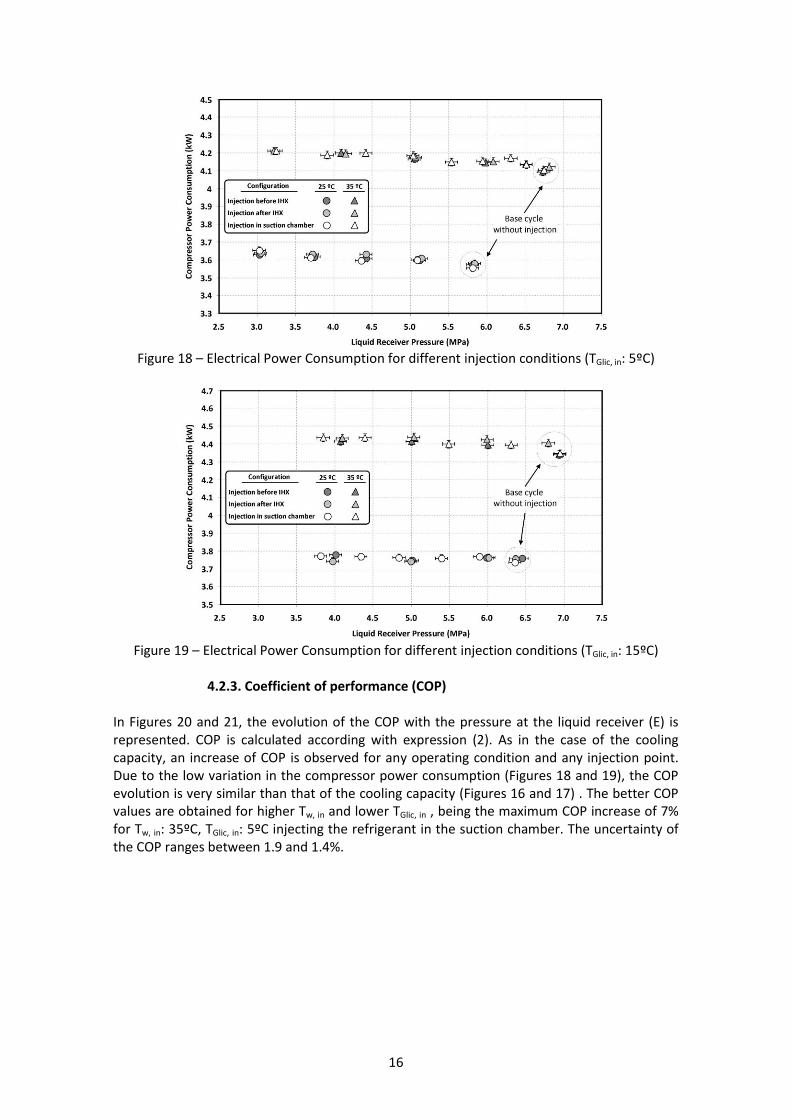
Thus, both effects counteract themselves resulting in no appreciable changes in the electrical power consumed by the compressor, as can be observed in the experimental measurements of Figures 18 and 19. The maximum variation in Pc is 2.79%, achieved for the operating conditions: Tw, in= 25ºC, TGlic, in= 5ºC and injecting the vapour in the suction chamber. The average variation is around 1.5% with an uncertainty of ± 0.5 % of the reading value.
16
Figure 18 – Electrical Power Consumption for different injection conditions (TGlic, in: 5ºC)
Figure 19 – Electrical Power Consumption for different injection conditions (TGlic, in: 15ºC)
4.2.3. Coefficient of performance (COP)
In Figures 20 and 21, the evolution of the COP with the pressure at the liquid receiver (E) is represented. COP is calculated according with expression (2). As in the case of the cooling capacity, an increase of COP is observed for any operating condition and any injection point. Due to the low variation in the compressor power consumption (Figures 18 and 19), the COP evolution is very similar than that of the cooling capacity (Figures 16 and 17) . The better COP values are obtained for higher Tw, in and lower TGlic, in , being the maximum COP increase of 7% for Tw, in: 35ºC, TGlic, in: 5ºC injecting the refrigerant in the suction chamber. The uncertainty of the COP ranges between 1.9 and 1.4%.

17
Figure 20 – COP for different injection conditions (TGlic, in: 5ºC)
Figure 21 – COP for different injection conditions (TGlic, in: 15ºC)
4.3. Summary
To summarize all the data collected during the test campaign, which has been analysed and presented in the figures, in Table 4 the maximum variations of each parameter for the different type of tests performed are presented. The maximum variation is calculated taking as reference value the operation of the cycle with the valve (D’) closed. The maximum variation, as mentioned before, corresponds to the minimum possible pressure of the liquid receiver (E), which is five bar upon the evaporating pressure.
18
Evaporator
Gas-Cooler Liquid
Receiver Maximum Variation
Test Type
Configuration TGlic, in
(ºC) qGlic, in
(m3 · h
-1)
Pev (MPa)
evP
(%)
TW, in
(ºC) qW, in
(m3 · h
-1)
PLiq Rec (MPa)
TSH (ºC)
GCm
(%) Evm
(%) evQ
(%)
CP
(%)
OPC
(%) DisT
(ºC)
1 Inj. before IHX 5.03 1.01 2.59 4.42 24.99 1.01 3.03 28.35 9,0 -24,1 5.10 1.57 3.48 -5.57 1 Inj. after IHX 4.90 1.02 2.59 3.69 25.01 1.02 3.04 25.77 10,9 -24,3 5.12 1.63 3.43 -8.95 1 Inj. Compressor 4.97 1.02 2.59 4.26 25.08 1.02 3.02 25.59 11,45 -23,76 5.34 2.79 2.49 -8.95
2 Inj. before IHX 5.07 1.01 2.73 4.09 34.90 1.03 4.10 31.31 10,5 -28,1 4.10 2.60 1.47 -6.61 2 Inj. after IHX 5.01 0.99 2.76 4.77 35.15 1.02 3.22 26.43 16,5 -35,18 6.78 2.15 4.53 -12.50 2 Inj. Compressor 4.94 1.02 2.74 4.54 34.85 1.02 3.25 23.71 16,2 -31,4 9.81 2.62 7.01 -14.68
3 Inj. before IHX 15.11 1.02 3.21 2.44 25.12 1.02 4.01 21.59 8,23 -25,2 3.87 0.56 3.30 -4.19 3 Inj. after IHX 15.06 1.02 3.21 2.65 24.93 1.02 3.97 19.87 8,44 -26,8 0.49 -0.35 0.84 -6.98 3 Inj. Compressor 15.00 1.01 3.22 2.76 24.92 1.02 3.81 17.02 10,5 -26,5 2.72 0.92 1.78 -8.95
4 Inj. before IHX 14.99 1.00 3.38 2.68 34.59 1.00 4.07 23.28 9,6 -31 7.67 1.73 5.84 -6.56 4 Inj. after IHX 14.99 1.01 3.44 4.21 35.05 1.00 4.10 19.57 16,4 -29,3 5.17 0.59 4.55 -11.54 4 Inj. compressor 15.07 1.01 3.46 5.10 35.04 1.01 3.85 16.10 17,4 -33,3 6.12 2.07 3.97 -14.60
Table 4 – Test summary

- 19 -
5. Conclusions Aiming to improve the energy performance of CO2 transcritical refrigeration facilities with a two stage expansion system, a new modification that could be easily implemented has been analyzed in this paper. The new configuration consists of extracting vapour from the liquid receiver, reducing thus its pressure and also the enthalpy of the saturated liquid. The extracted vapour is expanded and injected in suction line in order to reduce the total superheating degree and the discharge temperature of the compressor. Three variations of this configuration (differing in the location where the vapour is injected) have been experimentally studied and compared with the refrigeration facility operating without vapour extraction from the liquid receiver (base-cycle). The three variations of this new configuration, tested at the same operating conditions, generate an increase in the cooling capacity and in the COP (a maximum of 9.8% and 7%, respectively) and a reduction in the discharge temperature (a maximum of 14.7ºC). Accordingly, the new configuration causes a slight improvement in the energy performance of this kind of refrigeration facilities. Furthermore, it needs to be mentioned that no great differences have been found between the three possible positions to inject the expanded vapour refrigerant from the liquid receiver. What it should be remarked is that obtained improvements are better for higher Tw,in values, and since Tw,in is the hot sink temperature, it could be said that this configuration will provide bigger improvements in warm or hot countries. 6. Acknowledgments The authors are indebted to the Spanish Ministry of Education and Science (CTM2008-06468-C02-02/TECNO) and to the Spanish Ministry of the Environment and Rural and Marine Affairs (200800050084716) for the economic support given to the present work. 7. References [1] G. Lorentzen, Revival of carbon dioxide as a refrigerant, International Journal of
Refrigeration, 17 (1994) 292-301. [2] S.S. Pitla, E.A. Groll, S. Ramadhyani, New correlation to predict the heat transfer coefficient
during in-tube cooling of turbulent supercritical CO2, International Journal of Refrigeration, 25 (2002) 887-895.
[3] J. Sarkar, S. Bhattacharyya, M. Ramgopal, A transcritical CO2 heat pump for simultaneous water cooling and heating: Test results and model validation, International Journal of Energy Research, 33 (2009) 100-109.
[4] Fischer SK, Hughes PJ, Fairchild PD, Kusik CL, Diekmann JT, McMahon EM, H. H., Energy and Global Warming Impacts of CFC Alternative Technologies, Alternative Fluorocarbons Environmental Acceptability Study (AFEAS) & U. S. Department of Energy (DOE), (1991).
[5] D. Sánchez, E. Torrella, R. Cabello, R. Llopis, Influence of the superheat associated to a semihermetic compressor of a transcritical CO2 refrigeration plant, Applied Thermal Engineering, 30 (2010) 302-309.
[6] M. Li, Y. Ma, H. Guan, L. Li, Development and Experimental Study of CO2 Expander in CO2 Supercritical Refrigeration Cycles, International Journal of Green Energy, 1 (2004) 89-99.
[7] E. Torrella, D. Sánchez, R. Llopis, R. Cabello, Energetic evaluation of an internal heat exchanger in a CO2 transcritical refrigeration plant using experimental data, International Journal of Refrigeration, 34 (2011) 40-49.
- 20 -
[8] C. Aprea, A. Maiorino, An experimental evaluation of the transcritical CO2 refrigerator performances using an internal heat exchanger, International Journal of Refrigeration, 31 (2008) 1006-1011.
[9] F.Z. Zhang, P.X. Jiang, Y.S. Lin, Y.W. Zhang, Efficiencies of subcritical and transcritical CO2 inverse cycles with and without an internal heat exchanger, Applied Thermal Engineering, 31 (2011) 432-438.
[10] A. Cavallini, L. Cecchinato, M. Corradi, E. Fornasieri, C. Zilio, Two-stage transcritical carbon dioxide cycle optimisation: A theoretical and experimental analysis, International Journal of Refrigeration, 28 (2005) 1274-1283.
[11] R. Cabello, D. Sánchez, R. Llopis, E. Torrella, Experimental evaluation of the energy efficiency of a CO2 refrigerating plant working in transcritical conditions, Applied Thermal Engineering, 28 (2008) 1596-1604.
[12] R. Cabello, R. Llopis, D. Sánchez, E. Torrella, REFLAB: An interactive tool for supporting practical learning in the educational field of refrigeration, International Journal of Engineering Education, 27 (2011) 909-918.
[13] E.W. Lemmon, M.L. Huber, M.O. McLinden, REFPROP, NIST Standard Reference Database 23, v.8. National Institute of Standards, Gaithersburg, MD, U.S.A., (2007).
[14] ASHRAE, ASHRAE Handbook-Fundamentals. Atlanta: American Society of Heating, Refrigerating and Air-Conditioning Engineers, Inc., (2005).
[15] J. Sarkar, S. Bhattacharyya, M.R. Gopal, Optimization of a transcritical CO2 heat pump cycle for simultaneous cooling and heating applications, International Journal of Refrigeration, 27 (2004) 830-838.
[16] S.M. Liao, T.S. Zhao, A. Jakobsen, A correlation of optimal heat rejection pressures in transcritical carbon dioxide cycles, Applied Thermal Engineering, 20 (2000) 831-841.
[17] F. Kauf, Determination of the optimum high pressure for transcritical CO2-refrigeration cycles, International Journal of Thermal Sciences, 38 (1999) 325-330.