Embed Size (px)
Citation preview

7/28/2019 Experimental and Analytical Study of Vane Pump Inefficiencies
http://slidepdf.com/reader/full/experimental-and-analytical-study-of-vane-pump-inefficiencies 1/44
University of Tennessee, Knoxville
Trace: Tennessee Research and CreativeExchange
University of Tennessee Honors esis Projects University of Tennessee Honors Program
5-1995
Experimental and Analytical Study of Vane PumpIneciencies
Brian Edward TuckerUniversity of Tennessee - Knoxville
Follow this and additional works at: hp://trace.tennessee.edu/utk_chanhonoproj
is is brought to you for free and open access by the University of Tennessee Honors Program at Trace: Tennessee Research and Creative Exchange. It
has been accepted for inclusion in University of Tennessee Honors esis Projects by an authorized administrator of Trace: Tennessee Research and
Creative Exchange. For more information, please contact [email protected].
Recommended CitationTucker, Brian Edward, "Experimental and Analytical Study of Vane Pump Ineciencies" (1995). University of Tennessee Honors esis
Projects.
hp://trace.tennessee.edu/utk_chanhonoproj/141

7/28/2019 Experimental and Analytical Study of Vane Pump Inefficiencies
http://slidepdf.com/reader/full/experimental-and-analytical-study-of-vane-pump-inefficiencies 2/44
Experimental and Analytical Study of
Vane Pump Inefficiencies
Senior Honors P n ~ j e c t
Brian E. Tucker 2117 Andy Holt Avenue 707
Knoxville, TN 37916
Submitted in prutial fulfIllment of the degree of
Bachelors of Science in Mechanical Engineering
under the University of Tennessee
Honors Program
May 8,1995
Faculty Mentor: Dr. Frank H. Speckhart, P.E.
7/28/2019 Experimental and Analytical Study of Vane Pump Inefficiencies
http://slidepdf.com/reader/full/experimental-and-analytical-study-of-vane-pump-inefficiencies 3/44
Experimental and Analytical Study of
Vane Pump Inefficiencies
Senior Honors Prqject
Brian E. Tucker
2117 Andy Holt Avenue 707
Knoxville, TN 37916
Submitted in partial fulfillment of the degree of
Bachelors of Science in Mechanical Engineering .
under the University of Tennessee
Honors Program
May 8,1995
Faculty Mentor: Dr. Frank H. Speckhart, P.E.

7/28/2019 Experimental and Analytical Study of Vane Pump Inefficiencies
http://slidepdf.com/reader/full/experimental-and-analytical-study-of-vane-pump-inefficiencies 4/44
Experimental and Analytical Study of
Vane Pump Inefficiencies
Senior Honors Prqject
Brian E. Tucker 2117 Andy Holt Avenue 707
Knoxville, TN 37916
Submitted in partial fulfillment of the degree of
Bachelors of Science in Mechanical Engineering .
under the University of Tennessee
Honors Program
May 8, 1995
Faculty Mentor: Dr. Frank H. Speckhart, P.E.

7/28/2019 Experimental and Analytical Study of Vane Pump Inefficiencies
http://slidepdf.com/reader/full/experimental-and-analytical-study-of-vane-pump-inefficiencies 5/44
2117 Andy Holt Avenue 707
Knoxville, TN 37916
May 8,1995
Dr. Frank: H. Speckhart
Department of Mechanical and Aerospace Engineeling
414 Dougherty Hall
Knoxville, TN 37996-2210
Dr. Speckhart:
Enclosed is the final draft of my senior honors project entitled "Experimental and
Analytical Study of Vane Pump Inefficiencies." Thank you for your input and I hope
that final fonn of this study meets to your approval. I am also forwarding a copy of
this report to the University Honors office in Melrose Hall.
Thank: you once again for your guidance and support during this project. I hope I may
be of assistance in the future in further cooperative endeavors during my graduate study
at the University ofTennessee.
Sincerely,
Brian E. Tucker
i
7/28/2019 Experimental and Analytical Study of Vane Pump Inefficiencies
http://slidepdf.com/reader/full/experimental-and-analytical-study-of-vane-pump-inefficiencies 6/44
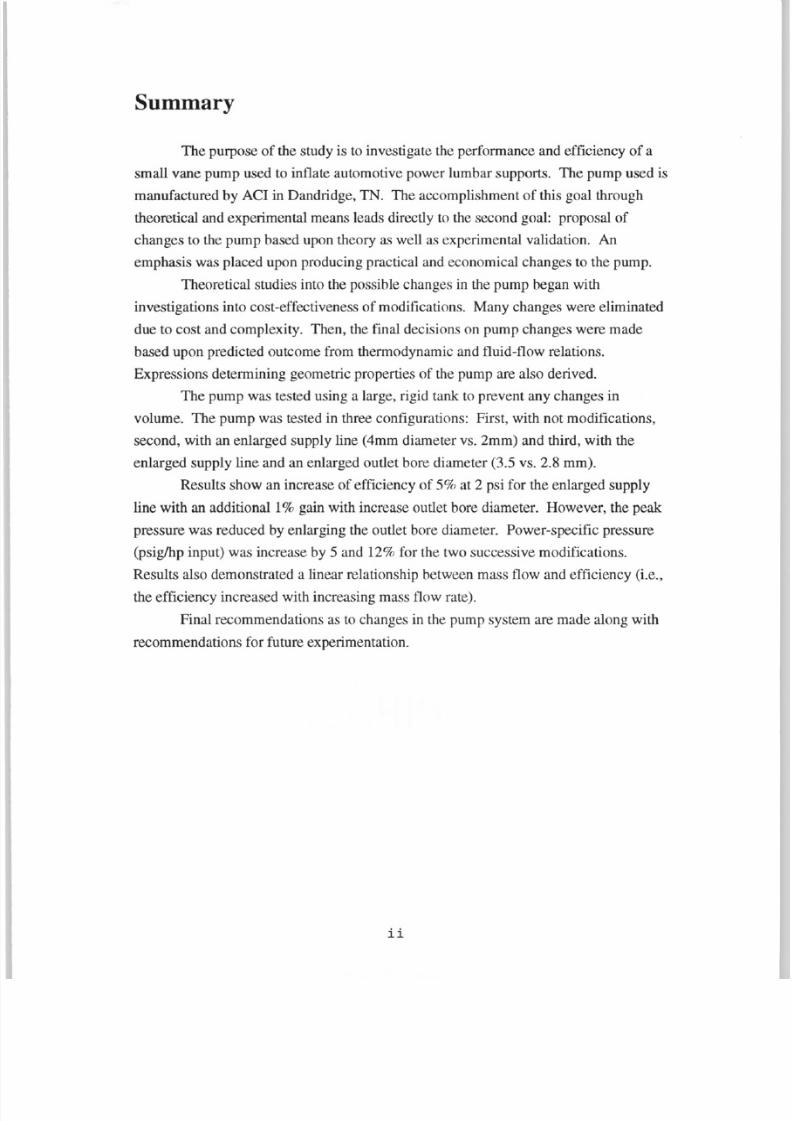
Summary
The purpose of the study is to investigate the performance and efficiency of a
small vane pump used to inflate automotive power lumbar supports. The pump used is
manufactured by ACI in Dandridge, TN. The accomplishment of this goal through
theoretical and experimental means leads directly to the second goal: proposal of
changes to the pump based upon theory as well as experimental validation. An
emphasis was placed upon producing practical and economical changes to the pump.
Theoretical studies into the possible changes in the pump began with
investigations into cost-effectiveness of modifications. Many changes were eliminated
due to cost and complexity. Then, the final decisions on pump changes were made
based upon predicted outcome from thermodynamic and fluid-flow relations.
Expressions determining geometric properties of the pump are also derived.The pump was tested using a large, rigid tank to prevent any changes in
volume. The pump was tested in three configurations: First, with not modifications,
second, with an enlarged supply line (4mm diameter vs. 2mm) and third, with the
enlarged supply line and an enlarged outlet bore diameter (3.5 vs. 2.8 mm).
Results show an increase of efficiency of 5% at 2 psi for the enlarged supply
line with an additional! % gain with increase outlet bore diameter. However, the peak
pressure was reduced by enlarging the outlet bore diameter. Power-specific pressure
(psig/hp input) was increase by 5 and 12% for the two successive modifications.
Results also demonstrated a linear relationship between mass flow and efficiency (i.e.,
the efficiency increased with increasing mass flow rate).
Final recommendations as to changes in the pump system are made along with
recommendations for future experimentation.
i i
7/28/2019 Experimental and Analytical Study of Vane Pump Inefficiencies
http://slidepdf.com/reader/full/experimental-and-analytical-study-of-vane-pump-inefficiencies 7/44
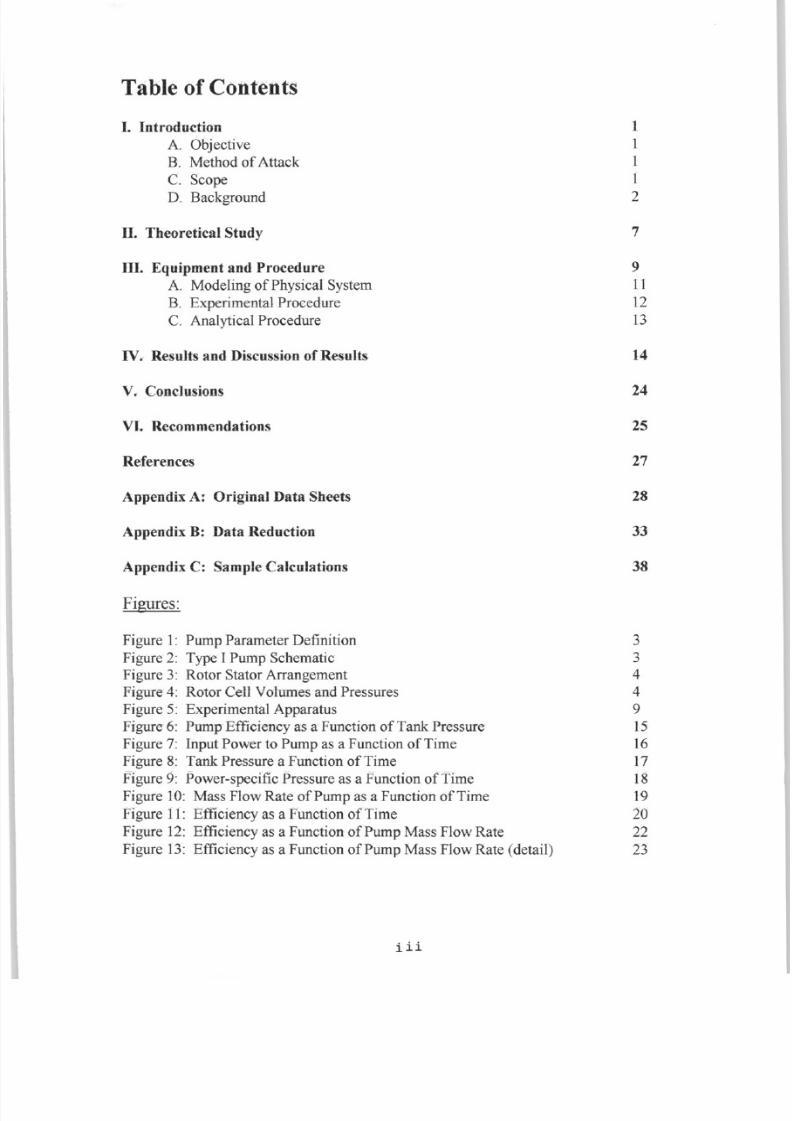
Table of Contents
I. Introduction 1A. Objective 1B. Method ofAttack 1C. Scope 1D. Background 2
II. Theoretical Study 7
m. Equipment and Procedure 9
A. Modeling of Physical System 11
B. Experimental Procedure 12
C. Analytical Procedure 13
IV. Results and Diseussion of Results 14
v. Conclusions 24
VI. Recommendations 25
References 27
Appendix A: Original Data Sheets 28
Appendix B: Data Reduction 33
Appendix C: Sample Calculations 38
Figures:
Figure 1: Pump Parameter Definition 3
Figure 2: Type I Pump Schematic 3
Figure 3: Rotor Stator Arrangement 4
Figure 4: Rotor Cell Volumes and Pressures 4
Figure 5: Experimental Apparatus 9
Figure 6: Pump Efficiency as a Function of Tank Pressure 15
Figure 7: Input Power to Pump as a Function of Time 16
Figure 8: Tank Pressure a Function ofTime 17
Figure 9: Power-specific Pressure as a Function orTime 18
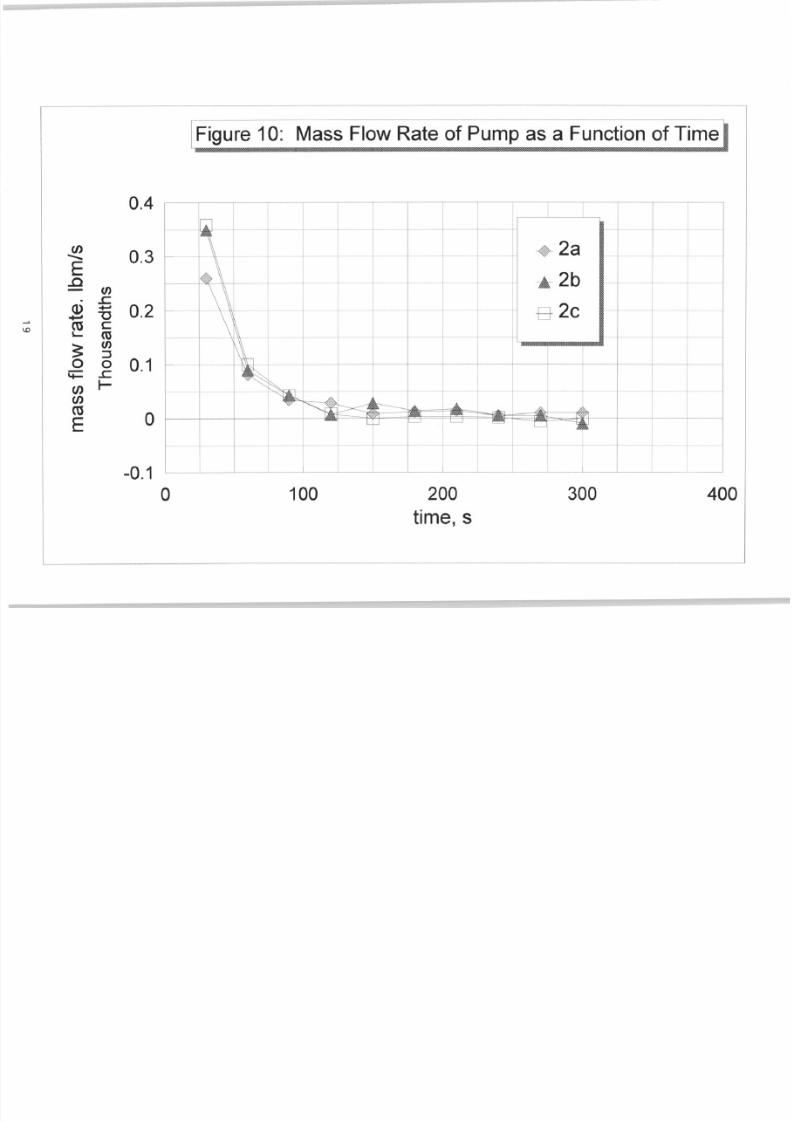
Figure 10: Mass Flow Rate ofPump as a Function ofTime 19
Figure 11: Efficiency as a Function ofTime 20
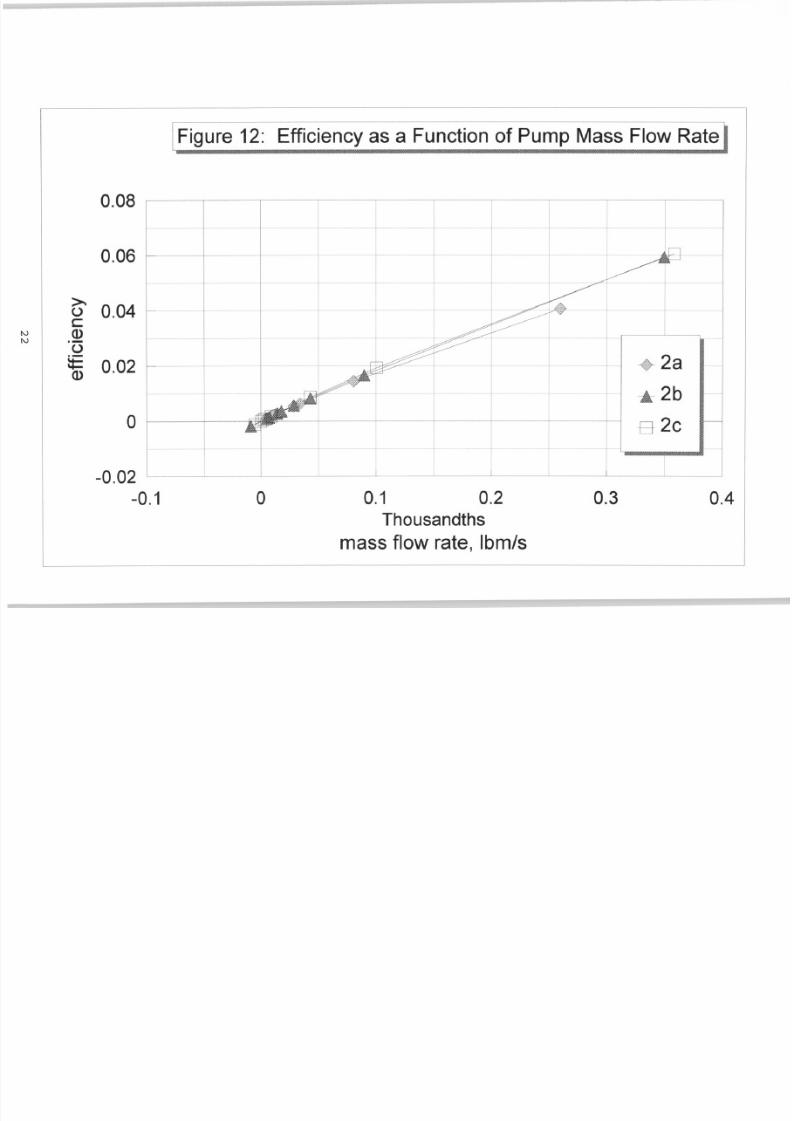
Figure 12: Efficiency as a Function ofPump Mass Flow Rate 22
Figure 13: Efficiency as a Function ofPump Mass Flow Rate (detail) 23
i i i
7/28/2019 Experimental and Analytical Study of Vane Pump Inefficiencies
http://slidepdf.com/reader/full/experimental-and-analytical-study-of-vane-pump-inefficiencies 8/44
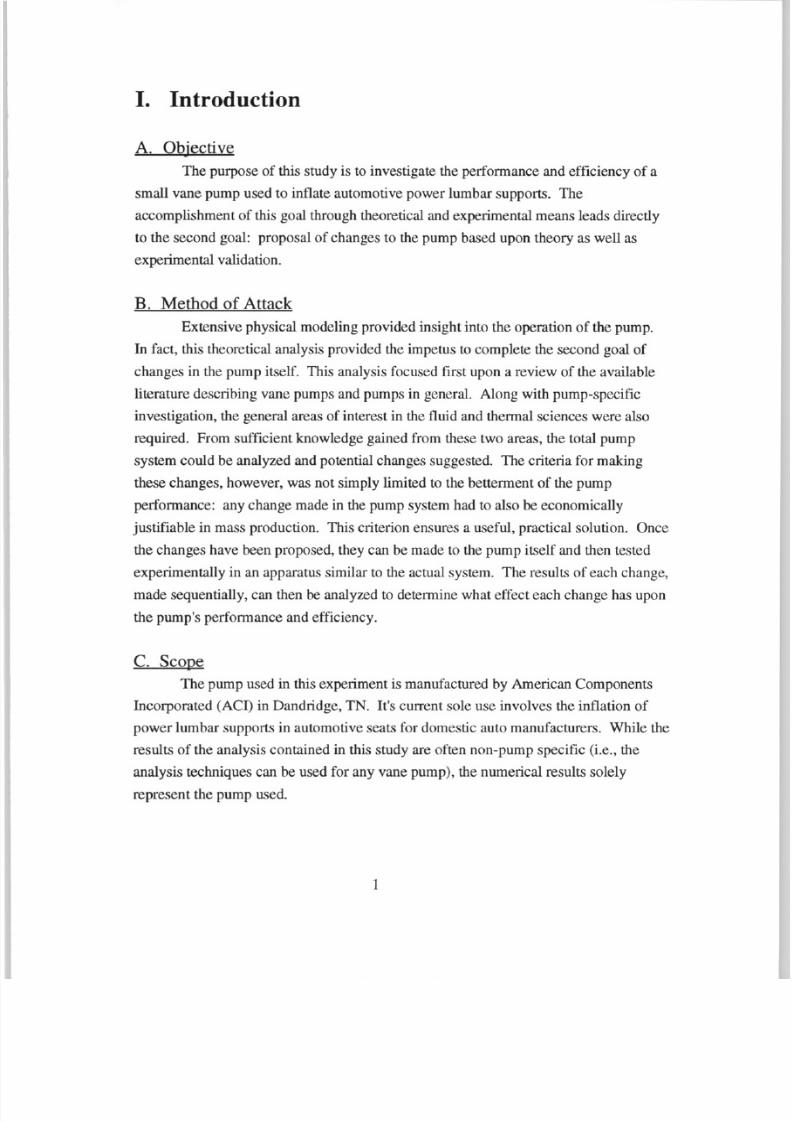
I. Introduction
A. Objective
The purpose of this study is to investigate the performance and efficiency of a
small vane pump used to inflate automotive power lumbar supports. The
accomplishment of this goal through theoretical and experimental means leads directly
to the second goal: proposal of changes to the pump based upon theory as well as
experimental validation.
B. Method of Attack
Extensive physical modeling provided insight into the operation of the pump.
In fact, this theoretical analysis provided the impetus to complete the second goal of
changes in the pump itself. This analysis focused first upon a reviewof
the availableliterature describing vane pumps and pumps in general. Along with pump-specific
investigation, the general areas of interest in the fluid and thermal sciences were also
required. From sufficient knowledge gained from these two areas, the total pump
system could be analyzed and potential changes suggested. The criteria for making
these changes, however, was not simply limited to the betterment of the pump
performance: any change made in the pump system had to also be economically
justifiable in mass production. This criterion ensures a useful, practical solution. Once
the changes have been proposed, they can be made to the pump itself and then tested
experimentally in an apparatus similar to the actual system. The results of each change,
made sequentially, can then be analyzed to detelmine what effect each change has upon
the pump's performance and efficiency.
C. Scope
The pump used in this experiment is manufactured by American Components
Incorporated (ACI) in Dandridge, TN. It's current sole use involves the inflation of
power lumbar supports in automotive seats for domestic auto manufacturers. While the
resultsof
the analysis contained in this study are often non-pump specific (i.e., theanalysis techniques can be used for any vane pump), the numerical results solely
represent the pump used.
1

7/28/2019 Experimental and Analytical Study of Vane Pump Inefficiencies
http://slidepdf.com/reader/full/experimental-and-analytical-study-of-vane-pump-inefficiencies 9/44
D. Background
i. Pumps (general)
Pumps are defined as devices designed to move or change the pressure of a
fluid. These devices can be classified into two categories: rotodynamic (dynamic) and
positive displacement (White 633). Rotodynamic pumps rely upon turbomachinery to
increase the velocity of the impinging fluid and thus increase the pressure. When a
rotodynamic pump is turned off, the pressure on both sides of the pump will equalize.
Examples include centrifugal compressors and axial fans. Positive displacement
pumps, on the other hand, rely upon the compression of the fluid by means of
constriction of physical boundaries. This constriction decreases the volume which the
fluid occupies and thus increases the pressure. A piston-cylinder device is a typical
example of a positive displacement pump. It is this later category which contains the
specific typeof
pump in question: the sliding-vane, or simply vane, pump.
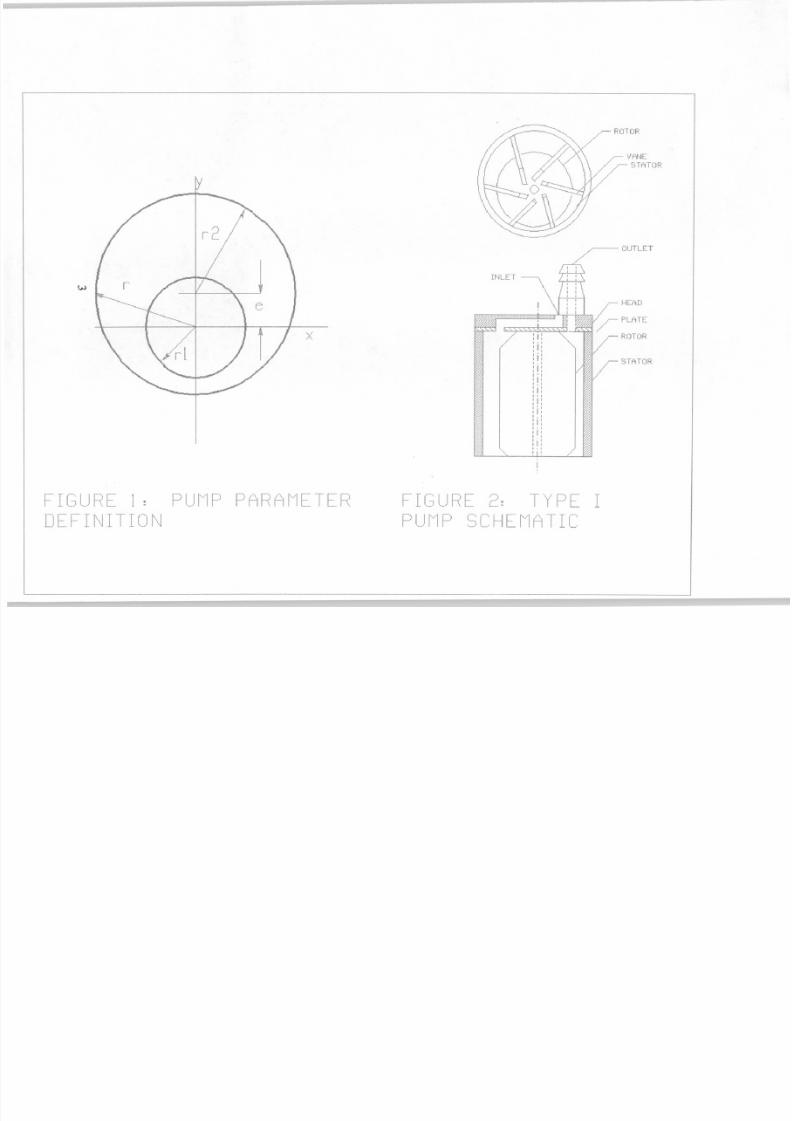
ii. Vane pump
At the heart of the vane pump lies a rotor of radius r l in which the vanes slide,
as shown in Figure 1. The vanes impinge upon a stator of inner radius r2. The centers
of the stator and rotor are offset by an eccentricity, defined as e. Figure 2 shows, in
schematic, the pump used in this experiment. Here, the vanes, stator, and rotor are
clearly labeled. Figures 3 and 4 (from Rudge 160,162) provide greater insight into the
pumps induction and exhaust processes. Figure 3 shows a typical commercial vane
pump in top view with stator, or side, inlet and outlet ports (it should be noted here that
the pump used in this experiment, though similar in concept, uses top-mounted inlet
and outlet ports). Figure 4 demonstrates the shrinking-volume concept of the positive
displacement vane pump: the cell volume enclosed by vanes on either side and between
the stator and rotor decreases as shown by the polar diagram of rotor cell volume from
the intake to outlet port.
iii. Pump system
The vane pumps in this experiment are used in power lumbar supports inautomotive applications. The pump is attached via a line to a bladder inside the seat. In
general, these bladders are located in the lower-back area of the car seat. Because the
vanes in these small pumps are held against the stator wall by centrifugal force when
the pump is operating, a valve in the system is nec essary to keep the flow from flowing
back through the pump when i t is not spinning.
2
7/28/2019 Experimental and Analytical Study of Vane Pump Inefficiencies
http://slidepdf.com/reader/full/experimental-and-analytical-study-of-vane-pump-inefficiencies 10/44
"// / ~ : = - - ~ - / / \ _". /.r- ROT OJ;'
1\ ':>. , / / ./ /,i ,/
r\0 ---;///'-'''.)'\/ .-I /' /'\. 'r" I / "',/ -< \\ /r- VANE
I ' 1\ « 7 ' ')1;':\// ~ STATOR
/." 1//1
/,/
\__ u \ / -- - " ~ - - - " " " " , , \ / ...
\r-----.,. (.1 - ---\..... /
\, \ \ -.--:::J/, VI ---;-6 /\ \ \ ,,/) ' \ l /1,.''1' - ' ' - . . . / ~ / ~ / " /
,- '.. / , / " / /' ,, / l" " - . ! ' - - - ~ - i ' ,/ ...
........ ---=:::::::::::-- J.-'/ - - - / ~ ~ / "/,.-r- OUTLET
r'-'/1-'':1\
{t·ILET --\ ~\ ~
\ I 1 I \.
\
\\
///
".
: I<: i'i
I:
.
i:i:,
I I::.i:,
,/
-Ir-' Ili)E "). T\/ F'EIC;IJF:E 1: PUr"'1F) F'AI=<A,'/IETER F L- I_ J ~ . , n I
DEFlr\jITIO[\j F'Urv '1F) ~ = ; [ H E , ' / l f ~ T I [
J : I
ROTOR

7/28/2019 Experimental and Analytical Study of Vane Pump Inefficiencies
http://slidepdf.com/reader/full/experimental-and-analytical-study-of-vane-pump-inefficiencies 11/44
160 D. G. SMITH AND P. J. RUDGE
____
__-- ...
position
SIGlin,
...-Oil injection
arc-.".
Rotor
St ator
Vane
F i gur e 3 : Rotor-etator arrangement
Roto, clil p,usutCIIflt ,d to I I I I I lan,11 of erll~
? .Figu re 4: Polar diagram of nltor volume. and . Impllfled polar diagram
of rotor cen pre. .ur..
4

7/28/2019 Experimental and Analytical Study of Vane Pump Inefficiencies
http://slidepdf.com/reader/full/experimental-and-analytical-study-of-vane-pump-inefficiencies 12/44
The pump used in this study consists of plastic rotor and vanes with a steel
stator and top plate (see Figure 2). The thin, steel stator casing is surrounded by a
plastic shelL The vanes are rectangular in shape and thus easy to manufacture. The
steel casing and plate are required to reduce friction on the upper and lower contact
surfaces with the rotor. The rotor is chamfered on the top and bottom and slotted to
allow the vanes to slide easily.
LV. Other considerations
As previously mentioned, fluid-flow and thermodynamic considerations are
also important to consider in the analysis of the pump. On key area in which many
losses in the pump system occur is the piping from the pump itself to the delivery area.
The Darcy-Weisbach equation (White 336) shows that for a pipe of length Land
diameterd
h = f Ly2 (1)f d2g
where hf is the friction head, f is the Darcy Friction Factor (which is a function of
Reynold's number and the pipe roughness), Y is the velocity of the fluid, and g is the
acceleration of gravity. From this relation, it can be ascertained that the losses due to
friction are inversely proportional to the diameter of the pipe. Also not so obvious is
the fact that the diameter plays a weaker role through the friction factor's dependenceupon Reynold's number and thus diameter. Therefore, increasing the outlet pipelline
diameter should decrease the friction losses in the pump system. This is especially
important when we consider the small size of the original line.
Other losses may occur in the outlet stages of the pump itself. Any sudden
changes in diameter in a line through which a fluid is flowing will constitute a further
loss characterized by the equation
y2h =-""K (2)
m 2g £..J
where the factor K has modeled empirically according the ratio of diameters by
(3)

7/28/2019 Experimental and Analytical Study of Vane Pump Inefficiencies
http://slidepdf.com/reader/full/experimental-and-analytical-study-of-vane-pump-inefficiencies 13/44
where d is the smaller diameter and D is the larger in the constriction (White 338).
What this implies is that in the outlet, a diameter change does occur and by reducing
this ratio of dID through the increase of d, another source of loss should be minimized.
v. Analysis
To analyze the efficiency of the pump itself requires knowledge of the amount
of work the pump exerts upon the gas being compressed. Work required to change
from a volume V 1 to V 2 can be expressed as
fV2
W= pdV (4)VI
where p is the pressure (Moran 33). I t is the pressure, which in itself is dependentupon volume, which defines the results of this integral. Using the ideal gas model, two
extreme cases can be used and compared for analysis purposes. I f all the heat
generated by the work done to compress the gas is dissipated and the gas stays at a
constant temperature (the isothermal case), then the product of pressure and volume
stays constant by the ideal gas law. Evaluating the integral in (4) produces
(5)W= p V l n ( ~ : J The other extreme, in which none of the heat escapes (adiabatic case), the product of
pressure and volume raised to ratio k of its specific heats is constant which leads to the
following equation for the work (Moran 103)
(6)
It can be shown by the ideal gas law that for the case under consideration in this
experiment (V=1.069 ft3, ~ p = 3 psi) that the maximum temperature changes are so
small (approximately 2.YF) for the adiabatic assumption that little difference would
then exist between using the isothermal and adiabatic assumptions. Therefore, for
simplicity, the isothermal case is used for the calculation of the work output of the
pump in the remainder of the study.
6
7/28/2019 Experimental and Analytical Study of Vane Pump Inefficiencies
http://slidepdf.com/reader/full/experimental-and-analytical-study-of-vane-pump-inefficiencies 14/44
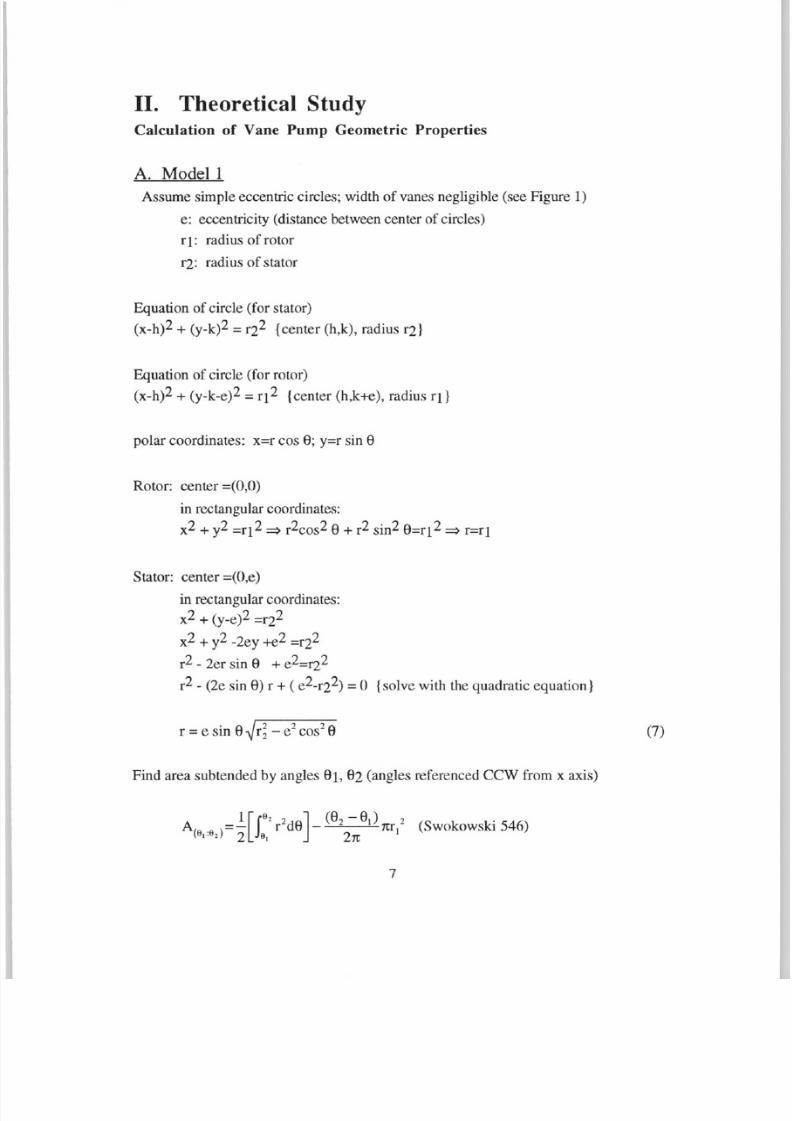
II. Theoretical StudyCalculation of Vane Pump Geometric Properties
A. Modell
Assume simple eccentric circles; width of vanes negligible (see Figure 1)
e: eccentricity (distance between center of circles)
f1: radius of rotor
f2: radius of stator
Equation of circle (for stator)
(x-h)2 + (y-k)2 = f22 {center (h,k), radius f2}
Equation of circle (for rotor) (x-h)2 + (y-k-e)2 = q 2 {center (h,k+e), radius f1}
polar coordinates: x=r cos 8; y=r sin 8
Rotor: center =(0,0)
in rectangular coordinates:
x2 + y2 =f12 ~ r2cos2 8 + r2 sin2 8=q2 r=q
Stator: center =(O,e)
in rectangular coordinates:
x2 + (y-e)2 =f22
x2 + y2 -2ey +e2 =f22
r2 - 2er sin 8 + e2=f22
r2 - (2e sin 8) r + ( e2-f22) =°{solve with the quadratic equation}
r = e sin 8 - e2 cos2 8 (7)
Find area subtended by angles 81, 82 (angles referenced CCW from x axis)
7
7/28/2019 Experimental and Analytical Study of Vane Pump Inefficiencies
http://slidepdf.com/reader/full/experimental-and-analytical-study-of-vane-pump-inefficiencies 15/44
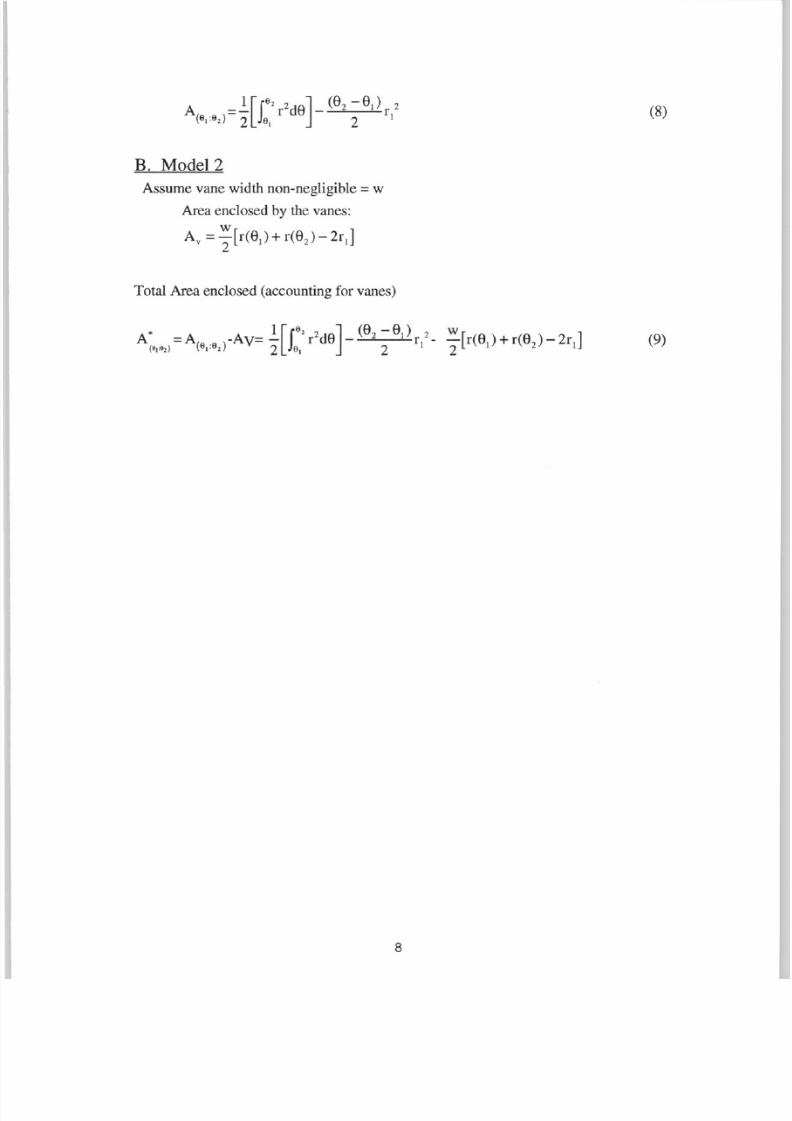
(8)
B. Model 2
Assume vane width non-negligible =w
Area enclosed by the vanes:
Av = w[r(8J +r(8 2 ) -2 r1J 2
Total Area enclosed (accounting for vanes)
(9)
8

7/28/2019 Experimental and Analytical Study of Vane Pump Inefficiencies
http://slidepdf.com/reader/full/experimental-and-analytical-study-of-vane-pump-inefficiencies 16/44
III. Equipment
A. Apparatus: (Figure 5)
pressure gage
TANK
multimeter
battery PUMP
' - ------r---1 I I I I I---T----'wall outlet115VAC
B. Equipment Description and Use
Tame steel construction, 8 gallon US (1.069 ft3) capacity
Pressure gage: measure the pressure of the air inside the tank
Multimeter: determine the current flowing into the pump
Battery: provide 12V power supply required to run the electric motor
Battery charger: equalize the voltage of the battery during pump operation by
continuously supplying enough current to maintain battery voltage
Air line: supplies air from pump to tank (two different sizes used during testing)
OEM line: 2mm diameter, ABS plastic (2 90 degree bends)
enlarged diameter line: 4mm diameter, rubber
length (both): 52cm
9
7/28/2019 Experimental and Analytical Study of Vane Pump Inefficiencies
http://slidepdf.com/reader/full/experimental-and-analytical-study-of-vane-pump-inefficiencies 17/44
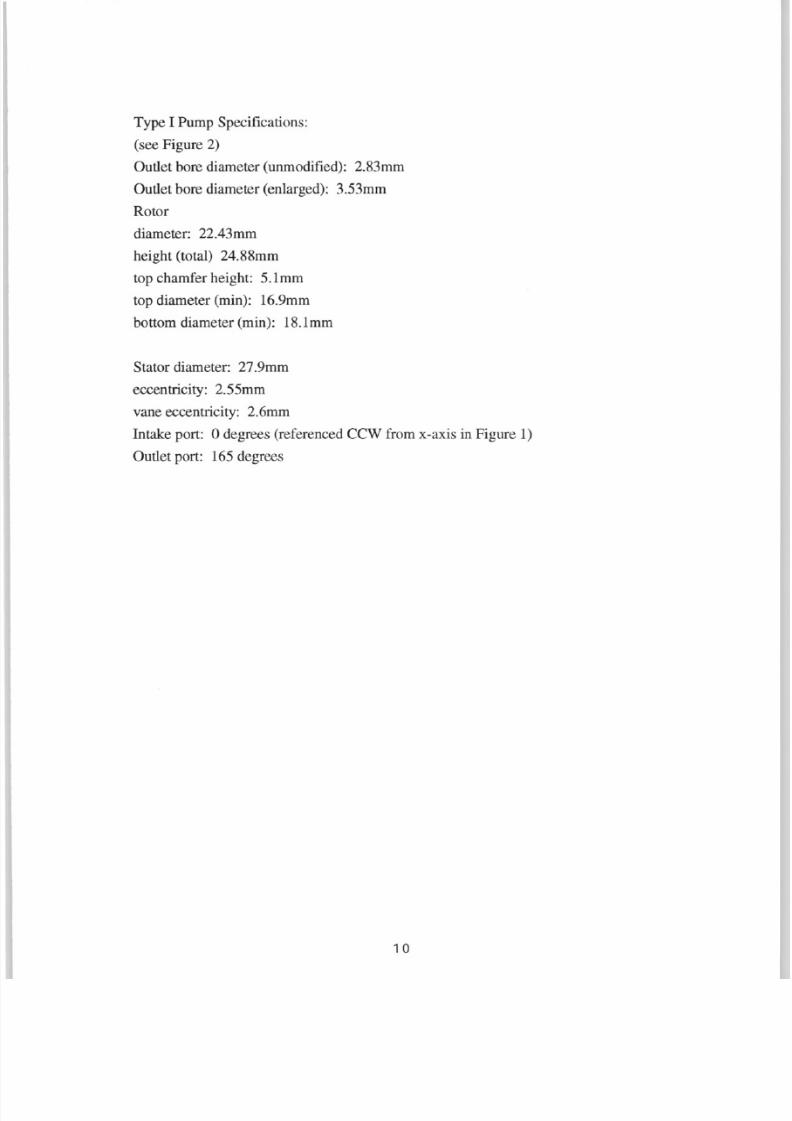
Type I Pump Specifications:
(see Figure 2)
Outlet bore diameter (unmodified): 2.83mm
Outlet bore diameter (enlarged): 3.53mm
Rotor
diameter: 22.43mm
height (total) 24.88mm
top chamfer height: 5.1mm
top diameter (min): 16.9mm
bottom diameter (min): 18 .1mm
Stator diameter: 27.9mm
eccentricity: 2.55mm
vane eccentricity: 2.6mm
Intake port: 0 degrees (referenced CCW from x-axis in Figure 1)
Outlet port: 165 degrees
10

7/28/2019 Experimental and Analytical Study of Vane Pump Inefficiencies
http://slidepdf.com/reader/full/experimental-and-analytical-study-of-vane-pump-inefficiencies 18/44
III. Procedure
A. Modeling of Physical System
To model the physical system involved detelTIlination from theory which
changes in the pump would produce positive and significant changes in pump
perfolTIlance. Of highest importance was the financial impact of these changes. The
current pump design as shown in Figure 2 is a very simple one. Any change which
would result in significantly increased manufacturing costs would diminish the pump's
competitive advantage from a financial standpoint and would thus meet with extreme
opposition. Keeping this in mind, the scope of possible changes was narrowed
considerably.
From a cost standpoint, several prospective changes could be eliminated. First,
lubrication in the system, which would reduce the friction and thus noise (a sourceof
inefficiency), looks attractive, but implementation of any supplied lubrication system
would be difficult at best. Using a simple liquid lubricant (WD-40) did reduce noise
and thus pump friction in testing of the Type I pump, but the lubricant quickly
evaporated. No simple, much less inexpensive, solution exists in the answering of the
lubrication question. Changing of the geometry of the rotor and vane also proved
impossible due to the lack of facilities in which to manufacture comparable parts.
However, changes in the induction and exhaust processes could easily be
implemented. All of the induction and exhaust routing was accomplished through the
head of the pump, which is an interchangeable item. Thus, changes could be made to
the head and different heads could be tested using the same pump and the results
compared.
Induction routing in the head involved long, narrow, and twisting
passageways. According to Dr. M. Parang, it is likely that these passageways are used
to stagnate the incoming flow in an attempt to produce laminar inlet flow. Realizing the
potentially halTIlful effects of producing turbulent flow in the pump inlet, the induction
routing was skipped as a candidate for pump changes.
Finally, changes in the exhaust process were considered. As previouslymentioned, changes in the outlet line and outlet bore would be beneficial to the
perfolTIlance of the pump. Also, these changes in the pump would not be expensive to
implement. Thus, both changes were approved for use in the experimental testing of
the pumps so that their usefulness might be ascertained.
11

7/28/2019 Experimental and Analytical Study of Vane Pump Inefficiencies
http://slidepdf.com/reader/full/experimental-and-analytical-study-of-vane-pump-inefficiencies 19/44
B. Experimental Procedure
i. Choice ofEquipment
To test the changes made to the pump, a large, rigid tank served the purpose of
modeling the actual physical system. The tank was chosen for several reasons. First,
the rigid walls ensured a constant volume during the testing. An actual bladder used in
the power lumbar system undergoes an inflation process in which the volume of the
bladder changes. Because of the difficulties associated with the measurement of this
changing volume, the rigid tank was chosen. The large size of the tank enabled
measurements to be taken by hand accurately over longer spans of time owing to the
fact that achieving operating pressures required longer amounts of time due to the large
volume of the tank relative to an actual bladder. A smaller tank would have reached
peaked pressure much more quickly requiring measurements to be taken at a much
higher rate (perhaps making it impossible to take readings by hand).
ii. Conducting the Experiment
To test the basic pump configuration and verify the experimental soundness of
the apparatus and the procedure, a Type III pump (not analyzed in this study) was
used. The test of this pump, labeled Test 1, involved the same basic steps which were
to be used in all pump tests. The pump was attached to the tank via a line and then
attached to the tank fitting with a section of rubber hose. All connections were tested to
ensure that no leaks had occurred by compressing the air in the tank and then blocking
off the line. I f the pressure in the tank as measured by the pressure gage did not
decrease, no leaks were present in the system. Next, the pump power supply was
hooked up allowing for the multimeter to be wired in series to measure current into the
motor. In all but test 1, a standard battery charger was also used to ensure that battery
voltage would not decrease as the pumps slowly drained the battery (in test 1, the
voltages were measured over time). Then, the power circuit with the battery was
completed and the stopwatch was started. Readings of pressure and current were taken
every thirty seconds until the allotted time period of five minutes (300 seconds) had
elapsed.Test 2 involved the testing of the Type I pump for analysis purposes. Three
separate tests were conducted. In Test 2a, a standard Type I pump with no
modifications and an original bladder supply line was tested and used as the controL
Test 2b involved only changing the supply line from the standard to larger size. Test 2c
then added to the enlarged supply line an enlarged outlet diameter. Each test was
carried out sequentially using the same pump (though with different pump heads; the
12

7/28/2019 Experimental and Analytical Study of Vane Pump Inefficiencies
http://slidepdf.com/reader/full/experimental-and-analytical-study-of-vane-pump-inefficiencies 20/44
Test 2c head came from a similar pump with the aforementioned outlet diameter
change). Between tests, the motor unit on the pump was allowed to cool down. Then,
the no-load current could be checked to ensure that each pump would start at the same
initial condition.
c. Analysis Procedure
The isothermal case assumptions were used in the analysis of the output power
of the pump. The power was calculated using the isothelmal work equation (5) and the
ideal gas model. Input power was calculated by simply taking the product of the pump
current and battery Voltage. The details of these calculations are outlined in the sample
calculations.
13
7/28/2019 Experimental and Analytical Study of Vane Pump Inefficiencies
http://slidepdf.com/reader/full/experimental-and-analytical-study-of-vane-pump-inefficiencies 21/44
IV. Results and Discussion of Results
The testing of the Type I pump produced several positive changes in the
perfonnance of the pump. Figure 6 shows the efficiency (isothennal) of each of the
pumps (2a, 2b, 2c) as a function of tank pressure. Pumps 2b and 2c each showed
increased efficiency (almost 5% for each at 2 psi) versus 2a while achieving higher
overall pressures. The largest change, as is evident from the figure, came from the use
of the larger outlet line. The difference between the outlet line and the outlet line with
the enlarged outlet bore amounts to about I % over most of the range. However, the
efficiency of 2c actually drops below 2b above 2.5 psig. While not predicted, this
decrease in efficiency comes from a decrease in the rate of change of pressure (see
Figure 8) which is the result of less restriction in the outlet. In other words, changes in
outlet diameter do increase the efficiency of the pump at lower pressures, butincreasing the outlet diameter means paying a price in telms of peak: pressure.
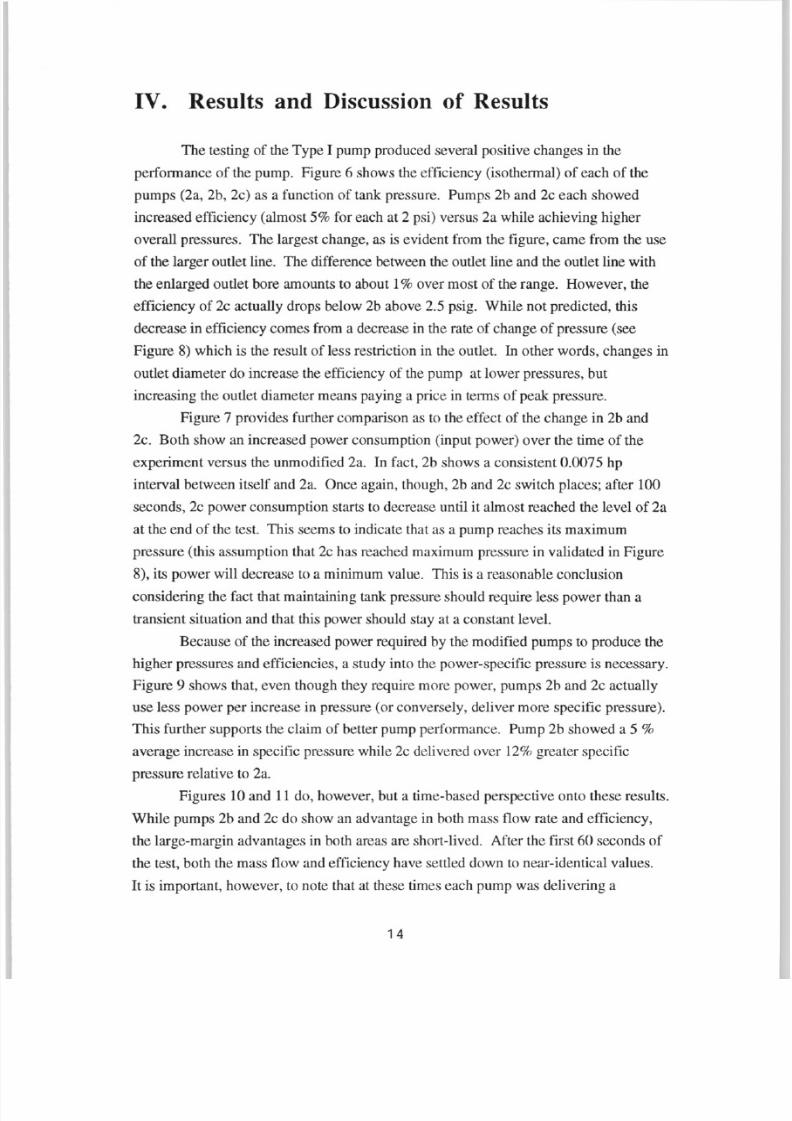
Figure 7 provides further comparison as to the effect of the change in 2b and
2c. Both show an increased power consumption (input power) over the time of the
experiment versus the unmodified 2a. In fact, 2b shows a consistent 0.0075 hp
interval between itself and 2a. Once again, though, 2b and 2c switch places; after 100
seconds, 2c power consumption starts to decrease until it almost reached the level of 2a
at the end of the test. This seems to indicate that as a pump reaches its maximum
pressure (this assumption that 2c has reached maximum pressure in validated in Figure
8), its power will decrease to a minimum value. This is a reasonable conclusion
considering the fact that maintaining tank: pressure should require less power than a
transient situation and that this power should stay at a constant level.
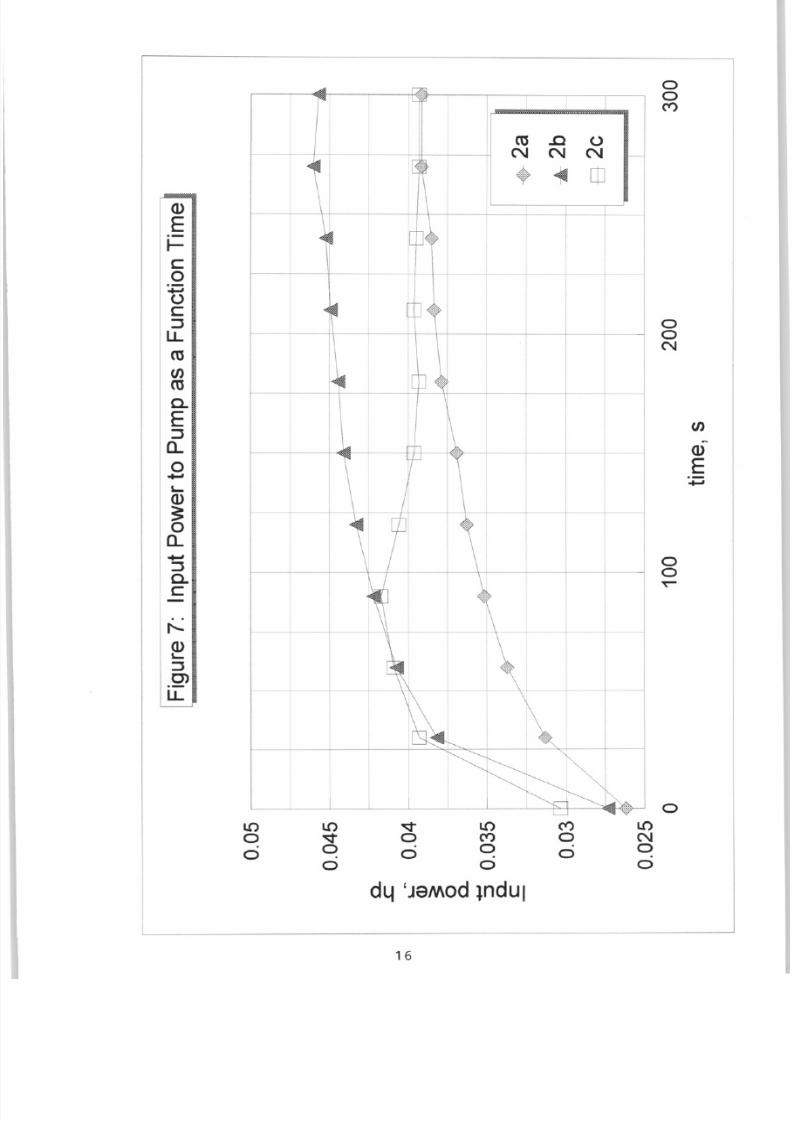
Because of the increased power required by the modified pumps to produce the
higher pressures and efficiencies, a study into the power-specific pressure is necessary.
Figure 9 shows that, even though they require more power, pumps 2b and 2c actually
use less power per increase in pressure (or conversely, deliver more specific pressure).
This further supports the claim of better pump pelformance. Pump 2b showed a 5 %
average increase in specific pressure while 2c delivered over 12% greater specificpressure relative to 2a.
Figures 10 and 11 do, however, but a time-based perspective onto these results.
While pumps 2b and 2c do show an advantage in both mass flow rate and efficiency,
the large-margin advantages in both areas are short-lived. Mter the first 60 seconds of
the test, both the mass flow and efficiency have settled down to near-identical values.
It is important, however, to note that at these times each pump was delivering a
14

7/28/2019 Experimental and Analytical Study of Vane Pump Inefficiencies
http://slidepdf.com/reader/full/experimental-and-analytical-study-of-vane-pump-inefficiencies 22/44
Figure 6: Pump Efficiency as a Function of Tank Pressure
0.08-r - - - - - - - - - - - l . ___ 1
,h . . 2a
0.06 ~ - f - - - - - - - - - - l - - I - - ~ ~ .It . 2b - -~ 0.04cQ)
u
.$;. ~~ - -+- - - -1 - - ""~ ~~ ' " " ~ ~ ~
- a 2c
-1-
~Q) 0.02
o
I------i---------L - ... , ~ ~ ~~ . ~ \ ~ ~ ~_--4 .
'--- -
LE"t". - f - - - ~ - - + - - - - - - ffA- - - 1 ~ --0 .02
1 1.5 2 2.5 3 3.5
Pressure, psig
7/28/2019 Experimental and Analytical Study of Vane Pump Inefficiencies
http://slidepdf.com/reader/full/experimental-and-analytical-study-of-vane-pump-inefficiencies 23/44
CO ..c 0N N N
•~ CO
00('t)
() )
El -e0
+oJ
0e::J 0
U. 0N
CJ)::J
a. ())
0 E+o J
+o J
::J 0c..e
~
I"-
())~::JC )
U.
0
co
CJ)co
c..E
~() )
~0
a.+oJ
0
L() L( ) v L() ( 't) L( )
0
0
v0
0
0
0
('t)
0
0
0
0
N0
0
dll 'J9MOd lndu I
16

7/28/2019 Experimental and Analytical Study of Vane Pump Inefficiencies
http://slidepdf.com/reader/full/experimental-and-analytical-study-of-vane-pump-inefficiencies 24/44
Q)
E ~\f-
aca~oc
::::sU.
rn
en
rn
~::::sen
en
Q)
a..'-
~ crn~. . ex:>
Q)'-::::s0). -u.
Alli l A
l LW'"I
I
< t l l ~ leo <
1D <0
rn ..a 0N N N
+ ~ OJ:=0 10
I
I
.. 10 ;41>
I II
I I ill I II
I ruI
I
! 1\~\
I
I I i1I~ 1
6"""-
~ 1
) \' ~ ~""'" ~
('I') N T"'"
61sd '8JnSS8Jd
17
i-
I
I
-
~ ~ l"! !§i
o
oo('I')
ooN
ooT"'"
en
-)
E
o
7/28/2019 Experimental and Analytical Study of Vane Pump Inefficiencies
http://slidepdf.com/reader/full/experimental-and-analytical-study-of-vane-pump-inefficiencies 25/44
o
('i)L ~ Io
I(]) ~ W ~ I ~ ~ 9 ~ 1 - - ~ ~ ~ ~ - - ~ ' -.-E
I
J-
en I N
coI
(]) [D ~ ~ *, I I
'+ oCo-+ J
oC
:JU.
co ..c 0N N N
+ ~ OJoo
L
:Jen
en(] ) inL L
a..
o~o(]) QJ
a.
I
I I en
1IIl"b>+-----------+-I_--+--_I--------------------l-_ I (] )i!f""""
E
Q)L
:J0>. -U.
o 0 0 0CO c.o ~ N
enI ~ ~ \ ~ ~ ~ ~ ~ - - ~ ~ i - - g
(])
3:o \ ~ i ~a..
. . ~ ~ \ , I0>
d 4 / 6 ~ s d '8JnSS8Jd ~ ~ J ~ ~ 8 d s J8MOd
18
7/28/2019 Experimental and Analytical Study of Vane Pump Inefficiencies
http://slidepdf.com/reader/full/experimental-and-analytical-study-of-vane-pump-inefficiencies 26/44
- -
IFigure 10: Mass Flow Rate of Pump as a Function of Time J
0.4.,w I I
1 " - - + - - ~ - - .,.--+ _.- !-
en f- __ II - I.........
- f- 0.3 - - - ' - = 2aE - .0
. .£\: 2b
(/ ). .r:::.\ --f--- --) ~~ "U 0.2 B 2c e--+-
co C~ en ~ - rL (/) ~ ::J
0 0'+= .r:::.
0.1 ~ ~ -----r-t--+---t----L J
r-~ A --4 -
enen ~ ~ - - - - - - - . . A . ACO ~ A
-r-
E ,.LP L-J = " I A._ ~ ~ [",Wi0 C ~ ~ -- j
._ _ ._._- -r--l----t
-0.1
o 100 200 300 400
time, S

7/28/2019 Experimental and Analytical Study of Vane Pump Inefficiencies
http://slidepdf.com/reader/full/experimental-and-analytical-study-of-vane-pump-inefficiencies 27/44
[Figure 11: Efficiency as a Function of Time)
0.08 I
-. 2a
0.06r : l
. 2b,~
-a 2cc: A ~ 0.04 -. -~ 0
\ ')
\ ~\ .l,..-,
0.02 ~
~ ~ A ..
. ~ - - - -.A.
IIIS1IIII "W'1 -= 1 '"o ..............J
o 100 200 300
time, S

7/28/2019 Experimental and Analytical Study of Vane Pump Inefficiencies
http://slidepdf.com/reader/full/experimental-and-analytical-study-of-vane-pump-inefficiencies 28/44
different pressure. The significance of this result stems from the fact that, in general,
the pumps are used for short periods of time (tested times of up to 4 seconds to reach
maximum pressure in a typical bladder) to inflate lumbar support bladders.
Figures 12 and 13 demonstrate an unusual property of vane pumps: the
efficiency of the pump increases linearly with the mass flow rate. As shown over thefull range in Figure 12 as well as in detail in Figure 13 , this behavior is relatively
insensitive to changes made in the exhaust process. Therefore, the goal of increasing
the efficiency of any vane pump could be realized by increasing the mass flow rate of
the pump.
Originally, plans were made to calculate the theoretical compression ratio based
upon the geometry of the pump using equation (9). However, an initial analysis of the
pump showed that from a geometric point of the view the compression ratio should be
at or below 1. This is inconsistent with the experimental data which shows a pressure
increase to 3 psia or a pressure ratio of about 1.2. The offset of the vanes themselves
(their axes do not intersect in the center of the rotor) does differ from the geometric
model and may account for some of the effects. Also, the fact that the maximum
pressure changed with the outlet bore diameter proves that more complex geometric and
fluid effects are present than the simple geometric model can predict.
21
7/28/2019 Experimental and Analytical Study of Vane Pump Inefficiencies
http://slidepdf.com/reader/full/experimental-and-analytical-study-of-vane-pump-inefficiencies 29/44
- -
-- - - --
~ i g u r e 13: E ~ ~ ! n ~ y as ' ! f u ~ ~ t i o ~ m p M a s ~ ~ Rate I
0.08
t-0.06
_.- - - - -
~U O. 04 ~ - .CCI)a-U~ 0.02 ~ ~ - t - ~ - j - ~ - - - t - . 2a
. 2b
0 -B 2c
-0.02
-0.1 0 0.1 0.2 0.3 0.4
Thousandths
mass flow rate, Ibm/s
I

7/28/2019 Experimental and Analytical Study of Vane Pump Inefficiencies
http://slidepdf.com/reader/full/experimental-and-analytical-study-of-vane-pump-inefficiencies 30/44
[ F i g L l r e 1 3 ~ ~ ! . i c ! : n c y as ~ F u n ~ ! ! ? ! o ! . . P u m p ~ ~ s Flo!'_Ra!:1
0.015 .--,- - - - - - , - -- ---,---------,---------,--------,---------,,------.,-------,
0.01
uc:
Q) 0.005utE . 2aQ)
. 2bo I ~ 4
+
-B 2c
-0.005 - ' --_-------L__ ------'-----__ - " - -_---L__-------'-----__ ~ _ ____._I--I__-0.02 o 0.02 0.04 0.06
Thousandths
mass flow rate, Ibm/s
7/28/2019 Experimental and Analytical Study of Vane Pump Inefficiencies
http://slidepdf.com/reader/full/experimental-and-analytical-study-of-vane-pump-inefficiencies 31/44
V. Conclusions
It has been shown that increasing the supply line diameter will increase the
efficiency of a vane pump by significant amounts (measured up to 5%). This
difference is especially evident at low pressures; the advantage decreases with
increasing pressure. Increasing the outlet bore diameter can also increase the efficiency
by up to 1% over only increasing the outlet line size, but this increase incurs the penalty
of lowering the maximum pressure which the pump can deliver. This also decreases its
efficiency versus the enlarged outlet diameter-only modification at higher pressures.
It has also been demonstrated that the changes made in pump configuration
provide greater pressure delivery per input power by over 5% (average) by only
increasing the supply line diameter and by over 12% (average) by also adding an
enlarged outlet bore diameter.These efficiency advantages are, however, shOlt-lived and occur in the first 60
seconds of the tests. Advantages in both efficiency and mass flow rate dwindle as time
increased during the test.
Vane pumps can be characterized as having a linear relationship between mass
flow rate and efficiency. Increasing mass flow rate will linearly increase the efficiency
of the pump.
24

7/28/2019 Experimental and Analytical Study of Vane Pump Inefficiencies
http://slidepdf.com/reader/full/experimental-and-analytical-study-of-vane-pump-inefficiencies 32/44
VI. Recommendations
A. Recommendations for Pump System
Due to the increased efficiency and higher pressure delivery rates, the changes
made to the pumps could be used to improve the existing pump design. The bore
diameter used is within the range of physical constraints while the new supply line hose
is of standard size and material. Therefore, both changes are cost-effective, and they
will increase the performance of the pump.
B. Experimental Recommendations
While the results of this study are illuminating, several opportunities exist to
better the analysis and several new questions have been raised. Since much of the
difference between the modified and unmodified pumpsoccUlTed
in the early part of theexperiment (the first 60 seconds), further testing using shorter time periods could better
quantify the advantages of the changes. To further quantify the effects of bore diameter
upon peak pressure and efficiency, several values of bore diameter should be tested.
Also, a large opportunity exists to determine how the exhaust bore diameter affects the
compression ratio of the pump through geometlic modeling and further
experimentation. Also, while it was originally passed over, changes in the intake port
geometry could also be investigated to determine ways to increase mass flow rate and
thus efficiency.
25

7/28/2019 Experimental and Analytical Study of Vane Pump Inefficiencies
http://slidepdf.com/reader/full/experimental-and-analytical-study-of-vane-pump-inefficiencies 33/44
References
White, Frank: M. FluidMechanics 2nd Ed . New York, McGraw-Hill Incorporated, 1986
Moran, Michael J. and Shapiro, Howard N . Fundamentals ofEngineering Thermodynamics 2nd Ed .New York, John Wiley and Sons, 1992
Rudge, P. J. and Smith, D. G. "Pressure-Volume Diagrams for Sliding Vane Rotary Compressors" The
Institution ofMechanical Engineers Proceedings 1969-1970, Volume 184, Part 3R, London, 1970
26

7/28/2019 Experimental and Analytical Study of Vane Pump Inefficiencies
http://slidepdf.com/reader/full/experimental-and-analytical-study-of-vane-pump-inefficiencies 34/44
Append'ix A: Original Data Sheets
27

7/28/2019 Experimental and Analytical Study of Vane Pump Inefficiencies
http://slidepdf.com/reader/full/experimental-and-analytical-study-of-vane-pump-inefficiencies 35/44
Senior Project DATA SHEET
BrianE. Tucker
Experiment Description: ~ s;c.1""\p J '- ••++v, c..."-"""c.""
Pump: Tfjpe. 3
Date: 3 - 1 - 9-:>
Tank Volume: ~ " " , H Q " " Total time of experiment: 5 ...1.....t-c'.\
Notes:
,IMEJS .PRESSURE PSIG""\0
2.("('S- 1\, , 'f
bO <-I ~ II."' ]0 S / ~ ~ \ I, .,0
12-0 "/. t?,> \ \ ""1>
\ ~ o ~\. ...... Q 9 , o
o _ ~ O-\0
24 0 10 . }?O
2 . . ~ I l ' ~j c ?o \ 2.. \(0 .
B ..+"tf i
CURRENT A
\.\ '110h ?2--:c.f.jfJ)4 ~ f2
2 t9 1>t"3 J st.!
g . ~ r . . .~ , ~
~ y l . . 2 . ~? nr"l,
V.. I _ ~ C . c. ........ \ . . , . . . . . " c . ~ :' - t . . , " ' - V ' I ~
lI"'-Til.C;""" ( 'L.o$ ~l ~ · ' ' ' v
ME-lEX M - 4 ~ S Dlo-il Ii ) 455"'610
L. C. 0.0 0 \ A ~ . ~ 'f t l ' - S S ~ 6 W L ~
(U . " , * Ie;- r ; - -= - - - ---. L L. 0,0; r
-- ~ -<:() . - - - ---
t
28

7/28/2019 Experimental and Analytical Study of Vane Pump Inefficiencies
http://slidepdf.com/reader/full/experimental-and-analytical-study-of-vane-pump-inefficiencies 36/44
-,
Senior Project Brian E. Tucker
I I = ~ r i m e n t Description: Pump: E . r - "Jo """ .... .. . i ~ s . ; ~ . I O t o \ + ~ + Date: ~ \ \ . . \ 9 - , \q95
Tank Volume: F 1 ~ \ \ ~ v.s ITotal time of experiment: ~ o o s
Notes: u \;":' ~ + . . t . ~ - p ) \!"C.
b ~ " c,.l-\c;-I")V ~ " ' k " ~ .
TIME, S PRESSURE, PSIG CURRENT,A N t> ~ o . e l C l . A t t ~ t :0 0 , . ~ ' " \ . b ~ A~ l.L..(S"" I . ~ c .
bO 1.. 90 2. \ \
' 2 .09 "2.2..0'0 z. z.,.,tz..o 2.2.S"
\50 2 . \ 0 2.31
I ~ O 2.J'7 '2."1'7
2 - ~ a 2.. '2.'40
,cfO 2 . . . ~ 9 Z ' ~ l ~ 7 0 2 . ~ '2 .. <.(S"
~ o 2 . . c . L ~..:"D
29

7/28/2019 Experimental and Analytical Study of Vane Pump Inefficiencies
http://slidepdf.com/reader/full/experimental-and-analytical-study-of-vane-pump-inefficiencies 37/44
Senior ProjectBrian E. Tucker
Experiment .ption:Pump:"'''" t:- No _ .... { . " " ' ~ ; l .. ~ o w l ~ Ii", ..
Date: ~ ( f . A , - \ •• ,U,
Tank Volume: 9 :).. \\..,-> V$
Total time of x p e r i m e n t ~ $" .
Notes: v." ....) o \ - C . " ' ~ P--I j l ~ , C J " I;t\e-
~ , , \ - 4 . 0 - . , G"-'Y , H,.,"-t..e( •
TIME, S PRESSURE, PSIG CURRENT,A0 1.7l N o \oto.cJ,.
0;- C"'" r t :\. 9S- 2 . ' l ~ be> 2 . . « ~ 2 . ~ s - ",:t90 '2.,,9- 2. -<f
2. "7(Z-O 2 .<1'l
\ ~ O Z.r<J ?'7(P
\ ~ o 'Z..et? ~ . ' 1 ~ 2. \0 S.D '7 2 . ~ 1 .2.'to 3. \0 z.g3 :1-'70 Sol .-, 2 _ ~ . P )c)cJ .1.09 ? ¢G.
30

7/28/2019 Experimental and Analytical Study of Vane Pump Inefficiencies
http://slidepdf.com/reader/full/experimental-and-analytical-study-of-vane-pump-inefficiencies 38/44
Senior ProjectBrian E. Tucker
~ '-riment Description: P u ~ p ' t ~ x:- ~ . . . . . . . a c > A OctL.ar(.... " " ~ ) ; I ? ~ l:",«...
Date: H'ft.\l.... \ ' . l 9QS
lank Volume: g c ) " ' ~ - ' '" sTotal time of experimentJOO, Notes: Us,' ' ' j ~ ~ ; ~ r c . . l ~ ( t , l4V.)C- \ ,....4 -
~ . ~ c . . ~ ~ i ~ , . " ~ .
TIME, S PRESSURE, PSIG0 0
3&> '2..00
l·S-Go( ,0
'2 . l i 'o10
12..0 Z.P>\S-O lo·t ' :)
I ~ D 2.2'7
2. .0 (J.99
::;?ttO 2.90~ . . , o 2.V')
""3Ot::' '2..'t '"l
CURRENT , A
1 .902 4 ~2.s-t
2.. '" '2 .. S'I2.LfP
~ . < . I '2 . ~ ~ "Z ' ' 4 ~ '2.",'2 ' ' '( ' '
-
31

7/28/2019 Experimental and Analytical Study of Vane Pump Inefficiencies
http://slidepdf.com/reader/full/experimental-and-analytical-study-of-vane-pump-inefficiencies 39/44
Appendix B: Data Reduction
32

7/28/2019 Experimental and Analytical Study of Vane Pump Inefficiencies
http://slidepdf.com/reader/full/experimental-and-analytical-study-of-vane-pump-inefficiencies 40/44
Brian E. Tucker
Senior Project
Brian E. Tucker
Constants:
Volume: 8 gallons 1.06944 ftA 3
Temp. 77 deg F 537 deg R
R 53.35
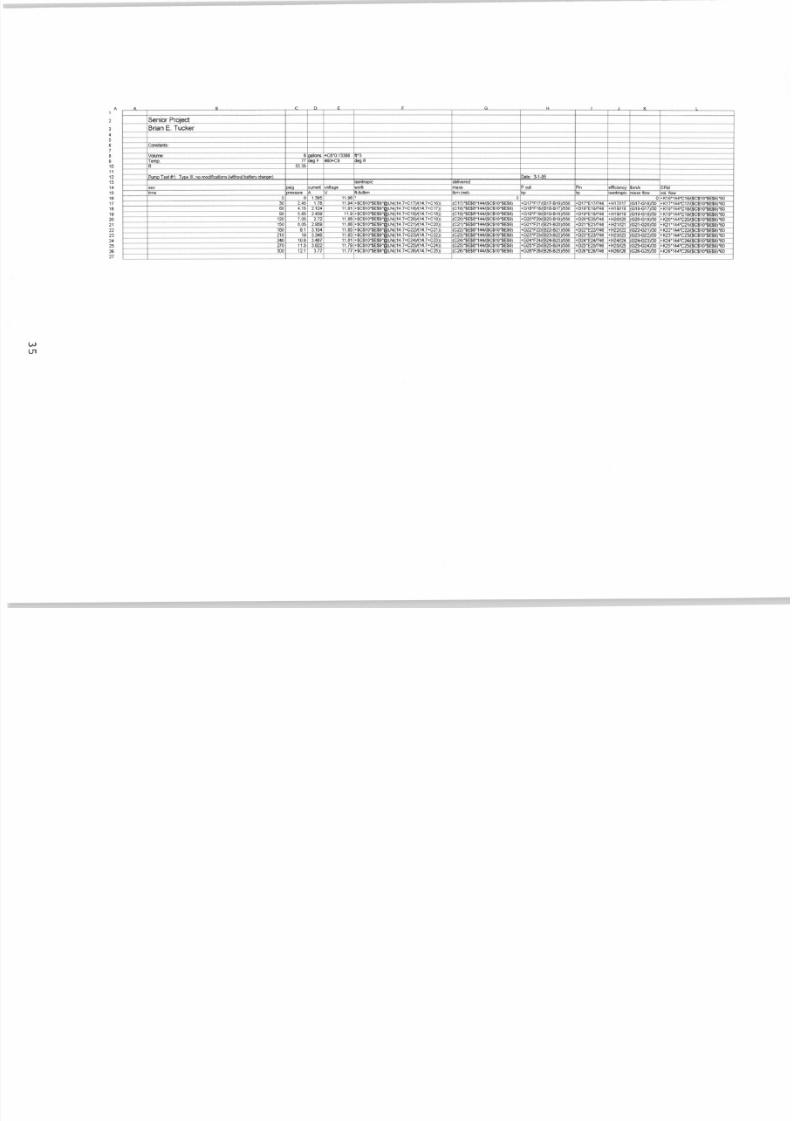
Pum!2 Test #1 : Ti'J1e III, no modifications (without batterY charger) Date: 3-1-95
isentropic delivered
sec psig current voltage work mass Pout Pin efficiency Ibm/s
time pressure A V ft-Ibllbm Ibm (net) hp hp isentropic mass flow
0 0 1.385 11 .96 • 0 0
30 2.45 1.78 11 .94 4416.255 0.01317 0.003525 0.02849 0.123726 0.000439
60 4.15 2.124 11 .91 2707.748 0.022308 0.003661 0.03391 0.107958 0.000305
90 5.65 2.439 11 .9 2193.593 0.030371 0.004038 0.038906 0.103779 0.000269
120 7.05 2.72 11 .88 1906.096 0.037897 0.004378 0.043316 0.101068 0.000251
150 8.05 2.959 11 .86 1287.81 0.043272 0.003377 0.047043 0.071793 0.000179
180 9.1 3.154 11 .85 1292.653 0.048916 0.003832 0.0501 0.076491 0.000188
210 10 3.346 11.83 1063.382 0.053754 0.003464 0.053061 0.06529 0.000161
240 10.8 3.487 11 .81 913.1913 0.058054 0.003213 0.055203 0.058203 0.000143
270 11 .5 3.622 11 .79 775.841 0.061817 0.002907 0.057243 0.050778 0.000125
300 12.1 3.77 11 .77 648 .6832 0.065042 0.002557 0.059481 0.04299 0.000108
Pum!2 Test #2: Ti'J1e II. no modifications Date: 4-19-95
isentropic deliveredsec psig current voltage work mass Pout Pin efficiency Ibm/s
time pressure A V ft-Ibllbm Ibm hp hp isentropic mass flow
0 0 1.64 11 .92 0 0- 0.026205 - 0
30 1.45 1.96 11 .92 2695.08 0.007794 0.001273 0.031318 0.040651 0.00026
60 1.9 2.11 11 .92 787.3489 0.010213 0.000487 0.033715 0.014455 0.000081
90 2.09 2.2 11 .92 326.0473 0.011235 0.000222 0.035153 0.006315 0.000034
120 2.25 2.27 11 .92 271 .717 0.012095 0.000199 0.036271 0.005491 0.000029
150 2.3 2.31 11 .92 84.38578 0.012363 0.000063 0.03691 0.001713 9.0E-06
180 2.37 2.37 11 .92 117.7241 0.01274 0.000091 0.037869 0.0024 0.000013
210 2.45 2.4 11 .92 133.9521 0.01317 0.000107 0.038349 0.002788 0.000014
240 2.48 2.41 11 .92 50.071 0.013331 0.00004 0.038508 0.001051 5.4E-06
270 2.54 2.45 11 .92 99.88023 0.013653 0.000083 0.039147 0.002111 0.000011
300 2.6 2.45 11 .92 99.53322 0.013976 0.000084 0.039147 0.002154 0.000011
Pum!2 Test #2: Ti'J1e II, no modifications; large outiet line Date: 4-19-95
isentropic delivered
sec psig current voltage work mass Pout Pin efficiency Ibm/stime pressure A V ft-Ibllbm Ibm hp hp isentrop ic mass flow
0 0 1.71 11.92 0 0- 0.027323 . . . 0
30 1.95 2.39 11.92 3568.591 0.010482 0.002267 0.038189 0.059364 0.000349
60 2.45 2.55 11 .92 847.6639 0.01317 0.000677 0.040745 0.016605 0.00009
90 2.69 2.64 11 .92 398.1389 0.01446 0.000349 0.042183 0.008271 0.000043
120 2.73 2.71 11 .92 65.82186 0.014675 0.000059 0.043302 0.001352 7.2E-06
150 2.89 2.76 11 .92 261.7855 0.015535 0.000246 0.044101 0.005589 0.000029
180 2.97 2.78 11 .92 130.0011 0.015965 0.000126 0.04442 0.002832 0.000014
210 3.07 2.81 11 .92 161 .6762 0.016502 0.000162 0.0449 0.003601 0.000018
240 3.1 2.83 11 .92 48.32548 0.016664 0.000049 0.045219 0.001079 5.4E-06
270 3.13 2.88 11 .92 48.2441 0.016825 0.000049 0.046018 0.001069 5.4E-06
300 3.08 2.86 11 .92 -80.452 0.016556 -8.1E-05 0.045699 -0.00177 -9.0E-06
Pum!2 Test #2 : Ti'J1e II. enlarged outiet; large outiet line Date: 4-19-95
IsentropIc delivered
sec psig current voltage work mass Pout Pin efficiency Ibm/s
time pressure A V ft-Ibllbm Ibm hp hp isentropic mass flow0 0 1.9 11 .92 0 0'" 0.030359 . . . 0
30 2 2.46 11 .92 3654.495 0.010751 0.002381 0.039307 0.060577 0.000358
60 2.56 2.56 11.92 944.9274 0.013761 0.000788 0.040905 0.019266 0.0001
90 2.8 2.61 11 .92 395.6189 0.015051 0.000361 0.041704 0.008653 0.000043
120 2.85 2.54 11 .92 81 .73743 0.01532 0.000076 0.040586 0.00187 9.0E-06
150 2.85 2.48 11 .92 0 0.01532 0 0.039627 0 0
180 2.87 2.46 11 .92 32.62979 0.015427 0.000031 0.039307 0.000776 3.6E-06
210 2.89 2.48 11 .92 32.59267 0.015535 0.000031 0.039627 0.000774 3.6E-06
240 2.9 2.47 11 .92 16.28244 0.015589 0.000015 0.039467 0.00039 1.8E-06
270 2.87 2.46 11 .92 -48.8751 0.015427 -4 .6E-05 0.039307 -0.00116 -5.4E-06
300 2.87 2.46 11 .92 0 0.015427 0 0.039307 0 0
SPROJWRKWK4 05/07/95
33

7/28/2019 Experimental and Analytical Study of Vane Pump Inefficiencies
http://slidepdf.com/reader/full/experimental-and-analytical-study-of-vane-pump-inefficiencies 41/44
Table A-1: Power-specific Pressurepower-specific pressure, psig/hp % increase VS. 2a
time s 2a 2b 2c 2b 2c
o 0 0 ONA NA30 46.29931 51 .06217 50.88121 10 .28712 9.896271
6056.3551660 .1296262 .583896 .697626 11 .0526390 59.4547 63.76919 67.13981 7.256778 12.92599
120 62.03249 63.04577 70.22208 1.633456 13.2021150 62.31297 65.53168 71 .92101 5.165406 15.419
180 62.58389 66.86121 73.01454 6.834532 16.66667
210 63.88772 68.37457 72.93042 7.023023 14 .15405240 64.40168 68.55479 73.47906 6.448763 14 .09495
270 64.88289 68.01652 73.01454 4.82967 12.5328130066.4155667 .3980473.01454 1.479299.935897
AVG : 5.765566 12 .98804
34
7/28/2019 Experimental and Analytical Study of Vane Pump Inefficiencies
http://slidepdf.com/reader/full/experimental-and-analytical-study-of-vane-pump-inefficiencies 42/44
5
10
15
20
25
A
•
6
7•
11 12
13
14
16
17,.
,.
21 22
23
2.
26
27

7/28/2019 Experimental and Analytical Study of Vane Pump Inefficiencies
http://slidepdf.com/reader/full/experimental-and-analytical-study-of-vane-pump-inefficiencies 43/44
Appendix C: Sample Calculations
36

7/28/2019 Experimental and Analytical Study of Vane Pump Inefficiencies
http://slidepdf.com/reader/full/experimental-and-analytical-study-of-vane-pump-inefficiencies 44/44
Sample Calculations
Finding Pump Efficiency
w = RT In(Pi Pj ) = (53 .35 Ibfllbm-R)*(537R)*ln((4.15+ 14.7psi)/(2.45+ 14.7psi) = 2707.5 ft Ibfllbm
m (net) = PVIRT = (4.15 psi)* 144in2/ft2*1.069 ft3 /(53 .35 Ibfllbm-R)*(537R) = 0.0223 Ibm
W = w m = 60.379 ft-Ibf
P= 60.379 ft-Ibf / (30 s * 550 ft-Ibf/s-hp) = 3.659E-3 hp
Pin =2.124A*11 .91V = 0.0253kW = 0.0339 hp
efficiency = PIP in = 3.659E-3 hp / 0.0339 hp = 10.79 %