Embed Size (px)
Citation preview
Experts in Spray TechnologySpray
NozzlesSpray
ControlSpray
AnalysisSpray
Fabrication
Experimental and Computational Study of a Spray
at Multiple Injection Angles
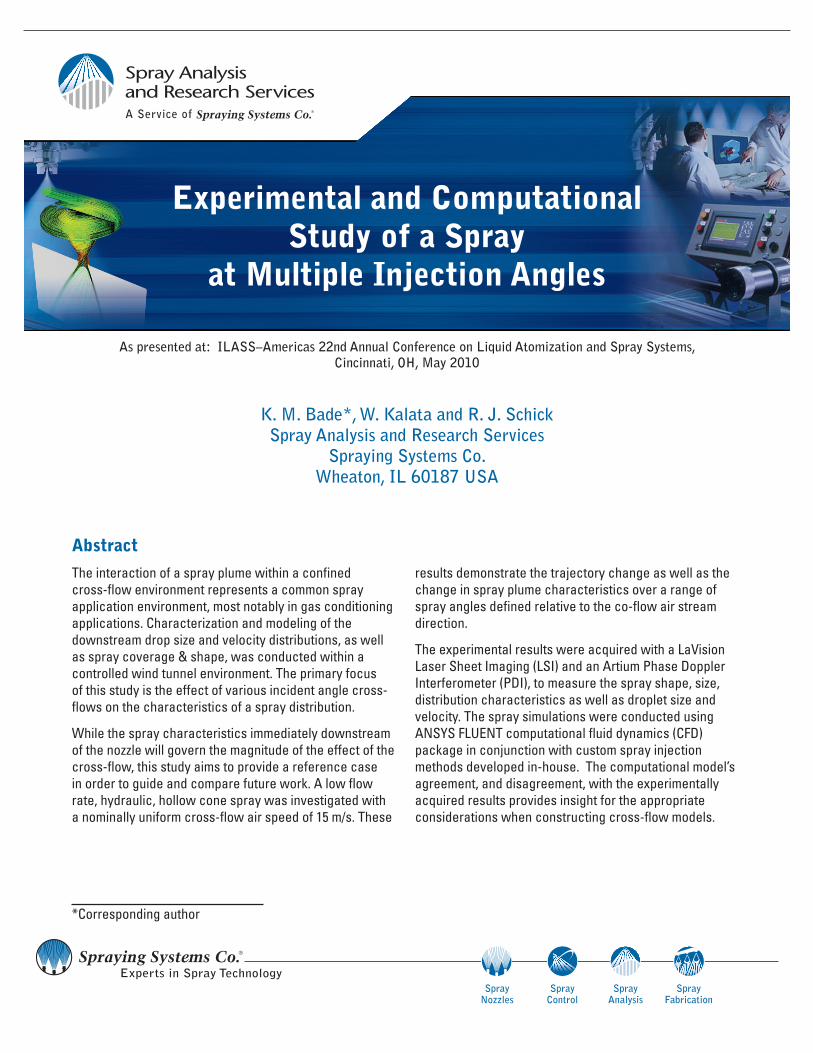
K. M. Bade*, W. Kalata and R. J. SchickSpray Analysis and Research Services
Spraying Systems Co.Wheaton, IL 60187 USA
Abstract
The interaction of a spray plume within a confined cross-flow environment represents a common spray application environment, most notably in gas conditioning applications. Characterization and modeling of the downstream drop size and velocity distributions, as well as spray coverage & shape, was conducted within a controlled wind tunnel environment. The primary focus of this study is the effect of various incident angle cross-flows on the characteristics of a spray distribution.
While the spray characteristics immediately downstream of the nozzle will govern the magnitude of the effect of the cross-flow, this study aims to provide a reference case in order to guide and compare future work. A low flow rate, hydraulic, hollow cone spray was investigated with a nominally uniform cross-flow air speed of 15 m/s. These
results demonstrate the trajectory change as well as the change in spray plume characteristics over a range of spray angles defined relative to the co-flow air stream direction.
The experimental results were acquired with a LaVision Laser Sheet Imaging (LSI) and an Artium Phase Doppler Interferometer (PDI), to measure the spray shape, size, distribution characteristics as well as droplet size and velocity. The spray simulations were conducted using ANSYS FLUENT computational fluid dynamics (CFD) package in conjunction with custom spray injection methods developed in-house. The computational model’s agreement, and disagreement, with the experimentally acquired results provides insight for the appropriate considerations when constructing cross-flow models.
*Corresponding author
As presented at: ILASS–Americas 22nd Annual Conference on Liquid Atomization and Spray Systems, Cincinnati, OH, May 2010
2 www.sprayconsultants.com
Introduction
Process improvement and optimization in the gas conditioning industry is a constantly ongoing effort. The improvements made in nozzle design and liquid atomization in recent years have provided the possibility of process optimization like never before. While on-site experimental testing provides the most direct assessment of a spray’s characteristics in a gas conditioning tower, often the cost and availability of testing is limited or impossible. Therefore, computational fluid dynamics (CFD) projects for this type of application have become very useful. Using CFD methods, gas conditioning process engineers are able to, for the first time, assess the spray quality within the actual spray process region. The increased use of CFD to model these processes requires in-depth validation of the methods used to model these applications and the results provided by these types of models.
Spraying Systems Co. has the unique combination of testing and modeling expertise which allow for a rigorous validation of these modeling techniques often used to simulate un-testable situations. This validation of CFD results is wide reaching in applicable variables; the focus of the present study is on the relative angle of the spray nozzle to a steady, nominally uniform co/cross-flow air stream. Orientation angles of the spray nozzle axis (α) varied from 0° (in-line with the co-flow air) to 135° at Δ15° intervals for the experimental results; while the CFD results are provided at 0°, 45°, and 90°. Comparisons of the agreement and disagreement a the common angles show that while the modeling matches the experimental results fairly well, there are additional factors which are causing notable discrepancies.
Experimental and Computational Study of a Spray at Multiple Injection Angles
EQUIPMENT & METHODS
Experimental Setup and Methods
The experimental setup consisted of a spray nozzle, wind tunnel, PDI system w/traverse, LSI system. All tests were carried out with the cross-flow air and spray liquid (water) at ambient temperature, ~68°F. The nozzle was operated with a steady 3.8 bar (55 psi) clean water supply for all tests.
Wind Tunnel
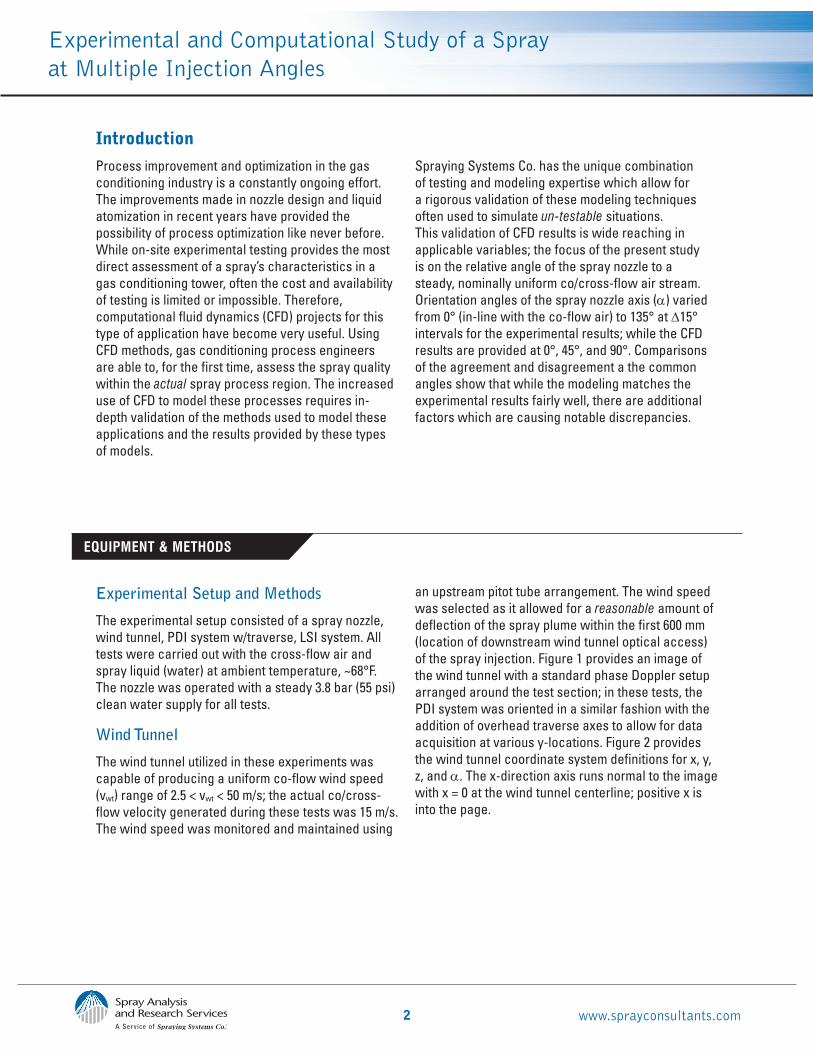
The wind tunnel utilized in these experiments was capable of producing a uniform co-flow wind speed (vwt) range of 2.5 < vwt < 50 m/s; the actual co/cross-flow velocity generated during these tests was 15 m/s. The wind speed was monitored and maintained using
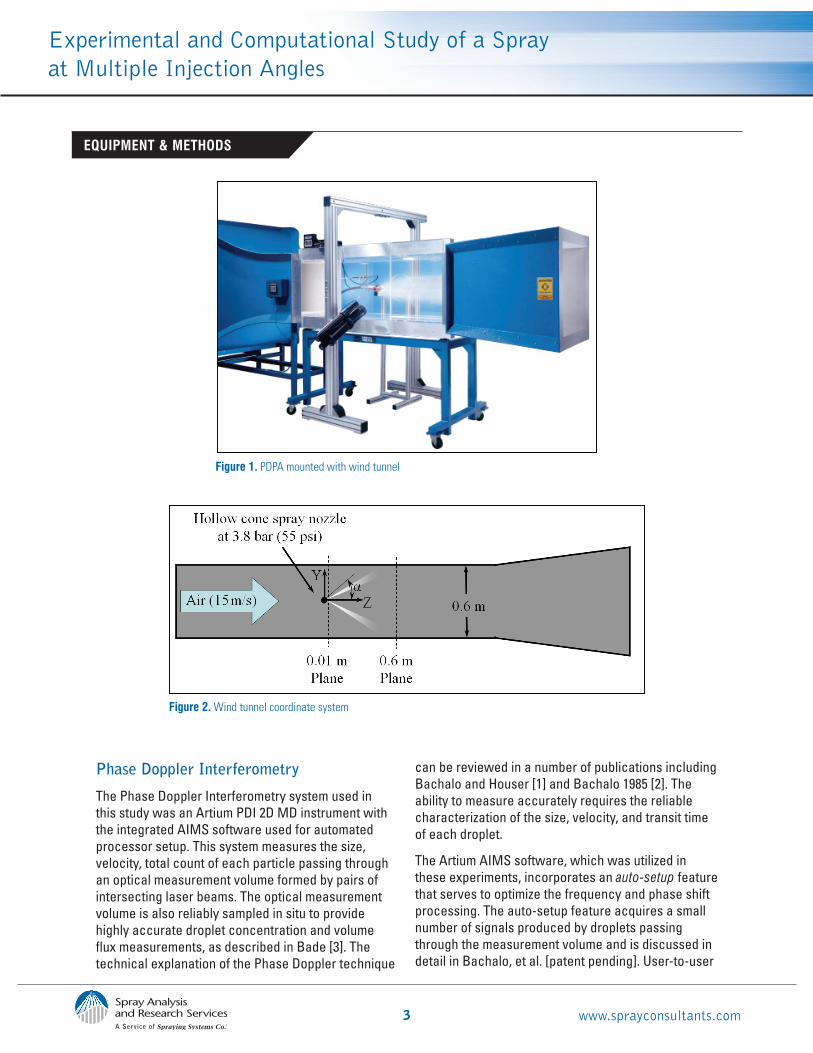
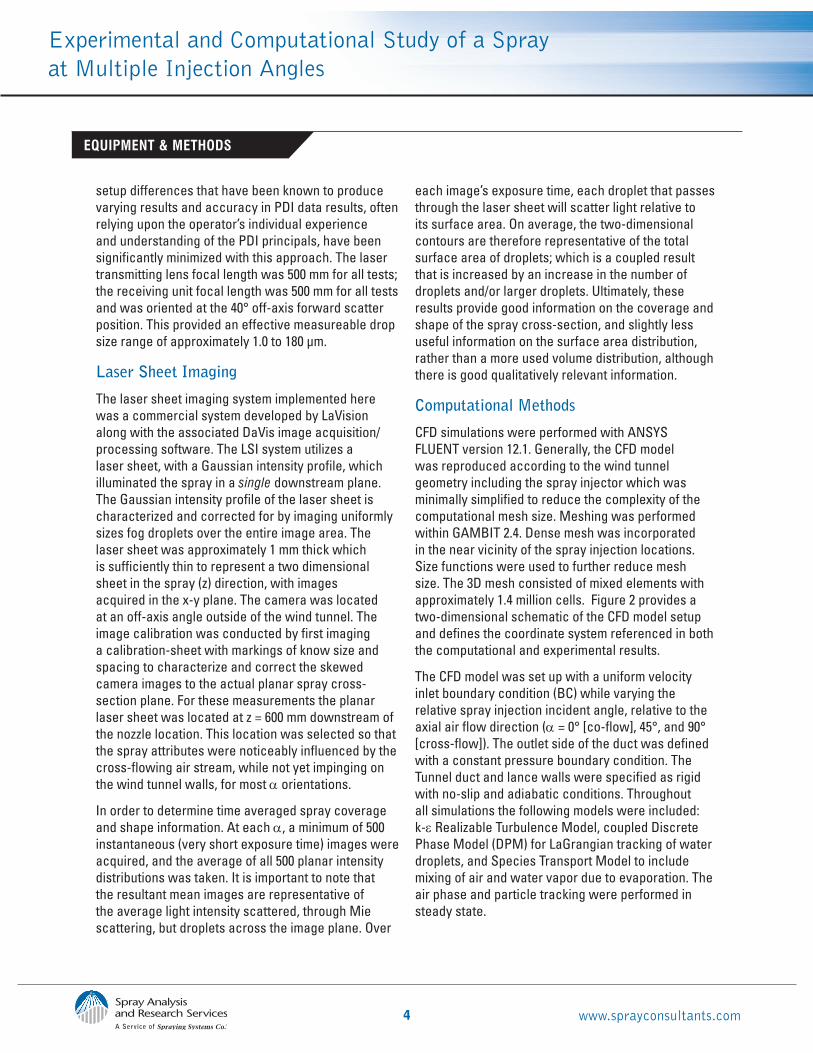
an upstream pitot tube arrangement. The wind speed was selected as it allowed for a reasonable amount of deflection of the spray plume within the first 600 mm (location of downstream wind tunnel optical access) of the spray injection. Figure 1 provides an image of the wind tunnel with a standard phase Doppler setup arranged around the test section; in these tests, the PDI system was oriented in a similar fashion with the addition of overhead traverse axes to allow for data acquisition at various y-locations. Figure 2 provides the wind tunnel coordinate system definitions for x, y, z, and α. The x-direction axis runs normal to the image with x = 0 at the wind tunnel centerline; positive x is into the page.
3 www.sprayconsultants.com
EQUIPMENT & METHODS
Experimental and Computational Study of a Spray at Multiple Injection Angles
Figure 1. PDPA mounted with wind tunnel
Figure 2. Wind tunnel coordinate system
Phase Doppler Interferometry
The Phase Doppler Interferometry system used in this study was an Artium PDI 2D MD instrument with the integrated AIMS software used for automated processor setup. This system measures the size, velocity, total count of each particle passing through an optical measurement volume formed by pairs of intersecting laser beams. The optical measurement volume is also reliably sampled in situ to provide highly accurate droplet concentration and volume flux measurements, as described in Bade [3]. The technical explanation of the Phase Doppler technique
can be reviewed in a number of publications including Bachalo and Houser [1] and Bachalo 1985 [2]. The ability to measure accurately requires the reliable characterization of the size, velocity, and transit time of each droplet.
The Artium AIMS software, which was utilized in these experiments, incorporates an auto-setup feature that serves to optimize the frequency and phase shift processing. The auto-setup feature acquires a small number of signals produced by droplets passing through the measurement volume and is discussed in detail in Bachalo, et al. [patent pending]. User-to-user
4 www.sprayconsultants.com
Experimental and Computational Study of a Spray at Multiple Injection Angles
EQUIPMENT & METHODS
setup differences that have been known to produce varying results and accuracy in PDI data results, often relying upon the operator’s individual experience and understanding of the PDI principals, have been significantly minimized with this approach. The laser transmitting lens focal length was 500 mm for all tests; the receiving unit focal length was 500 mm for all tests and was oriented at the 40° off-axis forward scatter position. This provided an effective measureable drop size range of approximately 1.0 to 180 µm.
Laser Sheet Imaging
The laser sheet imaging system implemented here was a commercial system developed by LaVision along with the associated DaVis image acquisition/processing software. The LSI system utilizes a laser sheet, with a Gaussian intensity profile, which illuminated the spray in a single downstream plane. The Gaussian intensity profile of the laser sheet is characterized and corrected for by imaging uniformly sizes fog droplets over the entire image area. The laser sheet was approximately 1 mm thick which is sufficiently thin to represent a two dimensional sheet in the spray (z) direction, with images acquired in the x-y plane. The camera was located at an off-axis angle outside of the wind tunnel. The image calibration was conducted by first imaging a calibration-sheet with markings of know size and spacing to characterize and correct the skewed camera images to the actual planar spray cross-section plane. For these measurements the planar laser sheet was located at z = 600 mm downstream of the nozzle location. This location was selected so that the spray attributes were noticeably influenced by the cross-flowing air stream, while not yet impinging on the wind tunnel walls, for most α orientations.
In order to determine time averaged spray coverage and shape information. At each α, a minimum of 500 instantaneous (very short exposure time) images were acquired, and the average of all 500 planar intensity distributions was taken. It is important to note that the resultant mean images are representative of the average light intensity scattered, through Mie scattering, but droplets across the image plane. Over
each image’s exposure time, each droplet that passes through the laser sheet will scatter light relative to its surface area. On average, the two-dimensional contours are therefore representative of the total surface area of droplets; which is a coupled result that is increased by an increase in the number of droplets and/or larger droplets. Ultimately, these results provide good information on the coverage and shape of the spray cross-section, and slightly less useful information on the surface area distribution, rather than a more used volume distribution, although there is good qualitatively relevant information.
Computational Methods
CFD simulations were performed with ANSYS FLUENT version 12.1. Generally, the CFD model was reproduced according to the wind tunnel geometry including the spray injector which was minimally simplified to reduce the complexity of the computational mesh size. Meshing was performed within GAMBIT 2.4. Dense mesh was incorporated in the near vicinity of the spray injection locations. Size functions were used to further reduce mesh size. The 3D mesh consisted of mixed elements with approximately 1.4 million cells. Figure 2 provides a two-dimensional schematic of the CFD model setup and defines the coordinate system referenced in both the computational and experimental results.
The CFD model was set up with a uniform velocity inlet boundary condition (BC) while varying the relative spray injection incident angle, relative to the axial air flow direction (α = 0° [co-flow], 45°, and 90° [cross-flow]). The outlet side of the duct was defined with a constant pressure boundary condition. The Tunnel duct and lance walls were specified as rigid with no-slip and adiabatic conditions. Throughout all simulations the following models were included: k-ε Realizable Turbulence Model, coupled Discrete Phase Model (DPM) for LaGrangian tracking of water droplets, and Species Transport Model to include mixing of air and water vapor due to evaporation. The air phase and particle tracking were performed in steady state.
5 www.sprayconsultants.com
Experimental and Computational Study of a Spray at Multiple Injection Angles
EQUIPMENT & METHODS
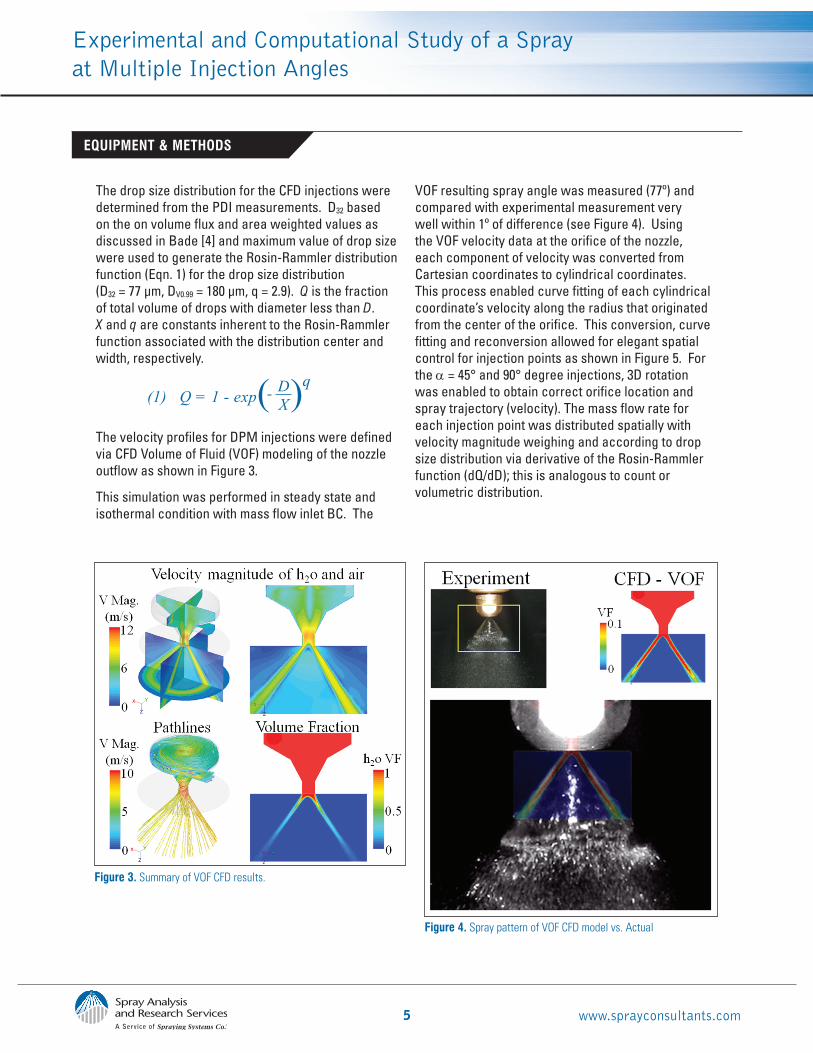
Figure 3. Summary of VOF CFD results.
The drop size distribution for the CFD injections were determined from the PDI measurements. D32 based on the on volume flux and area weighted values as discussed in Bade [4] and maximum value of drop size were used to generate the Rosin-Rammler distribution function (Eqn. 1) for the drop size distribution (D32 = 77 µm, DV0.99 = 180 µm, q = 2.9). Q is the fraction of total volume of drops with diameter less than D. X and q are constants inherent to the Rosin-Rammler function associated with the distribution center and width, respectively.
The velocity profiles for DPM injections were defined via CFD Volume of Fluid (VOF) modeling of the nozzle outflow as shown in Figure 3.
This simulation was performed in steady state and isothermal condition with mass flow inlet BC. The
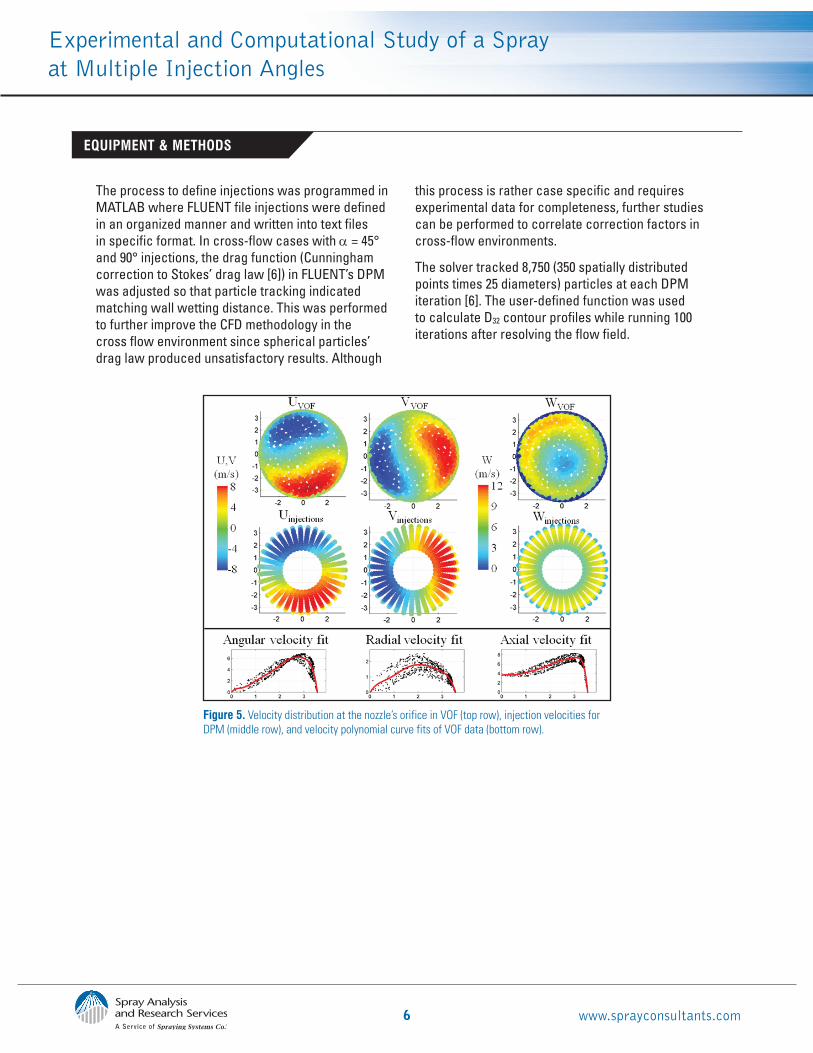
VOF resulting spray angle was measured (77º) and compared with experimental measurement very well within 1º of difference (see Figure 4). Using the VOF velocity data at the orifice of the nozzle, each component of velocity was converted from Cartesian coordinates to cylindrical coordinates. This process enabled curve fitting of each cylindrical coordinate’s velocity along the radius that originated from the center of the orifice. This conversion, curve fitting and reconversion allowed for elegant spatial control for injection points as shown in Figure 5. For the α = 45° and 90° degree injections, 3D rotation was enabled to obtain correct orifice location and spray trajectory (velocity). The mass flow rate for each injection point was distributed spatially with velocity magnitude weighing and according to drop size distribution via derivative of the Rosin-Rammler function (dQ/dD); this is analogous to count or volumetric distribution.
(1) Q = 1 - exp( ) DX
-q
Figure 4. Spray pattern of VOF CFD model vs. Actual
6 www.sprayconsultants.com
Experimental and Computational Study of a Spray at Multiple Injection Angles
EQUIPMENT & METHODS
The process to define injections was programmed in MATLAB where FLUENT file injections were defined in an organized manner and written into text files in specific format. In cross-flow cases with α = 45° and 90° injections, the drag function (Cunningham correction to Stokes’ drag law [6]) in FLUENT’s DPM was adjusted so that particle tracking indicated matching wall wetting distance. This was performed to further improve the CFD methodology in the cross flow environment since spherical particles’ drag law produced unsatisfactory results. Although
this process is rather case specific and requires experimental data for completeness, further studies can be performed to correlate correction factors in cross-flow environments.
The solver tracked 8,750 (350 spatially distributed points times 25 diameters) particles at each DPM iteration [6]. The user-defined function was used to calculate D32 contour profiles while running 100 iterations after resolving the flow field.
Figure 5. Velocity distribution at the nozzle’s orifice in VOF (top row), injection velocities for DPM (middle row), and velocity polynomial curve fits of VOF data (bottom row).
7 www.sprayconsultants.com
Experimental and Computational Study of a Spray at Multiple Injection Angles
RESULTS & DISCUSSION
LSI Results
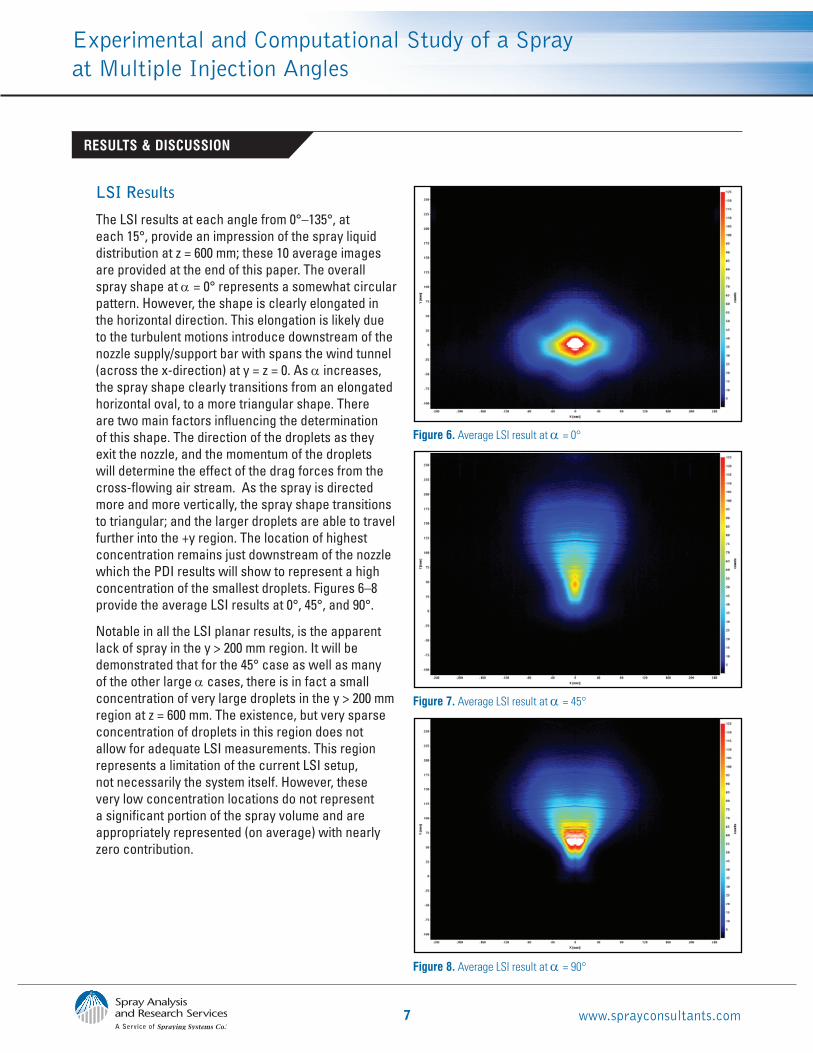
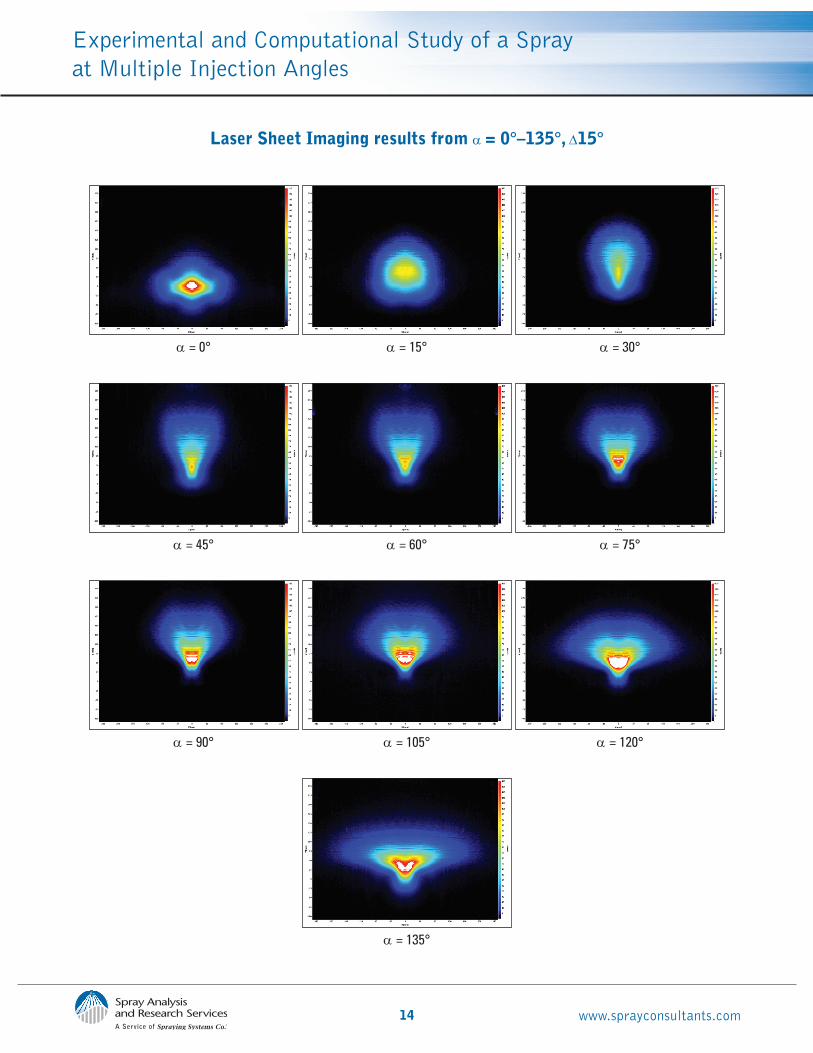
The LSI results at each angle from 0°–135°, at each 15°, provide an impression of the spray liquid distribution at z = 600 mm; these 10 average images are provided at the end of this paper. The overall spray shape at α = 0° represents a somewhat circular pattern. However, the shape is clearly elongated in the horizontal direction. This elongation is likely due to the turbulent motions introduce downstream of the nozzle supply/support bar with spans the wind tunnel (across the x-direction) at y = z = 0. As α increases, the spray shape clearly transitions from an elongated horizontal oval, to a more triangular shape. There are two main factors influencing the determination of this shape. The direction of the droplets as they exit the nozzle, and the momentum of the droplets will determine the effect of the drag forces from the cross-flowing air stream. As the spray is directed more and more vertically, the spray shape transitions to triangular; and the larger droplets are able to travel further into the +y region. The location of highest concentration remains just downstream of the nozzle which the PDI results will show to represent a high concentration of the smallest droplets. Figures 6–8 provide the average LSI results at 0°, 45°, and 90°.
Notable in all the LSI planar results, is the apparent lack of spray in the y > 200 mm region. It will be demonstrated that for the 45° case as well as many of the other large α cases, there is in fact a small concentration of very large droplets in the y > 200 mm region at z = 600 mm. The existence, but very sparse concentration of droplets in this region does not allow for adequate LSI measurements. This region represents a limitation of the current LSI setup, not necessarily the system itself. However, these very low concentration locations do not represent a significant portion of the spray volume and are appropriately represented (on average) with nearly zero contribution.
Figure 6. Average LSI result at α = 0°
Figure 7. Average LSI result at α = 45°
Figure 8. Average LSI result at α = 90°
8 www.sprayconsultants.com
Experimental and Computational Study of a Spray at Multiple Injection Angles
RESULTS & DISCUSSION
PDI Results
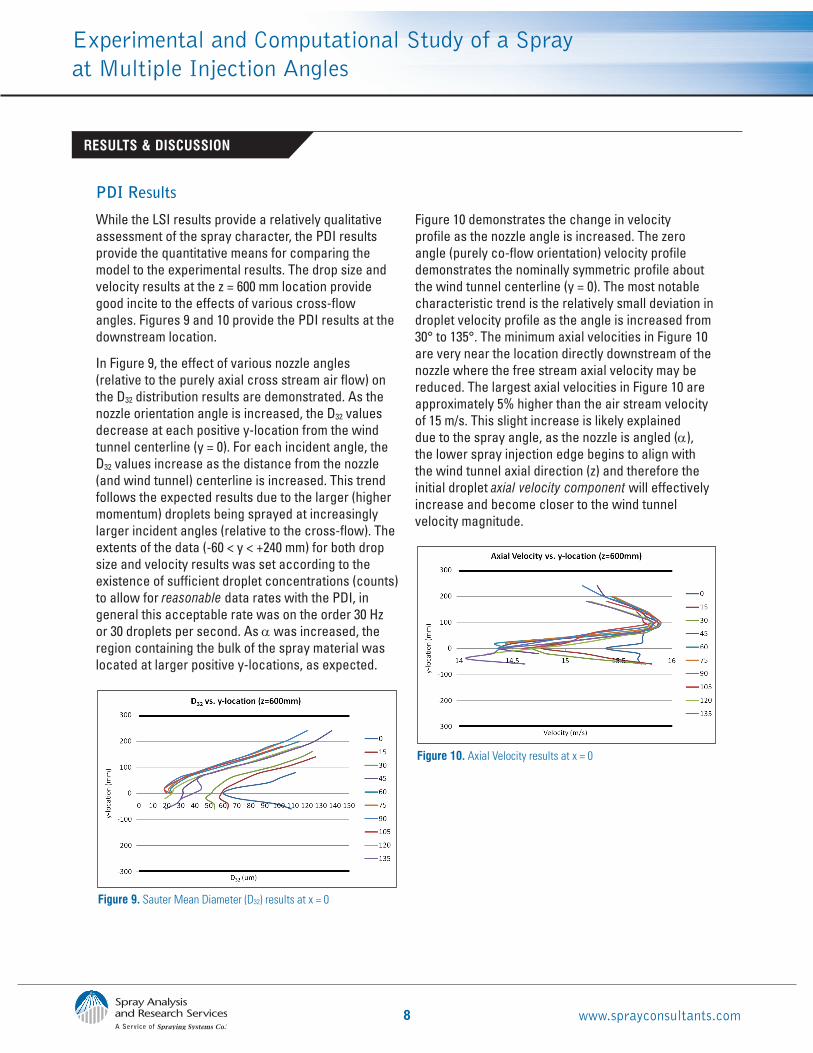
While the LSI results provide a relatively qualitative assessment of the spray character, the PDI results provide the quantitative means for comparing the model to the experimental results. The drop size and velocity results at the z = 600 mm location provide good incite to the effects of various cross-flow angles. Figures 9 and 10 provide the PDI results at the downstream location.
In Figure 9, the effect of various nozzle angles (relative to the purely axial cross stream air flow) on the D32 distribution results are demonstrated. As the nozzle orientation angle is increased, the D32 values decrease at each positive y-location from the wind tunnel centerline (y = 0). For each incident angle, the D32 values increase as the distance from the nozzle (and wind tunnel) centerline is increased. This trend follows the expected results due to the larger (higher momentum) droplets being sprayed at increasingly larger incident angles (relative to the cross-flow). The extents of the data (-60 < y < +240 mm) for both drop size and velocity results was set according to the existence of sufficient droplet concentrations (counts) to allow for reasonable data rates with the PDI, in general this acceptable rate was on the order 30 Hz or 30 droplets per second. As α was increased, the region containing the bulk of the spray material was located at larger positive y-locations, as expected.
Figure 9. Sauter Mean Diameter (D32) results at x = 0
Figure 10 demonstrates the change in velocity profile as the nozzle angle is increased. The zero angle (purely co-flow orientation) velocity profile demonstrates the nominally symmetric profile about the wind tunnel centerline (y = 0). The most notable characteristic trend is the relatively small deviation in droplet velocity profile as the angle is increased from 30° to 135°. The minimum axial velocities in Figure 10 are very near the location directly downstream of the nozzle where the free stream axial velocity may be reduced. The largest axial velocities in Figure 10 are approximately 5% higher than the air stream velocity of 15 m/s. This slight increase is likely explained due to the spray angle, as the nozzle is angled (α), the lower spray injection edge begins to align with the wind tunnel axial direction (z) and therefore the initial droplet axial velocity component will effectively increase and become closer to the wind tunnel velocity magnitude.
Figure 10. Axial Velocity results at x = 0
9 www.sprayconsultants.com
Experimental and Computational Study of a Spray at Multiple Injection Angles
RESULTS & DISCUSSION
CFD Results
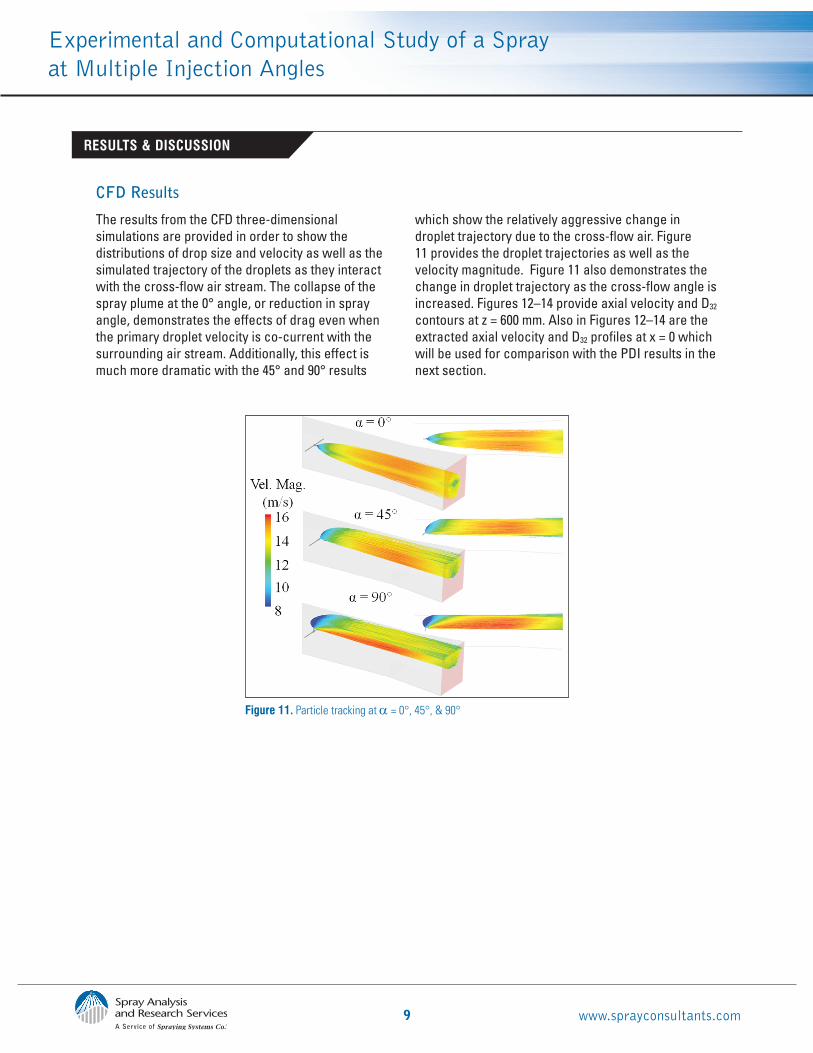
The results from the CFD three-dimensional simulations are provided in order to show the distributions of drop size and velocity as well as the simulated trajectory of the droplets as they interact with the cross-flow air stream. The collapse of the spray plume at the 0° angle, or reduction in spray angle, demonstrates the effects of drag even when the primary droplet velocity is co-current with the surrounding air stream. Additionally, this effect is much more dramatic with the 45° and 90° results
which show the relatively aggressive change in droplet trajectory due to the cross-flow air. Figure 11 provides the droplet trajectories as well as the velocity magnitude. Figure 11 also demonstrates the change in droplet trajectory as the cross-flow angle is increased. Figures 12–14 provide axial velocity and D32 contours at z = 600 mm. Also in Figures 12–14 are the extracted axial velocity and D32 profiles at x = 0 which will be used for comparison with the PDI results in the next section.
Figure 11. Particle tracking at α = 0°, 45°, & 90°
10 www.sprayconsultants.com
Experimental and Computational Study of a Spray at Multiple Injection Angles
RESULTS & DISCUSSION
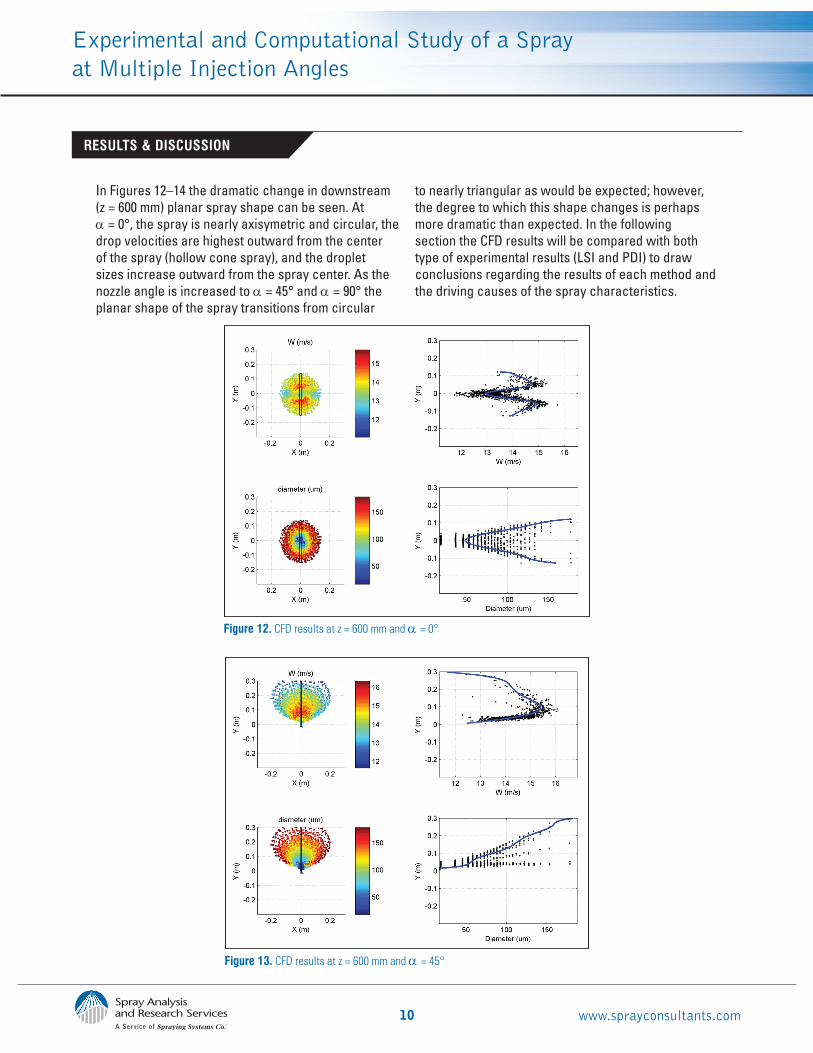
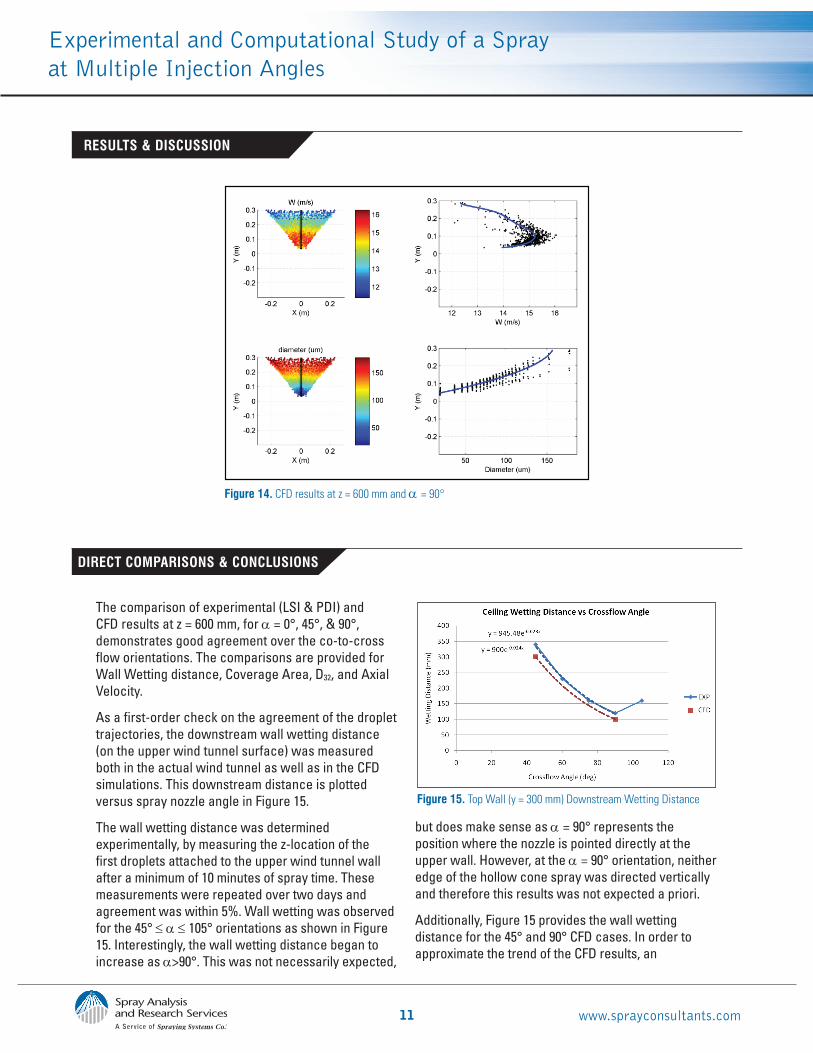
In Figures 12–14 the dramatic change in downstream (z = 600 mm) planar spray shape can be seen. At α = 0°, the spray is nearly axisymetric and circular, the drop velocities are highest outward from the center of the spray (hollow cone spray), and the droplet sizes increase outward from the spray center. As the nozzle angle is increased to α = 45° and α = 90° the planar shape of the spray transitions from circular
to nearly triangular as would be expected; however, the degree to which this shape changes is perhaps more dramatic than expected. In the following section the CFD results will be compared with both type of experimental results (LSI and PDI) to draw conclusions regarding the results of each method and the driving causes of the spray characteristics.
Figure 12. CFD results at z = 600 mm and α = 0°
Figure 13. CFD results at z = 600 mm and α = 45°
11 www.sprayconsultants.com
Experimental and Computational Study of a Spray at Multiple Injection Angles
RESULTS & DISCUSSION
Figure 14. CFD results at z = 600 mm and α = 90°
The comparison of experimental (LSI & PDI) and CFD results at z = 600 mm, for α = 0°, 45°, & 90°, demonstrates good agreement over the co-to-cross flow orientations. The comparisons are provided for Wall Wetting distance, Coverage Area, D32, and Axial Velocity.
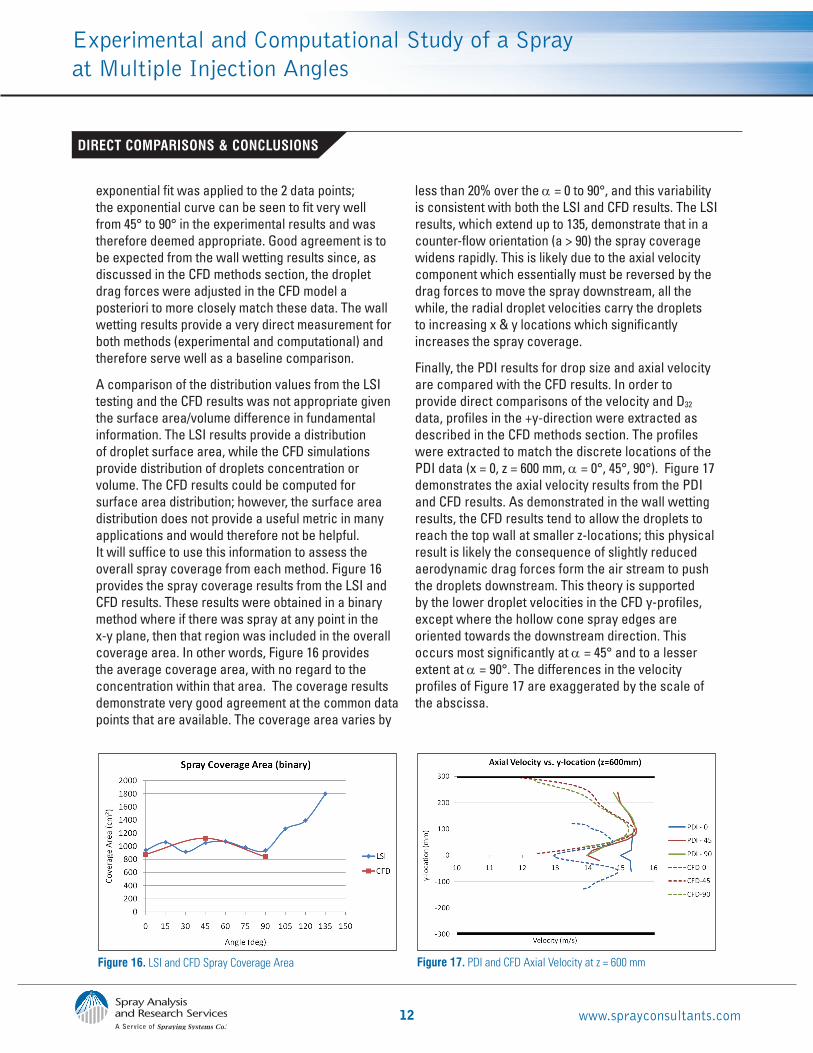
As a first-order check on the agreement of the droplet trajectories, the downstream wall wetting distance (on the upper wind tunnel surface) was measured both in the actual wind tunnel as well as in the CFD simulations. This downstream distance is plotted versus spray nozzle angle in Figure 15.
The wall wetting distance was determined experimentally, by measuring the z-location of the first droplets attached to the upper wind tunnel wall after a minimum of 10 minutes of spray time. These measurements were repeated over two days and agreement was within 5%. Wall wetting was observed for the 45° ≤ α ≤ 105° orientations as shown in Figure 15. Interestingly, the wall wetting distance began to increase as α>90°. This was not necessarily expected,
but does make sense as α = 90° represents the position where the nozzle is pointed directly at the upper wall. However, at the α = 90° orientation, neither edge of the hollow cone spray was directed vertically and therefore this results was not expected a priori.
Additionally, Figure 15 provides the wall wetting distance for the 45° and 90° CFD cases. In order to approximate the trend of the CFD results, an
DIRECT COMPARISONS & CONCLUSIONS
Figure 15. Top Wall (y = 300 mm) Downstream Wetting Distance
12 www.sprayconsultants.com
Experimental and Computational Study of a Spray at Multiple Injection Angles
exponential fit was applied to the 2 data points; the exponential curve can be seen to fit very well from 45° to 90° in the experimental results and was therefore deemed appropriate. Good agreement is to be expected from the wall wetting results since, as discussed in the CFD methods section, the droplet drag forces were adjusted in the CFD model a posteriori to more closely match these data. The wall wetting results provide a very direct measurement for both methods (experimental and computational) and therefore serve well as a baseline comparison.
A comparison of the distribution values from the LSI testing and the CFD results was not appropriate given the surface area/volume difference in fundamental information. The LSI results provide a distribution of droplet surface area, while the CFD simulations provide distribution of droplets concentration or volume. The CFD results could be computed for surface area distribution; however, the surface area distribution does not provide a useful metric in many applications and would therefore not be helpful. It will suffice to use this information to assess the overall spray coverage from each method. Figure 16 provides the spray coverage results from the LSI and CFD results. These results were obtained in a binary method where if there was spray at any point in the x-y plane, then that region was included in the overall coverage area. In other words, Figure 16 provides the average coverage area, with no regard to the concentration within that area. The coverage results demonstrate very good agreement at the common data points that are available. The coverage area varies by
less than 20% over the α = 0 to 90°, and this variability is consistent with both the LSI and CFD results. The LSI results, which extend up to 135, demonstrate that in a counter-flow orientation (a > 90) the spray coverage widens rapidly. This is likely due to the axial velocity component which essentially must be reversed by the drag forces to move the spray downstream, all the while, the radial droplet velocities carry the droplets to increasing x & y locations which significantly increases the spray coverage.
Finally, the PDI results for drop size and axial velocity are compared with the CFD results. In order to provide direct comparisons of the velocity and D32 data, profiles in the +y-direction were extracted as described in the CFD methods section. The profiles were extracted to match the discrete locations of the PDI data (x = 0, z = 600 mm, α = 0°, 45°, 90°). Figure 17 demonstrates the axial velocity results from the PDI and CFD results. As demonstrated in the wall wetting results, the CFD results tend to allow the droplets to reach the top wall at smaller z-locations; this physical result is likely the consequence of slightly reduced aerodynamic drag forces form the air stream to push the droplets downstream. This theory is supported by the lower droplet velocities in the CFD y-profiles, except where the hollow cone spray edges are oriented towards the downstream direction. This occurs most significantly at α = 45° and to a lesser extent at α = 90°. The differences in the velocity profiles of Figure 17 are exaggerated by the scale of the abscissa.
DIRECT COMPARISONS & CONCLUSIONS
Figure 17. PDI and CFD Axial Velocity at z = 600 mm
Figure 16. LSI and CFD Spray Coverage Area
13 www.sprayconsultants.com
Experimental and Computational Study of a Spray at Multiple Injection Angles
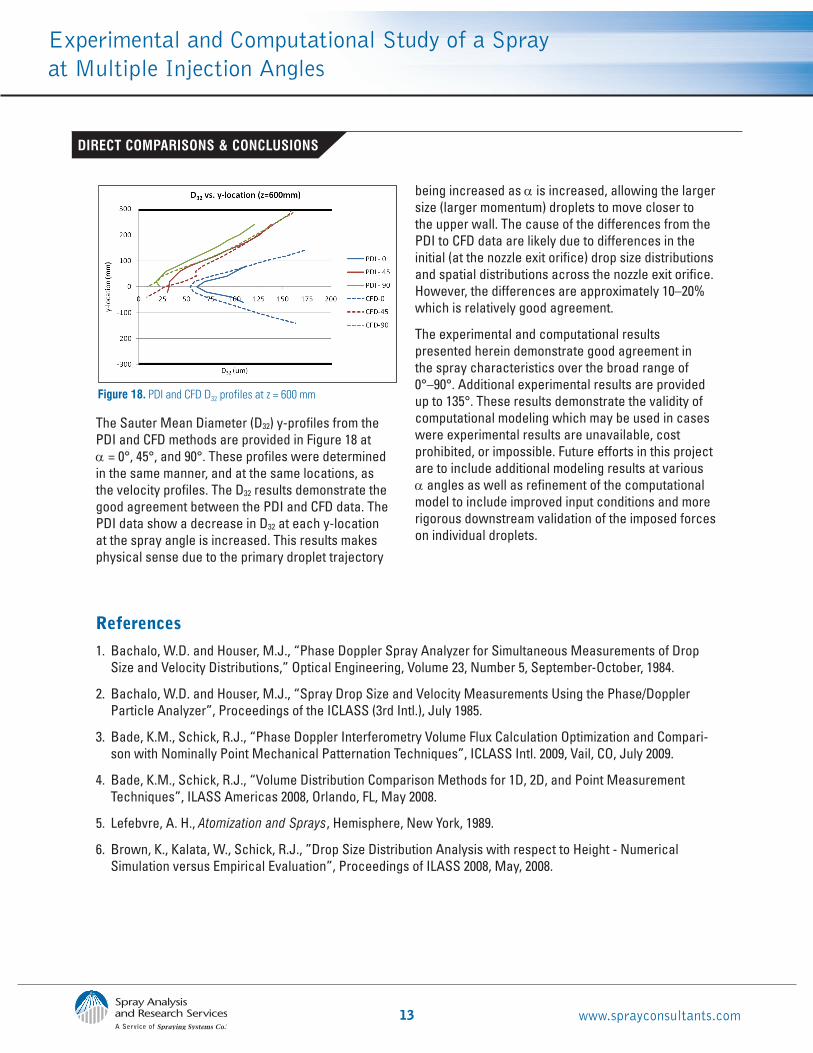
Figure 18. PDI and CFD D32 profiles at z = 600 mm
The Sauter Mean Diameter (D32) y-profiles from the PDI and CFD methods are provided in Figure 18 at α = 0°, 45°, and 90°. These profiles were determined in the same manner, and at the same locations, as the velocity profiles. The D32 results demonstrate the good agreement between the PDI and CFD data. The PDI data show a decrease in D32 at each y-location at the spray angle is increased. This results makes physical sense due to the primary droplet trajectory
being increased as α is increased, allowing the larger size (larger momentum) droplets to move closer to the upper wall. The cause of the differences from the PDI to CFD data are likely due to differences in the initial (at the nozzle exit orifice) drop size distributions and spatial distributions across the nozzle exit orifice. However, the differences are approximately 10–20% which is relatively good agreement.
The experimental and computational results presented herein demonstrate good agreement in the spray characteristics over the broad range of 0°–90°. Additional experimental results are provided up to 135°. These results demonstrate the validity of computational modeling which may be used in cases were experimental results are unavailable, cost prohibited, or impossible. Future efforts in this project are to include additional modeling results at various α angles as well as refinement of the computational model to include improved input conditions and more rigorous downstream validation of the imposed forces on individual droplets.
DIRECT COMPARISONS & CONCLUSIONS
References
1. Bachalo, W.D. and Houser, M.J., “Phase Doppler Spray Analyzer for Simultaneous Measurements of Drop Size and Velocity Distributions,” Optical Engineering, Volume 23, Number 5, September-October, 1984.
2. Bachalo, W.D. and Houser, M.J., “Spray Drop Size and Velocity Measurements Using the Phase/Doppler Particle Analyzer”, Proceedings of the ICLASS (3rd Intl.), July 1985.
3. Bade, K.M., Schick, R.J., “Phase Doppler Interferometry Volume Flux Calculation Optimization and Compari-son with Nominally Point Mechanical Patternation Techniques”, ICLASS Intl. 2009, Vail, CO, July 2009.
4. Bade, K.M., Schick, R.J., “Volume Distribution Comparison Methods for 1D, 2D, and Point Measurement Techniques”, ILASS Americas 2008, Orlando, FL, May 2008.
5. Lefebvre, A. H., Atomization and Sprays, Hemisphere, New York, 1989.
6. Brown, K., Kalata, W., Schick, R.J., ”Drop Size Distribution Analysis with respect to Height - Numerical Simulation versus Empirical Evaluation”, Proceedings of ILASS 2008, May, 2008.
14 www.sprayconsultants.com
Laser Sheet Imaging results from α = 0°–135°, Δ15°
Experimental and Computational Study of a Spray at Multiple Injection Angles
α = 0° α = 15° α = 30°
α = 45° α = 60° α = 75°
α = 90° α = 105° α = 120°
α = 135°