Embed Size (px)
Citation preview
1
Canadian Journal of Chemical Engineering 87 (1): 11-18, 2009
EXPERIMENTAL AND COMPUTATIONAL STUDY OF THE BED
DYNAMICS OF SEMI -CYLINDRICAL GAS - SOLID FLUIDIZED BED
A. Sahoo*, Ch. Ramesh and K. C. Biswal
Department of Chemical Engineering, National Institute of Technology, Rourkela-769008, Orissa, India.
ABSTRACT With computational fluid dynamics (CFD) it is possible to get a detailed view of the flow
behavior of the fluidized beds. A profound and fundamental understanding of bed
dynamics such as bed pressure drop, bed expansion ratio, bed fluctuation ratio and
minimum fluidization velocity of homogeneous binary mixtures has been made in a semi-
cylindrical fluidized column for gas solid systems, resulting in a predictive model for
fluidized beds. In the present work attempt has been made to study the effect of different
system parameters (viz. size and density of the bed materials and initial static bed height)
on the bed dynamics. The correlations for the bed expansion and bed fluctuations have
been developed on the basis of dimensional analysis using these system parameters.
Computational study has also been carried out using a commercial CFD package Fluent
(Fluent Inc.). A multifluid Eulerian model incorporating the kinetic theory for solid
particles was applied in order to simulate the gas–solid flow. CFD simulated bed pressure
drop has been compared with the experimental bed pressure drops under different
conditions for which the results show good agreements.
KEY WORDS
Computational Fluid Dynamics, multi-fluid Eulerian model, semi-cylindrical bed, gas-
solid fluidization and bed dynamics
2
---------------------------------------------------------------------------------------------------------------------* Corresponding author: Tel. +91-661-2462258(O), 2463258 ( R), Fax: +91-6612472926 E-Mail: [email protected]
INTRODUCTION
A very large part of the processes in the chemical processes industries concern gas solid
flows. In order to obtain well operating gas solid contactors a through understanding of
flow phenomena of gas solid flow is vital. A good qualitative understanding and an
accurate quantitative description of fluid flow is necessary for the modeling of these
devices. Accurate modeling of these fluidized beds is complicated. Despite their
widespread application, much of the development and design of fluidized bed reactors
has been complex empirical as the flow behavior of gas–solid flow in these systems
makes flow modeling a challenging task.
The fundamental problem encountered in modeling hydrodynamics of a gas–solid
fluidized bed is the motion of two phases where the interface is unknown and transient,
and the interaction is understood only for a limited range of conditions (Gilbertson and
Yates, 1996). With the advent of increased computational capabilities computational fluid
dynamics, CFD is emerging as a very promising new tool in modeling hydrodynamics.
While it is now a standard tool for single-phase flows, it is at the development stage for
multiphase systems, such as fluidized beds. Work is required to make CFD suitable for
fluidized bed reactor modeling and scale-up. CFD also holds great promise for
multiphase flows, obtaining accurate solutions is much more challenging, not just
because each of the phases must be treated separately, but, in addition, a number of new
and difficult factors (such as drag, lift and inter particle phases etc.) come into play.
LITERATURE
A discrete particle model of a gas-fluidised bed has been developed by Hoomans et al.
(1996). The two-dimensional motion of the individual, spherical particles was directly
calculated from the forces acting on them, accounting for the interaction between the
particles and the interstitial gas phase. Gera et al. (1998) have compared Lagrangian
model and multifluid or Eulerian-Eulerian model in applying CFD modeling to gas-solid
fluidized beds. They have also modeled the particle collisions by the hard sphere
3
approach and soft sphere approach was used by Kobayashi et al. (2000). Kaneko et al.
(1999) have examined the multi body collisions by the Discrete Element Method (DEM).
Though the models based on a DEM allow the effects of various particle properties on
the motion of fluid to be studied, it is computationally intensive. Due to these
computational limitations, the Eulerian-Lagrangian model is normally limited to a
relatively small numbers of particles. Therefore, the multifluid model is the preferred
choice for simulating macroscopic hydrodynamics in Eulerian-Eulerian continuum
modeling with the fluid and solid phases treated as interpenetrating continuum phases and
it is the most commonly used approach for fluidized bed simulations (Pain et al., 2001).
They have used certain averaging techniques and assumptions as required to obtain a
momentum balance for the solids phase.
The drag force on a single sphere in a fluid has been well studied and empirically
correlated (Clift et al., 1978 and Bird et al., 2002) for a wide range of particle Reynolds
numbers. However, when a single particle moves in a dispersed two-phase mixture, the
drag is affected by the presence of other particles. In the present study, calculation of the
momentum exchange coefficient for the gas–solid systems has been done using Syamlal
and O’ Brien (1989) drag function. The solid-phase momentum equation contains an
additional term to account for momentum exchange due to particle collisions. The
absence of the stress term of the particle phase in the particulate momentum equation has
led to different models adopting different closure methods, including the kinetic theory
model (Sinclair and Jackson, 1989; Gidaspow, 1994; Hrenya and Sinclair, 1997). In
granular flow, particle velocity fluctuations about the mean are assumed to result in
collisions between particles being swept along together by the mean flow.
Numerous studies have shown the capability of the kinetic theory approach for modeling
bubbling fluidized beds (e.g. Pain et al., 2001; Sinclair and Jackson, 1989; Hrenya and
Sinclair, 1997; Ding and Gidaspow, 1990; Gelderbloom et al., 2003).
The kinetic theory model clearly explains why fluidized beds are such good heat transfer
devices. Their thermal conductivity, k can be expressed in terms of mean free path, l , the
average of fluctuating velocity, v which is essentially the square root of the granular
temperature and the density and the specific heat of particles as follows.
k = l v rCp
4
where r=density and Cp =heat capacity of particles.
The mean free path, l is essentially the particle diameter divided by the solids volume
fraction. For dense systems it is of the order of particle diameter. For dilute conditions it
will approach the size of equipment. The kinetic theory model has the potential to explain
why fluidized beds are such good contacting devices.
Jenkins and Savage (1983) utilized the coefficient of restitution (between 1 and 0, for
fully elastic collisions and for fully inelastic collisions respectively) to account for the
loss of energy due to collision of particles, which is not considered in the classical kinetic
theory. The energy dissipated as a result of collisions of granular inelastic particles has
been used by Lun et al. (1984) to obtain the ratio of the velocity fluctuations to the mean
flow as a function of the coefficient of restitution. A decrease in the coefficient of
restitution results in less elastic collisions generating more fluctuating kinetic energy
(Goldschmidt et al., 2001). In dense two-phase flows, the particle interaction time may be
much larger than the particle mean free flight time. Thus, the assumption that a pair of
particles completes its interaction before interacting with another particle may be invalid
as the solids concentration increases (Zhang and Rauenzahn, 2000).
Despite the modeling challenges, application of CFD to model fluidized bed
hydrodynamics continues to develop, as it has many advantages including design,
optimization and scale-up of such systems. Some of the correlations used in the models,
however, remain to be empirical or semi empirical. As a result, the model and its
parameters must be validated against experimental measurements obtained at similar
scale and configurations. Some of the challenges with respect to CFD model validation
for gas–solid systems have been reviewed by Grace and Taghipour (2004).
Computational Fluid Dynamics (CFD) modeling
CFD applications to a number of unit operations and processes in the chemical process
industries, oil and gas industry are increased in drastic rate in the past decade [H.S.
Pordal et al, 2001, T.J. Fry et al 2001 and C. J. Matice et al 1997, 2001].
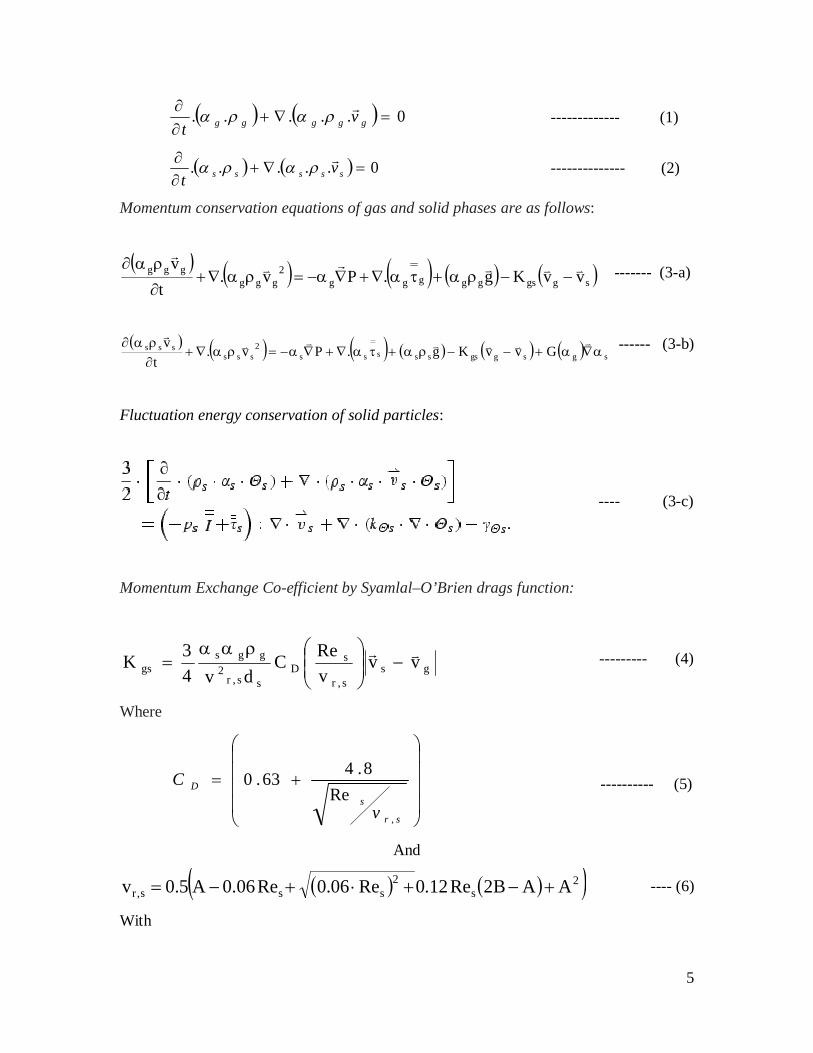
The governing equations for the present study can be summarized as follows:
Mass conservation equations of gas (g) and solid (s) phases:
5
0.....
ggggg vt
------------- (1)
0.....
sssss vt
-------------- (2)
Momentum conservation equations of gas and solid phases are as follows:
sggsggggg2
gggggg vvKg.Pv.
tv
------- (3-a)
sgsggssssss
2sss
sss GvvKg.Pv.t
v
------ (3-b)
Fluctuation energy conservation of solid particles:
---- (3-c)
Momentum Exchange Co-efficient by Syamlal–O’Brien drags function:
gss,r
sD
ss,r2
ggsgs vv
vReC
dv43K
--------- (4)
Where
sr
sD
v
C
,
Re8.463.0 ---------- (5)
And
2s
2sss,r AAB2Re12.0Re06.0Re06.0A5.0v ---- (6)
With
6
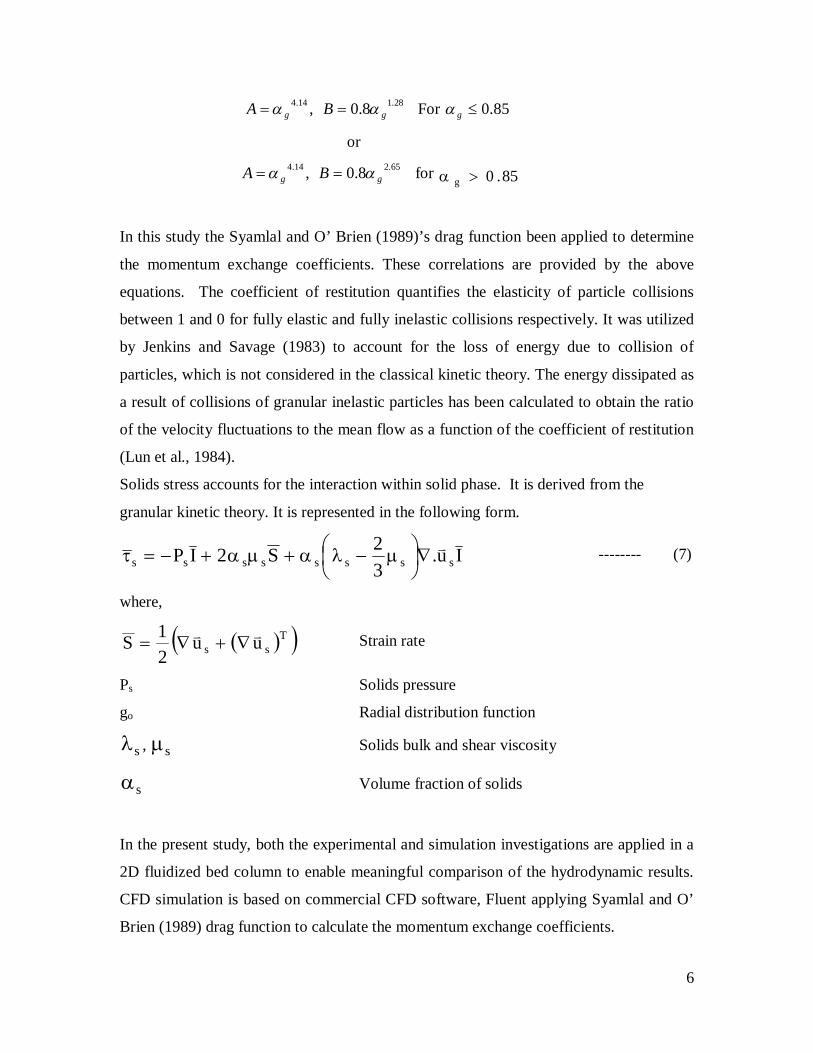
,14.4gA 28.18.0 gB For 85.0g
or
,14.4gA 65.28.0 gB for 85.0g
In this study the Syamlal and O’ Brien (1989)’s drag function been applied to determine
the momentum exchange coefficients. These correlations are provided by the above
equations. The coefficient of restitution quantifies the elasticity of particle collisions
between 1 and 0 for fully elastic and fully inelastic collisions respectively. It was utilized
by Jenkins and Savage (1983) to account for the loss of energy due to collision of
particles, which is not considered in the classical kinetic theory. The energy dissipated as
a result of collisions of granular inelastic particles has been calculated to obtain the ratio
of the velocity fluctuations to the mean flow as a function of the coefficient of restitution
(Lun et al., 1984).
Solids stress accounts for the interaction within solid phase. It is derived from the
granular kinetic theory. It is represented in the following form.
Iu.32S2IP ssssssss
-------- (7)
where,
Tss uu
21S Strain rate
Ps Solids pressure
go Radial distribution function
s , s Solids bulk and shear viscosity
s Volume fraction of solids
In the present study, both the experimental and simulation investigations are applied in a
2D fluidized bed column to enable meaningful comparison of the hydrodynamic results.
CFD simulation is based on commercial CFD software, Fluent applying Syamlal and O’
Brien (1989) drag function to calculate the momentum exchange coefficients.
7
EXPERIMENTAL SECTION
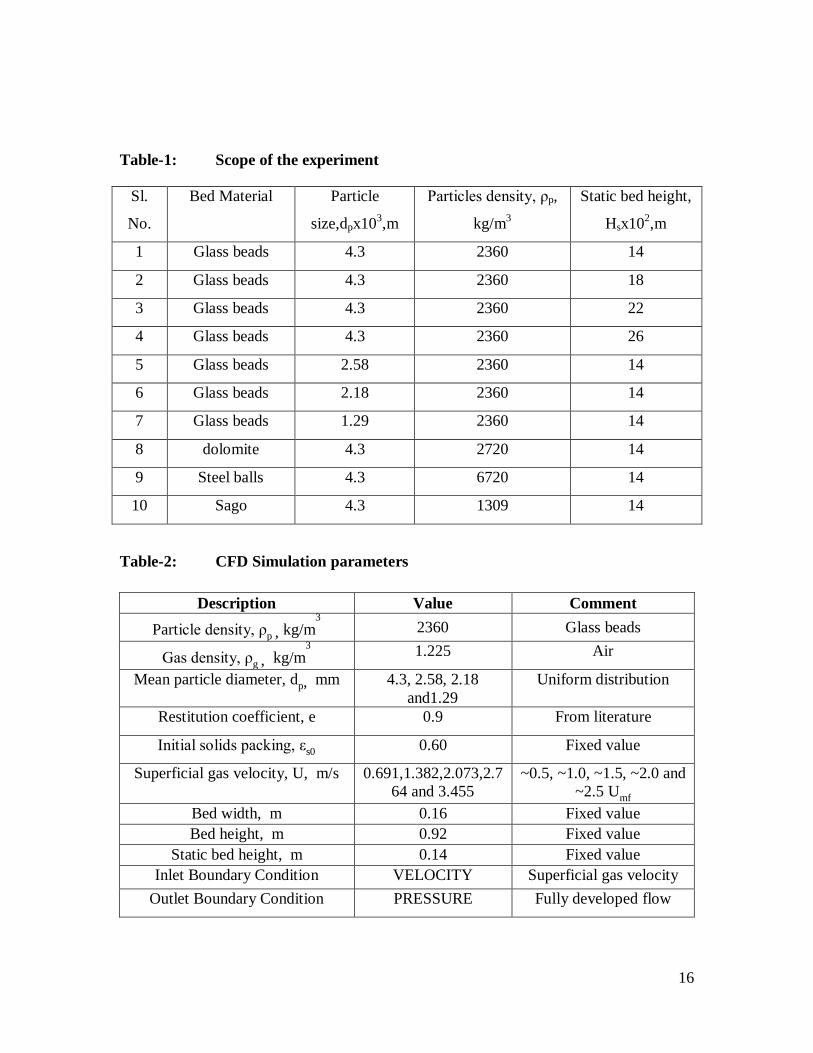
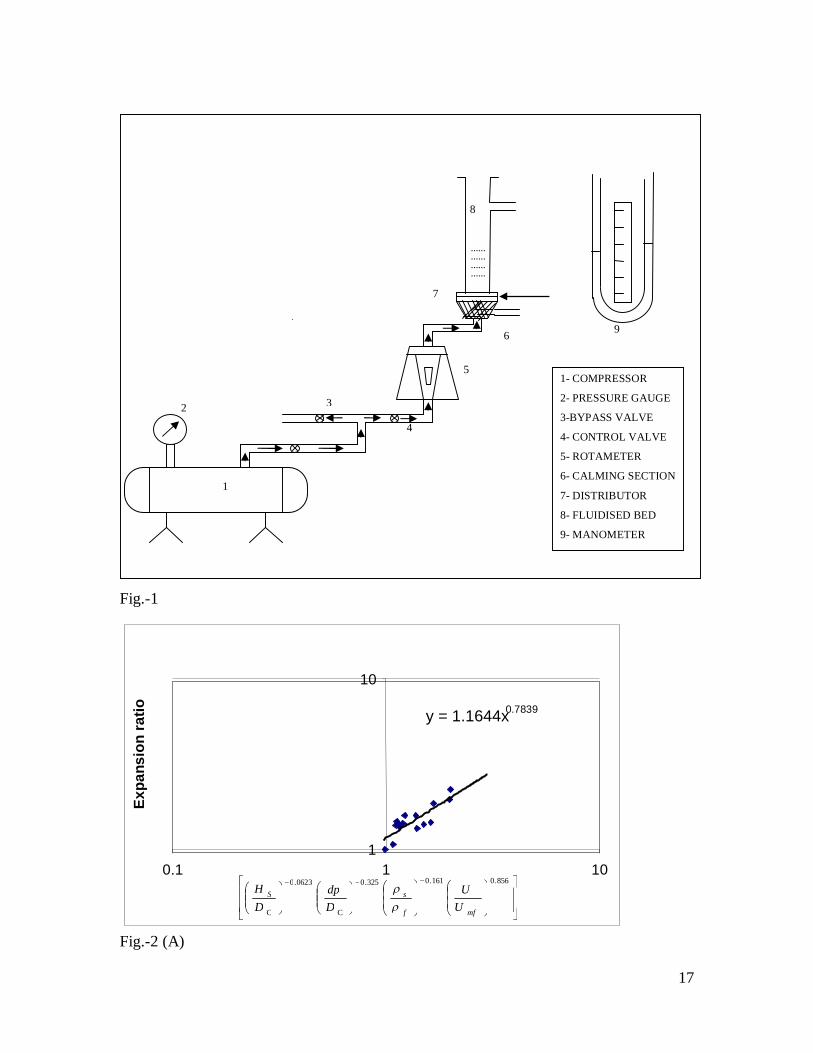
A schematic diagram of the experimental set up is shown in the Fig.-1. The experiment
has been conducted in a Semi-cylindrical Perspex column of 16cm internal diameter,
90cm in height and 1cm thick. The pressure drop across the fluidized bed is measured by
the manometer using carbon tetrachloride as the manometric liquid. A calming section is
provided below the distributor plate for the uniform distribution of the air. The
experiment has been carried out to study the effect of different system parameters on the
bed hydrodynamics. Scope of the experiment has been presented in Table-1. The bed
materials were fluidized by controlling the air flow rate through the rotameter. The bed
dynamics viz. bed expansion ratio, bed fluctuation ratio and bed pressure drops were
measured at different superficial velocities (calculated through the flow rate of air) for
different operating conditions i.e. by varying different system parameters.
The simulation of fluidized bed was performed by solving the governing equations of
mass, momentum and energy conservation [Anderson, j. D., 1995] using Fluent 6.1.22,
CFD software (Fluent, 2003). A multifluid Eulerian model, which considers the
conservation of mass and momentum for the gas and fluid phases, was applied. The
kinetic theory of granular flow which considers the conservation of solid fluctuation
energy was used for closure of the solids stress terms. The restitution coefficient is
considered as 0.9 here from the literature. Considered simulation parameters for glass
beads are shown in Table-2.
RESULTS AND DISCUSSION
The governing equations were solved using the finite volume approach. The 2D
computational domain was discretized by 13200 quadrilateral cells. A time step of 0.001s
with 20 iterations per time step was chosen. This iteration was adequate to achieve
convergence for the majority of time steps. First-order discretization schemes for the
convection terms are used. The relative error between two successive iterations was
specified by using a convergence criterion of 10-3 for each scaled residual component.
Sensitivity analysis was performed through a case study for investigating the effect of
8
time step, discretization schemes and convergence criterion on the final modeling results.
The phase-coupled SIMPLE (PC-SIMPLE) algorithm (Vasquez and Ivanov, 2000),
which is an extension of the SIMPLE algorithm to multiphase flows, is applied for the
pressure-velocity coupling. In this algorithm, the coupling terms are treated implicitly
and form part of the solution matrix. The pressure-velocity coupling is based on total
volume continuity and the effects of the interfacial coupling terms are fully incorporated
into the pressure correction equation.
Singh, R. (1997) has explained the advantages of non-cylindrical conduits by carrying out
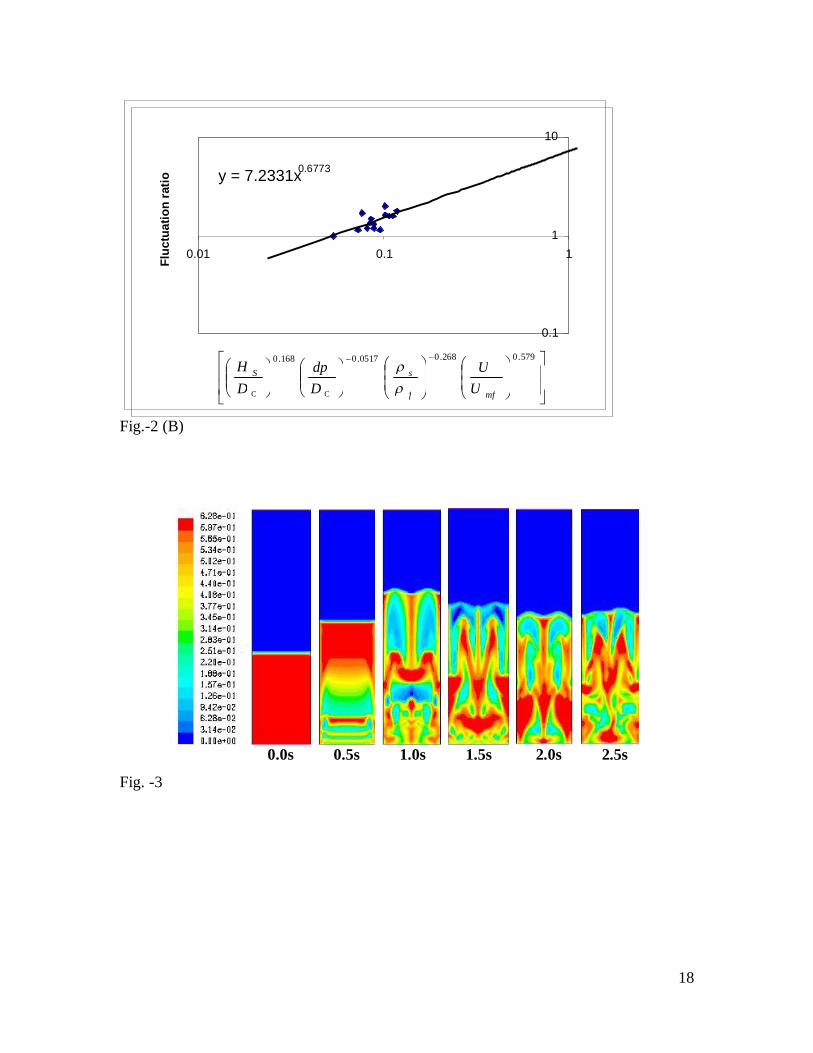
thorough experimentation on hydrodynamic studies of the fluidized beds. The correlations have been developed on the basis of dimensional analysis for the
bed expansion ratio and fluctuation ratio [Kunii and Levenspiel,1991] by correlating
different system parameters with the experimentally observed expansion and fluctuation
ratios respectively. These correlation plots have been shown in Fig-2 (A) and (B).
Bed expansion ratio, R:
856.0
mf
161.0
f
s325.0
C
0623.0
C
S
UU
Ddp
DH164.1R ------- (8)
Bed fluctuation ratio, r:
579.0
mf
268.0
f
s0517.0
C
168.0
C
S
UU
Ddp
DH233.7r --------- (9)
Experimental analyses were performed to identify the steady state pressure drop, ∆P, bed
expansion ratio, Hmax/HS and bed fluctuation ratio, Havg/HS at different superficial
velocities. The voidage, ε, i.e., the gas phase volume fraction in a fluidized bed, can be
determined using pressure drop across the bed (Y. Tsuji et al, 1993). The overall pressure
drop, the bed expansion ratio, bed fluctuation ratio and the voidage were 1955 Pa, 1.18,
1.6 and 0.6, respectively at minimum fluidization velocity (Umf =1.382 m/s, Hs = 14 cms)
for glass beads. These values were compared with those predicted by CFD simulation
under different superficial gas velocities. The CFD simulations were performed using the
transient Eulerian-Granular model in Fluent software. Various superficial gas velocities,
some multiples of Umf, were examined in order to cover a range of velocities under and
above Umf. Fig-3 shows a contour plot of solids fraction of a typical result using the
9
Syamlal-O’Brien drag model. At time 0.0 s, the bed was fluidized at U=1.382 m/s, a
superficial gas velocity of ~1.5 Umf. Initially, the bed height increased with bubble
formation until it settled to a steady-state bed height. In Fig-3, a comparison of the time-
averaged bed pressure drop, using Syamlal-O’Brien drag function against superficial gas
velocity is plotted. Good agreement has been observed between the simulation and
experimental results at velocities higher than Umf.
The model predictions, however, do not show close agreement with experiments at
velocities under Umf. This may be attributed to the solids not being fluidized, thus being
dominated by inter particle frictional forces, which could not be predicted by the
approach taken by the multi-fluid model for simulating gas-solid phases. The correlations
developed by the dimensional analysis for expansion and fluctuation ratios for the
fluidized beds are in well agreement with experimental results. Standard and mean
deviations between the experimental (Rexp / rexp) and calculated (Rcal / rcal) values have
been found to be 11.5 & 0.06% and 13.67 & 0.96% for bed expansion and fluctuation
ratios respectively. A sample plot of the simulated solids volume fractions of the 2D bed
has been shown in Fig.-3 for glass beads of size 4.3mm with a static bed height of 14cms
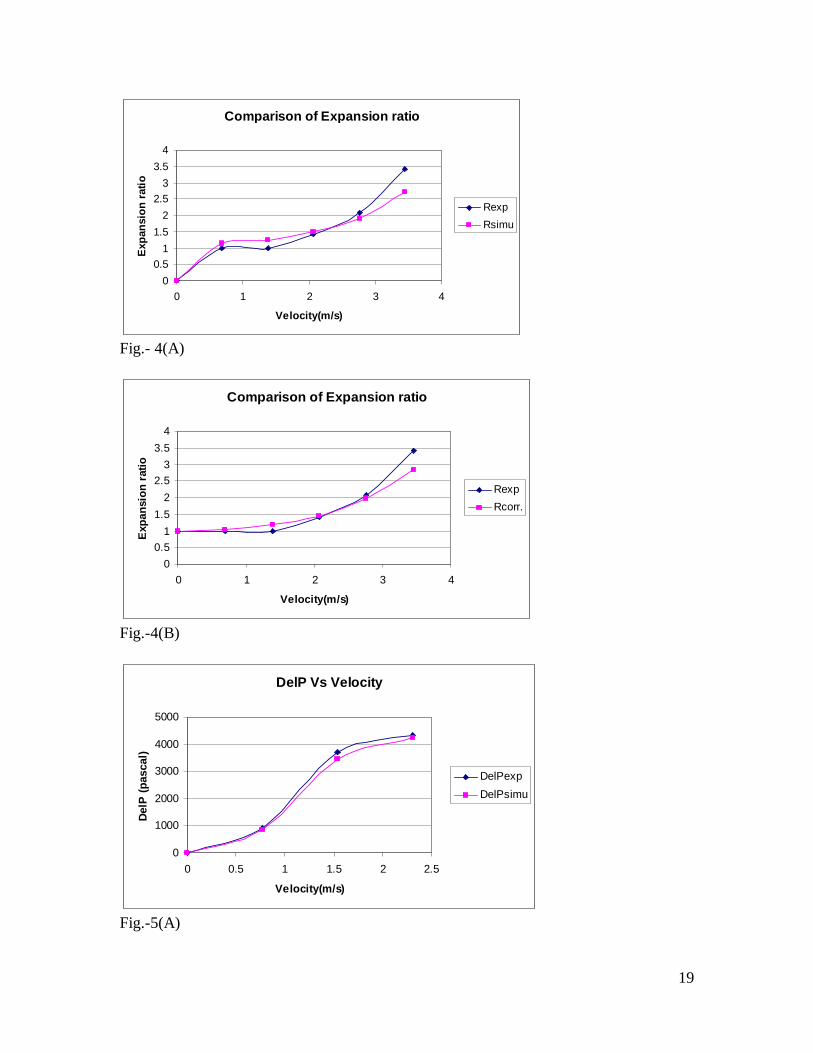
at different times. Fig. - 4 (A) and (B) show the comparison of the experimental
expansion ratio with CFD simulated and correlated expansion ratio respectively. Pressure
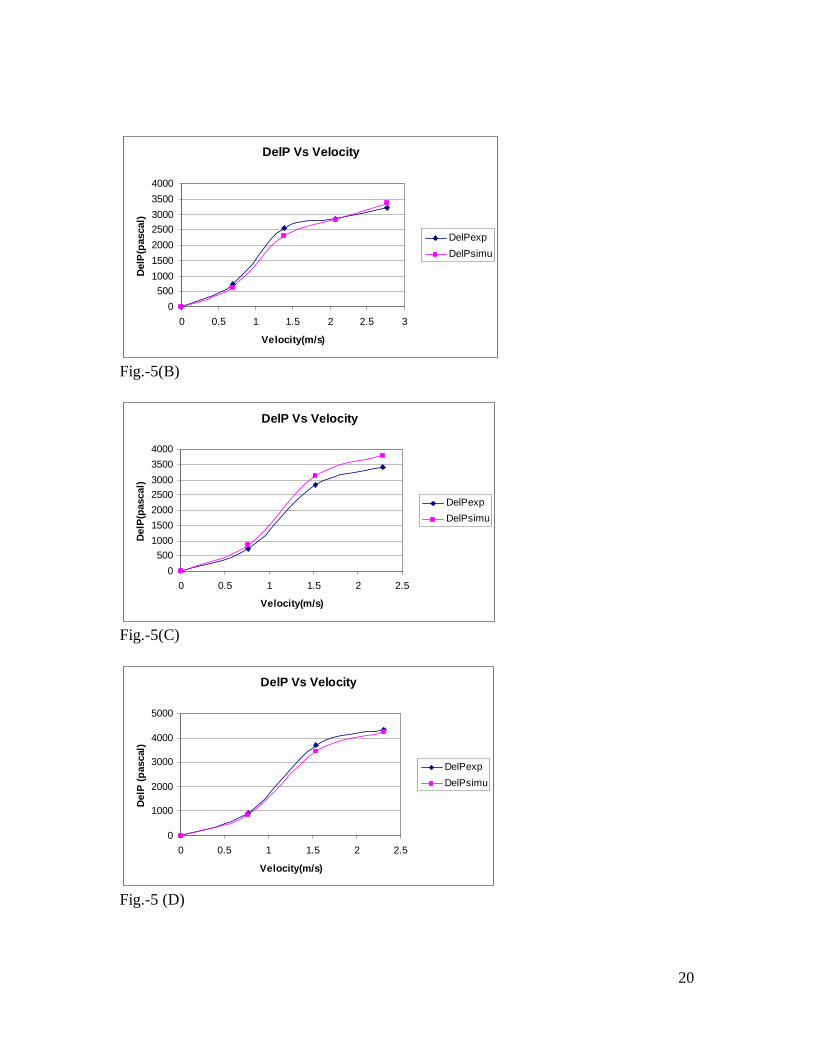
drop of the bed has been studied by considering different superficial velocities, both
above and under the minimum fluidization velocity. Fig- 5(A) to (D) show the
comparisons between the experimental and simulated pressure drops plotted against
superficial velocities for different initial static bed heights (viz.14, 18, 22 and 26 cms) for
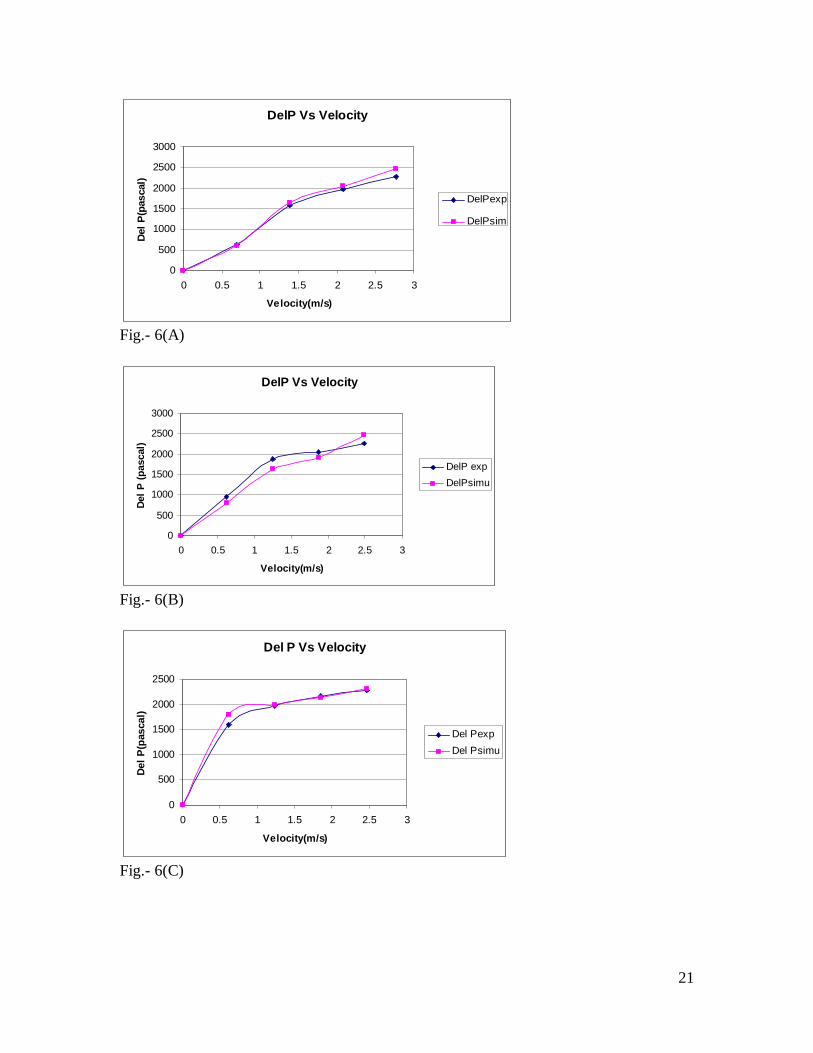
a particular size (4.3mm) of glass beads . Fig- 6 (A), (B), and (C) show the comparisons
between the experimental and simulated pressure drops for the glass beads of a given
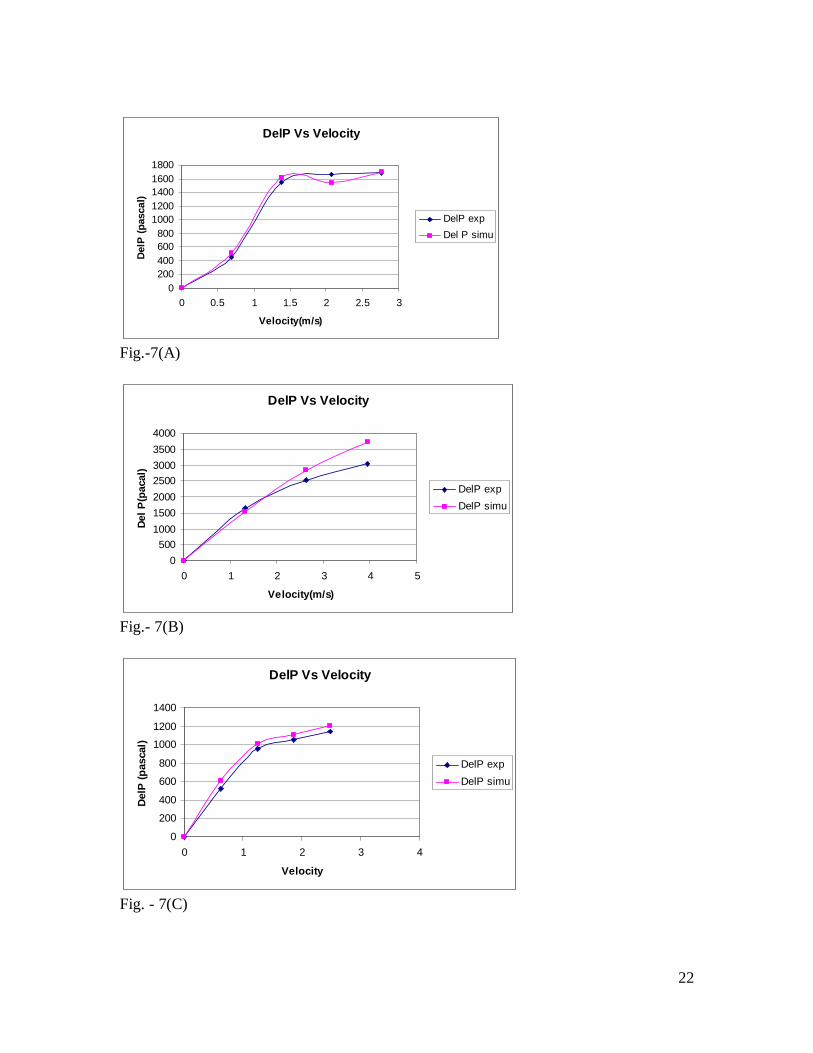
static bed height (14cms) for different particle sizes. Fig- 7 (A), (B) and (C) show the
comparisons between the experimental and simulated pressure drops for materials of
different densities.
From the developed correlations, based on dimensional analysis it is found that the bed
expansion ratio increases with increase in velocity ratio (U/Umf), but decreases with the
increase in density ratio(s/f), size ratio (dp/Dc) and bed aspect ratios. Whereas the bed
fluctuation ratio was found to increase with the increase in velocity ratio and bed aspect
10
ratio and the same was observed to decrease with the increase in density ratio(s/f) and
size ratio (dp/Dc). Therefore it is better to maintain lower values of velocity ratio, density
ratio and size ratio for optimum bed dynamics.
CONCLUSIONS
Experimental work has been carried out to study the hydrodynamics of a semi-cylindrical
gas-solid fluidized bed. The effects of various system parameters (viz., static bed height,
flow rate of fluid, particle size, and the density of the particles) on the bed dynamics
(such as minimum fluidization velocity, bed pressure drop, bed expansion ratio and the
bed fluctuation ratio) were studied. Experimental results were correlated by dimensional
analysis approach and compared by the computational approach.
It has been observed that the minimum fluidization velocity increases with increase in
particle size and particle density. It was also observed that it is not a function of the static
bed height. The calculated values of the bed expansion/fluctuation ratios obtained from
the developed correlations show good agreement with the experimental values over wide
ranges of parameters.
Flow behavior is studied computationally using a commercial CFD package FLUENT
6.1. In the experimental setup a gas is fed through a small diameter inlet to the bottom of
the calming section, where as in the CFD simulation a flat velocity profile is defined at
the bottom of the calming section. But it has been proved by some authors that the error
in considering this assumption is negligible (F. Taghipour et al., 2005). A multifluid
Eulerian model integrating the kinetic theory for solid particles using Fluent CFD
software was capable of predicting the gas–solid behavior of a fluidized bed.
Comparison of the model predictions, using the Syamlal–O’Brien drag function and
experimental measurements on the time-average bed pressure drop, velocity profile, bed
expansion, and qualitative gas–solid flow pattern indicated reasonable agreement for
most operating conditions thereby ensuring the wide scope of the semi-cylindrical
fluidized bed in various industries over wide range of parameters.
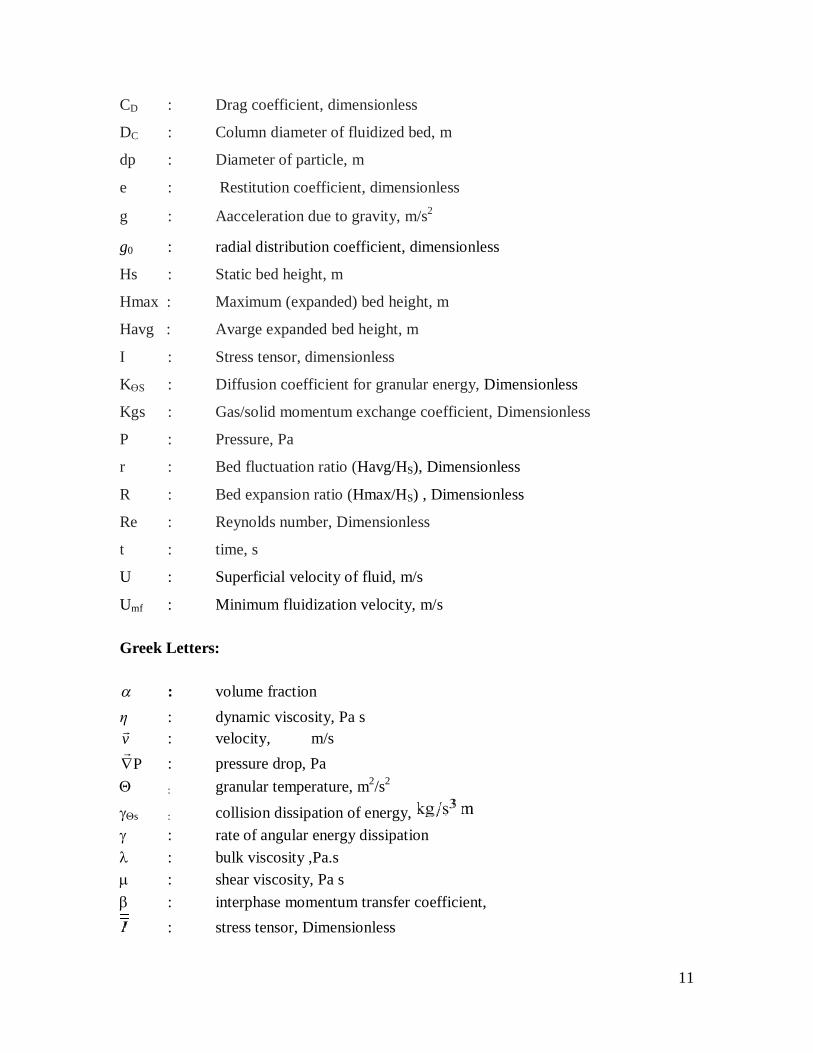
NOMENCLATURE
11
CD : Drag coefficient, dimensionless
DC : Column diameter of fluidized bed, m
dp : Diameter of particle, m
e : Restitution coefficient, dimensionless
g : Aacceleration due to gravity, m/s2
g0 : radial distribution coefficient, dimensionless
Hs : Static bed height, m
Hmax : Maximum (expanded) bed height, m
Havg : Avarge expanded bed height, m
I : Stress tensor, dimensionless
KӨS : Diffusion coefficient for granular energy, Dimensionless
Kgs : Gas/solid momentum exchange coefficient, Dimensionless
P : Pressure, Pa
r : Bed fluctuation ratio (Havg/HS), Dimensionless
R : Bed expansion ratio (Hmax/HS) , Dimensionless
Re : Reynolds number, Dimensionless
t : time, s
U : Superficial velocity of fluid, m/s
Umf : Minimum fluidization velocity, m/s
Greek Letters:
: volume fraction η : dynamic viscosity, Pa s v : velocity, m/s
P
: pressure drop, Pa : granular temperature, m2/s2 s : collision dissipation of energy,
: rate of angular energy dissipation : bulk viscosity ,Pa.s : shear viscosity, Pa s : interphase momentum transfer coefficient,
: stress tensor, Dimensionless
12
: stress tensor, Pa
Subscripts:
g : for gas s : f or solid avg. : for average max. : for maximum exp : for experimental values sim : for CFD simulated values
REFERENCES
1. Bird, R.B., W.E. Stewart and E.N. Lightfoot, Transport Phenomena (second ed),
Wiley, New York (2002).
2. Clift, R., M. E. Weber and J.R. Grace, Bubbles, Drops, and Particles, Academic
Press, New York (1978).
3. Ding, J. and D. Gidaspow, A bubbling fluidization model using kinetic theory of
granular flow, A.I.Ch.E. Journal 36, 523–538 (1990).
4. Fry., T.J., CFD aids in the development of novel spray drying technology,
Powders and bulk magazine, (2001).
5. Gelderbloom, S.J., D. Gidaspow and R.W. Lyczkowski, CFD simulations of
bubbling/collapsing fluidized beds for three Geldart groups, A.I.Ch.E. Journal 49,
844–858 (2003).
6. Gera, D., M. Gautam, Y. Tsuji, T. Kawaguchi and T. Tanaka, Computer
simulation of bubbles in large-particle fluidized beds, Powder Technology 98,
38–47 (1998).
7. Gidaspow, D., Multiphase Flow and Fluidization: Continuum and Kinetic Theory
Descriptions, Academic Press, San Diego (1994).
8. Gilbertson M. A. and J.G. Yates, The motion of particles near a bubble in a gas-
fluidized bed, Journal of Fluid Mechanics 323, 377–385 (1996).
9. Goldschmidt, M. J. V., J.A.M. Kuipers and W.P.M. van Swaaij, Hydrodynamic
modelling of dense gas-fluidised beds using the kinetic theory of granular flow:
13
effect of coefficient of restitution on bed dynamics, Chemical Engineering
Science 56, 571–578 (2001).
10. Grace, J.R. and F. Taghipour, Verification and validation of CFD models and
dynamic similarity for fluidized beds, Powder Technology 139, 99–110 (2004).
11. Hrenya, C.M. and J.L. Sinclair, Effects of particle–phase turbulence in gas–solid
flows, A.I.Ch.E. Journal 43, 853–869 (1997).
12. Hoomans, B. P. B., J. A. M. Kuipers, W. J. Briels and W. P. M. van Swaaij,
Discrete particle simulation of bubble and slug formation in a two-dimensional
gas-fluidised bed: A hard-sphere approach, Journal of Chemical Engineering
Science, 51, 99-118 (1996).
13. Jenkins, J. T. and S.B. Savage, A theory for the rapid flow of identical, smooth,
nearly elastic, spherical particles, Journal of Fluid Mechanics 130,187–202
(1983).
14. Kaneko, Y., T. Shiojima and M. Horio, DEM simulation of fluidized beds for gas-
phase olefin polymerization, Chemical Engineering Science 54, 5809–5821
(1999).
15. Kobayashi, N., R. Yamazaki and S. Mori, A study on the behavior of bubbles and
solids in bubbling fluidized beds, Powder Technology 113, 327–344 (2000).
16. Lun, C. K. K., S.B. Savage, D.J. Jeffrey and N. Chepurniy, Kinetic theories for
granular flow: inelastic particles in Couette flow and slightly inelastic particles in
a general flow field, Journal of Fluid Mechanics 140, 223–256 (1984).
17. M. Syamlal, W. Rogers, and T.J. O'Brien. MFIX documentation, Theory Guide,
U. S. Dept. of Energy, Office of Fossil Energy, Tech. Note. (1993).
18. Matice., C.J., High speed filling of plastic containers. SME, November 1997
19. Matice, C. J., H.S. Pordal., Design of venturi mixers, Flow control
magazine,November (2001).
20. Pain, C.C., S. Mansoorzadeh and C.R.E. de Oliveira, A study of bubbling and
slugging fluidised beds using the two-fluid granular temperature model,
International Journal of Multiphase Flow 27, 527–551 (2001).
21. Pordal, H.S., C.J. Matice, T.J. Fry, Using CFD models to simulate multiphase
flow, Chemical processing, November (2001).
14
22. Sinclair, J.L., and R. Jackson, Gas–particle flows in a vertical pipe with particle –
particle interactions, A.I.Ch.E. Journal 35, 1473–1486 (1989).
23. Singh, R. K., “Studies on certain aspects of gas-solid fluidization in non-
cylindrical conduits”, Ph. D. Thesis, Sambalpur University, INDIA. (1997).
24. Syamlal, M. and T. J. O’Brien, Computer simulation of bubbles in a fluidized
bed, A.I.Ch.E. Symposium Series 85, 22–31 (1989).
25. Taghipour, F., N. Ellis, C. wong, “experimental and computational study of gas-
solid fluidized bed”, Chemical Engg. Science, 60, 6857-6867 (2005).
26. Tsuji, Y., T. Kawaguchi, and T. Tanaka, “Discrete particle simulation of two-dimensional fluidized bed,” Powder Technol., 77, 79 (1993).
27. Zhang, D.Z. and R. M. Rauenzahn, Stress relaxation in dense and slow granular
flows, Journal of Rheology 44, 019–1041 (2000).
Text books:
1. Anderson, John. D. “Computational fluid dynamics: basics with applications”,
Mc.Graw- Hill, 1995.
2. Kunii, D. and O. Levenspiel, 1991. “Fluidization Engineering”, second ed.
Butterworth-Heinemann, London.
3. Fluent, 2002. Fluent 6.0 User’s Guide, 20.4 Eulerian Model. Fluent Inc.
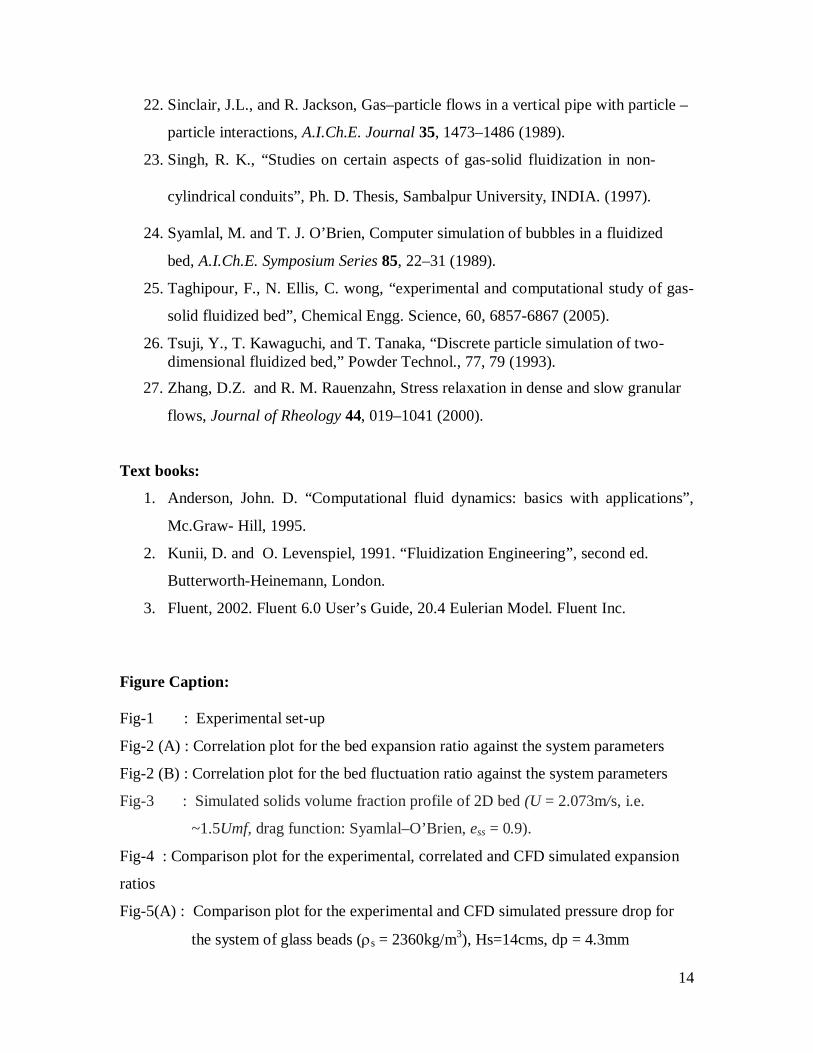
Figure Caption: Fig-1 : Experimental set-up
Fig-2 (A) : Correlation plot for the bed expansion ratio against the system parameters
Fig-2 (B) : Correlation plot for the bed fluctuation ratio against the system parameters
Fig-3 : Simulated solids volume fraction profile of 2D bed (U = 2.073m/s, i.e.
~1.5Umf, drag function: Syamlal–O’Brien, ess = 0.9).
Fig-4 : Comparison plot for the experimental, correlated and CFD simulated expansion
ratios
Fig-5(A) : Comparison plot for the experimental and CFD simulated pressure drop for
the system of glass beads (s = 2360kg/m3), Hs=14cms, dp = 4.3mm
15
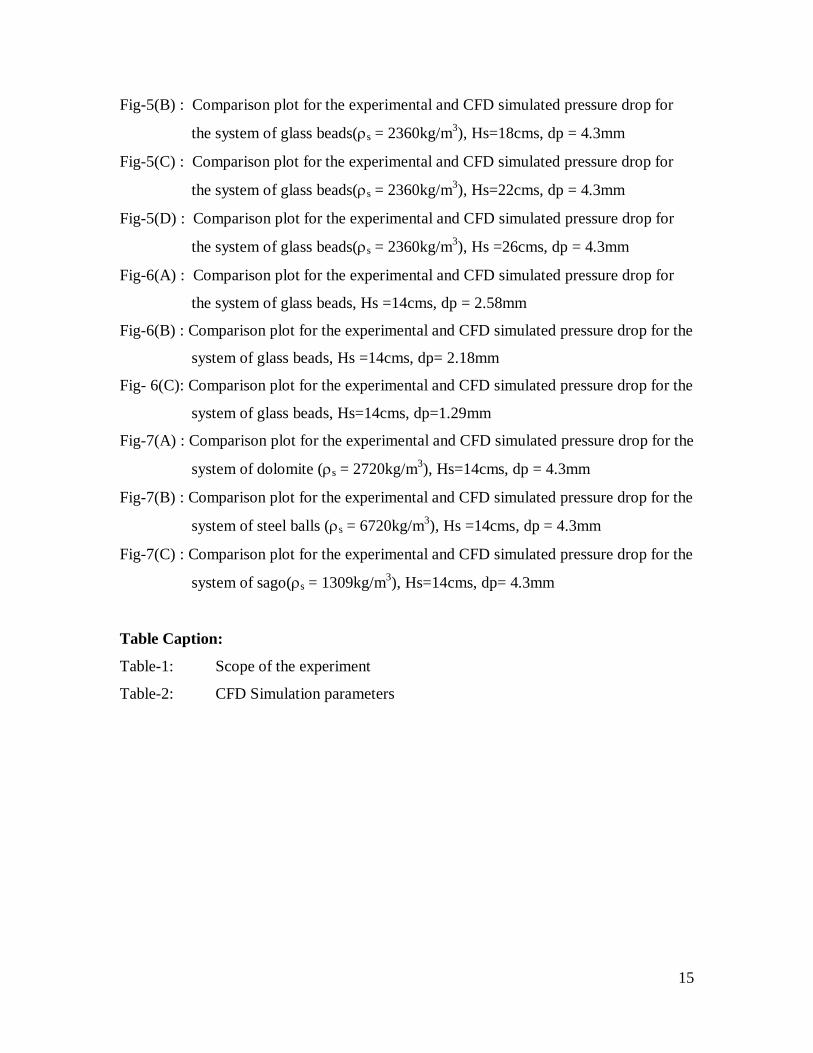
Fig-5(B) : Comparison plot for the experimental and CFD simulated pressure drop for
the system of glass beads(s = 2360kg/m3), Hs=18cms, dp = 4.3mm
Fig-5(C) : Comparison plot for the experimental and CFD simulated pressure drop for
the system of glass beads(s = 2360kg/m3), Hs=22cms, dp = 4.3mm
Fig-5(D) : Comparison plot for the experimental and CFD simulated pressure drop for
the system of glass beads(s = 2360kg/m3), Hs =26cms, dp = 4.3mm
Fig-6(A) : Comparison plot for the experimental and CFD simulated pressure drop for
the system of glass beads, Hs =14cms, dp = 2.58mm
Fig-6(B) : Comparison plot for the experimental and CFD simulated pressure drop for the
system of glass beads, Hs =14cms, dp= 2.18mm
Fig- 6(C): Comparison plot for the experimental and CFD simulated pressure drop for the
system of glass beads, Hs=14cms, dp=1.29mm
Fig-7(A) : Comparison plot for the experimental and CFD simulated pressure drop for the
system of dolomite (s = 2720kg/m3), Hs=14cms, dp = 4.3mm
Fig-7(B) : Comparison plot for the experimental and CFD simulated pressure drop for the
system of steel balls (s = 6720kg/m3), Hs =14cms, dp = 4.3mm
Fig-7(C) : Comparison plot for the experimental and CFD simulated pressure drop for the
system of sago(s = 1309kg/m3), Hs=14cms, dp= 4.3mm
Table Caption:
Table-1: Scope of the experiment
Table-2: CFD Simulation parameters
16
Table-1: Scope of the experiment
Sl.
No.
Bed Material Particle
size,dpx103,m
Particles density, ρp,
kg/m3
Static bed height,
Hsx102,m
1 Glass beads 4.3 2360 14
2 Glass beads 4.3 2360 18
3 Glass beads 4.3 2360 22
4 Glass beads 4.3 2360 26
5 Glass beads 2.58 2360 14
6 Glass beads 2.18 2360 14
7 Glass beads 1.29 2360 14
8 dolomite 4.3 2720 14
9 Steel balls 4.3 6720 14
10 Sago 4.3 1309 14
Table-2: CFD Simulation parameters
Description Value Comment Particle density, ρp , kg/m
3 2360 Glass beads
Gas density, ρg , kg/m3 1.225 Air
Mean particle diameter, dp, mm 4.3, 2.58, 2.18 and1.29
Uniform distribution
Restitution coefficient, e 0.9 From literature
Initial solids packing, εs0 0.60 Fixed value
Superficial gas velocity, U, m/s 0.691,1.382,2.073,2.764 and 3.455
~0.5, ~1.0, ~1.5, ~2.0 and ~2.5 Umf
Bed width, m 0.16 Fixed value Bed height, m 0.92 Fixed value
Static bed height, m 0.14 Fixed value Inlet Boundary Condition VELOCITY Superficial gas velocity
Outlet Boundary Condition PRESSURE Fully developed flow
17
Fig.-1
Fig.-2 (A)
1
2 3
4
5
6
7
………………………
8
9
1- COMPRESSOR
2- PRESSURE GAUGE
3-BYPASS VALVE
4- CONTROL VALVE
5- ROTAMETER
6- CALMING SECTION
7- DISTRIBUTOR
8- FLUIDISED BED
9- MANOMETER
y = 1.1644x0.7839
1
10
0.1 1 10
Expa
nsio
n ra
tio
856 .0 161 .0325 . 0 0623.0
mf f s
CC
S U
U D dp
D H
18
Fig.-2 (B)
0.0s 0.5s 1.0s 1.5s 2.0s 2.5s
Fig. -3
y = 7.2331x0.6773
0.1
1
10
0.01 0.1 1
Fluc
tuat
ion
ratio
579. 0268.00517 .0168.0
mff
s
CC
S
UU
Ddp
DH
19
Comparison of Expansion ratio
00.5
11.5
22.5
33.5
4
0 1 2 3 4
Velocity(m/s)
Expa
nsio
n ra
tio
RexpRsimu
Fig.- 4(A)
Comparison of Expansion ratio
00.5
11.5
22.5
33.5
4
0 1 2 3 4
Velocity(m/s)
Exp
ansi
on r
atio
RexpRcorr.
Fig.-4(B)
DelP Vs Velocity
0
1000
2000
3000
4000
5000
0 0.5 1 1.5 2 2.5
Velocity(m/s)
DelP
(pas
cal)
DelPexpDelPsimu
Fig.-5(A)
20
DelP Vs Velocity
0500
1000150020002500300035004000
0 0.5 1 1.5 2 2.5 3
Velocity(m/s)
Del
P(pa
scal
)
DelPexpDelPsimu
Fig.-5(B)
DelP Vs Velocity
0500
1000150020002500300035004000
0 0.5 1 1.5 2 2.5
Velocity(m/s)
Del
P(pa
scal
)
DelPexpDelPsimu
Fig.-5(C)
DelP Vs Velocity
0
1000
2000
3000
4000
5000
0 0.5 1 1.5 2 2.5
Velocity(m/s)
Del
P (p
asca
l)
DelPexpDelPsimu
Fig.-5 (D)
21
DelP Vs Velocity
0
500
1000
1500
2000
2500
3000
0 0.5 1 1.5 2 2.5 3
Velocity(m/s)
Del P
(pas
cal)
DelPexp
DelPsim
Fig.- 6(A)
DelP Vs Velocity
0
500
1000
1500
2000
2500
3000
0 0.5 1 1.5 2 2.5 3
Velocity(m/s)
Del P
(pas
cal)
DelP expDelPsimu
Fig.- 6(B)
Del P Vs Velocity
0
500
1000
1500
2000
2500
0 0.5 1 1.5 2 2.5 3
Velocity(m/s)
Del P
(pas
cal)
Del PexpDel Psimu
Fig.- 6(C)
22
DelP Vs Velocity
0200400600800
10001200140016001800
0 0.5 1 1.5 2 2.5 3
Velocity(m/s)
Del
P (p
asca
l)
DelP expDel P simu
Fig.-7(A)
DelP Vs Velocity
0500
1000150020002500300035004000
0 1 2 3 4 5
Velocity(m/s)
Del P
(pac
al)
DelP expDelP simu
Fig.- 7(B)
DelP Vs Velocity
0
200
400
600
800
1000
1200
1400
0 1 2 3 4
Velocity
DelP
(pas
cal)
DelP expDelP simu
Fig. - 7(C)