Embed Size (px)
Citation preview
Experimental and Data Modeling Methods for Targeted Water Chemistry Studies related
with Nuclear Power Reactors
By
Vaidehi Sharan Tripathi
CHEM 01200604011
BHABHA ATOMIC RESEARCH CENTRE
A thesis submitted to the
Board of Studies in Chemical Sciences
In partial fulfillment of requirements
For the Degree of
DOCTOR OF PHILOSOPHY
of
HOMI BHABHA NATIONAL INSTITUTE
February, 2014
Homi Bhabha National InstituteRecommendations of the Viva Voce Committee
As members of the Viva Voce Committee, we certify that we have read the
dissertation prepared by Mr. Vaidehi Sharan Tripathi entitled" Experimental and
Data Modeling Methods for Targeted Water Chemistry Studies Related with
Nuclear Power Reactors" and recommend that it may be accepted as fulfilling
the thesis requirement for the award of Degree of Doctor of Philosophy.
Chairman - Prof. K. L. Ramakumar Date:
Guide I Convener - Prof. D. B. Naik Date:
~\5 Z ~l '7"$) > "r- 2.0\4-
•External Examiner - Dr. S. Muralidharan f) 11
>,~--r:/._1>~tv ~Date:
Member 1 - Prof. S. K. Mukerjee
Member 2- Prof. A. K. Tyagi ,.-~ Date: ~ I'~ 0.:;>.- .1:20/4
Final approval and acceptance of this thesis is contingent upon the candidate's
submission of the final copies of the thesis to HBNI.
I hereby certify that I have read this thesis prepared under my direction
and recommend that it may be accepted as fulfilling the thesis requirement.
Date: 31-07-2014
Place: Mumbai
Guide: Prof. D. B. Naik
ii
STATEMENT BY AUTHOR
This dissertation has been submitted in partial fulfillment of requirements for an
advanced degree at Homi Bhabha National Institute (HBNI) and is deposited in the Library
to be made available to borrowers under rules of the HBNI.
Brief quotations from this dissertation are allowable without special permission,
provided that accurate acknowledgement of source is made. Requests for permission for
extended quotation from or reproduction of this manuscript in whole or in part may be
granted by the Competent Authority of HBNI when in his or her judgment the proposed
use of the material is in the interests of scholarship. In all other instances, however,
permission must be obtained from the author.
Vaidehi Sharan Tripathi

iii
DECLARATION
I, hereby declare that the investigation presented in the thesis has been carried out by me.
The work is original and has not been submitted earlier as a whole or in part for a degree /
diploma at this or any other Institution / University.
Vaidehi Sharan Tripathi

iv
List of publications arising from the thesis Journals:
1) “Study of nitric acid leachout characteristics from weak base anion exchanger to
maintain a specified pH regime during Gd(NO3)3 removal from moderator system of
540 MWe PHWRs” V. S. Tripathi, V. Balaji, G. Venkateswaran and S. C. Dash,
Canadian Journal of Chemical Engineering, 2009, Vol. 87, 887-895.
2) “Effect of gamma irradiation on chromate sorption over magnetite surface”.
V.S. Tripathi, S.J. Keny, S. Bera and G. Venkateswaran, Radiation Effects & Defects
in Solids, 2012, Vol. 167, 676–683.
3) “Novel V(III) compound: Electrochemical synthesis of V(OH)(HCOO)2,
characterization and evaluation of electroreduction on suitable electrodes”
V. S. Tripathi, K. K. Bairwa, D. Mal and D. B. Naik, Journal of The Electrochemical
Society, 2014, Vol. 161, E34 – E39.
Symposia: 1) “Gadolinium removal from the moderator system of TAPP #3 using the three layer bed”
V. S. Tripathi, V. Balaji, G. Venkateswaran and S. C. Dash, Proc. of Symposium on Operational and Environmental Issues Concerning use of Water as a Coolant in Power Plants and Industries (OPENWAC 2008), 15-16 Dec., 2008, Kalpakkam, pp 189-192.
2) “Electrochemical Investigation of Vanadium Reduction on Graphite Electrode”
V. S. Tripathi, K. K. Bairwa and S. V. Narasimhan, International Symposium on Materials Chemistry (ISMC-2010), 7-12 Dec., 2010, Mumbai, Poster paper No. A-23.
3) “Electrochemical Synthesis and Characterization of V(OH)(HCOO)2 for Easing the
Decontamination Formulation Preparation Methodology for Light Water Reactors” V. S. Tripathi, K. K. Bairwa and S. Velmurugan, Proc. of Fifth ISEAC Triennial International Conference on Advances and Recent Trends in Electrochemistry (ELAC-2013), 16-20 Jan., 2013, Hyderabad, pp 485-489.
Vaidehi Sharan Tripathi

v
Dedicated
to
My Beloved
Late Mother
vi
Acknowledgements
Foremost, I would like to express my sincere gratitude towards my present guide
Prof. D. B. Naik, Head, Applied Radiation Chemistry Section, Radiation & Photochemistry
Division (RPCD), BARC for his continuous support during my Ph.D study and research,
for his patience, motivation, enthusiasm, and immense knowledge. I also thank him for his
guidance and for critically reviewing my thesis. I would also like to express my deep sense
of gratitude and sincere thanks to my former research guide Prof. G. Venkateswaran,
former Head, Analytical Chemistry Division (ACD), BARC who introduced me to the area
of reactor water chemistry, for his generous inspiration, guidance, encouragement and
useful suggestions.
I would like express my gratitude towards the doctoral committee members for this
study, Prof. T. Mukherjee (former Director, Chemistry Group), Prof. K. L. Ramakumar
(Director, Radiochemistry & Isotope Group), Prof. S. V. Narasimhan (Former Associate
Director, Chemistry Group), Prof. S. K. Mukerjee (Head, Process Development Division)
and Prof. A. K. Tyagi (Head, Solid State Chemistry Section, Chemistry Division) for their
encouragement, insightful comments, and critical periodic review of the work.
I would like to specially thank to Prof. S. Velmurugan, Head, Water & Steam
Chemistry Division (WSCD), BARC-Facilities, Kalpakkam for his keen interest and
encouragement for completion of this work. My sincere thanks also go towards

vii
Dr. Shantanu Bera, Dr. S. Nagabhushan Achary, Dr. (Ms.) Naina H. Raje and
Dr. Rakesh Kumar for providing immediate and timely attention to my analytical
requirements.
I would like to place on record, the co-operation and constant support received from
my group colleagues Dr. A. G. Kumbhar, Dr. (Ms.) S. J. Keny, Mr. B. K. Gokhale and
Mr. K. K. Bairwa. This work could only be completed with the close co-operation from my
group colleagues.
It is my pleasure to acknowledge my fellow colleagues and friends who were
always available for any technical discussion, which include Dr. S. Nigam, Dr. S. Varma,
Dr. B. P. Mandal, Dr. K. Bhattacharyya and many others for their continuous moral
support. I wish to express my gratitude to all staff members of RPCD, ChD and WSCD for
their timely administrative assistance.
Last but not the least, I would like to thank my kids, Dishita and Aarav for sparing
me from paying attention to them during this work, my wife, Deepti for her immense
support and almost single handedly managing the family and my father for his constant
encouragement and for providing the spiritual support throughout my life.
Vaidehi Sharan Tripathi
viii
Contents
Page No.
Synopsis xiii-xxvii
List of Figures xxviii-xxxii
List of Tables xxxiii-xxxv
Chapter 1: Introduction 1-43
1.1 Structural materials and water chemistry controls of water cooled
reactors
2
Boiling Water Reactor (BWR) 4
Pressurized Water Reactor (PWR) 6
Pressurized Heavy Water Reactor (PHWR) 8
1.2 Oxide growth and activity transport in nuclear power plants 10
1.2.1 Corrosion products of iron in aqueous medium 10
1.2.2 Process of deposition of corrosion products 13
1.2.3 Radiation field build-up 15
1.2.4 Mechanism of Radioactivity build-up 17
1.3 Minimizing and control of radiation field in primary heat
transport systems
19
1.4 Decontamination 22
1.4.1 Physical/ Non-chemical decontamination procedures 22
1.4.2 Chemical decontamination procedures 23
Hard-chemical Decontamination 24
Soft-chemical decontamination 24
1.5 Oxide Dissolution 25
1.5.1 Acid Dissolution 26
1.5.2 Reductive / Oxidative Dissolution 26
Reductive Dissolution 27
Oxide dissolution of austenitic stainless steel structural
materials
30
Oxidative dissolution 30
ix
1.6 Decontamination chemical/ reagent requirements 31
1.6.1. Ion-exchange behavior / regenerative mode of dissolution 31
1.6.2 Consideration of radiolytic degradation 33
1.6.3 Material compatibility considerations 33
1.7 Present scenario of operational decontamination processes 34
1.8 Scope and objectives of the present work 35
1.8.1 Maximum solubility studies for aqueous V(V) and V(IV)
formate solutions
35
1.8.2 Optimization of electrolytic synthesis route for V(II)
preparation
36
1.8.3 Synthesis and characterization of different oxidation state
vanadium solids
36
1.8.4 Redox speciation method development for quantification of
aqueous vanadium redox mixtures
37
1.8.5 Chromate sorption over magnetite in presence of gamma
irradiation
38
1.8.6 Water chemistry control by weak base anion exchanger 39
1.9 References 40
------------------------------------------------------------------------------------ -------------------
Chapter 2: Experimental Methods 44-67
2.1 Introduction 44
2.2 Description of the electrolytic cell 45
2.3 Simulated moderator purification system setup for gadolinium
removal studies
47
2.4 Synthesis of different oxidation state vanadium formate solids
from aqueous solution
49
2.5 Instrumental techniques 52
2.5.1 Ultraviolet - Visible Spectrophotometry 52
2.5.2 Flame Atomic Absorption Spectrometry (FAAS) 54
2.5.3 Inductively Coupled Plasma – Atomic Emission
Spectroscopy (ICP-AES)
55
2.5.4 Ion Chromatography 56
2.5.5 Powder X-ray diffraction (XRD) 58
2.5.6 Fourier-Transformed Infrared (FT-IR) spectrometer 59
x
2.5.7 Thermogravimetry 60
2.5.8 X-Ray Photoelectron Spectroscopy (XPS) 61
2.5.9 Electrochemical techniques 62
Tafel Plot 62
Cyclic Voltammetry 64
2.6 References
66
------------------------------------------------------------------------------------ -------------------
Chapter 3: Studies on Optimization of Parameters for Vanadium
Synthesis in Low Oxidation State
68-129
3.1 Introduction 68
3.2 Experimental 70
3.2.1 Evaluation of maximum solubility of V(V) and V(IV)
aqueous solutions
70
3.2.2 Constant current electrolysis and electrochemical evaluation
of electrodes
71
3.2.3 Synthesis and characterization of different oxidation state
vanadium solids
72
3.3 Results and discussion 74
3.3.1 Maximum solubility of V(V) and V(IV) in formate medium 74
3.3.2 Constant current electrolysis for vanadium reduction 81
3.3.3 Electrochemical evaluation of suitable cathode material 82
Potentiodynamic polarization studies 82
Cyclic voltammetric studies 86
3.3.4 Synthesis and characterization of different oxidation state
vanadium solids
93
Compositional characterization of synthesized vanadium
compounds
95
Thermogravimetric analysis of vanadium compounds 103
Infrared spectral evaluation of the vanadium compounds 110
X-ray photoelectron (XPS) spectroscopic study of the
vanadium compounds
113
X-ray diffraction study of the vanadium compounds 115
Summary 127
xi
3.4 References 127
------------------------------------------------------------------------------------ -------------------
Chapter-4: Redox Speciation Studies of Aqueous Vanadium
Solutions
130-145
4.1 Introduction 130
4.2 Experimental 132
4.3 Results and discussion 134
4.3.1 Evaluation of progress of electrolysis 134
4.3.2 Spectrophotometric method for redox speciation of aqueous
vanadium ions
136
4.3.2 Direct spectrophotometric determination of aqueous
V(III)/V(II) redox couple
139
Summary 145
4.4 References 145
------------------------------------------------------------------------------------ -------------------
Chapter 5: Chromate Sorption over Magnetite in Presence of
Gamma Irradiation
146-167
5.1 Introduction 146
5.2 Experimental 147
5.3 Results and discussion 148
5.3.1 Solution evaluation for isothermal interaction 148
5.3.2 Oxide evaluation for isothermal interaction 150
5.3.3 Solution evaluation of gamma irradiated chromate-
magnetite system
155
5.3.4 Oxide evaluation of gamma irradiated chromate-magnetite
system
159
Summary 166
5.4 References 166
------------------------------------------------------------------------------------ -------------------
Chapter 6: Water Chemistry Control by Weak Base Anion
Exchanger
168-196
6.1 Introduction 168
6.2 Experimental 170
6.3 Results and Discussion 172
xii
6.3.1 Leachout behaviour of WBA column 172
6.3.2 Removal of gadolinium from solution 183
Summary 195
6.4 References 196
------------------------------------------------------------------------------------ -------------------
Chapter 7: 197-200
Conclusions 197
Future scope of work 200
------------------------------------------------------------------------------------ --------------------
xiii
Synopsis of the thesis titled: Experimental and data modeling
methods for targeted water chemistry studies related with
nuclear power reactors
Introduction
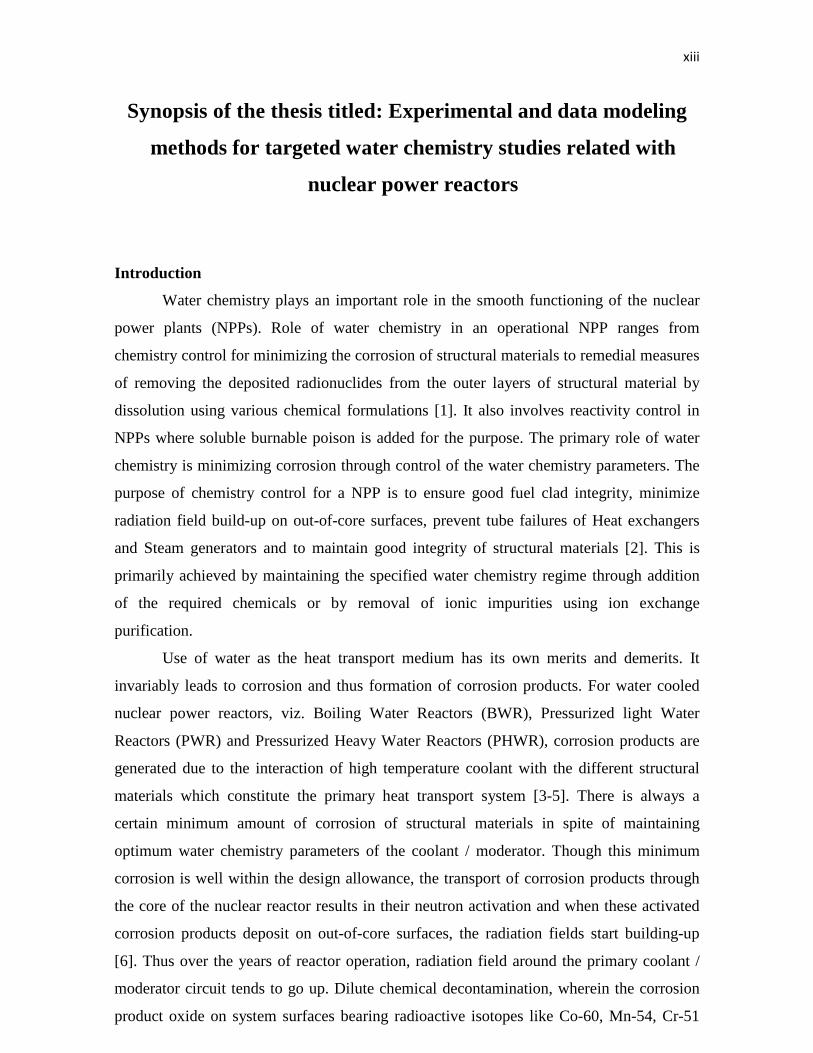
Water chemistry plays an important role in the smooth functioning of the nuclear
power plants (NPPs). Role of water chemistry in an operational NPP ranges from
chemistry control for minimizing the corrosion of structural materials to remedial measures
of removing the deposited radionuclides from the outer layers of structural material by
dissolution using various chemical formulations [1]. It also involves reactivity control in
NPPs where soluble burnable poison is added for the purpose. The primary role of water
chemistry is minimizing corrosion through control of the water chemistry parameters. The
purpose of chemistry control for a NPP is to ensure good fuel clad integrity, minimize
radiation field build-up on out-of-core surfaces, prevent tube failures of Heat exchangers
and Steam generators and to maintain good integrity of structural materials [2]. This is
primarily achieved by maintaining the specified water chemistry regime through addition
of the required chemicals or by removal of ionic impurities using ion exchange
purification.
Use of water as the heat transport medium has its own merits and demerits. It
invariably leads to corrosion and thus formation of corrosion products. For water cooled
nuclear power reactors, viz. Boiling Water Reactors (BWR), Pressurized light Water
Reactors (PWR) and Pressurized Heavy Water Reactors (PHWR), corrosion products are
generated due to the interaction of high temperature coolant with the different structural
materials which constitute the primary heat transport system [3-5]. There is always a
certain minimum amount of corrosion of structural materials in spite of maintaining
optimum water chemistry parameters of the coolant / moderator. Though this minimum
corrosion is well within the design allowance, the transport of corrosion products through
the core of the nuclear reactor results in their neutron activation and when these activated
corrosion products deposit on out-of-core surfaces, the radiation fields start building-up
[6]. Thus over the years of reactor operation, radiation field around the primary coolant /
moderator circuit tends to go up. Dilute chemical decontamination, wherein the corrosion
product oxide on system surfaces bearing radioactive isotopes like Co-60, Mn-54, Cr-51
xiv
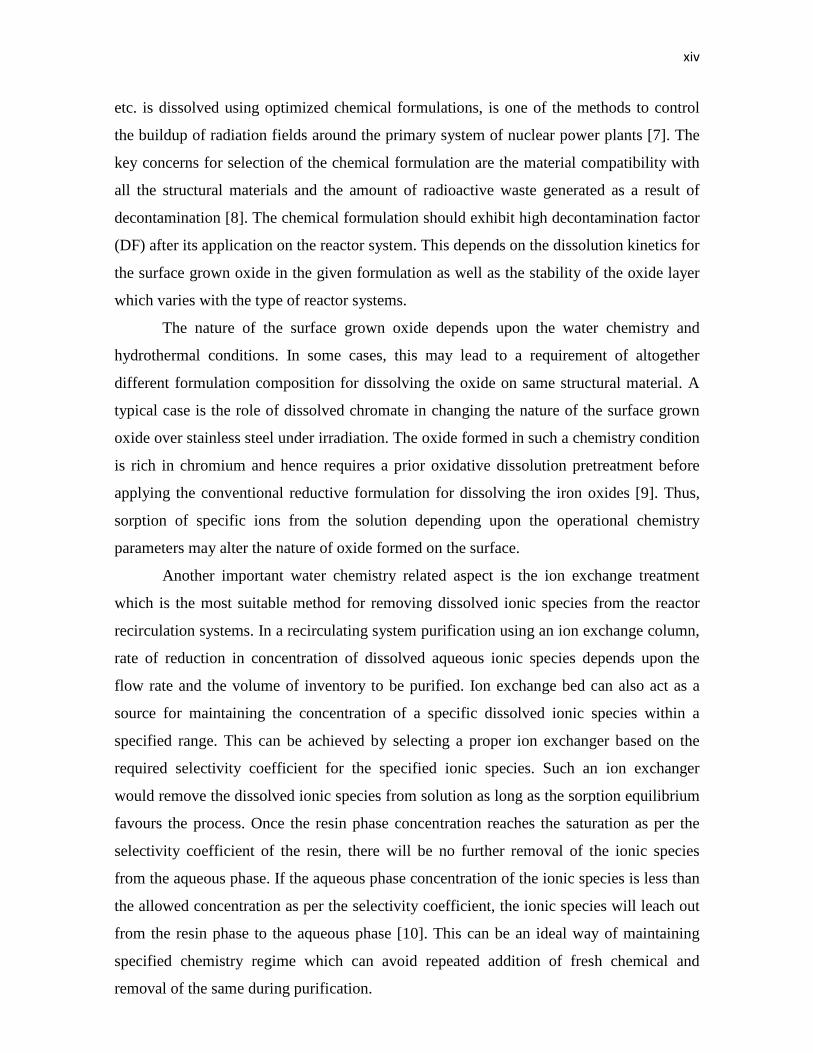
etc. is dissolved using optimized chemical formulations, is one of the methods to control
the buildup of radiation fields around the primary system of nuclear power plants [7]. The
key concerns for selection of the chemical formulation are the material compatibility with
all the structural materials and the amount of radioactive waste generated as a result of
decontamination [8]. The chemical formulation should exhibit high decontamination factor
(DF) after its application on the reactor system. This depends on the dissolution kinetics for
the surface grown oxide in the given formulation as well as the stability of the oxide layer
which varies with the type of reactor systems.
The nature of the surface grown oxide depends upon the water chemistry and
hydrothermal conditions. In some cases, this may lead to a requirement of altogether
different formulation composition for dissolving the oxide on same structural material. A
typical case is the role of dissolved chromate in changing the nature of the surface grown
oxide over stainless steel under irradiation. The oxide formed in such a chemistry condition
is rich in chromium and hence requires a prior oxidative dissolution pretreatment before
applying the conventional reductive formulation for dissolving the iron oxides [9]. Thus,
sorption of specific ions from the solution depending upon the operational chemistry
parameters may alter the nature of oxide formed on the surface.
Another important water chemistry related aspect is the ion exchange treatment
which is the most suitable method for removing dissolved ionic species from the reactor
recirculation systems. In a recirculating system purification using an ion exchange column,
rate of reduction in concentration of dissolved aqueous ionic species depends upon the
flow rate and the volume of inventory to be purified. Ion exchange bed can also act as a
source for maintaining the concentration of a specific dissolved ionic species within a
specified range. This can be achieved by selecting a proper ion exchanger based on the
required selectivity coefficient for the specified ionic species. Such an ion exchanger
would remove the dissolved ionic species from solution as long as the sorption equilibrium
favours the process. Once the resin phase concentration reaches the saturation as per the
selectivity coefficient of the resin, there will be no further removal of the ionic species
from the aqueous phase. If the aqueous phase concentration of the ionic species is less than
the allowed concentration as per the selectivity coefficient, the ionic species will leach out
from the resin phase to the aqueous phase [10]. This can be an ideal way of maintaining
specified chemistry regime which can avoid repeated addition of fresh chemical and
removal of the same during purification.
xv
Scope and objectives of the study
The water chemistry studies undertaken in the present work are related to the
decontamination of stainless steel based NPPs viz. BWRs and PWRs along with the
application of ion exchange resins for maintaining the specified water chemistry regime.
The chemical decontamination formulation is usually a mixture of a reducing agent, a
chelating ligand and a pH maintaining reagent. The action of chemical decontamination
formulation can be broadly described in two steps. The strong reducing agents such as
V(II)-NTA (nitrilotriacetic acid) or Fe(II)-NTA adsorb on the surface of the oxide and
reduce the Fe(III) on surface by the heterogeneous electron transfer mechanism. The oxide
lattice is destabilized by the Fe(III) to Fe(II) reduction owing to the ionic size variation and
associated increased electrostatic repulsion between the Fe(II) and oxide ions, the Fe(II)
ion dissolved in the solution is subsequently stabilized by the complexing agent at the
favourable pH conditions [11]. Iron oxides are the major constituent of the surface grown
oxides in all types of NPPs operating under different water chemistry regimes. The
percentage metal ion composition of iron in the surface oxide ranges from 70 to more than
95. Direct reductive dissolution is effective for low Cr containing oxides. However, if the
Cr content is higher, typically > 10 metal atom% chromium in the oxide lattice, an
oxidative pretreatment is a required prior to the conventional reductive dissolution to
obtain good decontamination factor (DF) [12]. While simple iron oxides like Fe3O4,
γ-Fe2O3, FeOOH and α-Fe2O3 etc., can be efficiently dissolved using organic acid
reductant based formulations like a mixture of citric acid, ethylenediamine tetra acetic acid
(EDTA) and ascorbic acid (CEA) where ascorbic acid acts as the reducing agent, the
chromium, nickel substituted iron oxides like Fe2-xCrxO3, FexCryNizO4 (x+y+z = 3) etc.,
require formulation based on stronger reducing agents like V(II) EDTA,V(II) (pic)3 etc.
These Ni and Cr substituted oxides are primarily formed on stainless steel based light water
cooled nuclear power reactors like Boiling Water Reactor (BWR) and Pressurised Water
Reactor (PWR) [13].
Thus, a methodology to synthesize the strong reducing agent namely V(II) at large
scale is imperative for undertaking decontamination of stainless steel based NPPs. Major
part of the present work is related with the studies on optimization of the synthesis of V(II)
based formulation. The strongly reducing nature of V(II) requires careful handling under
inert condition. Otherwise it will react with atmospheric oxygen and will instantaneously
get oxidized to V(III). The stringent requirement of inert condition poses immense
handling related issues for the large scale application. These can be addressed in two ways.
xvi
The first and the preferred one is to prepare a material compatible V(II) solid compound
which can be directly added to the reactor system during the decontamination campaign.
The second option is to optimize the preparation of a high concentration V(II) solution in a
material compatible formulation which will reduce the volume to be handled during the
decontamination campaign. The stringent condition of material compatible formulation
limits the choice of synthesis routes. Electrochemical route is the one which provides the
flexibility of selective synthesis. Electrolytic route allows us to select the exact medium
required for synthesis without any addition of spare reagent or formation of any byproduct.
The prevalent oxidation states of vanadium compounds are 5+ and 4+. The methodology
used for the synthesis was based on electroreduction of saturated aqueous V(V) or V(IV)
precursor solutions in the material compatible formulation. The maximum concentration
has been evaluated for V(V) in formic acid medium at different molar ratio and also for
V(IV) in formic acid media. The solid compounds obtained by precipitation during the
process were also characterized for their chemical composition. Electrochemical studies
using aqueous vanadium solution were performed to select the suitable electrode. A two
compartment electrolysis cell was designed and fabricated in-house which was used for
electroreduction of various vanadium formate solutions. A V(III)-formate solid compound
obtained by electroreduction was also characterized for the chemical composition and
solubility in aqueous solution. Complexation of the V(III) compound to obtain highly
stable aqueous solution is also studied.
The electrolysis requires an efficient methodology for monitoring as the product is
highly reactive and air sensitive. On-line continuous solution potential monitoring with a
redox electrode impressed with a high frequency of 1.13 kHz, 10 mV alternating voltage to
overcome polarization of the electrode has been evolved for evaluating the progress of
electrolysis. A redox speciation method for periodic batch samples has also been evolved
which is based on simple, rapid and sensitive indirect spectrophotometric measurement.
Dissolution of oxide from the surface also entails understanding the nature of oxide
formed on the structural surfaces. Presence of chromate in medium has been studied for its
role in modifying the representative iron oxide. Effect of gamma irradiation on the oxide
modification has been compared with isothermal interaction.
Weak base anion exchange resin has been evaluated for maintaining the specified
pH during Gd3+ removal. The use of nitric acid loaded weak base anion exchange resin has
been studied for the purpose.
xvii
Organization of the thesis:
The thesis contains seven chapters. The first chapter gives the details of the water
chemistry controls practiced in the various NPPs and related issues. The second chapter
contains the discussion of the experimental and instrumental techniques used in the study.
Third to sixth chapter contain the description of the research work carried out in details.
Seventh chapter contains the overall summary of conclusions of the study. The brief
overview of the chapters is given below:
Chapter 1: Introduction
This chapter outlines the overall general introduction to the issues related with the
water chemistry of NPPs. The basis for evolution of water chemistry specifications for the
various types of NPPs is discussed. The issue of oxide growth mechanism on the structural
material surfaces and related activity transport and radioactivity field buildup is discussed.
A broad outline of the topic is presented on the basis of literature survey. The general
perspective of decontamination and related practices is also discussed. A summary of the
methodologies of oxide dissolution based on the literature reports is presented. The varying
mechanisms of chemical dissolutions for different kind of oxides have been also been
enlisted. The requirement of a strong reducing agent for dissolution of oxides grown over
the stainless steel surfaces is discussed. Criteria for selection of a suitable decontamination
formulation on the basis of fulfillment of additional preconditions imposed by the specific
requirements of NPPs are discussed. A brief account of evolution of various
decontamination formulation to meet the above mentioned requirements is also given. The
specific role of chromate in modification of the representative oxides, its enhanced sorption
in presence of gamma irradiation is discussed. The water chemistry control by application
of nitric acid loaded weak base anion exchange resin is also discussed in this chapter.
Chapter 2: Experimental methods
This chapter outlines the experimental setup details used in the study including the
description of cell used for electrolysis, the arrangement made for monitoring redox
potential and the recirculation loop with an ion exchange column used for water chemistry
control using ion exchange bed. Synthesis of representative oxides for chromate sorption
studies is also described. Brief principle of instrumental techniques used for
characterization and analysis in the study is described in the chapter. These include
electrochemical techniques like cyclic voltammetry and potentiodynamic polarization

xviii
using PGSTAT 302N from Ecochemie which can operate within ± 15 V, 2 A working
range, atomic absorption spectroscopy (AAS) using Avanta from GBC with 8 lamp holder,
ion chromatography (IC) using DX-120 from Dionex, Fourier transform Infrared
spectroscopy (FTIR) using MB 102 FTIR from Bomem having a scan range of
4000 - 400 cm-1 with a resolution of 2 cm-1, Ultraviolet-visible spectroscopy (UV-vis)
using Jasco-700 spectrophotometer having a scan range of 900 to 190 nm,
thermogravimetry (TG) using SETSYS by SETARAM , X-ray diffraction (XRD) using
Philips powder x-ray diffractometer based on PW1710 processing unit with vertical
goniometer (model PW1820) coupled to PW1729 x-ray generator having Cu Kα x-ray
source (30 KV and 20 mA) and X-ray photoelectron spectroscopy (XPS) using VG model -
ESCALAB MK 200X spectrometer equipped with Al kα x-ray energy of 1486.6 eV and
FWHM of 0.85 eV along with Mg kα x-ray energy of 1253.6 eV and FWHM of 0.75eV.
Chapter 3: Studies on Optimization of Parameters for Vanadium Synthesis in Low
Oxidation State
This chapter describes the studies undertaken to optimize the vanadous, V(II)
formulation preparation methodology for large scale preparation. Vanadous formulation in
a material compatible media is required for decontamination of stainless steel based NPPs
namely BWRs and PWRs. The prevalent oxidation states of vanadium are vanadate (VO2+)
and vandyl (VO2+) in the aqueous medium. The solubility of sodium metavanadate in the
formic acid medium is compared with its vanadyl counterpart which is obtained by
chemical reduction using hydrazine. V(V) as vanadate and V(IV) as vanadyl ions have
been in-situ generated and sequentially concentrated to evaluate the saturation solubilities.
Instantaneous solubility was evaluated by turbidimetric and conductivity measurements.
Vanadyl ion has shown almost two times higher solubility than the vanadate ion in similar
concentration of formic acid. The residual vanadium solubility in the aged solutions was
determined by elemental analysis separately. The lower solubility of vanadate in aqueous
media is attributed to its deprotonation and associated hydrolysis behavior [14]. The
tendency to undergo deprotonation decreases with decreasing oxidation state and hence
vanadyl is expected to have higher solubility than that of the vanadate ion in a given
aqueous media. A stable solution of 450 mM of vanadyl formate could be prepared by
reduction of sodium metavanadate with 225 mM hydrazine in 2.7 M formic acid medium.
These solubility studies have been described in the chapter.
xix
Electrochemical route is selective and free of byproducts and hence is the method
of choice for synthesizing vanadous formulation in material compatible state. The selection
of suitable cathode material is a key factor for electrolytic reduction process. The ease of
fabrication of cathode in the required geometry for its subsequent use in the electrolysis
cell, safe and easy handling during operation are issues to be addressed while selecting a
cathode material. The primary requirement for a good cathode material is to provide high
current efficiency for the desired reduction process. The synthesis of V(II) in acidic
medium will be affected by the competing proton reduction process as the formal redox
potential for hydrogen evolution is more positive than that for V(III)/V(II) redox potential.
Thus, a high current efficiency for V(III)/V(II) redox process can only be obtained at
electrodes which have high overpotential for hydrogen evolution. Stainless steel and
carbon based cathodes (glassy carbon and graphite rod) have been evaluated for the
vanadium reduction using potentiodynamic polarization and cyclic voltammetry. Tafel
parameters for these electrodes were compared to evaluate the electrochemical kinetics of
vanadium reduction. The exchange current density is around five times higher for V(III) on
stainless steel (1.268 × 10⁻⁶ A cm-2) as compared to that on glassy carbon
(2.403 × 10⁻⁷ A cm-2). The exchange current density for HCOOH itself is much higher
(~23 times) for stainless steel electrode (4.667 × 10⁻⁷ A cm-2) as compared to that for
glassy carbon (2.039 × 10⁻⁸ A cm-2). The increase in exchange current density for V(III) as
compared to that for HCOOH is much more on glassy carbon electrode, 11.8 times as
compared to 2.7 times for stainless steel electrode. Exchange current density for V(III) has
shown two fold increase upon addition of equimolar concentration of HCOOH on stainless
steel electrode (2.882 × 10⁻⁶ A cm-2) whereas it reduced to less than half on glassy carbon
(1.065 × 10⁻⁷ A cm-2) for similar acid addition. Thus, carbon based electrodes will give
better current efficiency for V(III) reduction in formic acid media. Cyclic voltammetry
studies have further elucidated the mechanism of interaction of these electrodes with V(III)
in presence of formic acid. The part consumption of current for acid reduction on stainless
steel electrodes and blocking of active sites by H+ adsorption on carbon surfaces was
observed in cyclic voltammetric studies. Although electrochemical parameters evaluated
for glassy carbon and graphite electrodes were similar, the electrochemical characteristics
of graphite electrode were complicated owing to the porous nature of its surface. The
electrochemical studies have established that carbon based electrodes will be suited for
electrolytic reduction of vanadium in formic acid medium as compared to stainless steel
electrode.

xx
Controlled current electrolysis of vanadium in formic acid medium has been
evaluated in a two compartment cell. The electrolysis was evaluated for saturation
concentrations of V(V) as well as V(IV) solutions. A V(III) precipitate was obtained for
both V(V) and V(IV) solutions with saturated concentrations. As the saturation
concentration for vanadyl solution (~450 mM) is higher than that of vanadate solution
(~250 mM), the product yield is higher for the vanadyl solution. Also it takes lesser time as
compared to that for obtaining the product from vanadyl as only single step reduction is
involved for vanadyl reduction. The redox potential variation analysis in conjunction with
coulometric calculations shows that the precipitation of V(III) compound is governed by
both pH and concentration factors. The chemical formula of the product as established by
compositional analysis using AAS and IC, TG and FTIR is V(OH)(HCOO)2. The
compound dissolves instantaneously in water but a polymeric vanadium compound is
subsequently formed which is insoluble in water. The polymerization of dissolved
compound depends upon the concentration as well as the aging duration. High
concentration solutions undergo polymerization instantaneously while the low
concentration solutions undergo polymerization over a period of time. The stoichiometric
ratio of the compound and nitrilotriacetic acid (NTA) resulted in a stable aqueous solution
upto a concentration of 250 mM. The compound was also dissolved with citric acid in
equimolar concentration ratio to evaluate the solubility of V(III)-citrate complex. The
complex is highly soluble and a stable concentration of 1 M V(III)-citrate complex could
be prepared under inert atmosphere. Solutions with two times citric acid and three times
citric acid (molar ratio) have shown exactly the same UV-visible spectral pattern as that of
solution of equimolar concentration ratio. This indicates formation of only equimolar
V(III)-citrate complex with the present compound. These high concentration V(III)
formulations in material compatible composition without any spare/additional chemicals
will be highly suited for preparation of the required V(II) formulation for NPP
decontamination applications. An electrolytic cell designed for high current can be used for
V(II) preparation with a small volume to be handled at the above mentioned concentration
levels. Direct electrolysis of vanadate or vanadyl solutions at a maximum concentration of
125 mM also gives V(II) as final product, but with higher volume to be handled and also
with the presence of equimolar concentration of Na which will add to the total ionic load of
the spent decontamination formulation.
Vanadyl formate has also been reduced with Zn amalgam at high concentration
(350 mM). The brown precipitate obtained by the chemical reduction has been found to be

xxi
a V(II) compound with partial solubility in water. However this compound could be
dissolved in a complexing medium of NTA with heating. The proper separation of the solid
from the zinc amalgam medium and purification to remove traces of zinc is difficult in this
case.
Chapter 4: Redox speciation studies for aqueous vanadium solutions
This chapter describes the methodology developed for redox speciation of aqueous
vanadium. A methodology for in-situ monitoring of the electrolytic synthesis of vanadous
formate with minimum intervention has been developed. This is based on continuous
solution potential monitoring with a redox electrode impressed with a high frequency
alternating voltage to overcome polarization of the electrode. The redox potential
measurement by the conventional setup has been unsuccessful as the polarization of the
platinum redox electrode led to a non responsive readout after some time. The application
of high frequency alternating voltage on the electrode by the conductivity meter during the
measurement could effectively overcome the polarization. The two pole conductivity meter
applies frequency as per the conductivity of solution to avoid polarization. Redox potential
measurement using one of the two poles of the conductivity meter against a Ag/AgCl, sat.
KCl reference electrode gives a proper response for the entire range of electrolysis.
The redox speciation method for periodic batch samples has also been evolved
which is based on simple, rapid and sensitive indirect spectrophotometric measurement.
V(V) in solution is evaluated by adding Fe(II) and estimating the Fe(III) formed by the
spectrophotometric determination of the sulfosalicylic acid complex. The usual
Fe(II) o-phenanthroline method could not be used owing to severe interference of the
V(V)/V(IV) redox couple with the iron o-phenanthroline complex. The
Fe(III) sulfosalicylic acid complex shows a linear dynamic range for 2 to 10 ppm Fe(III)
and the absorption maxima is observed at 510 nm. Vanadium may exist in solution in (II),
(III), (IV), or (V) valence state, or as a mixture of any two contiguous valence states during
the progress of electrolysis. The redox speciation involves evaluating the V(V) reducing
strength of the sample. This is done by converting the sample to V(V)/V(IV) mixture by
adding known excess V(V) aliquot to the sample. The residual V(V) is then analysed as
described above. Total vanadium concentration in the sample is separately evaluated by
completely oxidizing it to V(V) with acidic permanganate and then by repeating the above
mentioned analysis. Neither V(IV) nor Mn(II) has shown any interference over a wide
range of concentration in the analysis of Fe(III) sulfosalicylic acid complex. The
xxii
composition of the redox mixture in the sample is then calculated by correlating the V(V)
reducing strength of the redox mixture with the total vanadium concentration of the
sample.
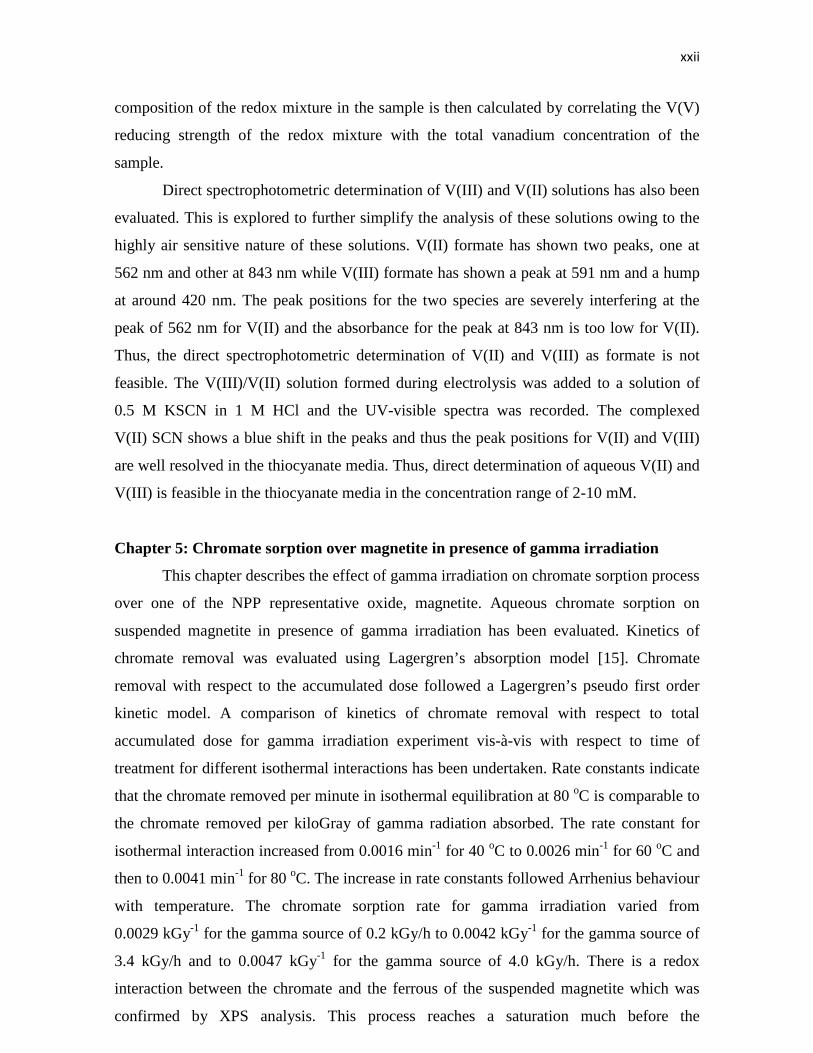
Direct spectrophotometric determination of V(III) and V(II) solutions has also been
evaluated. This is explored to further simplify the analysis of these solutions owing to the
highly air sensitive nature of these solutions. V(II) formate has shown two peaks, one at
562 nm and other at 843 nm while V(III) formate has shown a peak at 591 nm and a hump
at around 420 nm. The peak positions for the two species are severely interfering at the
peak of 562 nm for V(II) and the absorbance for the peak at 843 nm is too low for V(II).
Thus, the direct spectrophotometric determination of V(II) and V(III) as formate is not
feasible. The V(III)/V(II) solution formed during electrolysis was added to a solution of
0.5 M KSCN in 1 M HCl and the UV-visible spectra was recorded. The complexed
V(II) SCN shows a blue shift in the peaks and thus the peak positions for V(II) and V(III)
are well resolved in the thiocyanate media. Thus, direct determination of aqueous V(II) and
V(III) is feasible in the thiocyanate media in the concentration range of 2-10 mM.
Chapter 5: Chromate sorption over magnetite in presence of gamma irradiation
This chapter describes the effect of gamma irradiation on chromate sorption process
over one of the NPP representative oxide, magnetite. Aqueous chromate sorption on
suspended magnetite in presence of gamma irradiation has been evaluated. Kinetics of
chromate removal was evaluated using Lagergren’s absorption model [15]. Chromate
removal with respect to the accumulated dose followed a Lagergren’s pseudo first order
kinetic model. A comparison of kinetics of chromate removal with respect to total
accumulated dose for gamma irradiation experiment vis-à-vis with respect to time of
treatment for different isothermal interactions has been undertaken. Rate constants indicate
that the chromate removed per minute in isothermal equilibration at 80 oC is comparable to
the chromate removed per kiloGray of gamma radiation absorbed. The rate constant for
isothermal interaction increased from 0.0016 min-1 for 40 oC to 0.0026 min-1 for 60 oC and
then to 0.0041 min-1 for 80 oC. The increase in rate constants followed Arrhenius behaviour
with temperature. The chromate sorption rate for gamma irradiation varied from
0.0029 kGy-1 for the gamma source of 0.2 kGy/h to 0.0042 kGy-1 for the gamma source of
3.4 kGy/h and to 0.0047 kGy-1 for the gamma source of 4.0 kGy/h. There is a redox
interaction between the chromate and the ferrous of the suspended magnetite which was
confirmed by XPS analysis. This process reaches a saturation much before the
xxiii
consumption of entire ferrous ions of magnetite indicating a passivating nature of the
product. The complete sorption of chromate could not be obtained in these studies although
the Fe(II) to chromate mole ratio was kept at 28:1. This is attributed to the formation of
passive maghemite (γ-Fe2O3) layer on the surface of magnetite. The effect of radiation on
both chromate solution and dispersed magnetite to alter the redox process could be
ascertained. For varying amount of magnetite, the amount of chromate reduced normalised
to the amount of magnetite taken has shown a decreasing trend with the increasing amount
of magnetite. This suggests that the chromate reduction on magnetite is a surface
phenomenon in the presence of irradiation. Gaussian-Lorenzian peak fittings to the XPS
data has been done to evaluate the chemical composition of the deposited chromium and
the resultant change in the chemical composition of the iron in the oxide lattice. This
indicated that the magnetite equilibrated with chromate under γ irradiation resulted in a
different surface composition as compared to the one obtained in absence of γ irradiation.
The binding energy of Cr 2p3/2 showed the presence of Cr3+. However, Cr 2p3/2 peak-
binding energy and peak width was higher than that for the non-irradiated case. It appears
that Cr in the irradiated sample is present as different Cr3+-bearing species. Fe 2p peak also
showed higher binding energy and broader peak unlike that of the samples of isothermal
equilibration with chromate. Cr3+ on the surface of magnetite was present in two different
compounds, CrOOH and Cr2O3. Similarly the presence of FeOOH was also found after
fitting the Fe 2p3/2 spectrum. XPS data indicated the presence of hydroxyl group and oxide
group attached to both iron and chromium moieties in case of irradiation whereas only
oxide group were seen in only temperature treatment. The O1s peak in case of
non irradiated sample is sharp and comparable with peak shape of O1s showed by standard
magnetite. But in the irradiated case the O1s peak is broader and indicated the presence of
some –OH group in the sample (peak at around 531.5 eV).
Thus, it was found that the redox interaction in presence of γ-irradiation proceed
through several different pathways. Prominent presence of hydroxyl group indicates the
important role of reducing radicals on the heterogeneous redox interaction.
Chapter 6: Water chemistry control by weak base anion exchanger
This chapter describes the study undertaken to maintain the pH within the specified
limits by nitric acid leach out from the nitric acid loaded weak base anion (NLWBA)
exchanger. Nitric acid sorption-desorption on weak base ion exchange resin was studied
for the removal of Gd(NO3)3 from solution while maintaining the pH in the range of
xxiv
5.0 – 5.5. This pH range is required to keep the Gd in aqueous phase without causing any
significant corrosion damage of the structural material by the acidic water chemistry. A
simple model based on first order dependence for both sorption and desorption has been
developed and the experimental data was fitted to the model to deduce the required
parameter values. Eluting of nanopure water through various nitric acid loaded weak base
resins has shown the leaching of nitric acid from the weak base resin with the leaching of
nitric acid following a first order decrease for upto 20% loading of the weak base resin.
Elution of nitric acids with varying concentrations through the nitric acid loaded weak base
resins has shown that the leach out of nitric acid from weak base resin is a combined effect
of mass action and electrostatic repulsion. The equilibrium constants for the 5%, 10%,
20%, 50% and 100% NLWBA mixtures with fresh weak base anion (WBA) exchanger
were determined to be 5.8, 7.2, 10.5, 9.2 and 8.7 dm3 mol-1 respectively. The equilibrium
constants evaluated for the experiments where nitric acid concentration equivalent to 5%,
10%, 20%, 50% and 100% loading were recirculated through fresh resin were 9.1, 13.5,
20.3, 6.5 and 6.2 dm3 mol-1 respectively. Thus, recirculation experiments with nitric acid
have shown that the leaching is governed by the equilibrium effects and the optimum
efficiency of weak base resin is obtained when the loading is around 20 %.
A strong acid cation exchanger topped mixed bed of strong acid cation exchanger and
weak base anion exchanger column was used to remove Gd(NO3)3 at 4 and 15 mgKg-1
concentrations under a given flow velocity and a given available ion exchange capacity in a
recirculation mode. The initial column outlet pH went above the specified limit during the
initial period of Gd removal. A mixed bed configuration of same amount of resins has
given a wider range of outlet pH as compared to the layered bed. A 5% nitric acid loaded
weak base anion exchanger as a bottom layer of the ion exchange column was used to
overcome the initial pH rise of the layered bed column outlet by the leach out of nitric acid.
This three layer column was effectively removing Gd while maintaining the technical
specifications of pH and conductivity.
Chapter 7: Conclusions
This chapter summarizes the important conclusions drawn from the studies
discussed in the preceding chapters. The scope of future work in this area of research is
also mentioned briefly.
The salient findings and conclusions of the study are given below:
xxv
1) Aqueous vanadyl ions have higher solubility than that of vanadate ions in formic acid
media.
2) Electrochemical evaluation of carbon based electrode and stainless steel electrodes for
selection of better cathode material for aqueous vanadium reduction has suggested that
carbon based electrodes are more suited for the application. The evaluation of Tafel
plots indicate that a significant part of current is lost in hydrogen evolution by formic
acid reduction on stainless steel electrodes while the acid blocks the active sites on
carbon electrode resulting in reduction of current density. Thus, a higher current
efficiency is obtained for vanadium reduction on carbon based cathode.
3) Controlled current electrolysis of 350 mM aqueous vandyl formate has resulted in
precipitation of an ionic V(III) compound. The compound readily dissolves in pure
water but subsequently precipitates out as polymer depending upon concentration and
ageing duration. However a stable aqueous solution with high V(III) concentration
could be prepared from it by adding a suitable complexing agent like nitrilotriacetic
acid which results in formation of 250 mM V(III) solution and citric acid which results
in formation of more than 1 M V(III) solution.
4) Controlled current electrolysis of vanadate and vanadyl formate solutions with
concentrations below 125 mM results in formation of aqueous solution of vanadous
formate.
5) Chemical reduction of 350 mM vanadyl formate using Zn amalgam has resulted in
precipitation of a vanadous compound.
6) In-situ monitoring of the electrolytic synthesis of vanadous formate based on
continuous solution potential monitoring with a redox electrode impressed with a high
frequency alternating voltage to overcome polarization of the electrode has been
developed.
7) A simple, rapid and sensitive indirect spectrophotometric method has been developed
for redox speciation of aqueous vanadium formate solution. Addition of known excess
vanadate could convert all contiguous redox couples of vanadium formate into
V(V)/V(IV) mixture. V(V) in solution is evaluated by adding Fe(II) and estimating the
Fe(III) formed by the spectrophotometric determination of its sulfosalicylic acid
complex.
8) Direct spectrophotometric determination of aqueous V(III)/V(II) formate solution
could be achieved by adding thiocyanate as complexing agent. V(II) absorption peaks

xxvi
undergo a blue shift in the thiocyanate media and thereby giving well resolved peaks
for the two aqueous vanadium redox species.
9) Chromate reduction on magnetite in presence of γ irradiation follows a Lagergren’s
pseudo first order kinetic model with respect to the applied dose. The extent of
chromate reduction with increasing magnetite amount indicates that the process is a
surface phenomenon.
10) XPS data has shown a difference in the surface composition of magnetite equilibrated
with chromate due to the effect of irradiation as compared to that of isothermal
equilibration.
11) Elution of nano pure water through various NLWBAs has shown that there is a
leachout of nitric acid from the NLWBA. The fitting of the experimental data to the
first order decrease of the leaching rate has shown a good agreement upto 20% initial
loading of the WBA. At higher loadings the leaching follows multiple mode behavior.
12) Recirculation of nitric acid solution through WBA and nano pure water through
NLWBAs has shown that the leaching of nitric acid is governed by the equilibrium
effect.
13) Gd(NO3)3 removal using a SAC topped mixed bed of SAC and WBA column led to
high column outlet pHs during initial stages of the run.
14) SAC topped mixed bed of SAC and WBA has given better result for Gd removal as
compared to a similar composition mixed bed under identical conditions in terms of
the pH profile.
15) Use of a 5% NLWBA under the given flow velocity and the given available resin
capacity has led to efficient removal of Gd while adhering to the technical
specification of pH to remain between 5.0-5.5.
References:
[1] J. A. Ayres, Decontamination of Nuclear Reactors and Equipments, Ronald Press, New
York, (1970).
[2] K. S.Venkateswarulu, Water Chemistry - Industrial and Power Station Water
Treatment, New Age International (P) Limited, Publishers, New Delhi (1998).
[3] J. A. Sawicki, Journal of Nuclear Materials, 419 (2011) 85.
[4] I. ul Haq, N. Cinosi, M. Bluck, G. Hewitt and S. Walker, Nuclear Engineering and
Design, 241 (2011) 155.
[5] R. L. Tapping, Journal of Nuclear Materials, 383 (2008) 1.
xxvii
[6] Coolant Technology of Water Cooled Reactors, Vol. 3, IAEA, Vienna, October 1992,
IAEA-TECDOC-667.
[7] Decontamination Handbook, EPRI, Palo Alto, CA: July 1999. TR-112352.
[8] C. J. Wood, Progress in Nuclear Energy, 23 (1990) 35.
[9] J. Manjanna, and G. Venkateswaran, Ind. Eng. Chem. Res., 41 (2002) 3053.
[10] V. M. Bhandari, V. A. Juvekar, S. R. Patwardhan, Ind. Eng. Chem. Res., 31 (1992)
1060.
[11] M. G. Segal and R. M. Sellers, J. Chem. Soc., Faraday Trans., 78 (1982) 1149.
[12] K. Kim, H. J. Lee, M. Choi, D. W. Kang and S. Inoue, Nuclear Engineering and
Design, 229 (2004) 91.
[13] K. Asahi, M. Kitamura, E. Ibe, Y. Asakura, and S. Uchida, Nuclear Science and
Engineering, 95 (1987) 257.
[14] M. Vijayakumar, L. Li, G. Graff, J. Liu, H. Zhang, Z. Yang and J. Z. Hu, J Power
Sources, 196 (2011) 3669.
[15] E. Demirbas, M. Kobya, E. Senturk, and T. Ozkan, Water SA, 30 (2004) 533.
xxviii
List of Figures
Fig. No. Figure Caption Page No.
------------- ----------------------------------------------------------------------- ----------
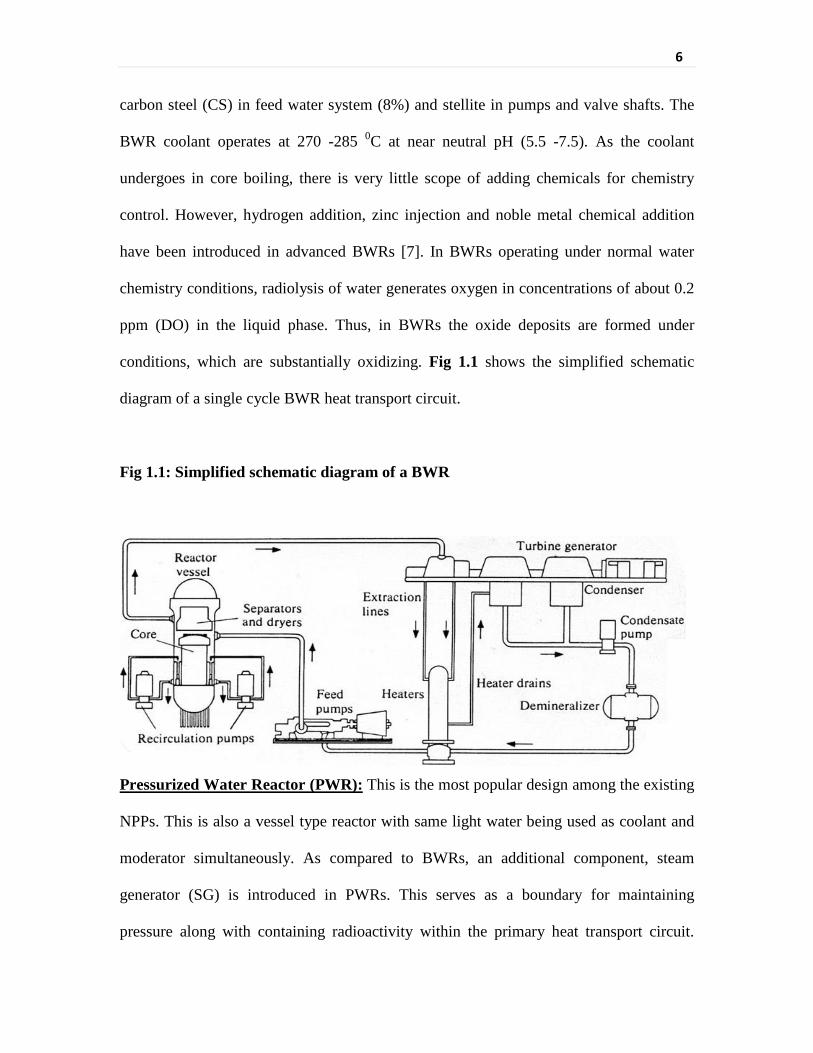
Fig 1.1 Simplified schematic diagram of a BWR 6
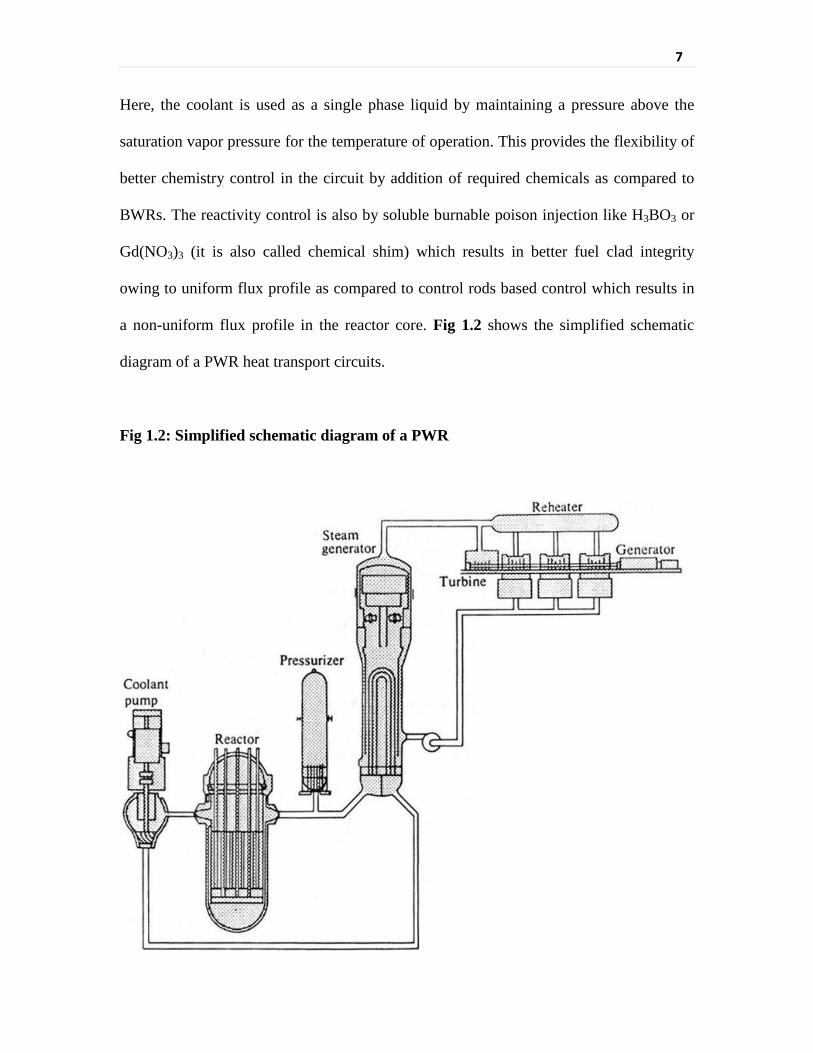
Fig 1.2 Simplified schematic diagram of a PWR 7
Fig 1.3 Simplified schematic diagram of a PHWR 9
Scheme 1.1 Possible oxidized species of iron under aqueous environment 12
Fig 1.4 Nature of oxides formed on the BWR, PWR and PHWR
primary circuits and steam generators
14
Fig 2.1 Design of the two compartment electrolysis cell separated by
an anion exchange membrane
46
Fig 2.2 Simulated setup of the moderator purification system of
TAPS 3 & 4
48
Fig 3.1 Conductivity and turbidity variation of V(V) formate
solution (two times acid)
75
Fig 3.2 Molar conductivity variation with concentration for
(A) V(V) in 2 times formic acid; (B) V(V) in 6 times formic
acid and (C) V(IV) in 6 times formic acid
76
Fig 3.3 Conductivity and turbidity variation of V(V) formate
solution (six times acid)
77
Fig 3.4 Conductivity, turbidity and density variation of V(IV)
formate solution
80
Fig 3.5 Tafel plots for various solutions on (A) stainless steel and
(B) glassy carbon and (C) graphite electrodes for (i) 0.5 mM
HCOOH; (ii) 1mM V(OH)(HCOO)2; (iii) 1mM
V(OH)(HCOO)2 with 0.5 mM HCOOH and (iv) 1 mM
V(OH)(HCOO)2 with 1 mM HCOOH
83
Fig 3.6 Cyclic Voltammograms of (A) 0.5 mM HCOOH, (B) 1 mM
V(OH)(HCOO)2, (C) solution of 0.5 mM HCOOH and
1 mM V(OH)(HCOO)2, (D) solution of 1 mM HCOOH and
87
xxix
1 mM V(OH)(HCOO)2 and (E) cyclic voltammograms of all
these solution at 10 mV/s scan rate on stainless steel
electrode.
Fig 3.7 Cyclic Voltammograms of (A) 0.5 mM HCOOH, (B) 1 mM
V(OH)(HCOO)2, (C) solution of 0.5 mM HCOOH and
1 mM V(OH)(HCOO)2, (D) solution of 1 mM HCOOH and
1 mM V(OH)(HCOO)2 and (E) cyclic voltammograms of all
these solution at 10 mV/s scan rate on glassy carbon
electrode.
88
Fig 3.8 Cyclic Voltammograms of (A) 0.5 mM HCOOH, (B) 1 mM
V(OH)(HCOO)2, (C) solution of 0.5 mM HCOOH and
1 mM V(OH)(HCOO)2, (D) solution of 1 mM HCOOH and
1 mM V(OH)(HCOO)2 and (E) cyclic voltammograms of all
these solution at 10 mV/s scan rate on graphite electrode.
89
Fig 3.9 Variation of peak current height with respect to the square
root of scan rate
92
Fig 3.10 Solution potential and current variations during the progress
of electrolysis
94
Fig 3.11 UV-visible spectra of vanadium samples dissolved in
nitrilotriacetic acid. 1) solid obtained by exceeding the
solubility of V5+ : HCOOH = 1 : 2 solution; 2) solid obtained
by exceeding the solubility of V5+ : HCOOH = 1 : 6 solution;
3) solid obtained by exceeding the solubility of
V4+ : HCOOH = 1 : 6 solution; 4) V3+ solid obtained by
electrolysis of V4+ formate; 5) Air oxidized V3+ precipitate
and 6) V2+ formate precipitated from zinc amalgam
98
Fig 3.12 UV-visible spectra of vanadium samples dissolved in citric
acid. 1) solid obtained by exceeding the solubility of V5+ :
HCOOH = 1 : 2 solution; 2) solid obtained by exceeding the
solubility of V5+ : HCOOH = 1 : 6 solution; 3) solid obtained
by exceeding the solubility of V4+ : HCOOH = 1 : 6 solution;
4) V3+ solid obtained by electrolysis of V4+ formate; 5) Air
oxidized V3+ precipitate and 6) V2+ formate precipitated from
zinc amalgam
99

xxx
Fig 3.13 UV – visible spectra of (A) V(IV); (B) V(III) and (C) V(II)
solids redissolved in nitrilotriacetic acid (NTA); Citric acid
(CA) and formic acid.
102
Fig 3.14 Typical chromatograms of (A) formate standard; (B) citric
acid dissolved vanadium formate solid and
(C) nitrilotriacetic acid dissolved vanadium formate solid
104
Fig 3.15 Thermogravimetric and differential thermal analysis plots for
V(IV) formate in air and nitrogen atmosphere
106
Fig 3.16 Thermogravimetric and differential thermal analysis plots for
V(III) formate in air and nitrogen atmosphere
107
Fig 3.17 Thermogravimetric and differential thermal analysis plots for
V(II) formate in air and nitrogen atmosphere
108
Fig 3.18 Infrared spectrum of A) solid obtained by exceeding the
solubility of V5+ : HCOOH = 1 : 6 solution; B) solid
obtained by exceeding the solubility of V4+ : HCOOH = 1 : 6
solution; C) Air oxidized V3+ precipitate D) V3+ solid
obtained by electrolysis of V4+ formate; and E) V2+ formate
precipitated from zinc amalgam; in KBr matrix
111
Fig 3.19 XPS spectra of vanadium and oxygen for A) solid obtained
by exceeding the solubility of V5+ : HCOOH = 1 : 6 solution;
B) solid obtained by exceeding the solubility of V4+ :
HCOOH = 1 : 6 solution; C) Air oxidized V3+ precipitate
D) V3+ solid obtained by electrolysis of V4+ formate; and
E) V2+ formate precipitated from zinc amalgam
116
Fig 3.20 XPS spectra of carbon for A) solid obtained by exceeding
the solubility of V5+ : HCOOH = 1 : 6 solution; B) solid
obtained by exceeding the solubility of V4+ : HCOOH = 1 : 6
solution; C) Air oxidized V3+ precipitate D) V3+ solid
obtained by electrolysis of V4+ formate; and E) V2+ formate
precipitated from zinc amalgam
117
Fig 3.21 XRD pattern of A) solid obtained by exceeding the solubility
of V5+ : HCOOH = 1 : 6 solution; B) solid obtained by
exceeding the solubility of V4+ : HCOOH = 1 : 6 solution;
C) V3+ solid obtained by electrolysis of V4+ formate; and
119

xxxi
D) V2+ formate precipitated from zinc amalgam
Fig 3.22 Comparison of the XRD pattern of V(IV) formate with the
matched reference
120
Fig 3.23 Comparison of the XRD pattern of V(II) formate with the
matched reference
121
Fig 4.1 Redox potential variation of vanadium formate solution
during electroreduction
135
Fig 4.2 UV-visible spectrum of the ferric sulfosalicylic acid complex
at pH 4.5
137
Fig 4.3 Variation in the concentration of various vanadium redox
species during controlled current electroreduction of V(V)
140
Fig 4.4 UV-visible spectra of V(II) and V(III) formate 141
Fig 4.5 Calibration plots of various V(II) and V(III) species 143
Fig 4.6 UV-visible spectra of V(II) and V(III) thiocynate 144
Fig 5.1 (A) Chromate removal on magnetite with varying
temperature (50 ml of 2 mM chromate solution equilibrated
with 1.0 g of magnetite) (B) Lagergren’s pseudo first order
kinetic model fitting for sorption of 50 ml of 10 mM
chromate on 1 g of magnetite
149
Fig 5.2 XRD pattern of (A) pure magnetite, (B) magnetite treated
with chromate at 60 oC and (C) magnetite treated with
chromate at 350 KGy gamma dose.
151
Fig 5.3 Cr 2p3/2 photoelectron peak from the magnetite samples
treated with chromate at different temperatures.
152
Fig 5.4 Deconvolution of Cr 2p3/2 peak to show that Cr resides in a
lattice similar to Cr2O3
153
Fig 5.5 Fe 2p photoelectron peak from the magnetite samples treated
with chromate at different temperature
154
Fig 5.6 (A) Chromate sorption on magnetite under gamma
irradiation (25 ml of 2.0 mM chromate solution was
equilibrated with 0.5 g of magnetite at each dose).
(B) Lagergren’s pseudo first order kinetic model fitting for
chromate reduction with respect to dose.
156
Fig 5.7 (A) Lagergren’s pseudo first order kinetic model fitting for 158

xxxii
chromate reduction on magnetite with respect to varying
dose rates. (B) Variation in the rate constants obtained with
varying dose rates
Fig 5.8 Cr 2p photoelectron peak from the magnetite samples treated
with chromate at different radiation doses
160
Fig 5.9 Fe 2p photoelectron peak from the magnetite samples treated
with chromate at different radiation doses
162
Fig 5.10 O1s photoelectron spectra for magnetite equilibrated with
chromate under different conditions
163
Fig 5.11 (A) Cr 2p3/2 , (B) Fe 2p and (C) O 1s photopeak
deconvolution from Magnetite after exposure in Chromate
with irradiation 350 kGy
165
Fig 6.1 pH variation during (A) removal of 4 mg kg-1 Gd and
(B) removal of 15 mg kg-1 Gd with a SAC topped mixed bed
185
Fig 6.2 Conductivity variation during (A) removal of 4 mg kg-1 Gd
and (B) removal of 15 mg kg-1 Gd with a SAC topped mixed
bed
186
Fig 6.3 Gadolinium concentration variation during (A) removal of
4 mg kg-1 Gd and (B) removal of 15 mg kg-1 Gd with a SAC
topped mixed bed
187
Fig 6.4 Variation of pH during 15 mg kg-1 Gd removal using a
mixed bed of SAC and WBA
190
Fig 6.5 pH variation during (A) removal of 4 mg kg-1 Gd and
(B) removal of 15 mg kg-1 Gd with a SAC topped mixed bed
followed by a 5% NLWBA
192
Fig 6.6 Conductivity variation during (A) removal of 4 mg kg-1 Gd
and (B) removal of 15 mg kg-1 Gd with a SAC topped mixed
bed followed by a 5% NLWBA
193
Fig 6.7 Gadolinium concentration variation during (A) removal of
4 mg kg-1 Gd and (B) removal of 15 mg kg-1 Gd with a SAC
topped mixed bed followed by a 5% NLWBA
194

xxxiii
List of Tables
Table. No. Table Caption Page No.
------------- ----------------------------------------------------------------------- -------------
Table 1.1 Major construction material used in coolant circuits 3
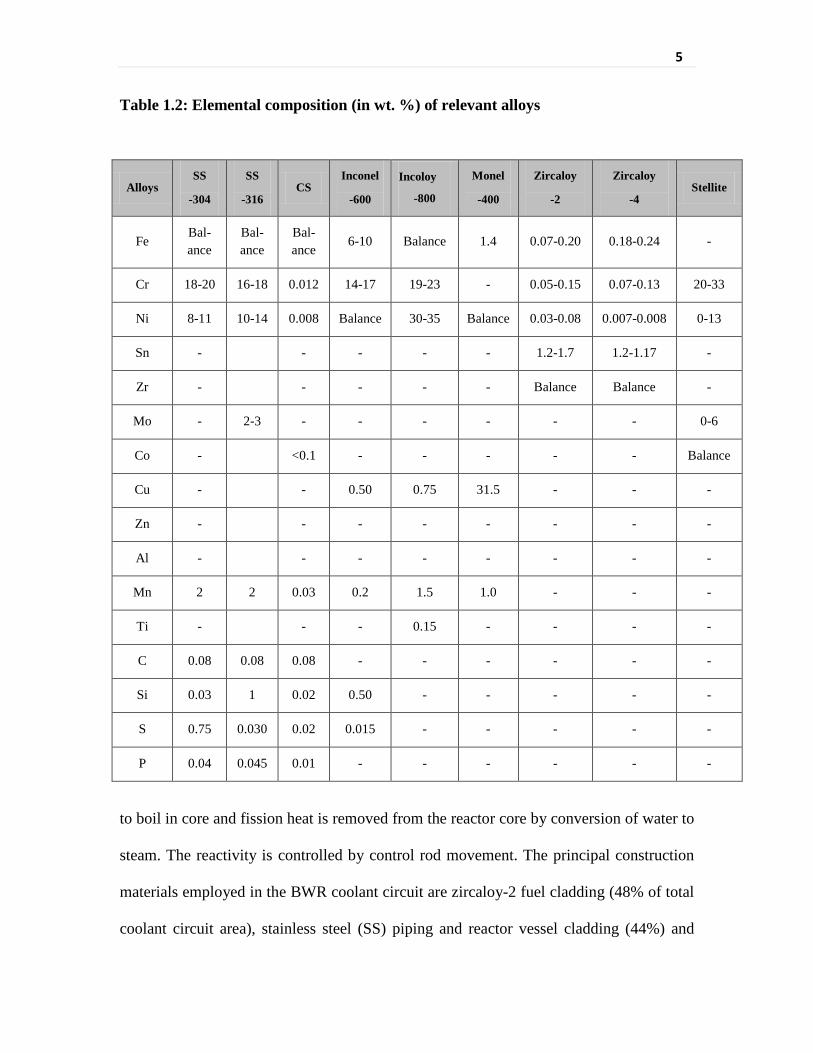
Table 1.2 Elemental composition (in wt. %) of relevant alloys 5
Table 1.3 Prevalent radionuclides found in primary heat transport
circuits of NPPs
16
Table 1.4 Standard Redox potentials (written using reduction
potential convention) of some of the reagents suitable for
use in decontamination formulations
28
Table 1.5 Stability constant values of different metal ions with the
some of the ligands
29
Table 3.1 Electrochemical parameters evaluated by analysis of Tafel
plots on Stainless steel (SS304L) electrode
84
Table 3.2 Electrochemical parameters evaluated by analysis of Tafel
plots on glassy carbon electrode
84
Table 3.3 Electrochemical parameters evaluated by analysis of Tafel
plots on graphite electrode
84
Table 3.4 AAS elemental analysis of solids dissolved in ultrapure
nitric acid
96
Table 3.5 ICP-AES elemental analysis of solids dissolved in
ultrapure nitric acid
97
Table 3.6 Calculated weight ratio of vanadium and formate and mole
ratio of formate with respect to vanadium in the sodium
and zinc formate corrected vanadium compound
105
Table 3.7 XPS Peak values of various vanadium solids 115
Table 3.8 Unit cell parameters of V(IV) formate obtained by
indexing the XRD pattern
123
Table 3.9 Unit cell parameters of V(III) formate obtained by
indexing the XRD pattern
124
xxxiv
Table 3.10 Unit cell parameters of V(II) formate obtained by indexing
the XRD pattern
126
Table 4.1 Results of analysis of V(III)-V(IV) mixture (triplicate
analysis)
138
Table 4.2 Results of analysis of V(II)-V(III) mixture (triplicate
analysis)
138
Table 4.3 Results of analysis of V(II)-V(III) mixture (triplicate
analysis)
142
Table 5.1 Cr 2p3/2 and Fe 2p3/2 binding energy values obtained from
magnetite equilibrated with chromate solution at different
temperature
153
Table 5.2 Sorption of 25 ml of 2 mM chromate on varying magnetite
amount at 200 kGy dose
157
Table 5.3 Cr 2p3/2 and Fe 2p3/2 binding energy values obtained from
magnetite in chromate solution exposed at different
gamma doses
161
Table 5.4 Results from deconvolution of Cr 2p3/2, Fe 2p and O 1s
photoelectron peaks from magnetite after exposure in
chromate with irradiation to 350 kGy dose
164
Table 6.1 Parameters obtained by fitting various modes of leaching
to the outlet conductivity of once through elution with
high purity water through WBA resin columns loaded with
NLWBA mixed with fresh WBA to different extents
175
Table 6.2 Parameters obtained by fitting the experimental outlet
conductivity data of elution of varying inlet pH solutions
through different columns loaded with nitric acid loaded
weak base anion exchanger mixed with fresh WBA to
different extents in a once through mode
178
Table 6.3 Parameters obtained by fitting the experimental bulk
conductivity data of recirculation of initially pure water
through columns loaded with nitric acid loaded weak base
anion exchanger mixed with fresh weak base anion
exchanger to different extents
180
Table 6.4 Parameters obtained by fitting the experimental bulk 181

xxxv
conductivity data of recirculation of different
concentrations of nitric acid solution through fresh weak
base anion exchange columns
1
CHAPTER-1
Introduction
Nuclear energy is a clean source of electrical power. Water cooled reactors
constitute more than 95% of the total nuclear power plants (NPPs) in the world. The
favourable properties of water to be used as the coolant medium varies with temperature
and pressure [1]. The natural pH of water decreases with increasing temperature and this
makes it a more corrosive medium at higher temperatures. Corrosive coolant in NPPs can
lead to several specific issues [2] namely:
• damaging the integrity of the boundaries restricting radioactivity such as fuel clad
and primary circuit materials;
• increasing the out-of-core radiation fields, and thus influencing man rem budgeting;
• increasing the formation of deposits, which may reduce the heat transfer and
enhance localized corrosion processes.
Thus, the water chemistry control is imperative for achieving a considerable
operational life for a NPP. Water chemistry is controlled to minimize contaminant
concentration and to mitigate loss of material due to general, crevice, pitting, and flow-
accelerated corrosion and cracking caused by stress corrosion cracking (SCC). Water
chemistry controls have been specified for the existing water cooled reactors for the
different stages like normal operations, startups, shutdown and abnormal operation [3].
For Boiling Water Reactors (BWRs), maintaining high purity of water reduces
susceptibility to SCC. For Pressurized Water Reactors (PWRs) and Pressurized Heavy
2
water Reactors (PHWRs), additives are used for reactivity control and to control the pH
conditions to inhibit corrosion.
There is always a certain minimum amount of corrosion of structural materials in
spite of maintaining optimum water chemistry parameters of the coolant/moderator [4].
The solubilized/suspended corrosion products get activated as they pass through the
reactor core and deposit at various locations based on their solubility at a particular
temperature and water chemistry regime.
Modified and newer water chemistry regimes have been applied in operating
plants to reduce radioactivity buildup, to be able to use extended fuel cycles (higher
burnup), and to apply effective remedies for existing corrosion problems (plant life
extension). Zinc dosage in PWR and BWR plants, noble metal addition in BWRs,
hydrazine dosage to primary coolant in Vado-Vodyannoy Energeticheskiyr Reactor
(VVER) plants, optimization of pH and boron/lithium or potassium ions ratio in primary
coolant with regard to high fuel enrichment and extended fuel cycles are examples of
these modifications. Thus, water chemistry of NPPs is an active field of research which
immensely contributes towards their better performance.
This chapter discusses structural materials and water chemistry of water cooled
reactors, oxide growth and activity transport issues of NPPs along with general methods
of decontamination and the scope of work undertaken in this desertation.
1.1 Structural materials and water chemistry controls of water cooled reactors
The heat transport circuits for water cooled reactors consist of several different
structural materials constituting the various components of the circuit. Each component is
3
made up of the best suited material for its functional requirement which includes
considerations for requirements of neutron economy, material strength, heat transfer
efficiency and corrosion resistance. The selection of material for the components of heat
transport circuit has undergone continuous revision based on the experience of operation
and development of better materials. The major component changes are the steam
generator tubes (from Monel-400 to Incoloy-800), condenser tubes (from admiralty brass
to stainless steel 316-L for in land water cooling and aluminum brass and cupronickel to
titanium for sea water cooling), Moderator heat exchanger (from cupro-nickel to stainless
steel 316-L) and coolant tube material (from zircalloy-2 to zirconium-2.5% niobium) [5].
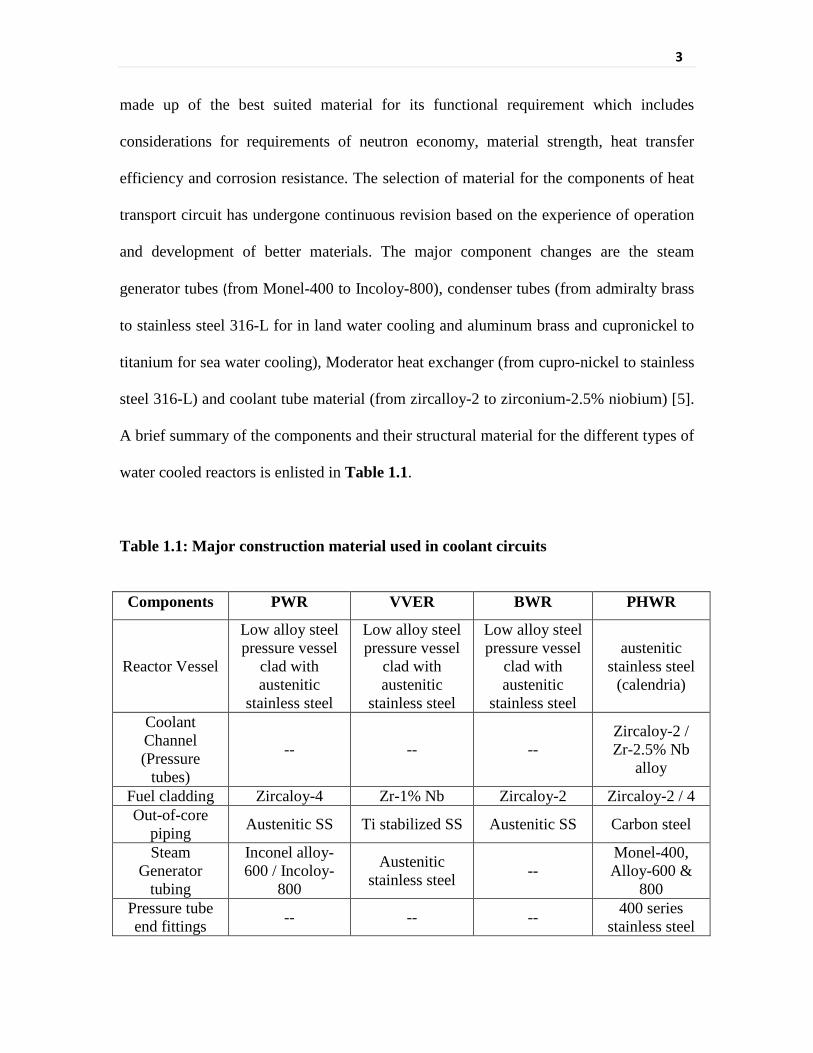
A brief summary of the components and their structural material for the different types of
water cooled reactors is enlisted in Table 1.1.
Table 1.1: Major construction material used in coolant circuits
Components PWR VVER BWR PHWR
Reactor Vessel
Low alloy steel pressure vessel
clad with austenitic
stainless steel
Low alloy steel pressure vessel
clad with austenitic
stainless steel
Low alloy steel pressure vessel
clad with austenitic
stainless steel
austenitic stainless steel
(calendria)
Coolant Channel (Pressure
tubes)
-- -- -- Zircaloy-2 / Zr-2.5% Nb
alloy
Fuel cladding Zircaloy-4 Zr-1% Nb Zircaloy-2 Zircaloy-2 / 4 Out-of-core
piping Austenitic SS Ti stabilized SS Austenitic SS Carbon steel
Steam Generator
tubing
Inconel alloy-600 / Incoloy-
800
Austenitic stainless steel --
Monel-400, Alloy-600 &
800 Pressure tube end fittings -- -- -- 400 series
stainless steel
4
The nature of corrosion product formed in the heat transport circuits of NPPs depend
upon the surface area of the structural materials exposed to the medium under the existing
dynamic hydrothermal conditions. The major share of surface area in the primary heat
transport circuit comes from the steam generator tubes in case of PWRs and PHWRs
whereas stainless steel and zircaloy constitute the major share of surface area in case of
BWRs [6]. The nature of the corrosion products formed by the interaction of coolant
depends upon the composition of the structural materials. The elemental composition of
the relevant metal alloys used in water-cooled nuclear reactors is shown in Table 1.2.
The different coolant chemistry parameters such as pH, dissolved oxygen,
conductivity etc., are maintained based on the compatibility of coolant with the structural
material in terms of corrosion and heat transfer efficiency and the type of reactor.
Chemistry control for NPPs varies with the designed hydrothermal conditions. While in
BWRs the reactor vessel itself acts as a steam generator, in PWRs and PHWRs the
primary coolant transfers the acquired fission heat through a set of separate steam
generators (SG) to the secondary coolant (light water). Thus, in BWR recirculation
system, the coolant exists in two phases (liquid and steam) while in PWRs and PHWRs,
the coolant exists in single phase in the primary heat transport system.
A brief design overview of these NPPs and the resulting water chemistry controls is
discussed hereunder:
Boiling Water Reactor (BWR): It is a vessel type reactor where light water is used as
the coolant medium which concurrently acts as the moderator as well. Water is allowed
5
Table 1.2: Elemental composition (in wt. %) of relevant alloys
Alloys SS
-304
SS
-316 CS
Inconel
-600
Incoloy
-800
Monel
-400
Zircaloy
-2
Zircaloy
-4 Stellite
Fe Bal-ance
Bal-ance
Bal-ance
6-10 Balance 1.4 0.07-0.20 0.18-0.24 -
Cr 18-20 16-18 0.012 14-17 19-23 - 0.05-0.15 0.07-0.13 20-33
Ni 8-11 10-14 0.008 Balance 30-35 Balance 0.03-0.08 0.007-0.008 0-13
Sn - - - - - 1.2-1.7 1.2-1.17 -
Zr - - - - - Balance Balance -
Mo - 2-3 - - - - - - 0-6
Co - <0.1 - - - - - Balance
Cu - - 0.50 0.75 31.5 - - -
Zn - - - - - - - -
Al - - - - - - - -
Mn 2 2 0.03 0.2 1.5 1.0 - - -
Ti - - - 0.15 - - - -
C 0.08 0.08 0.08 - - - - - -
Si 0.03 1 0.02 0.50 - - - - -
S 0.75 0.030 0.02 0.015 - - - - -
P 0.04 0.045 0.01 - - - - - -
to boil in core and fission heat is removed from the reactor core by conversion of water to
steam. The reactivity is controlled by control rod movement. The principal construction
materials employed in the BWR coolant circuit are zircaloy-2 fuel cladding (48% of total
coolant circuit area), stainless steel (SS) piping and reactor vessel cladding (44%) and
6
carbon steel (CS) in feed water system (8%) and stellite in pumps and valve shafts. The
BWR coolant operates at 270 -285 0C at near neutral pH (5.5 -7.5). As the coolant
undergoes in core boiling, there is very little scope of adding chemicals for chemistry
control. However, hydrogen addition, zinc injection and noble metal chemical addition
have been introduced in advanced BWRs [7]. In BWRs operating under normal water
chemistry conditions, radiolysis of water generates oxygen in concentrations of about 0.2
ppm (DO) in the liquid phase. Thus, in BWRs the oxide deposits are formed under
conditions, which are substantially oxidizing. Fig 1.1 shows the simplified schematic
diagram of a single cycle BWR heat transport circuit.
Fig 1.1: Simplified schematic diagram of a BWR
Pressurized Water Reactor (PWR): This is the most popular design among the existing
NPPs. This is also a vessel type reactor with same light water being used as coolant and
moderator simultaneously. As compared to BWRs, an additional component, steam
generator (SG) is introduced in PWRs. This serves as a boundary for maintaining
pressure along with containing radioactivity within the primary heat transport circuit.
7
Here, the coolant is used as a single phase liquid by maintaining a pressure above the
saturation vapor pressure for the temperature of operation. This provides the flexibility of
better chemistry control in the circuit by addition of required chemicals as compared to
BWRs. The reactivity control is also by soluble burnable poison injection like H3BO3 or
Gd(NO3)3 (it is also called chemical shim) which results in better fuel clad integrity
owing to uniform flux profile as compared to control rods based control which results in
a non-uniform flux profile in the reactor core. Fig 1.2 shows the simplified schematic
diagram of a PWR heat transport circuits.
Fig 1.2: Simplified schematic diagram of a PWR
8
The principal materials in PWR primary circuit are Zircaloy-4 fuel cladding
(20%), Inconel-600/800 steam generator tube (75%), SS piping, reactor vessel cladding
(5%) and cobalt base alloy as valve seats and hard facing materials. The primary coolant
circulating system contains boric acid (~1200 ppm at starting and in operation during the
end of the cycle) and lithium hydroxide (0.2 - 2.0 ppm) to maintain pH ~10.5. Hydrogen
is added and maintained in the coolant to control oxygen concentration at <0.01 ppm
during reactor operation [8]. This creates a reducing atmosphere and thus the oxides on
PWR surfaces are formed under predominantly reducing conditions. The system operates
at a temperature of 270 - 315 0C and there is no in-core boiling of the coolant. In PWRs, a
large fraction of the primary loop is Inconel-600 / Incoloy-800 and a significant portion
consists of SS. Therefore a different kind of film is formed on PWR primary loop
surfaces. The film is relatively thin (1-2.5 µm), dense, uniform and is quickly formed
initially but later the rate of growth decreases substantially.
Pressurized Heavy Water Reactor (PHWR): The PHWR is among the safest designs
of the commercial NPPs. It is a channel type reactor with separate coolant and moderator
circuits. Heavy water is used in the primary heat transport circuit as well as moderator
circuit. The primary heat transport circuit is the high temperature circuit and hence the
chemistry control for minimizing corrosion is practiced in this circuit. The moderator
circuit is a low temperature circuit and hence a high isotopic purity heavy water is
maintained in this circuit. The neutron poisons for chemical shim is added in moderator
as per the operational requirement. The PHWR primary circuit uses several materials
such as zirconium alloys for fuel cladding and pressure tubes comprising about 13% of
the total surface area of the primary coolant circuit. A large fraction (77%) of primary
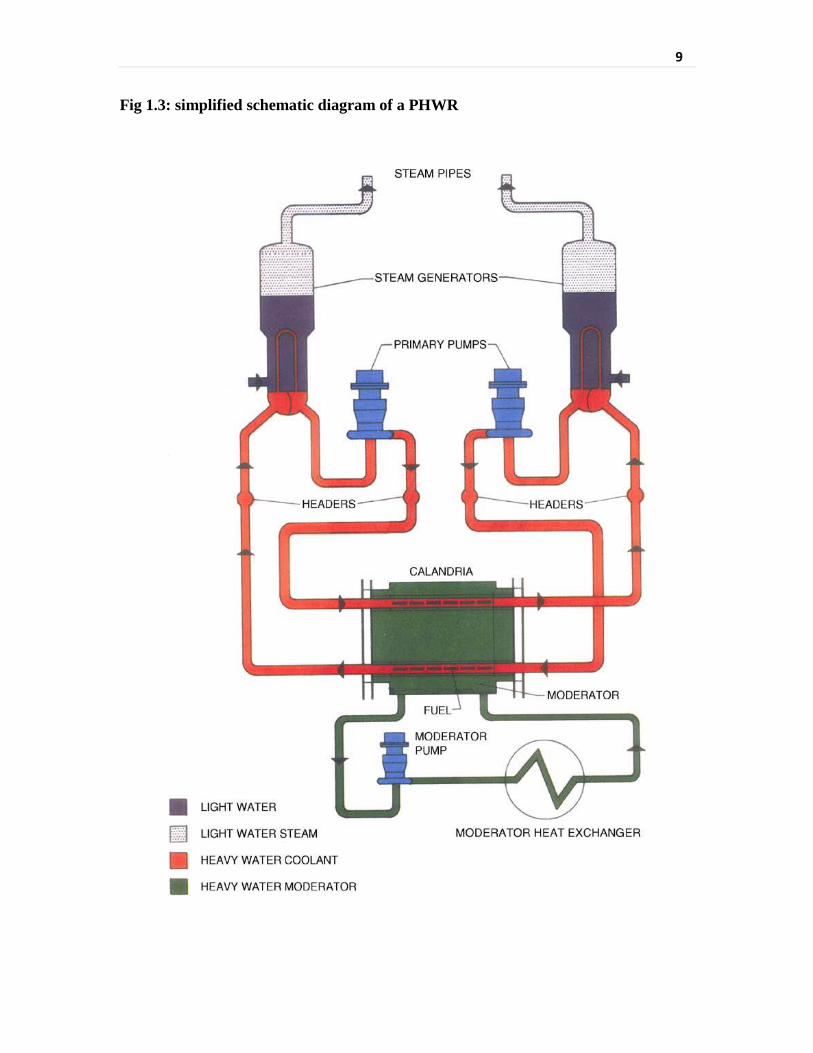
9
Fig 1.3: simplified schematic diagram of a PHWR

10
coolant loop is made up of Monel/Incoloy-800 SG tubes, which are used in the SG and
other heat exchangers. The use of carbon steel (~10%) for piping and vessel-shells is an
inherent feature of the design. The chemistry of the primary coolant in PHWR resembles
that of PWR in the sense that in both alkaline and deoxygenated conditions are
maintained. The major difference is that in PHWRs the chemical shim control of
reactivity is confined in a separate moderator circuit by addition of soluble neutron
poisons like boron or gadolinium. The coolant does not contain any neutron poison and
its pH is ~ 10.5, as measured at room temperature [9]. Fig 1.3 shows the moderator and
coolant circuit of primary system of a typical PHWR.
1.2 Oxide growth and activity transport in nuclear power plants
1.2.1 Corrosion products of iron in aqueous medium
Iron is the major constituent of the coolant circuit and thus its corrosion products
play an important role in deposit formation. Ferrous hydroxide is the initial product
resulting from the interaction of water with iron at low temperatures [2]:
Fe → Fe2+ + 2e− (1.1)
(Anodic reaction)
2e− + 2H2O → 2OH− + H2 (1.2)
(Cathodic reaction in absence of oxygen)
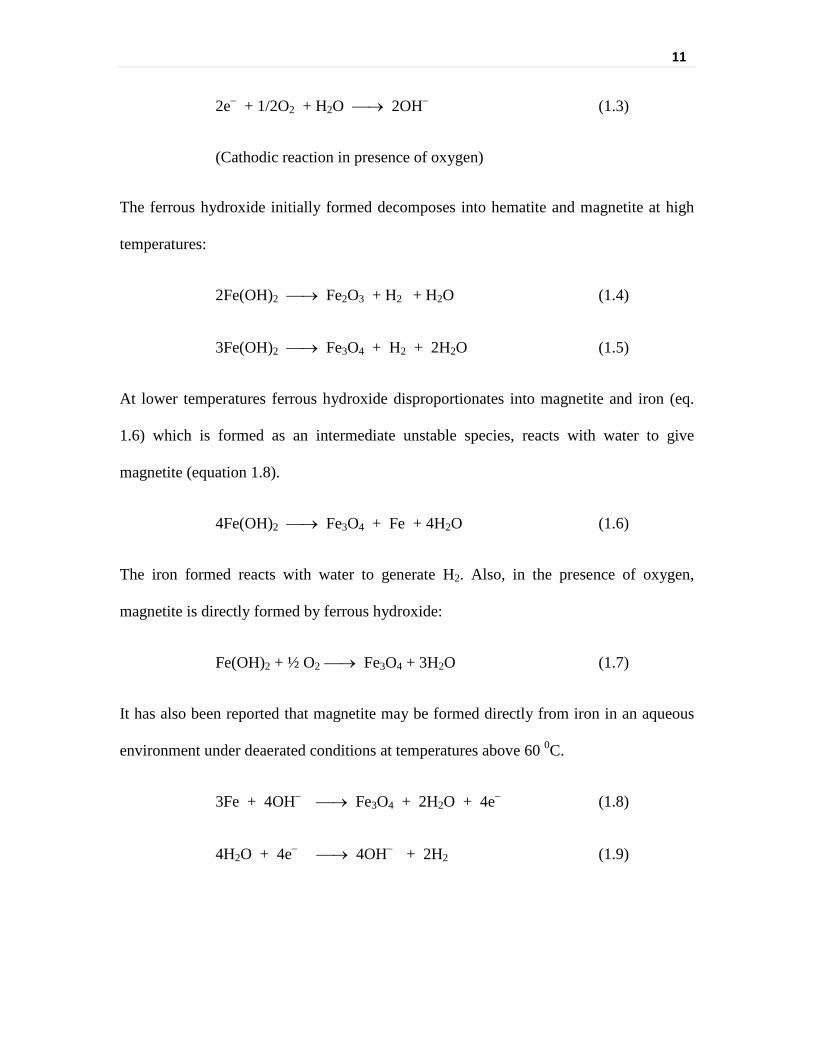
11
2e− + 1/2O2 + H2O → 2OH− (1.3)
(Cathodic reaction in presence of oxygen)
The ferrous hydroxide initially formed decomposes into hematite and magnetite at high
temperatures:
2Fe(OH)2 → Fe2O3 + H2 + H2O (1.4)
3Fe(OH)2 → Fe3O4 + H2 + 2H2O (1.5)
At lower temperatures ferrous hydroxide disproportionates into magnetite and iron (eq.
1.6) which is formed as an intermediate unstable species, reacts with water to give
magnetite (equation 1.8).
4Fe(OH)2 → Fe3O4 + Fe + 4H2O (1.6)
The iron formed reacts with water to generate H2. Also, in the presence of oxygen,
magnetite is directly formed by ferrous hydroxide:
Fe(OH)2 + ½ O2 → Fe3O4 + 3H2O (1.7)
It has also been reported that magnetite may be formed directly from iron in an aqueous
environment under deaerated conditions at temperatures above 60 0C.
3Fe + 4OH− → Fe3O4 + 2H2O + 4e− (1.8)
4H2O + 4e− → 4OH− + 2H2 (1.9)
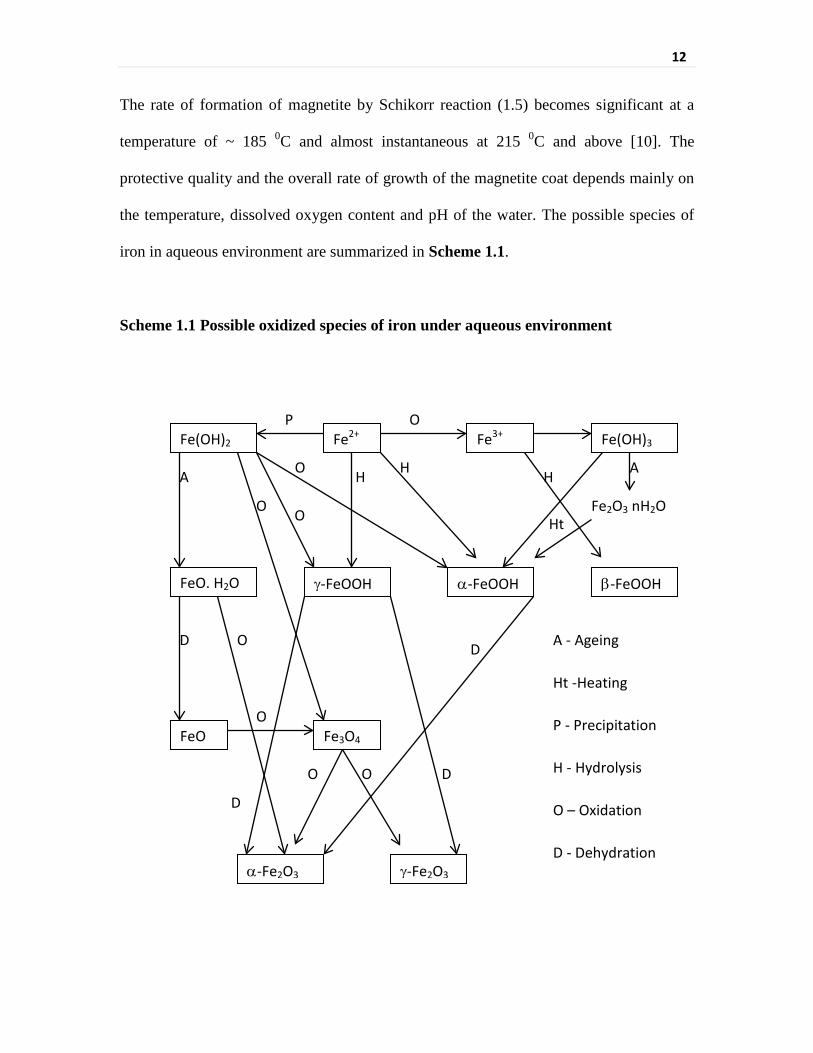
12
The rate of formation of magnetite by Schikorr reaction (1.5) becomes significant at a
temperature of ~ 185 0C and almost instantaneous at 215 0C and above [10]. The
protective quality and the overall rate of growth of the magnetite coat depends mainly on
the temperature, dissolved oxygen content and pH of the water. The possible species of
iron in aqueous environment are summarized in Scheme 1.1.
Scheme 1.1 Possible oxidized species of iron under aqueous environment
Fe2O3 nH2O
Fe(OH)2 Fe2+ Fe3+ Fe(OH)3
γ-FeOOH α-FeOOH β-FeOOH FeO. H2O
FeO Fe3O4
α-Fe2O3 γ-Fe2O3
P O
A H
Ht
H H O
O O
A
D O
O
D
D
O
D
O
A - Ageing
Ht -Heating
P - Precipitation
H - Hydrolysis
O – Oxidation
D - Dehydration
13
Thus the factors that most strongly influence the types of corrosion film are the
structural materials and the coolant chemistry environment. The corrosion film is also
affected by the presence of other structural materials [11].
1.2.2 Process of deposition of corrosion products
The interaction of high temperature coolant with structural materials results in the
formation of corrosion products with incorporation of varying degree of substitutional
elements released from the different alloys. The thickness, composition, protective
nature, porosity and elemental depth variation of deposits also depend on water chemistry
condition during reactor operation. Consolidation model has been used to explain the
process of deposition. Turner and Klimas derived a consolidation model based on a two-
layer deposit with a labile portion and a consolidated portion [12]. It assumed that the
portions interacted with each other, leading to the model expression. Lister and Cussac
have shown that transients behave differently from steady accumulations in case of bulk
boiling [13]. They have proposed a comprehensive model which included microlayer
evaporation, particle filtering through rings of deposit, particle trapping at the surface of
growing bubbles, and an increase in concentration at bubble nucleation sites by a
pumping action as bubbles deposit are considered.
In general, the oxide film formed on the inner surfaces of primary system can be
considered to be of two types: the ‘grown-on’ protective oxides which are usually thick
but strongly adherent to the base metal (inner layer) and the loose ‘deposited’ oxides
which overlay the grown oxide (outer layer). Generally grown-on oxide constitutes the
thin inner layer of the oxide deposit. In the case of PWR/ BWRs, grown-on oxides are
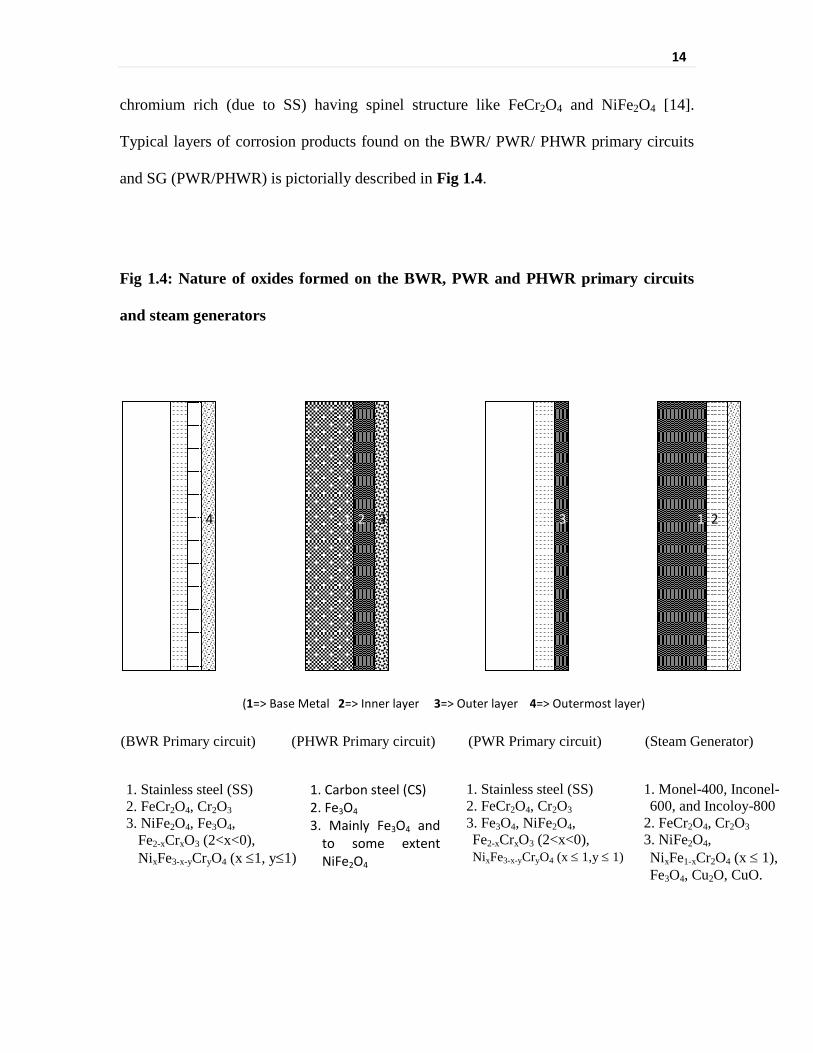
14
chromium rich (due to SS) having spinel structure like FeCr2O4 and NiFe2O4 [14].
Typical layers of corrosion products found on the BWR/ PWR/ PHWR primary circuits
and SG (PWR/PHWR) is pictorially described in Fig 1.4.
Fig 1.4: Nature of oxides formed on the BWR, PWR and PHWR primary circuits
and steam generators
1. Stainless steel (SS) 2. FeCr2O4, Cr2O3 3. NiFe2O4, Fe3O4,
Fe2-xCrxO3 (2<x<0), NixFe3-x-yCryO4 (x ≤1, y≤1)
4 F O
1. Carbon steel (CS) 2. Fe3O4 3. Mainly Fe3O4 and
to some extent NiFe2O4
1. Stainless steel (SS) 2. FeCr2O4, Cr2O3 3. Fe3O4, NiFe2O4, Fe2-xCrxO3 (2<x<0), NixFe3-x-yCryO4 (x ≤ 1,y ≤ 1)
1. Monel-400, Inconel-600, and Incoloy-800
2. FeCr2O4, Cr2O3 3. NiFe2O4, NixFe1-xCr2O4 (x ≤ 1), Fe3O4, Cu2O, CuO.
(1=> Base Metal 2=> Inner layer 3=> Outer layer 4=> Outermost layer)
((BWR Primary circuit) (PHWR Primary circuit) (PWR Primary circuit) (Steam Generator)
1 2 3 4 1 2 3 1 2 3 1 2
15
Although the exact chemical composition of the oxide can vary from system to
system and within the same system from one location to another, some generalizations
are possible. In the case of PHWRs, the deposits on the CS surfaces are largely made-up
of Fe3O4 and very minor amount of nickel ferrite. An oxide (mostly magnetite) film of
40-50 µm thickness had been observed on the CS surfaces that have seen about 10 years
of operation. On the other hand, in the case of BWRs and PWRs, the reactor vessel and
the piping surfaces in the primary circuit are made-up of SS-304, cladded carbon steel
and the oxide deposits on these surfaces are a mixture of Fe, Cr and Ni containing spinels
/ inverse spinels oxides.
1.2.3 Radiation field build-up
The soluble as well as particulate matter (crud) released from the base metal pass
through the reactor core along with the coolant. During their passage through the core,
the nuclides of the corrosion products undergo neutron activation (thermal and fast
neutron) due to the presence of high neutron flux in the core, resulting in the generation
of activated corrosion products (ACPs). These ACP can get redeposited on the out-of-
core surfaces; thereby causing radiation exposure to the personnel involved in the
maintenance tasks in the primary heat transport system areas [15]. The fission products
(FPs), most of which are radioactive and are formed during the operation of nuclear
power plant, are commonly contained within the fuel clad and are released only if the
clad develops a defect.

16
Table 1.3 shows some of the major contributing ACPs and FPs. Although, a big
list of radionuclide is identified as contaminants, in most of the reactors 60Co (t1/2 5.27 y,
γ 1.17 and 1.33 MeV) and 58Co (t1/2 71.3 d, γ 0.811 MeV) with their long life and high
gamma energies are dominant among all the activated corrosion products and are of
potential concern [16].
Table 1.3: Prevalent radionuclides found in primary heat transport circuits of NPPs
Radio-nuclides t1/2 (days) Source (generation)
Corrosion products
60Co 1900 59Co(n,γ)
58Co 72 58Ni(n,p)
51Cr 273 50Cr(n, γ)
59Fe 45 58Fe(n,γ)
54Mn 310 54Fe(n,γ)
65Zn 244 64Zn(n,γ)
124Sb 60 123Sb(n,γ)
Fission Products
144Ce 290 U(n,f)
95Zr 63.3 U(n,f) & 94Zr(n,γ)
140La - U(n,f)
95Nb 35 95Zr→ (β- decay)
137Cs 11000 U(n,f)
106Ru 365 U(n,f)

17
Based on a study made from the data collected from different nuclear power
plants, the contribution to the personnel exposure from various isotopes are
60Co, 58Co 80-85 %
59Fe, 54Mn, 51Cr 5-10 %
Fission products 10 %
1.2.4 Mechanism of Radioactivity build-up
Radionuclides are incorporated in the surface oxide layer by several mechanisms.
The major routes of radionuclide incorporation in oxide layer are [17]:
Direct corrosion reaction: Oxide formation by the direct corrosion reaction of the base
metal with the aqueous medium can be represented as:
3 Fe + 4 H2O → Fe3O4 + 4 H2 (1.10)
2 Fe + Co + 4H2O → CoFe2O4 + 4 H2 (1.11)
Ion-exchange Mechanism: These are decided by the site preference energies and the
lattice stabilization brought out by ion exchange.
[Fe3+]t [Fe2+Fe3+]o O4 + Co2+ → [Fe3+]t [Co2+Fe3+]o O4 + Fe2+ (1.12)
Adsorption: The charge acquired by the oxide surface is responsible for electrostatically
attracting an oppositely charged species in solution causing its adsorption onto the oxide
surface. This can be represented as ζ = k (pzc – pH) where ζ is the zeta potential on the
oxide surface which is a measure of the surface charge, ‘pzc’ is the pH at which the oxide

18
surface shows zero charge and pH defines the experimental H+ concentration in solution.
A typical adsorption can be represented as
−M−H + Co(OH)+ → −M−O−Co(OH) + H+ (1.13)
The adsorbed species can subsequently undergo an ion-exchange process with the rest of
the oxide, thereby resulting in bulk incorporation of exchanged metal-ion. This of course
depends on the lattice stabilization brought about by the exchange process.
Co-precipitation: The corrosion product existing in coolant can get deposited onto the
base metal as a result of solubility/super solubility consideration. The subsequent
interaction of the deposited species with the oxide surface depends on the thermodynamic
stabilization brought as a result of such interaction. Otherwise the surface will contain a
mixture of different metal ions.
Isotopic exchange: An inactive metal ion in the oxide surface can undergo isotopic
exchange with its active isotope in solution. For e.g.
[Fe3+]t [Co2+Fe3+]o O4 + *Co2+ ↔ [Fe3+]t [*Co2+Fe3+]o O4 + Co2+ (1.14)
Particulate Deposition: The settling of suspended particles due to gravity in no or low
flow areas such as surge tank and dead legs causes localized build-up of hotspots of
radioactivity.
Among the above processes, the direct corrosion reaction contributes in a major
way to corrosion product build-up especially on new surfaces while particulate deposition
is the least dominant mechanism.
19
1.3 Minimizing and control of radiation field in primary heat transport systems
Radiation exposure to operating staff directly depends on the radiation dose level
of the coolant systems. The nuclear regulatory agencies such as International
Commission on Radiation Protection (ICRP) and in India, Atomic Energy Regulatory
Board (AERB) have prescribed the limits to which personnel manning nuclear facilities
can be exposed to radiation. Currently, the prescribed limits are 100 mSv for 5 years
individual exposure and should not exceed 30 mSv in any calendar year during the 5-year
block [18].
Steps to control the buildup of radiation fields are taken right from the design and
commissioning stages of the plant apart from those at regular operational stages. The
methods being considered/followed during design, operation and maintenance of water-
cooled nuclear reactors for man-sievert reduction and plant life extension are enlisted
hereunder [19].
• Adopting stringent measures in selection and specification of construction materials
resulting in reduction of cobalt inventory in the primary coolant system. Culmonoy, is
being considered as substitutes for stellite.
• Stringent coolant chemistry conditions to minimize the corrosion product formation,
deposition on the fuel and their subsequent release into out of core surfaces.
• Designing a purification system with a very short clean-up half-life.

20
• Electro-polishing: Electro-polishing of some of the components leaves a very smooth
microstructure on the surface, resulting in significant reduction in radiation field build-
up. Electro-polishing of channel heads in steam generators has been developed for PWR
and PHWRs applications.
• Hot conditioning: At the commissioning stage, pre-filming of structural material by
controlled corrosion process before achieving nuclear heat helps in minimizing the
activity transport.
At the operational level, following are the important procedures being practiced.
• Replacing the defective fuel as soon as the defect is detected in the case of PHWRs,
where there is on-line refueling facility.
• Controlling Coolant chemistry: Controlling chemistry parameters at different stages
such as operation, during power ramping (increasing or decreasing reactivity of the core)
and during reactor shut down is important to reduce the corrosion damage and subsequent
release and redeposition of radioactivity on the out-of-core surfaces.
• The control of [Ni]/ [Fe] concentration in the feed water to ≤ 0.2 is helpful in
controlling the radiation fields in the initial stages of newly commissioned BWRs. The
concentrations of Ni and Co species diminish in reactor water with such control. This
ratio [Ni]/ [Fe] ≤ 0.2 is achieved by iron injection at the condensate extraction pump
discharge.
• Use of high quality purification circuit to remove soluble (ionic) and particulate (0.1-10
µm) form of ACPs through ion exchange and filtration unit.
21
• Metal ion passivation (Zn/ Mg addition to coolant): Metal – ion passivation is a
relatively nascent field of research with the aim to control the rate of radiation field
buildup. The beneficial action of Zn and / or Mg is that, these ions can effectively
incorporate into protective oxides (Fe3O4, NiFe2O4 and FeCr2O4) and make them even
more compact and adherent while inhibiting the incorporation of unwanted radionuclide
such as 60Co.
• Hydrogen injection and Noble-metal addition (Pt/Rh): Hydrogen injection with and
without noble metal passivation has been developed to mitigate the Inter-Granular Stress
Corrosion Cracking (IGSCC) of BWR components. The method is based on the catalytic
recombination of the radiolytically produced O2 and H2O2 with H2 to form H2O on metal
surface, thereby achieving electrochemical potential of ( -300 mV vs. SHE) on the
surface of stainless steel. Noble metal passivation lowers the hydrogen injection levels
achieving the same benefits of concentration, but achieved with much lower H2 addition.
Noble metal passivation is a palliative to the reactor fence 16N problem faced with regular
Hydrogen Water Chemistry (HWC).
• Chemical Decontamination, which is a curative step, involves the quantitative
dissolution of oxide matrix containing radionuclide using suitable formulations/ reagents
without affecting the base metal. This method has been proved to be an efficient and
advantageous among the various methods mentioned above. In BWRs, a reasonable
decontamination (> 80% radioactivity removal) is achieved if the outer layers are
removed, and the same trend is observed in PHWRs too.

22
1.4 Decontamination
In the case of water-cooled nuclear reactors, contamination on out of core
surfaces, viz. the inside surfaces of pipes and equipment through which the
coolant/moderator water (or heavy water) flows dominate the person-sievert problem.
Periodic decontamination procedure by means of chemical dissolution of the outer oxide
layer of the structural surfaces is practiced to address this issue in operational NPPs [20].
Experience has shown that in a typical PHWR, in a single decontamination campaign
about 150 to 300 Kg of iron has been removed to completely decontaminate the full
system (the entire PHT system, volume, ~ 70,000 liters).
The decontamination procedures may be broadly divided into two main groups:
[1] Physical or Non-chemical Decontamination procedures and
[2] Chemical Decontamination procedures.
1.4.1 Physical/ Non-chemical decontamination procedures
Depending on the end-purpose and the system to be decontaminated, one has a
choice of several methodologies developed over the past 2-3 decades. These can be
broadly classified as
⇒ Mechanical cleaning methods like brushing, wiping, ultrasonic cleaning etc
⇒ Steam blasting

23
⇒ Cleaning using abrasives such as use of water jet, or dry ice pellets (propelled
by jet of CO2) with or without admixtures like glass beads, quartz beads, B2O3
or other abrasive materials.
The usefulness of physical methods is restricted since a pre-condition for these is
the accessibility of the surface to be treated. Besides, these processes tend to abrade not
only the protective oxide film but also the base metal, thereby roughening the surface and
aiding the subsequent penetration of radioactive nuclides into the base metal. Apart from
the disadvantages of inaccessibility of area of intricate geometry, application of physical
methods is generally limited to external surfaces.
1.4.2 Chemical decontamination procedures
Chemical decontamination, involves the dissolution of the radioactive deposits on
the surfaces of alloys using specially developed chemical formulations. It aims at
reducing the radiation field by dissolving the oxide film on the system surfaces without
any appreciable attack on base metal. Since, selective removal of radionuclide from the
oxide film is not possible, complete removal of the protective host film is the only way
by which radionuclides can be removed from the system [21]. Chemical decontamination
has the unique advantage of cleaning surfaces of different sizes, geometry and at various
locations both accessible and inaccessible. Chemical decontamination methods can be
classified into two types namely
(a) Hard-chemical decontamination and
(b) Soft-chemical decontamination

24
Hard-chemical Decontamination:
Hard chemical decontamination is the chemical procedure for removing oxide
layers completely using strong chemical formulations. These methods are based on the
use of concentrated reagents (6 - 10% w/v) such as redox reagents (Ce3+/Ce4+) in the
presence of mineral acids (e.g. nitric/sulphuric acid), and can accomplish complete
removal of oxide layers. The major drawback of hard chemical decontamination is its
excessive corrosive nature besides generation of large quantities of radioactive wastes.
This kind of decontamination is normally carried out during the decommissioning of
certain component or in those cases where the corrosion is not the serious concern.
Soft-chemical decontamination:
Soft decontamination procedures are based on the use of dilute chemical reagents
(typically 0.1% w/v of dissolved chemicals) such as reducing/oxidizing agents, chelating
agent and organic acids to bring about only partial dissolution of the oxide layers. Hence,
the treatment period required has to be longer. These methods are generally less corrosive
in nature and generate lesser volume of radioactive wastes.
Conventionally, the end result of a decontamination process is expressed in terms
of the Decontamination Factor (DF) achieved by the campaign.
DF = dose rate before decontamination/ dose rate after decontamination
i.e. the ratio of radiation field at a particular location before and after the
decontamination. DF is normally calculated for the selected points in a system/pipe-work,
25
excluding the background radiation level. A plot of DF vs. activity removed will yield an
exponential plot suggesting the high DF values do not mean high activity removal.
Achieving a DF of 2-10 is often acceptable as DF = 10 correspond to removal of 90%
radioactivity.
1.5 Oxide Dissolution
Oxide dissolution in a solution can be interpreted in terms of extent of under-
saturation of solution with respect to the oxide. The factors that influence the rate of
dissolution are temperature, composition of solution phase (pH, redox potential,
concentration of acids, reductants and complexing agents etc.) and the properties of the
oxide (specific surface area, stoichiometry, crystal symmetry, presence of defects etc.)
[22]. Additives in solution adsorb on the oxide and affect the energy of attachment
between the surface ions and those of the interior. Iron oxide dissolution can proceed
through several pathways:
(1) Acid dissolution ⇒ attack the sub lattice oxide ions (O2-) with protons
(2) Reductive / Oxidative dissolution ⇒ attack the cations of the sub lattice with
reductants/oxidants.
26
1.5.1 Acid Dissolution
The strong affinity of protons with the structural oxide ions assist in the release of
iron from the oxide lattice. Acids dissolution is described through adsorption of proton by
the surface OH group, resulting in weakening the Fe-O bond which finally leads to
labilizing the iron from the oxide lattice [23].
In the case of hematite or magnetite, the formal stoichiometry for the acid/ non-
reductive dissolution reaction can be shown as:
Fe2O3 + 6H+ → 2Fe3+ + 3H2O (1.18)
Fe3O4 + 8H+ → 2Fe3+ + Fe2+ + 4H2O (1.19)
Studies have shown that in the case of many oxides the acid attack is rather slow. Even at
very high concentrations (6-10%), the dissolution was significantly slow on oxides
containing few at. % of chromium/nickel and no dissolution was obtained with nickel
ferrite [24]. Also, use of mineral acid is not desirable in the system as it can lead to
corrosion problem as well as disposal problem. Hence, in operating nuclear reactors, no
such dissolution is being carried out.
1.5.2 Reductive / Oxidative Dissolution
Since most of the corrosion products found in primary system of water-cooled
reactors are iron/nickel/chromium-containing oxides which exhibit variable valency

27
states, they are amenable for reductive/oxidative dissolution. The redox dissolution was
found to be advantageous (faster kinetics) over conventional acid based slow dissolution.
Reductive Dissolution:
Reducible metal oxides can undergo dissolution by four general pathways in
acidic aqueous solution: proton-assisted (acid), ligand-promoted, reductive, and ligand-
promoted reductive dissolution [25]. Reductive dissolution of iron oxides involves
adsorption of the reducing agent on the surface of oxide. This is followed by the fast
inner or outer sphere electron transfer resulting in formation of Fe2+ at the interface. The
processes subsequent to the reduction of the surface Fe3+ ions, i.e. the actual dissolution
reactions involve terrace-ledge-kink mechanism. The driving force for the disruption of
the oxide surface and the ejection of Fe2+ ions into the bulk solution is the increase in size
of iron ions on reduction (crystallographic radii for the high-spin ions are 0.75 Å for Fe2+
and 0.65 Å for Fe3+), and the increased electrostatic repulsion between the electron
clouds of the iron ions and the adjacent O2- ions [26]. There are many reducing agents
with redox potential sufficiently negative to bring about reduction of Fe3+ in the oxide
lattice. The standard reduction potential for a number of reducing agents is given in
Table 1.4. These can be broadly classified into four categories:
• reducing agents based on organic acids such as formic, citric, oxalic, ascorbic
acids etc.
• inorganic reducing agents such as hydrazine, sodium dithionite etc.

28
• reduced metal ions ( Low Oxidation state Metal Ion LOMI) such as Fe2+, V2+,
Cr2+, etc. Further, the redox potentials of these metal ions can be modified by
complexation with chelating agents.
• reducing radicals generated radiolytically such as hydrated electron (e-aq),
hydroxy isopropyl radicals, [(CH3)2COH] etc.
Table 1.4: Standard Redox potentials (written using reduction potential convention)
of some of the reagents suitable for use in decontamination formulations
Reducing agents E0 in V (v/s. SHE) Reducing agents E0 in V (v/s. SHE)
Hydrazine -0.23 e-aq -2.7
Formic acid -0.40 Cr2+aq -0.41
Thioglycolic acid -0.23 Cr(II)-EDTA -0.99
Gallic acid -0.44 Cr(II)-bipyridil -0.12
Oxalic acid -0.23 V2+-formate -0.26
Ascorbic acid 0.27 V(II)-picolinate -0.41
Sodium dithionate -0.40 Fe2+aq +0.77
Propane-2-radicals -1.25 Fe(II)-EDTA +0.12
Fe(II)-oxalate +0.21
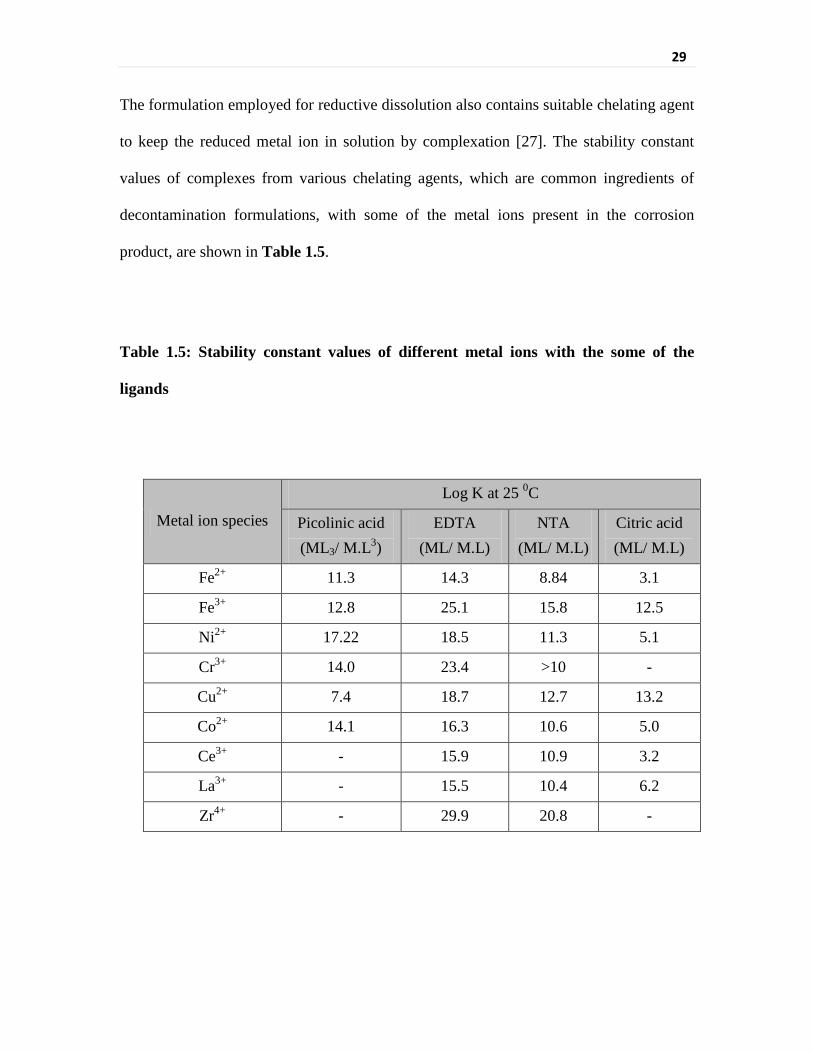
29
The formulation employed for reductive dissolution also contains suitable chelating agent
to keep the reduced metal ion in solution by complexation [27]. The stability constant
values of complexes from various chelating agents, which are common ingredients of
decontamination formulations, with some of the metal ions present in the corrosion
product, are shown in Table 1.5.
Table 1.5: Stability constant values of different metal ions with the some of the
ligands
Metal ion species
Log K at 25 0C
Picolinic acid (ML3/ M.L3)
EDTA (ML/ M.L)
NTA (ML/ M.L)
Citric acid (ML/ M.L)
Fe2+ 11.3 14.3 8.84 3.1
Fe3+ 12.8 25.1 15.8 12.5
Ni2+ 17.22 18.5 11.3 5.1
Cr3+ 14.0 23.4 >10 -
Cu2+ 7.4 18.7 12.7 13.2
Co2+ 14.1 16.3 10.6 5.0
Ce3+ - 15.9 10.9 3.2
La3+ - 15.5 10.4 6.2
Zr4+ - 29.9 20.8 -
30
Oxide dissolution of austenitic stainless steel structural materials:
The austenitic stainless steel pipework in BWRs and PWRs result in formation of
substituted ferrites like Fe2-xCrxO3, FexCryNizO4 (x+y+z = 3) etc. on the surface. The
outermost oxide layers on these pipeworks are mainly Ni and Cr substituted ferrites.
These oxides show poor dissolution behaviour in concentrated acids or in the presence of
strong complexing agents [28]. Such oxides have shown better dissolution efficiency in
the V(II) formulations as compared to organic acid based complexing-dissolution
formulations. Vanadous formulations create a stronger reducing condition as compared to
the organic acid based reducing agents. These formulations are used directly or in
combination of oxidizing pretreatment step of alkaline permanganate/acidic
permanganate depending upon the concentration of Cr in the oxide layer. Dissolution of
representative oxides such as NiFe2O4 in vanadous formulation has indicated that the
reaction at the particle surface is the rate determining step and the species reacting at the
surface is the vanadous complex. The dissolution is triggered by the rapid outer sphere
electron transfer from vanadous ion to the ferric ion in the surface. Vanadous based
formulations are qualified for application of decontaminating entire reactor system owing
to the superior material compatibility characteristics of these formulations [29].
Oxidative dissolution:
Normally oxidative dissolution is employed for chromium oxides and chromium-
rich iron oxides such as MCr2O4 (M=Fe2+, Ni2+, Co2+ etc) [30]. It involves the oxidation
of Cr3+ in the oxide lattice to Cr6+, which is generally done using acid/alkaline
permanganate reagents, hydrogen peroxide, ozone etc. In the case of chromium
31
containing oxides, the oxidative dissolution / treatment result in chromium depletion in
the residual oxides, thereby facilitating the subsequent reductive dissolution.
Permanganate based oxidative dissolution is most commonly practiced. Most of the time
the effectiveness of permanganate depends on the nature of metal surface (e.g. CS, SS,
Incaloy etc) being treated, since MnO2 can deposit on these surfaces based on the surface
charges and prevent further action of reagent by forming a barrier. Thus, during the
decontamination of reactor components, once the oxidative dissolution step is over, the
system has to be cleaned up before applying the reductive dissolution step.
1.6 Decontamination chemical/ reagent requirements
1.6.1. Ion-exchange behavior / regenerative mode of dissolution
In nuclear industry the removal of spent decontamination formulation i.e. metal
ions as well as the constituents of the formulations is predominantly practiced using ion
exchange resin. In regenerative dilute chemical decontamination process, the ion
exchange resins do the additional job of regenerating the formulation by continuously
removing the metal ions and activities from their complexes and releasing the
complexants and the H+ ions back to the system for further decontamination / dissolution
of oxide deposits [31]. Strong acid cation exchange resins are used for regeneration and
mixed beds are used for finally removing constituents of formulation at the end of
decontamination.
Major constituent of the formulation used for decontamination are carboxylic
acids or amino carboxylic acids that exist mostly in anionic form. However, a fraction of
32
the amino carboxylic acid can be protonated by the organic acids present in the
formulation and hence can exist in cationic form. This results in the removal of these
species by the cation exchange resin in regenerative decontamination process. Though the
loss of ion exchange capacity due to the pick – up of formulation constituents is not
significant, the decrease in the chemical concentration of the constituents that is removed
leads to decreased dissolution. Detailed studies carried out on this phenomenon showed
that DTPA, EDTA, PA and HEDTA are removed in large quantities. The extent of
adsorption is minimum for NTA and PDCA.
The order of selectivity of metal ions (by ion exchange resin) observed in non-
complexing medium is reversed in complexing medium. For instance, the trivalent metal
ions (e.g. Fe3+, Cr3+ etc) have poor selectivity and lower apparent capacity than divalent
metal ions in complexing medium. Chromium (III) and iron (III) ions are not at all
removed by the cation exchange resin in EDTA and in most other complexant media. For
divalent ions the capacity value decreases with increase in stability constant of the
complex formed. Cu2+ and Ni2+ have low apparent capacity because of the high stability
of the complexes (with EDTA, see Table 1.5) and Co2+ ion has relatively high capacity.
In the case of conventional LOMI formulations (non-regenerative), attempts are
being made to make the LOMI process a regenerative process by an ingenious method.
The spent LOMI is allowed to pass through an electrolytic cell consisting of three-
electrode compartments [32]. The central compartment is separated from the other two by
cation exchange membrane and is filled with IX resins. The metal ions dissolved by
LOMI reagent pass to the cathode compartment through the cation membrane and are

33
reduced to its metallic form and the regenerated LOMI goes back to the system. This way
the active waste is reduced to an ultimate low volume solid waste.
1.6.2 Consideration of radiolytic degradation
During the full system decontamination (including reactor core), the formulation
chemicals get exposed to radiation. This leads to a loss of formulations and at times
results in the generation of various degradation products including reactive transient
species [30]. The extent of decomposition depends on the duration of exposure and also
the time elapsed between the reactor shut down and the decontamination. It has been
observed in the laboratory experiments that citric acid resists decomposition when it is
present along with EDTA and ascorbic acid. Also, the presence of aromatic ring in the
constituents of formulations (for instance picolinic acid, pyridine dicarboxylic acid etc)
increases their stability. Irradiation also results in in-situ generation of low oxidation state
metal ions in the presence of stable complexing agents and thus aiding the
decontamination process when such reagents are used for the purpose [33].
1.6.3 Material compatibility considerations
Structural material integrity is a primary concern for any chemical addition in the
nuclear power plants (NPPs). Decontamination formulations too have to fulfill this
criterion. The composition of decontamination formulation has undergone continuous
modification to address this issue. The shift from oxalic acid based CITROX process to

34
LOMI based formulations is based on the material compatibility concerns [34]. This was
based on the laboratory observations of inter granular attack (IGA) of oxalic acid on
sensitized stainless steel.
Certain inhibitors (e.g. Rodine 92B) and some times surfactants (e.g. Triton X-
100) are being added to the formulation to protect any base metal loss (wall thinning).
However, this depends on the nature of formulations / systems being treated.
Conventionally filming amine based inhibitors are found very effective (even at 50 ppm
level), and are easy to remove both on cation / anion exchange resin during regeneration
step. It is reported that even sulfur-based inhibitors can be employed safely since the
removal process has been proved to be effective.
1.7 Present scenario of operational decontamination processes
The decontamination processes practiced for chemical decontamination can be
classified into three categories depending upon their mode of action
1. Strong single electron transfer based reducing agents e.g. Low Oxidation state
Metal Ions (LOMI) containing formulations.
2. Formulations based on the mixture of chelating agents (e.g. EDTA, NTA etc.) and
organic acid (e.g. oxalic acid, citric acid, ascorbic acid etc), which may also be
reducing in nature. Processes such as CORD, CAN-DEREM, CAN-DECON, DOW
NS-1, EDF-EMMA, are some of such processes.

35
3. Oxidant based formulations which contain alkaline/ acid permanganate e.g. APAC,
APOX, MOPAC processes. These are generally used for removing Cr from the
oxide and are usually used in combination with 1 or 2.
1.8 Scope and objectives of the present work
The water chemistry studies undertaken in the present work are related to the
decontamination of stainless steel based NPPs viz. BWRs and PWRs along with the
application of ion exchange resins for maintaining the specified water chemistry regime.
A methodology to synthesize the strong reducing agent namely V(II) on large
scale is imperative for undertaking decontamination of stainless steel based NPPs. Major
part of the present work is related with the studies on optimization of the synthesis of
V(II) based formulation. This included evaluating maximum solubility of the suitable
precursor solutions, studies for optimization of electrolytic route of V(II) preparation,
synthesis and characterization of different oxidation state vanadium solids, development
of redox speciation methodology for quantification of different redox mixtures of
aqueous vanadium redox mixtures along with studies related with chromate sorption over
magnetite in the presence of gamma irradiation and chemistry control methodology
development by nitric acid leaching from weak base anion exchange resin column. These
are briefly mentioned below.
1.8.1 Maximum solubility studies for aqueous V(V) and V(IV) formate solutions
V(V) or V(IV) solutions are the stable precursors available for synthesis of V(II)
formulations. V(V) formate could be obtained by direct addition of formic acid to sodium
36
metavanadate solution while V(IV) formate was obtained by chemically reducing the
V(V) formate by hydrazine addition. Maximum solubility of aqueous V(V) and V(IV)
formate solution has been evaluated by gradually increasing the concentration with
conductivity and turbidity monitoring. This is the primary step for optimizing the process
of V(II) synthesis as ideally the synthesis should begin with the maximum concentration
of precursor.
1.8.2 Optimization of electrolytic synthesis route for V(II) preparation
Electroreduction of aqueous V(V) or V(IV) precursor solutions in the material
compatible formulation is the most suitable route for preparation of V(II). Electrolysis
provides flexibility of selecting the reaction media along with avoiding any by-products
addition during the synthesis process. Controlled current electrolysis using two
compartment cell has been used for V(II) preparation. The primary objective of the study
has been to optimize the time of electrolysis. The selection of suitable cathode material
for achieving high current efficiency for the process, evaluation of maximum
concentration of precursor solution feasible for electroreduction to V(II) and evolving
better precursors as per the results has been studied.
1.8.3 Synthesis and characterization of different oxidation state vanadium solids
Different solids of vanadium have been prepared by aqueous route in the formic
acid medium. The vanadium compounds were obtained for all known aqueous vanadium
oxidation states viz. V(V), V(IV), V(III) and V(II). The compounds were obtained by
preparing aqueous saturated solutions of the different oxidation states of vanadium

37
through various routes. The compounds were characterized for the chemical composition,
oxidation states, thermal stability, structural information and formation of aqueous
complexes with suitable ligands namely nitrilotriacetic acid (NTA) and citric acid.
1.8.4 Redox speciation method development for quantification of aqueous vanadium
redox mixtures
Vanadium exists in aqueous solution as V(II), V(III), V(IV), or V(V), or as a
mixture of any two contiguous valence states. As mentioned earlier, the lower oxidation
states are air sensitive and hence the synthesis of lower oxidation state aqueous vanadium
compounds require continuous monitoring to ensure inert atmosphere in the experimental
setup. Thus redox speciation of aqueous vanadium is an essential prerequisite for
efficient synthesis of lower oxidation state aqueous vanadium compounds.
Spectrophotometric determination of aqueous vanadium is the method of choice
when rapid redox speciation is required [35]. However, direct spectrophotometric
determination of vanadium suffers from poor sensitivity and selectivity. Extraction to
organic phase followed by spectrophotometric determination using suitable
chromophores is normally practiced to improve sensitivity and selectivity [36, 37].
Catalytic spectrophotometric methods are also used for sensitive spectrophotometric
determination of V(V) [38]. However, these methods require extensive processing of the
sample, maintaining specific concentration ratio of reagents and providing specific
reaction conditions for good result. A modified method used by King and Garner [39] has
been used for spectrophotometric redox speciation. The vanadium samples are initially
analysed for total V(V) reducing strength. This is done by converting the sample to
38
V(V)/V(IV) mixture by adding known excess V(V) solution. Also, another aliquot of the
sample is completely oxidized to V(V) by acidic KMnO4 [40]. Redox interaction of V(V)
with Fe(II) is known to be instantaneous in acidic aqueous medium and has been used to
evaluate the V(V) concentration [41]. The same route but with the estimation of Fe(III)
by the established spectrophotometric Fe(III)-sulfosalicylate complex method [42] has
been followed. The figures of merit has already been evaluated for the method [43]. The
interference of V(IV) and Mn(II) on the method has been evaluated as these ions will be a
part of the sample matrix. Direct spectrophotometric method for V(III)/(II) speciation
based on thiocyanate complex formation is also explored.
Redox potential monitoring has been explored for on-line measurement during
electrolytic preparation of lower oxidation state aqueous vanadium compounds. Solution
potential monitoring with a redox electrode impressed with a high frequency of 1.13 kHz,
10 mV alternating voltage to overcome polarization of the electrode has been evolved for
evaluating the progress of electrolysis.
1.8.5 Chromate sorption over magnetite in presence of gamma irradiation
Chromate reduction on various iron oxides has been evaluated in several studies
[44]. Chromate has been used as a corrosion inhibitor for various applications where iron
based alloys are the structural materials [45]. In the shutdown cooling heat exchanger
(closed system) in reactor systems such as BWRs, chromate is still in use as the corrosion
inhibitor. Under certain operational conditions this chromate can come into primary
coolant recirculation circuit and can interact with the iron oxide bearing surface of the
structural materials. Here, the presence of ionizing radiation will be an important

39
parameter to be accounted for the interaction of chromate with the iron oxides. Structural
modification of the oxide surface of the recirculation system due to concomitant presence
of chromate and irradiation is of immense importance. One of the important implications
of the chromium bearing oxide surface is modification in the chemical formulation to be
employed for decontamination of the recirculation system.
Magnetite is one of the representative oxides formed on the structural material
surfaces. Effect of gamma irradiation on the heterogeneous chemical interaction of
chromate with the magnetite has been studied and it has been compared with the
isothermal interactions at various temperatures.
1.8.6 Water chemistry control by weak base anion exchanger
Soluble burnable poison in the moderator has been selected for reactivity control
during startup and shutdown (secondary shutdown system) of the 540 MWe pressurized
heavy water reactors (PHWRs) in India. Gadolinium nitrate in heavy water moderator is
used for the purpose. As a secondary shutdown tool Gd is used at 15 mg kg-1
concentration in the moderator system. The pH range of operation for this system is
specified to be 5.0 - 5.5. The upper limit for pH is restricted to avoid any precipitation of
Gd in the system [46] and the lower limit is fixed to maintain the material compatibility
of the different structural materials of the composite moderator system [47]. Colloidal
hydroxide/hydrous oxide/oxide formation has been reported for rare earths in the pH
range of 4.5 to 6.0 at relatively much higher concentrations by forced hydrolysis [48].
The concentration of Gd in moderator system is maintained by direct addition from the
secondary shutdown system as Gd(NO3)3 for increasing the concentration or by removal

40
through ion exchange columns. Removal of Gd involves a mixed bed of strong acid
cation exchanger (SAC) and weak base anion exchanger (WBA). WBA is used to avoid
any precipitation of Gd as Gd(OH)3 due to removal of nitrate prior to Gd3+ removal on
SAC. During the removal of Gd through such a column, in the initial stages the pH at the
outlet of the column goes above 5.5 and remains above 5.5 for about one half life of
recirculation through the column. However, the bulk moderator system pH remains
within the specified limit throughout the run. Feasibility of maintaining the pH of the ion
exchange column outlet within the specified limits of the bulk moderator system by the
leach out of nitric acid from the weak base resin of the column has been studied. The
leachout characteristics of nitric acid from weak base resin as a function of nitric acid
loading and initial inlet concentration at a particular flow rate is evaluated. Based on the
evaluation of leaching from the nitric acid loaded WBA, a column configuration is
suggested for maintaining the column outlet pH within the specified limits during the
Gd3+ removal from the moderator system.
1.9 References
[1] S. V. Lishchuka, N. P. Malomuzh, P. V. Makhlaichuk, Phys. Lett. A, 375 (2011) 2656.
[2] W. E. Berry, R. B. Diggle, EPRI NP-522 (1979).
[3] Coolant Technology of Water Cooled Reactors, Vol. 1, IAEA, Vienna, September 1992, IAEA-TECDOC-667.
[4] Corrosion in Nuclear Engineering, W.E. Berry John Wiley & sons, 1971.
41
[5] Y. S. R. Prasad, Proc. of The National Symposium of Water and Steam Chemistry in Power Plants and Industrial Units (SWACH-2000), Mumbai, Feb 23-25, 2000, pp 1-9.
[6] D. Ferrett, G. C. W. Comley, IAEA-TECDOC-356, 67 (1985).
[7] S. E. Garcia and C. J. Wood, International Conference on Water Chemistry of Nuclear Reactor Systems, (NPC 08), Berlin, 2008, Paper L4-1.
[8] Optimization of Water Chemistry to Ensure Reliable Water Reactor Fuel Performance at High Burnup and in Ageing Plant (FUWAC), IAEA, Vienna, October 2011, IAEA-TECDOC-1666.
[9] S. S. Bajaj and A. R. Gore, Nucl. Eng. and Design, 236 (2006) 701,
[10] G. Schikorr, Z. Elektrochem., 35 (1929) 65.
[11] Y. L. Sandler, Corrosion, 35 (1979) 205.
[12] C. W. Turner and S. J. Klimas, Proc. Engineering Foundation Conference on Heat Exchanger Fouling, Davos, 2001, pp. 19–26.
[13] D. Lister and F. Cussac, Heat Transfer Engineering, 30 (2009) 840.
[14] R. Riess and K. Lundgren, Crud in PWR/VVER and BWR Primary Circuits, LCC-2 Special Topic Report, ANT International, 2006.
[15] Modelling of Transport of Radioactive Substances in the Primary Circuit of Water-Cooled Reactors, IAEA, Vienna, March 2012, IAEA-TECDOC-1672.
[16] R. A. Shaw, Nucl. Technol., 44 (1979) 97.
[17] G. Venkateswaran, Proc. of The National Symposium of Water and Steam Chemistry in Power Plants and Industrial Units (SWACH-2000), Mumbai, Feb 23-25, 2000, pp 20-33.
[18] International Basic Safety Standards for Protection against Ionizing Radiation and for the Safety of Radiation Sources, Safety Series No. 115, IAEA, Vienna, 1996.
[19] Coolant Technology of Water-cooled Reactors: An Overview, Technical Report Series No. 347, IAEA, Vienna, 1993.
[20] Decontamination Handbook, EPRI, TR-112352, Palo Alto, CA: July 1999.
[21] J. A. Ayres, Decontamination of Nuclear Reactors and Equipments, Ronald Press, New York, 1970.
42
[22] J. L. Smee, ‘Dissolution Characteristics of Metal oxide in Water cooled Reactors in Decontamination and Decommissioning of Nuclear Facilities’ (Ed. Marilyn, M) Osterhout, Plennum Press, NY. 1980.
[23] R. M. Cornell and R. Giovanoli, Clay Minerals, 28 (1993) 223.
[24] M. G. Segal, T. Swan, Water Chemistry of Nuclear Reactor Systems 3. BNES, London, (1983) 187.
[25] M. D. S. Afonso, P. J. Morando, M. A. Blesa, S. Banwart and W. Stumm, J. Colloid and Interface Sc., 138 (1990) 74.
[26] M. G. Segal and R. M. Sellers, J. Chem. Soc., Faraday Trans., 78 (1982) 1149.
[27] A. B. O’Brien, M. G. Segal, J. Chem. Soc. Faraday Trans I. 83 (1987) 371.
[28] D. G. Wickham, Inorg. Synth., 9 (1967) 152.
[29] D. Bradbury, M. G. Segal, T. Swan, G. C. W. Comley, D. J. Ferrett, Nucl. Energy, 20 (1981) 403.
[30] T. Swan, M. G. Segal, W. J. Williams, M. E. Pick, EPRI-NP 5522M, USA, 1987.
[31] A. L. Rufus, S. Velmurugan, S. K. Padma, V. S Sathyaseelan, S. V Narasimhan, P. K. Mathur, Nucl. Technol., 122 (1998), 228.
[32] P. M. Tucker, Nuclear Engineering International, 38 (1993) 18.
[33] R. M. Sellers, Radiat. Phys. Chem., 21 (1983) 295.
[34] C. J. Wood, Progress in Nuclear Energy, 23 (1990) 35.
[35] M. J. C. Taylor and J. F. van Staden, Analyst, 119 (1994) 1263.
[36] C. Agarwal, M. K. Deb, R. K. Mishra, Analytical Letters, 23 (1990) 2063.
[37] S. A. Abbasi, Analytical Letters, 9 (1976) 113.
[38] M. R. Shishehbore and R. Jokar, Anal. Methods, 3 (2011) 2815.
[39] W. R. King, and C. S. Garner, J. Phys. Chem., 58 (1954) 29.
[40] C. L. Rulfs, J. J. Lagowski, and R. E. Bahor, Anal. Chem., 28 (1956) 84.
[41] H. Willard and P. Young, Ind. Eng. Chem., 6 (1934) 48.
[42] K. Ogawa and N. Tobe, Bull. Chem. Soc. Japan, 39 (1996) 223.
43
[43] D. G. Karamanev, L. N. Nikolov, V. Mamatarkova, Minerals Engineering, 15 (2002) 341.
[44] M. L. Peterson, A. F. White, G. E. Brown, G. A. Parks, Environ. Sci. and Technol., 31 (1997) 1573.
[45] E. McCafferty, M. K. Bernett, J. S. Murday, Corr. Sci., 28 (1988) 559.
[46] P. Sasikumar, K. Shivakamy, A. L. Rufus, V. K. Mittal, S. Bera, S. Velmurugan, S. V. Narasimhan, Power plant chemistry, 9 (2007) 34.
[47] G. T. Chandler and M.H. Anderson, WSRC-MS-91-502 (1991).
[48] E. Matijevic, United States Patent 5015452 (1991).
44
CHAPTER-2
Experimental Methods
2.1 Introduction
The description of the synthesis routes, experimental setups used for water
chemistry studies, equipment and techniques used in these studies is provided in this
chapter. The water chemistry studies undertaken in the present work involved designing
and fabricating a two compartment electrochemical cell for preparation of V(II) formate,
setting up a recirculation loop with an ion exchange column for studying water chemistry
control using ion exchange bed, synthesizing different vanadium formate solids. Solution
studies to evaluate maximum solubility of V(V) and V(IV) precursor aqueous solutions
involved periodic conductivity and turbidimetric measurements along with gravimetric
measurements for V(IV) solutions. Instrumental techniques used in this work involve the
analytical characterization instruments such as UV-visible spectrophotometry, atomic
absorption spectrophotometry (AAS), ion chromatography (IC) along with other solid
characterization instruments such as x-ray diffractometer (XRD), Fourier Transform
Infrared Spectroscopy (FTIR), thermogravimetry (TG) and X-ray photoelectron
spectroscopy (XPS). Electrochemical characterization of electrodes was done using the
potentiostat / galvanostat having FRA (frequency response analyser) module. The brief
description of these setups and the instrumental methods used in this work is presented
below.

45
2.2 Description of the electrolytic cell
Controlled potential electrolysis was carried out in a specially designed and in
house fabricated cell of borosilicate glass. This cell is having two compartments
separated by an anion exchange membrane. Approximately one liter capacity cell with
750 ml cathode compartment solution (catholyte) and ~60 ml anode compartment
solution (anolyte) was used. The cell is designed in a vertical cylindrical fashion. The
outer cylinder is the cathode compartment in which the anode compartment goes from the
top lid in a concentric arrangement. An anion exchange membrane was placed at bottom
of the anode compartment to separate the catholyte and the anolyte. The cathode rested at
the bottom of anode compartment below the anion exchange membrane. Graphite felt is
used as cathode material and stainless steel mesh is used as anode material. They face
each other and distance between the cathode and anode was kept at minimum to achieve
maximum current efficiency for the process. Cathode and anode were connected to dc
power supply unit using insulated wires. The design of the two compartment electrolytic
cell is shown in Fig 2.1. IOLAR nitrogen was purged through both cathode and anode
compartment during the electrolysis to maintain inert atmosphere in cathode
compartment and to provide a sweeping effect to remove the carbon dioxide from the
anode which is produced during electrolysis and gets deposited on the anode thereby
polarizing the anode. Oxygen at 2 ppm level is present in the nitrogen gas used for
deaeration as impurity. Oxygen trap arrangement was used to remove this oxygen. The V
(II) formate was used in oxygen trap because it is a strong reducing agent that can reduce
dissolved oxygen to water thereby resulting in highly pure N2 entering the electrolysis
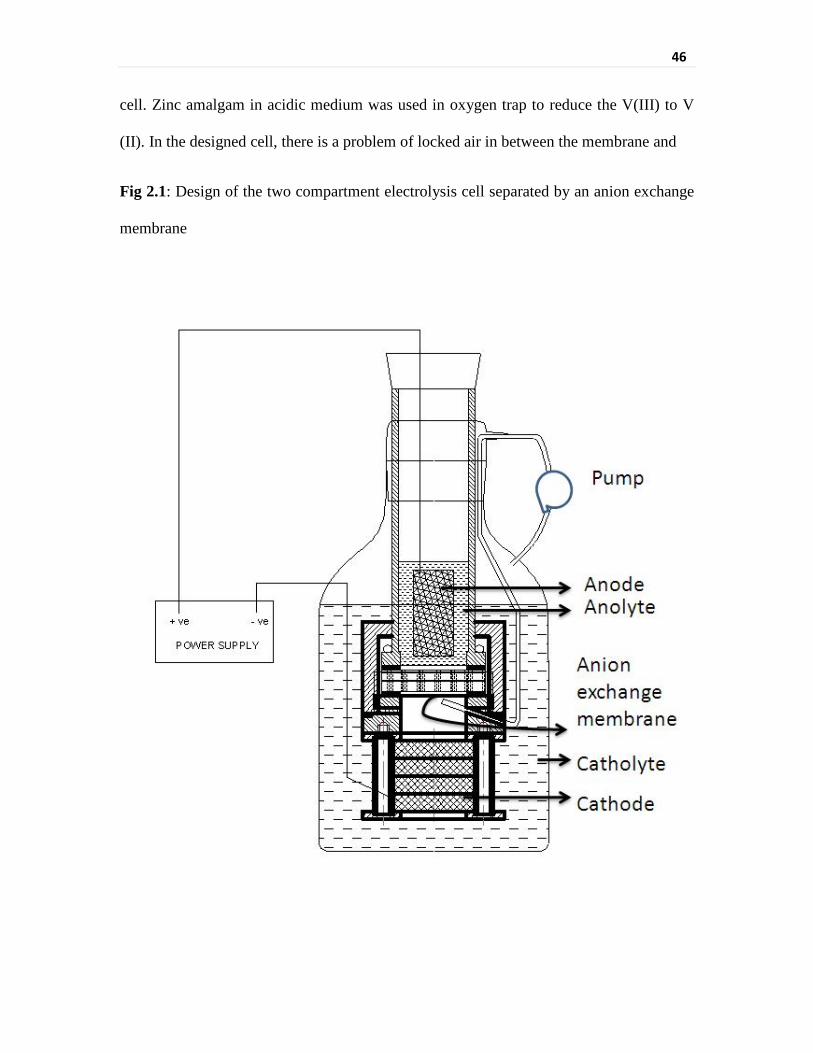
46
cell. Zinc amalgam in acidic medium was used in oxygen trap to reduce the V(III) to V
(II). In the designed cell, there is a problem of locked air in between the membrane and
Fig 2.1: Design of the two compartment electrolysis cell separated by an anion exchange
membrane
47
the nut tightening it from the cathode compartment side to avoid any leakage of the anode
compartment solution in the cathode compartment or vice versa. This locked air results in
electrical isolation of anolyte and catholyte and thereby disturbing the current flow path.
A provision for pumping out this locked air is made by providing a circulation
arrangement which additionally provides hydrodynamic convection and hence improved
current efficiency. The cathode potential was measured between cathode terminal and
reference electrode placed in a luggin probe filled with a conducting solution of sodium
formate. The luggin probe goes close to the surface of the cathode in the cathode
compartment solution. Cooling arrangements were provided in both cathode and anode
compartment to remove the heat from the solution since the membrane is having a
maximum operable temperature limit of 50 oC. Copper tube was used for cooling the
cathode compartment by wrapping it around the cathode compartment because of its high
thermal conductivity. Stainless steel was used for the cooling in anode compartment. This
tube was electrically insulated from the anode.
2.3 Simulated moderator purification system setup for gadolinium removal studies
An experimental set up has been designed and fabricated to simulate the
moderator purification system of the Indian 540 MWe PHWRs, Tarapur Atomic Power
Station (TAPS 3&4). The flow velocity of the system was simulated in the laboratory
setup along with the lower bed volume (BV) and empty bed contact time (EBCT) as
compared to the actual system. Empty bed contact time (EBCT) and bed volumes (BV)
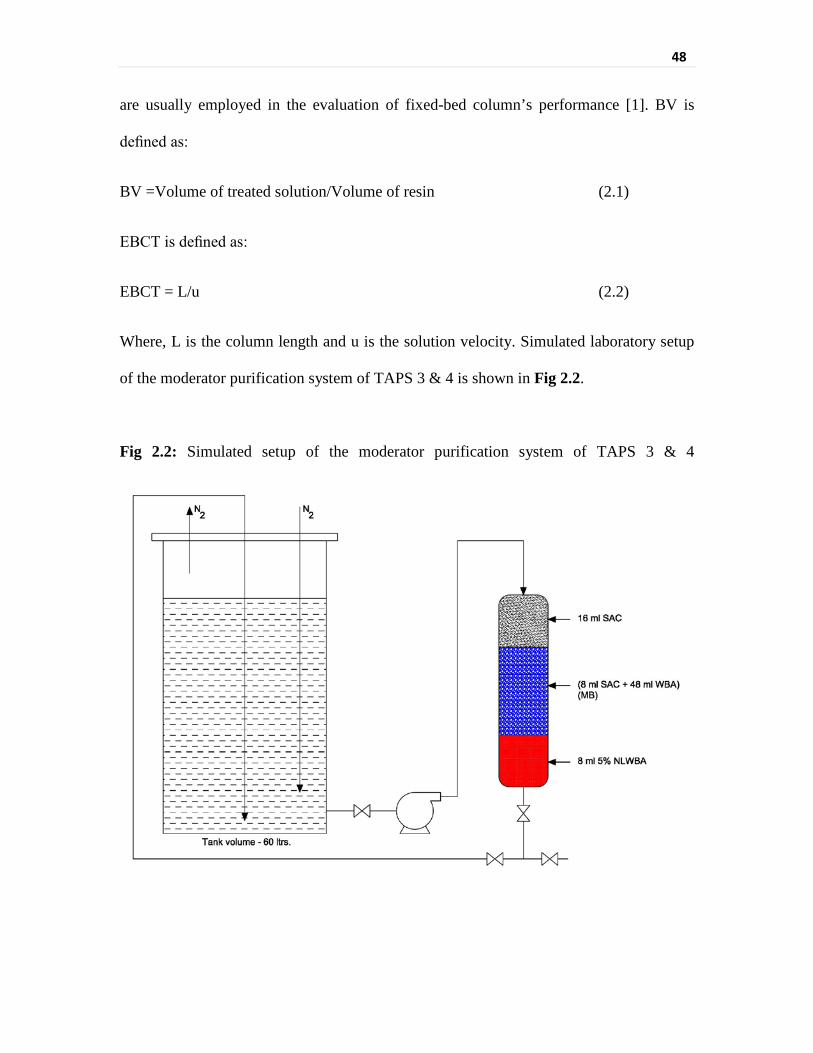
48
are usually employed in the evaluation of fixed-bed column’s performance [1]. BV is
defined as:
BV =Volume of treated solution/Volume of resin (2.1)
EBCT is defined as:
EBCT = L/u (2.2)
Where, L is the column length and u is the solution velocity. Simulated laboratory setup
of the moderator purification system of TAPS 3 & 4 is shown in Fig 2.2.
Fig 2.2: Simulated setup of the moderator purification system of TAPS 3 & 4
49
The moderator inventory is 2,66,363 l of heavy water while the ion exchange columns
have a volume of 200 l. In the laboratory studies, 60 l of 4 and 15 mg kg−1 solution of
Gd(NO3)3 at pH 5 was circulated through 80 ml resin column. The column consisted of
16 ml strong acid cation exchanger (SAC) (Auchtel duolite ARC 9351 in H+ form with
macroporous polystyrene matrix, sulfonic acid functional group, and exchange capacity
of 1.8 meq ml−1) topped mixed bed of 8 ml SAC and 48 ml weak base anion exchanger
(WBA) (Auchtel duolite ARA 9369 WBA with macroporous polystyrene matrix, tertiary
amine functional group, and total exchange capacity of 1.4 meq ml−1) as such and in
another experiment, a similar column with a bottom packing of 8 ml of 5% nitric acid
loaded weak base anion exchanger (NLWBA) mixture with fresh WBA. Thus, the bed
volume of the experimental setup was almost half of that in the reactor. This system has
been used to study the water chemistry control using ion exchange resins.
2.4 Synthesis of different oxidation state vanadium formate solids from aqueous
solution
Sodium metavanadate (AR grade, from S D Fine Chem. Ltd.) and formic acid (ca.
90 %, AR grade from S D Fine Chem. Ltd.) have been used to obtain various vanadium
compounds. Sodium metavanadate has been selected for the study owing to its good
solubility in water. It is also stable compound as compared to its ammonium analogue
[2]. Formic acid is selected to satisfy the criteria of a material compatible product which
can be used in nuclear power plants without having any adverse effect on structural
materials. The solids for each known stable oxidation state of vanadium have been
50
obtained from the above mentioned precursor from the aqueous solution. A saturated
solution of vanadium in the required oxidation state has been prepared through the
feasible route and the precipitate obtained subsequently was filtered and taken for
characterization.
Saturated solution of V(V) could be directly obtained by mixing NaVO3 and
formic acid solutions in a molar ratio of 1:2 or higher. Metavanadate converts to vanadate
by protonation as shown below:
NaVO3 → Na+ + VO3- (2.3)
VO3- + 2H+ → VO2
+ + H2O (2.4)
Vanadate is known to undergo precipitation at higher concentrations [3] as per the
following equation:
V2O5 (s) + 2H+ (aq.) ↔ 2VO2+ (aq.) + H20 (l) (2.5)
Thus, at higher concentrations, V2O5 could be precipitated out through the aqueous route.
The yield of V2O5 has been found to depend upon the concentration of formic acid in the
solution.
V(IV) solution was obtained by chemical reduction using hydrazine in acidic
medium. This reduction is feasible only at a high temperature of almost 80 oC and at
almost twice the required concentration of hydrazine as per the following reaction.
VO2+ + 2H+ + e- → VO2+ + H2O Eo = 1.00V vs. NHE (2.6)
VO3- + 4H+ + e- → VO2+ + 2H2O (overall reduction process) (2.7)
51
N2H4 → N2 + 4H+ + 4e- Eo = 0.23 V vs. NHE (2.8)
The stoichiometry of the above process was established experimentally.
Hydrazine can provide one H+ out of four required by sodium metavanadate for reducing
to VO2+. When the formic acid was stoichiometrically three times the sodium
metavanadate concentration, the chemical reduction of V(V) could not be completed even
after a period of more than 24 hours whereas when the formic acid added was four times
the sodium metavanadate concentration, the V(V) reduction was instantaneous as
indicated by the change in the color of the solution and the corresponding change in the
solution potential.
Hence, the total process during this reduction can be expressed as:
4NaVO3 + 12HCOOH + N2H4 → 4HCOONa + 4VO(HCOO)2 + N2 + 8H2O
(2.9)
Executing the above reaction at sufficiently high concentration of vanadium
resulted in precipitation of blue colored vanadyl formate which was filtered, washed and
taken for subsequent characterization.
V(III) solution could be obtained by electroreduction of either V(V) or V(IV)
formate solutions. Electrolysis of solutions of higher concentrations (above 150 mM) has
resulted in precipitation of a V(III) formate solid. This green colored solid was filtered
and washed before characterization.
V(II) solution could be obtained by electroreduction of either V(V) or V(IV)
formate solutions below 125 mM concentration. It can also be obtained by reduction of
52
either V(V) or V(IV) formate solutions by zinc amalgam. Reduction of high
concentration of V(IV) formate solution (ca. 350 mM) using zinc amalgam has resulted
in precipitation of a brown colored V(II) formate solid which was also characterized after
filtering, washing and drying.
2.5 Instrumental techniques
2.5.1 Ultraviolet - Visible Spectrophotometry
UV - visible Spectroscopy is used in the quantitative determination of solution of
transition metal ions and highly conjugated organic compounds. Molecules absorb UV-
visible light to undergo an electronic transition from the ground state to excited electronic
state. The electronic transition follows certain selection rules. UV absorptions are
generally broad because vibrational and rotational levels are associated with the
electronic levels. A beam of light from a visible and/or UV light source is separated into
its component wavelength by a prism or diffraction grating. Monochromatic beam in turn
is split into two equal intensity beams by a beam splitter. One beam, the sample beam
(colored), passes through a transparent cuvette containing a solution of the compound
being studied in transparent solvent. The other beam, the reference (coloured), passes
through an identical cuvette containing only the solvent. The intensities of these light
beams are then measured by electronic detectors and compared. The intensity of the
reference beam, which should have suffered little or no light absorption, is defined as I0.
The intensity of the sample beam is defined as I. The Beer-Lambert law states that the
53
absorbance of a solution is directly proportional to the solution path length b and the
concentration c of the absorbing species.
A = -log10 (I /I0) = ε⋅ c⋅ l (2.10)
Where A is the measured absorbance, I0 is the intensity of the incident light at a
given wavelength, I is the transmitted intensity, l the path length of the beam through the
sample and c the concentration of the absorbing species. For each species and
wavelength, ε is a constant known as the molar absorptivity or extinction coefficient.
Application in present work: UV-visible spectra was acquired for the aqueous solutions in
a 10 mm path length quartz cuvette with a scanning speed of 200 nm/min using Jasco-V
700 UV-visible spectrophotometer. UV-visible spectrophotometry has been extensively
used in the present work in analysing the solution composition of the transition metal
ions. It has also used been used to evaluate the oxidation states of various redissolved
vanadium formate solids. The analysis methods used in this study were ferric analysis as
ferric sulfosalicylic acid complex, direct vanadium analysis as V(III)/V(II) thiocyanate
complex, chromate analysis as Cr(VI) s-diphenyl carbazide complex and gadolinium
analysis as Gd arsenazo(III) complex.
Ferric forms a red colored complex with sulfosalicylic acid and its wavelength of
maximum absorbance (λmax) is 465 nm. The pH of the analysed solution was maintained
at 4.5 using acetic acid-sodium acetate buffer. This complex shows a linear dynamic
range for 2 to 10 ppm Fe(III) [4].
Direct spectrophotometric method for V(III)/V(II) speciation based on
thiocyanate complex formation has been developed. Well separated peaks for V(II) and
54
V(III) are obtained with K4[V(II)(SCN)6] having a maxima at 724 nm while
K3[V(III)(SCN)6] having a maxima at 595 nm in highly acidic solution (ca. 0.5 M HCl).
The thiocyanate complex shows a linear dynamic range for 2 to 10 mM V(III)/V(II)
solution.
Chromate forms a reddish violet complex with s-diphenyl carbazide in acidic
media with absorption maximum (λmax) at 540 nm. The analysis is done in 1M H2SO4
media. This complex shows a linear dynamic range for 0.2 to 1 ppm Cr(VI) [5].
Gadolinium forms a violet colored complex with arsenazo (III) in acidic media
having absorption maximum (λmax) at 650 nm. The complex shows a linear dynamic
range of 0.05-to 0.3 ppm Gd solution [6].
2.5.2 Flame Atomic Absorption Spectrometry (FAAS)
The soluble metal ions are atomized under flame which subsequently absorb the
characteristic wavelength photons emitted by the same metal lamp source. The extent of
absorption is proportional to concentration and it follows the Beer-Lambert law. Sample
solutions are usually aspirated with the gas flow into a nebulizing/mixing chamber to
form small droplets before entering the flame. Flame burner is subsequently used for
desolvation, vaporization and atomization of liquid sample at higher temperature (2100 –
2800 oC) [7]. Depending upon the nature of sample to be aspirated, the flame is obtained
by using acetylene / N2O as fuels and air / O2 as oxidants.
55
Application in present work: AAS has been used for vanadium and zinc analysis in the
redissolved vanadium formate solids. Avanta AAS from GBC has been used for analysis.
Vanadium has been analysed by N2O – acetylene fuel mixture and the absorbance was
measured at 318.5 nm. Zinc was analysed with air – acetylene fuel mixture and the
absorbance was measured at 213.9 nm. Sodium has also been analysed with the same
system in the emission mode. The sample has been prepared by dissolving 15 mg of solid
in ultrapure nitric acid and then diluting the resulting solution to the desired volume for
analysis. Triplicate analysis have been used to report the results.
2.5.3 Inductively Coupled Plasma – Atomic Emission Spectroscopy (ICP-AES)
It is an emission based technique and hence is more sensitive than the absorbance
based techniques like AAS. The plasma torch excites all the sample elements to their
thermally excited state. These excited elements subsequently emit light at their
characteristic wavelengths as they return to ground state. This light is collected by the
spectrometer and passes through a diffraction grating that serves to resolve the light into a
spectrum of its constituent wavelengths. Within the spectrometer, this diffracted light is
then collected by photomultiplier tubes as detector and amplified to yield an intensity
measurement that can be converted to an elemental concentration by comparison with
calibration standards. This technique is also known as inductively coupled optical
emission spectrometer (ICP-OES), is a very sensitive technique for identification and
quantification of elements in a sample [8]. Detection limits typically range from parts per
million (ppm) to sub parts per billion (ppb), depending on the element and instrument
56
capability. The ICP-AES from HORIBA JOBIN YVON Model ULTIMA 2 was used for
elemental analysis. The instrument has sequential scanning facility based on Czerny
Turner monochromator with 1 meter focal length and a high frequency 40.68 MHz RF
generator. The instrument gives resolution of <10 pm up to 430 mm and < 18 pm up to
430 -800nm. The relative standard deviation was less than 1.5 % for elements analyzed
by the technique.
Application in present work: The metal ion concentrations as analysed by FAAS has been
verified by the ICP-AES analysis. The samples were prepared by dissolving around 7 mg
of solid in ultrapure nitric acid and then making up the resulting solution to 50 ml for
analysis. Emissions from Na, V and Zn were measure at 309.311, 330.237 and 202.551
nm respectively. Triplicate analysis were done and the mean value are reported.
2.5.4 Ion Chromatography
Ion chromatography is the reversible adsorption of charged molecules to
immobilized ion groups on a matrix of opposite charge. The ions are separated from one
another over a column using a suitable mobile phase. The separation is due to the
differential migration of the ions on an ion exchange column [9]. Ion exchange process is
characterized by a corresponding ion exchange equilibrium, which determines the
distribution between the mobile and stationary phase:
E-stat + A-
mob ↔ A-stat + E-
mob (2.11)
A: sample ion, E: eluent ion
57
The equilibrium coefficient is given by the expression:
KA = [A-stat][ E-
mob]/[ A-mob][ E-
stat] (2.12)
KA differs for different ions and hence their affinity for the stationary phase also differs.
Affinity and hence separation of ions is governed by the charge on the ion and the
hydrated radius of the ion. In the third stage, substances are removed from the column by
increasing the ionic strength of the eluting buffer. After separation the ions are
quantitatively analyzed by suitable detector. The detector employed is usually a
conductivity detector but for transition metal ions UV-visible absorption detector is used.
For conductivity detection the solvent is neutralized or suppressed. Thereafter the
conductivity obtained is purely due to the ions of the sample.
Application in present work: Dionex DX-120 ion chromatograph with Dionex
IonPac®AS14 (4×250 mm) analytical column and ASRS Ultra II 4mm suppressor
column was used for analysis. A solution of 3.5 mM Na2CO3 and 1 mM NaHCO3 has
been used as eluent. Analysis was carried out at the eluent flow rate of 1 ml/min using the
sample injection loop volume of 100 µl. Peaks were analysed by using the PeakNet-SE
5.21 software. The samples were prepared by dissolving the vanadium formate solids in
nitrilotriacetic acid (NTA) and citric acid (CA) media. The amount of NTA and CA were
taken so as to form their equimolar solution with respect to vanadium. The concentration
of formate ions in these solution were analysed by the IC.
58
2.5.5 Powder X-ray diffraction (XRD)
XRD is a nondestructive method for the structure analysis of crystals. The sample
is irradiated with monochromatic X-rays and the intensity of the diffracted radiation is
recorded. An important field of application is the identification of crystalline fractions in
powders. Every crystal lattice scatters the X-rays in its own unique diffraction pattern
producing a fingerprint of its atomic and molecular structure. Bragg’s law governs the
conditions for diffraction and diffracted beams are often referred to as reflections [10].
Constructive interference of the reflected beams emerging from different planes will take
place if the difference in the path lengths of two rays is equal to whole number i.e.
nλ = 2dhkl sinθ (2.13)
Where θ is the glancing angle and dhkl is the spacing between the set of crystal plane of
Miller’s indices hkl and n is an integer (1, 2, etc., corresponding to first order, second
order, etc respectively).
Application in present work: XRD patterns of the samples (vanadium formate solids)
were recorded with Philips powder X-ray diffractometer based on PW1710 processing
unit with vertical goniometer (Model PW1820) coupled to PW1729 x-ray generator. The
Cu K∝ X-ray was produced from Philips sealed X-ray tube (30 KV and 20 mA). The
produced X-ray was filtered using a Ni-filter. The diffracted beam was further
monochromatized using curved graphite monochromator with (002) face. The diffracted
X-ray photons were counted using a sealed gas proportional counter. Interfacing the
processing unit to a computer collected the data in the two-theta range of 10-70° at a
scanning speed of 20/min. Peak calculation was done with Cu Kα1 wavelength (1.5406
59
Å). Comparing the standard JCPDS files, the phases present in the samples were
identified.
2.5.6 Fourier-Transformed Infrared (FT-IR) spectrometer
The technique is based on the fact that a chemical substance shows marked
selective absorption (at resonance frequency) in the infrared region. The absorption of IR
radiation, gives rise to close-packed absorption bands, called an IR absorption spectrum,
and the IR absorption band extends over a wide wavelength range. The mid-infrared
region which ranges approximately from 4000–400 cm−1 (2.5 – 25 μm) is used to study
the fundamental vibrations and associated rotational-vibrational structure. The vibrational
mode in a molecule will be "IR active," if it is associated with changes in the dipole [11].
Various bands present in IR spectrum correspond to the characteristic functional group
and bonds present in a chemical substance. Thus, an IR spectrum of a chemical substance
is a fingerprint for its identification. The compound absorbs IR radiation only when the
natural frequency of vibration of some part of a molecule (i.e. atoms or group of atoms
comprising it) is the same as that of the incident radiation. Also, the absorption of IR-
radiation should cause a change in its electric dipole moment as an additional criterion.
Application in present work: IR spectra of the samples were recorded using a Fourier-
transform infrared spectrometer (BOMEM, MB 102) over the range of 400-4000 cm-1.
The samples disks for IR were prepared by adding ~1mg sample to ~300 mg KBr. The
mixture was ground thoroughly and pressed (~160 bars) to obtain pellets, and was
mounted in the IR-sample mounting slot to record the spectra.
60
2.5.7 Thermogravimetry
Thermo Gravimetric Analysis (TGA) is an analytical technique used to determine
a material‘s thermal stability and the fraction of volatile components by monitoring the
weight change that occurs as specimen is heated. The measurement is normally carried
out in air or in an inert atmosphere, like helium or argon, and the weight is recorded as a
function of temperature. The TGA can give information such as composition of multi-
component systems, thermal stability of materials, oxidative stability of materials,
estimated lifetime of a product, decomposition kinetics of materials, the effect of reactive
or corrosive atmosphere on materials, moisture and the volatile content of materials [11].
These essential components include a container in the form of a crucible to hold the
sample, a furnace that can heat the sample to a high temperature, and an appropriate
balance that continuously monitors the sample weight. The test material is placed in an
alumina cup that is supported on an analytical balance located outside the furnace
chamber. The balance is zeroed, and the sample cup is heated according to a
predetermined thermal cycle. The balance sends the weight signal to the computer for
storage, along with the sample temperature and the elapsed time.
Application in present work: Experiments have been carried out using Netzsch
Thermobalance (Model No.: STA 409 PC Luxx). In this work Pt vs. Pt-10% Rh
thermocouples were used as temperature and differential temperature sensors.
Recrystallised alumina sample holders were used as sample and reference holders. TG–
DTA data analysis was done using Proteus software from Netzsch. Simultaneous TG–
DTA–EGA measurements were carried out individually on accurately weighed vanadium

61
samples (about 10 mg) in air and inert atmosphere by heating from room temperature to
700 0C at a heating rate of 10 0C min-1. The flow rate of high purity nitrogen was
maintained at 100 ml min-1to transport the volatile products. Nitrogen was also used as
protective gas to the thermobalance at a flow rate of 20 ml min-1.
2.5.8 X-Ray Photoelectron Spectroscopy (XPS)
Photoelectron spectroscopy is a surface-sensitive (0.5 – 2 nm), nondestructive
method for the investigation of the elements and chemical bonds of conducting,
semiconducting and insulating solids and powders.
In X-Ray Photoelectron Spectroscopy monoenergetic soft X-Rays bombard a sample
material, causing electrons to be ejected. Identification of the elements present in the
sample can be made directly from the kinetic energies of these ejected photoelectrons. If
the energy of monochromatic X rays is known (hν) and the kinetic energy of the emitted
photoelectrons Ke is measured with an electron spectrometer then the binding energy (Be)
of the atomic orbital from which the electron originates can be calculated by means of the
equation [12]
Be= hν –Ke– φ, φ is the work function of the spectrometer (2.14)
On a finer scale it is also possible to identify the chemical state of the elements
present from small variations in the determined kinetic energies. The relative
concentrations of elements can be determined from the measured photoelectron
intensities. For a solid, XPS probes 2-20 atomic layers deep, depending on the material
and the energy of electron. The particular strengths of XPS are, semi quantitative

62
elemental analysis of surfaces without standards, and chemical state analysis, for
materials as diverse as biological to metallurgical. XPS also is known as Electron
Spectroscopy for Chemical Analysis (ESCA).
Application in present work: The XPS study of substituted samples in the present study
were carried out on VG model - ESCALAB MK 200X spectrometer equipped with an Al
K∝ source (1486.6 eV) and calibrated with Au 4f7/2 line at 84.0 eV from a specimen of
Au film on Si substrate. A few milligram of well-ground sample powder was spread
uniformly over indium foil and pressed. The foil was attached to a stainless steel stub for
mounting to the X-Y-Z translator of the XPS system. The appropriate corrections for
charging effect were made with the help of a weak carbon 1s signal appearing at 285.1
eV.
2.5.9 Electrochemical techniques
Tafel Plot
One of the elementary relations in electrochemistry, Butler- Volmer equation
which is the relationship between current and overpotential is used to study the
heterogeneous kinetics and is expressed as follows [13]
𝑖 = 𝐹𝐴𝐾0[𝐶𝑜(0, 𝑡)𝑒−α𝑓𝐸−𝐸0′ − 𝐶𝑅(0, 𝑡)𝑒(1−α)𝑓𝐸−𝐸0
′] (2.15)
where k0 is the standard rate constant, A is the electrode surface area, E0’ is the potential
where forward and reverse rate constants have same value, α is the transfer coefficient, f
= (F/RT), other terms have their usual meaning in electrochemistry. If the solution is well

63
stirred or the current is kept very low so that the surface concentration do not differ
appreciably from the bulk values, the Butler- Volmer equation can then be rewritten as
𝑖 = 𝑖0[𝑒−α𝑓η − 𝑒(1−α)𝑓η] (2.16)
Where, i0 is the exchange current density and η=(E-E0’) is called overpotential. For very
large values of η (either negative or positive), equation (2.16) can be written as
𝑖 = 𝑖0𝑒−α𝑓η
or, η = 2.303𝑅𝑇α𝑓
𝑙𝑜𝑔𝑖0 −2.303𝑅𝑇
α𝑓𝑙𝑜𝑔𝑖 (2.17)
Equation (2.17) follows the Tafel form which is, η = a+b log i
Where, a = (2.303RT/αf)log i0 and b = - (2.303RT/αf)
A plot of η verses log i is called the Tafel plot. Analysing the slope of this plot,
kinetic information about an electrochemical reaction can be extracted. The overpotential
for a given current is indicative of the activation energy required to drive the redox
reaction. Higher exchange current density indicates faster kinetics and hence lower
activation barrier and vice versa. Tafel slopes are related with the symmetry of the barrier
to the reaction. If the barrier is perfectly symmetric, the Tafel slope for a single electron
transfer process will be 118 mV/dec. A higher Tafel slope indicates steeper slope of the
potential energy surface with respect to the reaction coordinate and hence slow rise in
rate of reaction with increasing overpotential. If the Tafel slope is less than 118 mV/dec,
the reaction rate will increase significantly upon applying higher overpotential. A much
lower Tafel slope indicates multielectron transfer.

64
Cyclic Voltammetry
In cyclic voltammetry, the current response of a small stationary electrode in an
unstirred solution is measured after exciting it by a triangular voltage waveform. The
measurement is carried out under a diffusion controlled conditions. The potential is first
varied linearly from one end to the other, after reaching the extreme value the scan
direction is reversed, and the potential is returned to its initial value. The excitation cycle
can be repeated several times. The voltage extremes at which reversal takes place are
called switching potentials [14]. The range of switching potentials chosen for a given
experiment is that within which a diffusion-controlled oxidation or reduction of the
analyte takes place.
Important variables in a cyclic voltammogram are the cathodic peak potential
(Epc), anodic peak potential (Epa), cathodic peak current (ipc), and anodic peak current
(ipa). For a reversible electrode reaction, anodic and cathodic peak currents are
approximately equal in value but opposite in sign. For a reversible electrode reaction at
298 K, the difference in peak potentials, ∆Ep, is
∆Ep = |Epa-Epc| = 0.0592/n V (2.18)
where n is the number of electrons involved in the half reaction. When the electron
transfer kinetics is very slow, irreversibility comes into play and the value of ∆Ep exceeds
the expected value. For irreversible reactions, the value of ∆Ep increases with increasing
65
the scan rate. Quantitative relation between scan rate and peak current is given by
Randles-Sevcik equation which is (at 298K)
ip = 2.686×10⁵n3/2AcDυ1/2 (2.19)
where ip is the peak current (A), A is the electrode area (cm2), D is the diffusion
coefficient (cm2/sec), c is the concentration (mol/cm3), and υ is the scan rate (V/s).
Thus, scan rate affects the peak current and accordingly the variation could be
applied to ascertain the reversibility of the redox process.
Cyclic voltammetry is also used to study the coupled chemical reactions.
Variation in peak current with varying scan rates gives fair idea about the coupled
chemical reactions. Thus, the mechanism of complex heterogeneous redox reactions
could be understood by cyclic voltammetry.
Application in present work: Electrochemical evaluations were carried out in a glass cell
with a solution volume of 25 ml under inert conditions. Planar disk electrodes of stainless
steel, graphite and glassy carbon were used with the geometric surface area of 0.18, 0.18
and 0.13 cm2 respectively. All potentials were measured against the Ag/AgCl, sat. KCl
reference electrode and platinized platinum was used as the counter electrode. Tafel plot,
cyclic voltammetry and AC impedance data were obtained for 0.5 mM HCOOH, 1 mM
V(OH)(HCOO)2, solution of 0.5 mM HCOOH and 1 mM V(OH)(HCOO)2 and solution
of 1 mM HCOOH and 1 mM V(OH)(HCOO)2 for all of the above mentioned electrodes.
0.5 M KNO3 was used as supporting electrolyte in all these experiments. The electrodes
were polished initially by coarse polishing paper and finally with 0.05 µm size alumina
suspension over a nylon cloth, and washed with distilled water before each experiment.

66
Tafel plot was evaluated for each system after a stable open circuit potential
(OCP) value was obtained. The potential was scanned from 400 mV negative potential to
400 mV positive potential with respect to OCP at a scan rate of 1mV/s.
Cyclic voltammograms were obtained at the scan rates of 10 mV/s, 20 mV/s, 50
mV/s, 100 mV/s, 500 mV/s and 1000 mV/s for all systems with the scan range of -650
mV to + 1200 mV vs. Ag/AgCl, sat. KCl.
2.6 References
[1] J. P. Chen, M-L. Chua, B. Zhang, Waste Management, 22 (2002) 711.
[2] J. Trau, J. Thermal Anal., 6 (1974) 355.
[3] M. Skyllas Kazacos, C. Menictas, and M. Kazacos, J. Electrochem. Soc., 143 (1996)
L86.
[4] K. Ogawa and N. Tobe, Bull. Chem. Soc. Japan, 39 (1996) 223.
[5] Jens E.T. Andersen, Anal. Chim. Acta, 361 (1998) 125.
[6] K. Macgibbon, R. Culligan And G.H. Brown, Point Lepreau Generating Station
Chemistry Laboratory Analytical Procedure :Gadolinium Arsenazo III, 78200-AP-
GA1, 2014.
[7] J.A. Dean and T.C. Rains, “Flame Emission and Atomic Absorption Spectrometry”,
New York: Marcel Dekker Inc., Vol. 1 (1971).
67
[8] E. S. Dipietro, M. M. Bashor, P. E. Stroud, B. J. Smarr, B. J. Burgess, W. E. Turner
and J. W. Neese, Sc. Total Environ., 74 (1988) 249.
[9] J. S. Fritz and D. T. Gjerde, Ion Chromatography, Third Ed., Weinheim: Wiley-VCH,
(2000).
[10] C. Kittel, Introduction to Solid State Physics, New York John Wiley & sons, 1953.
[11] D. A. Skoog, F. J. Holler and T. A. Nieman, Principles of Instrumental Analysis,
Harcourt Asia Pvt. Ltd., 2001.
[12] D. Briggs and M. P. Seah, Practical Surface Analysis by Auger and X-ray
Photoelectron Spectroscopy, John Wiley & Sons, 1987.
[13] A. J. Bard and L. R. Faulkner, Electrochemical Methods Fundamentals and
Applications: Second Edition, John Wiley & Sons, Inc. 2001.
[14] P. T. Kissinger and W. R. Heineman, J. Chem. Edu., 60 (1983) 702.

68
CHAPTER-3
Studies on Optimization of Parameters for Vanadium Synthesis in Low
Oxidation State
3.1 Introduction
Decontamination of light water reactors wherein stainless steel is used as major
structural material such as BWRs and PWRs involves removal of various substituted
ferrites with high lattice energies. Strong reducing agents such as ones based on
vanadium (II) and chromium (II) are very effective in reductive dissolution of such
oxides [1-5].
Although vanadous formulations can be easily obtained by chemical reduction
using stronger reducing agents like zinc amalgam, but the subsequent use in nuclear
power reactor limits the option of synthesis owing to the material compatibility and the
active waste volume generation issues [6]. Synthesis of vanadous formulation through
electrolytic reduction is a viable option for the purpose as any other chemical route will
inevitably introduce spare reagents/byproducts in the formulation [7]. These spare
reagents/byproducts will finally increase the ionic load of the spent decontamination
formulation and thereby lead to higher active waste volume generation. Concerns about
material compatibility for stainless steel structural materials rule out use of any strong
acid or its conjugate anion in the formulation [8, 9]. Electrolytic route provides the
flexibility to select the exact required medium for synthesis without any addition of spare
reagent/byproduct [10]. The prevalent oxidation states of vanadium compounds are 5+
and 4+. The conversion from the prevalent 5+ or 4+ state to 2+ requires considerable
69
time due to the ensuing three or two step electrolysis. The stringent requirement of inert
condition poses immense handling related issues for the large scale application. These
can be addressed in two ways. The first and the preferred one is to prepare a material
compatible V(II) solid compound which can be directly added to the reactor system
during the decontamination campaign. The second option is to optimize the preparation
of a high concentration V(II) solution in a material compatible formulation which will
reduce the volume to be handled during the decontamination campaign.
V(V) or V(IV) solutions are the stable precursors available for synthesis of V(II)
formulations. V(V) formate could be obtained by direct addition of formic acid to sodium
metavanadate solution while V(IV) formate was obtained by chemically reducing the
V(V) formate by hydrazine addition. Maximum solubility of aqueous V(V) and V(IV)
formate solution has been evaluated by gradually increasing the concentration with
conductivity and turbidity monitoring.
Electroreduction of aqueous V(V) or V(IV) precursor solutions in the material
compatible formulation is the most suitable route for preparation of V(II). Controlled
current electrolysis using two compartment cell has been studied for V(II) preparation.
Suitable cathode materials have been evaluated for the purpose. The synthesis of V(II) in
acidic medium will be affected by the competing proton reduction process as the formal
redox potential for hydrogen evolution is more positive than that for V(III)/V(II) redox
potential. Thus, a high current efficiency for V(III)/V(II) redox process can only be
obtained at electrodes which have high overpotential for hydrogen evolution. Heavy
metals like Hg, Cd and Pb are known to have high overpotential for hydrogen evolution
[11] but these are avoided in large scale application owing to their high toxicity. Stainless

70
steel and carbon based cathodes could be among the viable options. On the other hand,
accelerated hydrogen evolution in the presence of V(III)/V(II) redox couple will indicate
a cathode which can be used for electrocatalytic hydrogen generation from weak organic
acids. The electrochemical characteristics of glassy carbon and stainless steel electrodes
have been evaluated for the electroreduction of synthesized vanadic hydroxyl formate.
Tafel plot evaluation and cyclic voltammetric studies of these materials have been carried
out for the purpose.
Different solids of vanadium have been prepared by aqueous route in the formic
acid medium. The vanadium compounds were obtained for all known aqueous vanadium
oxidation states viz. V(V), V(IV), V(III) and V(II). The compounds were obtained by
preparing aqueous saturated solutions of the different oxidation states of vanadium
through various routes. The compounds were characterized for the chemical composition,
oxidation states, thermal stability, structural information and formation of aqueous
complexes with suitable ligands namely nitrilotriacetic acid and citric acid.
3.2 Experimental
3.2.1 Evaluation of maximum solubility of V(V) and V(IV) aqueous solutions
The maximum solubility of V(V) formate was evaluated by its in situ generation
by mixing the stock solutions of NaVO3 and HCOOH in the 1:2 and 1:6 molar ratio. The
conductivity was measured using CON 1500 conductivity meter from Eutech Instruments
with four probe electrode and resolution of 0.001 µS cm-1 and turbidity was measured
using Systronics µC turbiditymeter 135 with a 25 mm diameter flat bottom test tube. The
concentration of the solution was progressively increased to evaluate the saturation
71
solubility behaviour of V(V). V(IV) formate solution was in situ generated by mixing the
stocks of NaVO3, HCOOH and N2H4⋅H2O in required molar ratio at 80 oC under inert
atmosphere. The concentration of the solution was progressively increased with periodic
measurement of conductivity and turbidity.
3.2.2 Constant current electrolysis and electrochemical evaluation of electrodes
Sodium metavanadate was electrolyzed in formic acid medium using a two
compartment electrolysis cell. The constant current electrolysis was carried out with
V(V) precursor at 125 mM concentration and V(IV) precursor at 350 mM concentration.
Similar concentration of formic acid was used as anolyte. The electrochemical cell used
is an in-house designed and fabricated glass cell with two compartments separated by an
anion exchange membrane. The cell consists of two concentric cylindrical compartments,
the inner being anode compartment and outer one being cathode compartment. An anion
exchange membrane was placed at bottom of the anode compartment to separate the
catholyte and the anolyte. Graphite felt was used as the cathode while stainless steel AISI
304 was used as the anode and the compartments were separated by a commercial anion
exchange membrane. Constant current electrolysis was carried out using Aplab regulated
DC power supply type: CBPS/10 with a current density of around 55 mA/cm2 across the
anion exchange membrane. Catholyte volume was 550 ml while the anolyte volume was
50 ml. Applied cell voltage, cathode potential, solution potential and the current obtained
during the process were monitored to assess the reduction.
Electrochemical evaluations were carried out in a glass cell with a solution
volume of 25 ml under inert conditions. Planar disk electrodes of stainless steel, graphite

72
and glassy carbon were used with the geometric surface area of 0.18, 0.18 and 0.13 cm2
respectively. All the potentials were measured against the Ag/AgCl, sat. KCl reference
electrode and platinized platinum was used as the counter electrode. Tafel plot, cyclic
voltammetry and AC impedance data were obtained for 0.5 mM HCOOH, 1 mM
V(OH)(HCOO)2, mixture of 0.5 mM HCOOH and 1 mM V(OH)(HCOO)2 and mixture of
1 mM HCOOH and 1 mM V(OH)(HCOO)2 for all of the above mentioned electrodes. 0.5
M KNO3 was used as supporting electrolyte in all these experiments. The electrodes were
polished initially by coarse polishing paper and finally with 0.05 µm size alumina
suspension over a nylon cloth, and washed with distilled water before each experiment.
Tafel plot was evaluated for each system after a stable open circuit potential
(OCP) value was obtained. The potential was scanned from 400 mV negative potential to
400 mV positive potential with respect to OCP at a scan rate of 1mV/s.
Cyclic voltammograms were obtained at the scan rates of 10 mV/s, 20 mV/s, 50
mV/s, 100 mV/s, 500 mV/s and 1000 mV/s for all the systems with the scan range of -
650 mV to + 1200 mV vs. Ag/AgCl, sat. KCl.
3.2.3 Synthesis and characterization of different oxidation state vanadium solids
The vanadium solids in various oxidation states viz. V(V), V(IV), V(III) and V(II)
were obtained from the respective vanadium formate solutions by exceeding the
solubility limit. V(V) formate saturated solution was directly obtained by mixing NaVO3
with HCOOH in the required molar ratio. V(IV) formate saturated solution was prepared
by the chemical reduction of V(V) formate solution using hydrazine at 80 oC under inert
73
atmosphere. V(III) formate saturated solution was prepared by electrolytic reduction of
high concentration (350 mM) V(IV) solution while V(II) formate saturated solution was
obtained by electrochemical reduction of 350 mM V(IV) formate solution using zinc
amalgam. The precipitates obtained were filtered, washed, and dried in a vacuum
desiccator. The dried precipitates were grinded using mortar and pestle before washing
and drying again. The process was repeated several times. These precipitates were used
for characterization. Compositional analysis was done by Atomic Absorption
Spectrometry (AAS), Inductively Coupled Plasma – Atomic Emission Spectroscopy
(ICP-AES) and Ion Chromatography (IC). For AAS and ICP-AES, the samples were
prepared by dissolving the known weight of precipitate in ultrapure nitric acid and then
diluting the resulting solution to the desired volume for analysis. Based on the analysed
vanadium content in the precipitate, the solids were dissolved in equimolar concentration
of nitrilotriacetic acid (NTA) and citric acid and these solutions were used for IC
analysis. A solution of 3.5 mM Na2CO3 and 1 mM NaHCO3 has been used as eluent.
Analysis was carried out at the eluent flow rate of 1 ml/min using the sample injection
loop volume of 100 µl. Further characterization with thermogravimetry (TG) using
Netzsch Thermobalance (Model No.: STA 409 PC Luxx), infra-red spectroscopy (IR) in
KBr matrix (Bomem MB 102 FTIR) and UV –visible spectroscopy (Jasco-700) were also
carried out. XRD using Philips powder X-ray diffractometer based on PW1710
processing unit and XPS using VG model - ESCALAB MK 200X were carried out for
the structural characterization of the samples.
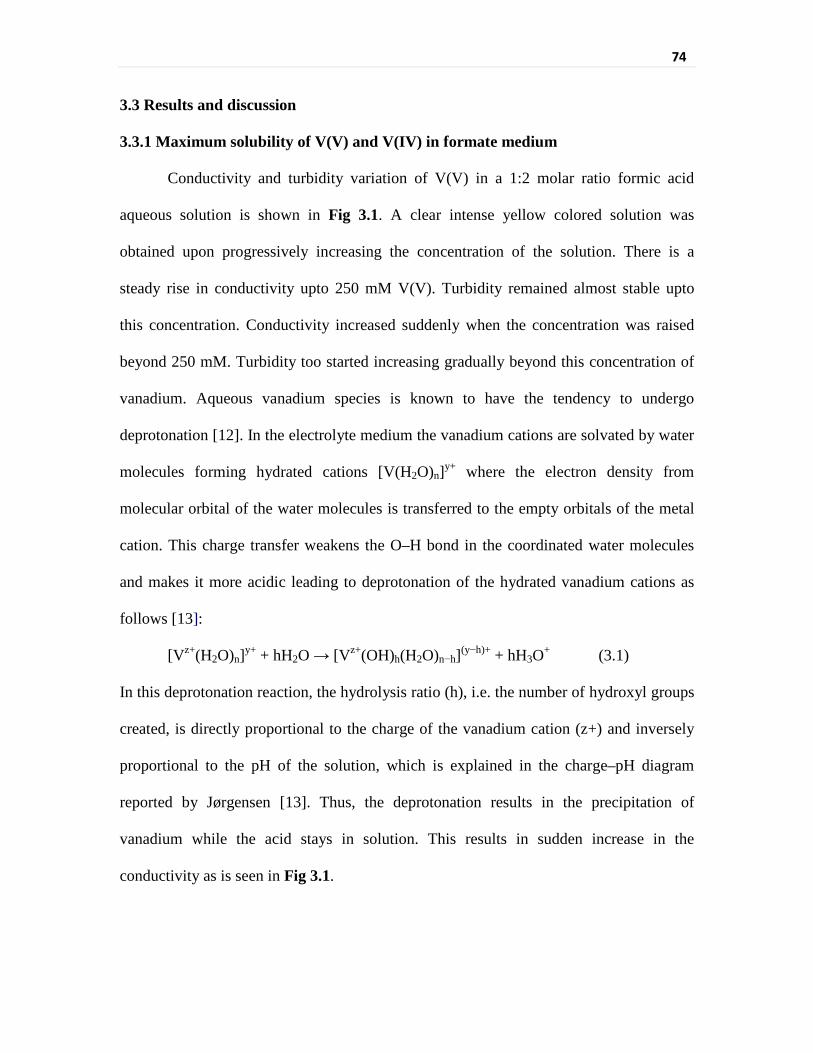
74
3.3 Results and discussion
3.3.1 Maximum solubility of V(V) and V(IV) in formate medium
Conductivity and turbidity variation of V(V) in a 1:2 molar ratio formic acid
aqueous solution is shown in Fig 3.1. A clear intense yellow colored solution was
obtained upon progressively increasing the concentration of the solution. There is a
steady rise in conductivity upto 250 mM V(V). Turbidity remained almost stable upto
this concentration. Conductivity increased suddenly when the concentration was raised
beyond 250 mM. Turbidity too started increasing gradually beyond this concentration of
vanadium. Aqueous vanadium species is known to have the tendency to undergo
deprotonation [12]. In the electrolyte medium the vanadium cations are solvated by water
molecules forming hydrated cations [V(H2O)n]y+ where the electron density from
molecular orbital of the water molecules is transferred to the empty orbitals of the metal
cation. This charge transfer weakens the O–H bond in the coordinated water molecules
and makes it more acidic leading to deprotonation of the hydrated vanadium cations as
follows [13]:
[Vz+(H2O)n]y+ + hH2O → [Vz+(OH)h(H2O)n−h](y−h)+ + hH3O+ (3.1)
In this deprotonation reaction, the hydrolysis ratio (h), i.e. the number of hydroxyl groups
created, is directly proportional to the charge of the vanadium cation (z+) and inversely
proportional to the pH of the solution, which is explained in the charge–pH diagram
reported by Jørgensen [13]. Thus, the deprotonation results in the precipitation of
vanadium while the acid stays in solution. This results in sudden increase in the
conductivity as is seen in Fig 3.1.

75
Fig 3.1: Conductivity and turbidity variation of V(V) formate solution (two times acid)
0 50 100 150 200 250 300 350 4000
10
20
30
Cond
uctiv
ity (µ
S/cm
)
Concentration (mM)
0
4
8
12
16
Tur
bidi
ty (N
TU)
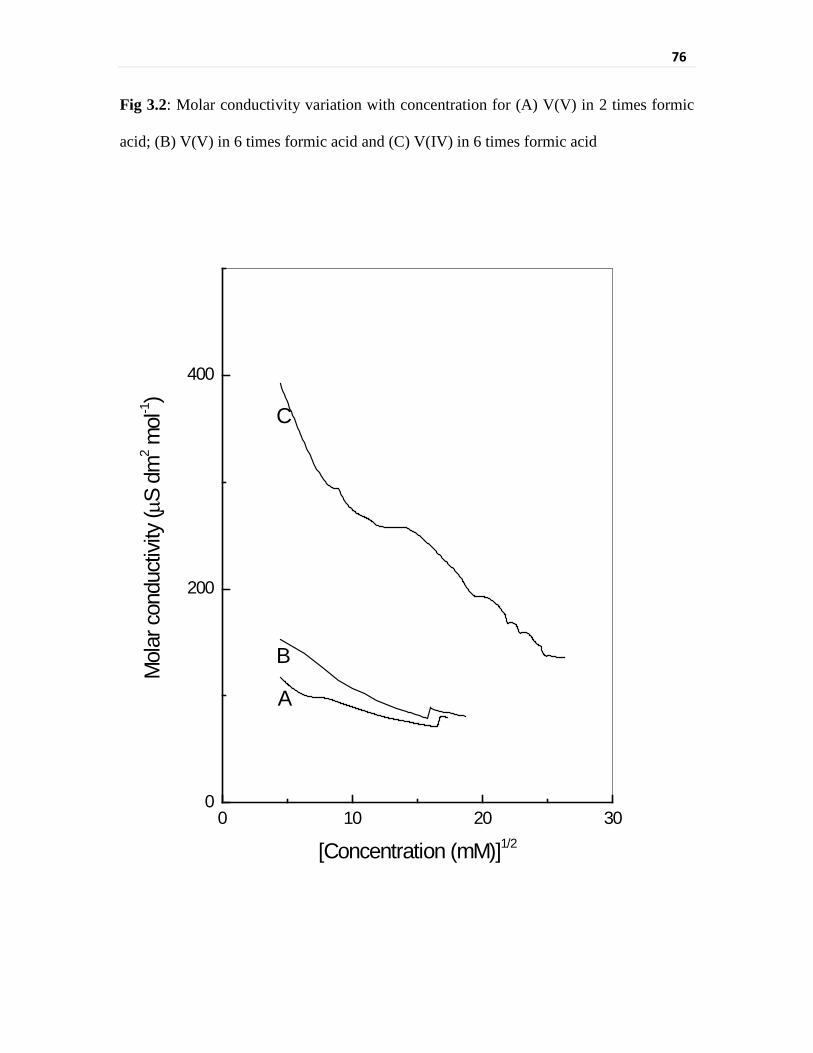
76
Fig 3.2: Molar conductivity variation with concentration for (A) V(V) in 2 times formic
acid; (B) V(V) in 6 times formic acid and (C) V(IV) in 6 times formic acid
0 10 20 300
200
400
Mol
ar c
ondu
ctivi
ty (µ
S dm
2 mol
-1)
[Concentration (mM)]1/2
A
B
C
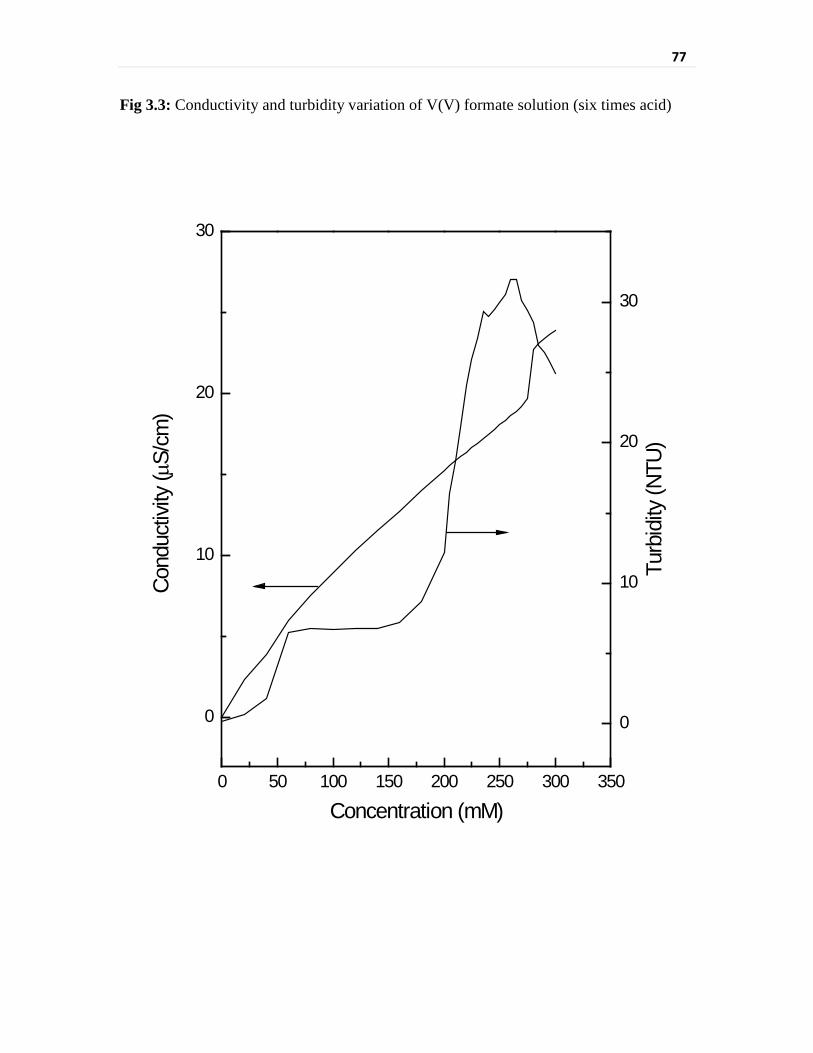
77
Fig 3.3: Conductivity and turbidity variation of V(V) formate solution (six times acid)
0 50 100 150 200 250 300 350
0
10
20
30
Cond
uctiv
ity (µ
S/cm
)
Concentration (mM)
0
10
20
30
Tur
bidi
ty (N
TU)
78
The molar conductivity variation with concentration has shown the nature of intermediate
electrolyte as per the Debye-Huckel-Onsagar expression for solution conductivity:
Λ𝑚 = Λ𝑚𝑜 − (𝐴 + 𝐵⋅Λ𝑚𝑜 )⋅√𝑐 (3.2)
Where, Λ𝑚 is the molar conductivity, Λ𝑚𝑜 is the limiting molar conductivity, c is the
electrolyte concentration and A and B are constants that depend quantities such as
temperature, the charges on the ions and the dielectric constant and viscosity of the
solvent. This is shown by the plot A in Fig 3.2.
Conductivity and turbidity variation of V(V) solution in a 1:6 molar ratio formic
acid solution is shown in Fig 3.3. Conductivity of the solution has increased gradually
upto a concentration of 275 mM. Formation of higher vanadium concentration solution
with increasing acidity can be explained by the equilibrium [14]:
V2O5 (S) + 2H+ 2VO2+ (aq) + H2O (3.3)
There is a sharp rise in conductivity upon further increase in the concentration of
vanadium. Variation in turbidity has shown that the solution is less stable at even lesser
concentration. The turbidity of solution started rising beyond concentration of 150 mM
vanadium in solution. This can be attributed to the tendency of V(V) to form oligomeric
species which seems to remain suspended in solution and not significantly affect the
conductivity of the solution. Turbidity has started decreasing once the deprotonation
initiated indicating that the suspended oligomeric vanadium species undergoes
deprotonation at a faster rate than the soluble vanadate species. The intermediate
electrolyte behavior of the vanadate remained unchanged with increasing acidity as
shown in plot B, Fig 3.2.
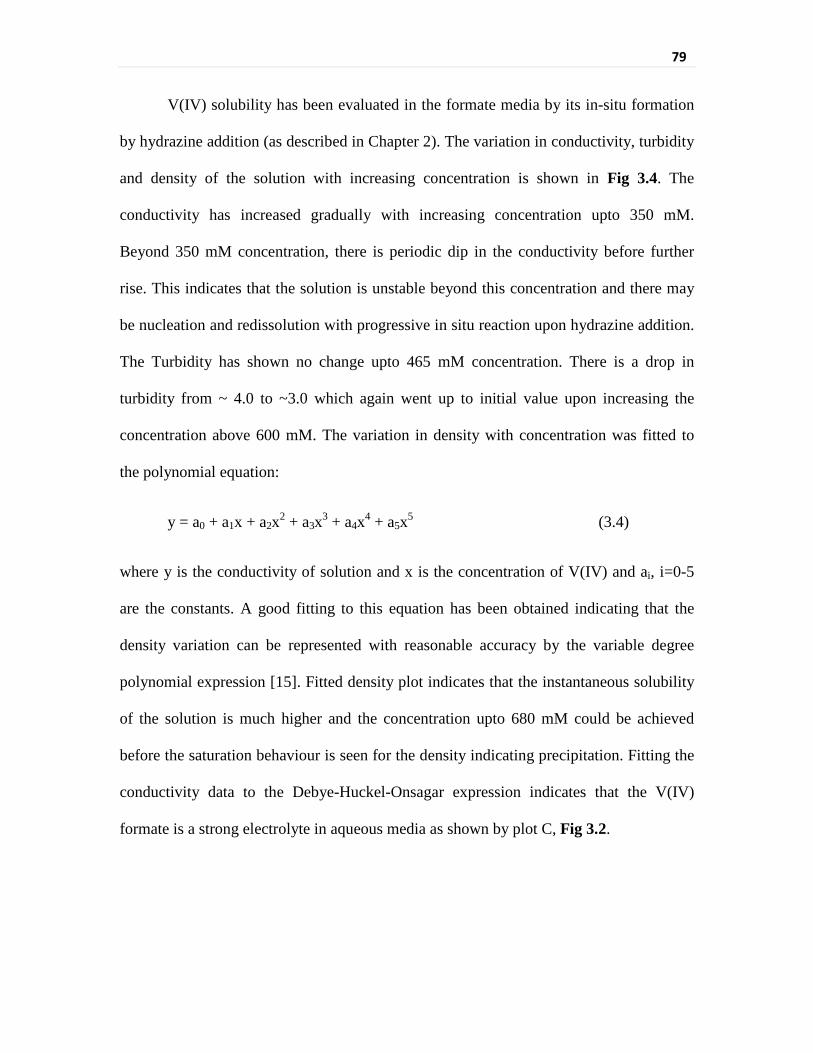
79
V(IV) solubility has been evaluated in the formate media by its in-situ formation
by hydrazine addition (as described in Chapter 2). The variation in conductivity, turbidity
and density of the solution with increasing concentration is shown in Fig 3.4. The
conductivity has increased gradually with increasing concentration upto 350 mM.
Beyond 350 mM concentration, there is periodic dip in the conductivity before further
rise. This indicates that the solution is unstable beyond this concentration and there may
be nucleation and redissolution with progressive in situ reaction upon hydrazine addition.
The Turbidity has shown no change upto 465 mM concentration. There is a drop in
turbidity from ~ 4.0 to ~3.0 which again went up to initial value upon increasing the
concentration above 600 mM. The variation in density with concentration was fitted to
the polynomial equation:
y = a0 + a1x + a2x2 + a3x3 + a4x4 + a5x5 (3.4)
where y is the conductivity of solution and x is the concentration of V(IV) and ai, i=0-5
are the constants. A good fitting to this equation has been obtained indicating that the
density variation can be represented with reasonable accuracy by the variable degree
polynomial expression [15]. Fitted density plot indicates that the instantaneous solubility
of the solution is much higher and the concentration upto 680 mM could be achieved
before the saturation behaviour is seen for the density indicating precipitation. Fitting the
conductivity data to the Debye-Huckel-Onsagar expression indicates that the V(IV)
formate is a strong electrolyte in aqueous media as shown by plot C, Fig 3.2.
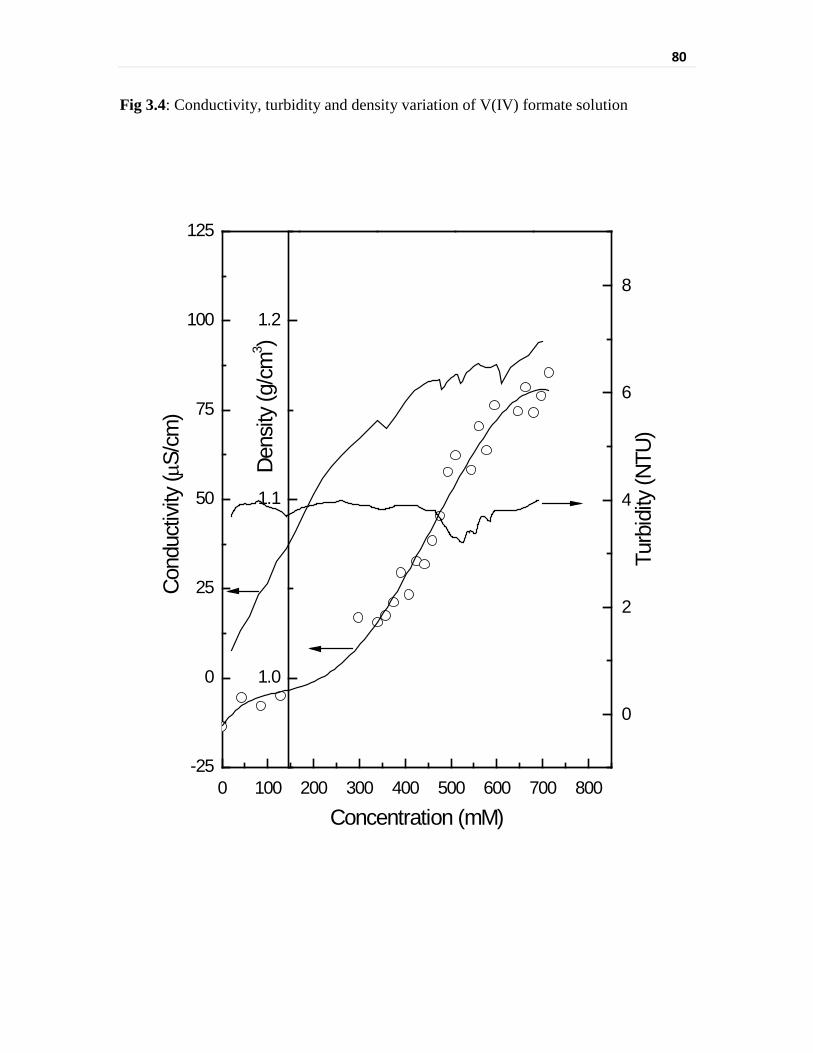
80
Fig 3.4: Conductivity, turbidity and density variation of V(IV) formate solution
-25
0
25
50
75
100
125
Cond
uctiv
ity (µ
S/cm
)
1.0
1.1
1.2
Den
sity
(g/c
m3 )
0 100 200 300 400 500 600 700 800
0
2
4
6
8
Turb
idity
(NTU
)
Concentration (mM)
81
The equilibrium concentration of these solutions were determined after two weeks
of the solution preparation. Polymeric film had formed on the surface of the glass vessel
used to stored V(V) solution while a blue precipitate layer could be seen at the bottom of
the vessel in which V(IV) solution was kept. The equilibrium concentrations were found
to be 50 mM for V(V) with two times formic acid, 150 mM for V(V) with six times
formic acid and 450 mM for V(IV) with six times formic acid.
3.3.2 Constant current electrolysis for vanadium reduction
V(V) formate and V(IV) formate at a concentration of 125 mM were separately
reduced by the constant current electrolysis. These reduction processes in cathode
compartment can be shown as:
VO2+ + 2H+ + e-→ VO2+ + H2O E° = 1.00 V vs SHE (3.5)
VO2+ + 2H+ + e-→ V3+ + H2O E° = 0.337 V vs SHE (3.6)
V3+ + e- → V2+ Eo = -0.255 V vs. SHE (3.7)
Formate ion migrates to anode compartment from the cathode compartment through the
anion exchange membrane continuously during the progress of electrolysis. In the anode
compartment, two formate ions form one carbon dioxide and one formic acid molecule.
This reaction can be expressed as
2HCOO- → CO2 + 2e- + HCOOH (3.8)
In this way the concentration of formic acid continuously increases in anode
compartment during the process. This also leads to a rise in the solution volume of the
82
anode compartment by migration of water molecule to anode compartment owing to the
osmotic effect.
A clear V(II) formate solution has been finally obtained by electrolysis of either
V(IV) or V(V) precursors. V(IV) formate takes 2/3rd time to form V(II) as compared to
V(V) formate. Based on the total charge passed for the reduction, the current efficiency
for the process was calculated to be more than 85%. Rest of the current can be attributed
to the hydrogen evolution by acid reduction which is a competitive process and for the
reduction of the oxygen which might have diffused in the cathode compartment during
electrolysis.
3.3.3 Electrochemical evaluation of suitable cathode material
Potentiodynamic polarization studies: The Tafel plots evaluated for the stainless steel,
glassy carbon and graphite electrodes are shown in Fig 3.5. The plots were evaluated for
the rising part of the current and the electrochemical parameters determined by the
evaluation are enlisted in Tables 3.1, 3.2 and 3.3. Corrosion potential of V(OH)(HCOO)2
system is more negative than that of HCOOH for both stainless steel and glassy carbon
electrodes. Corrosion potential of V3+ has shifted towards positive direction with addition
of acid in case of glassy carbon electrode whereas it has shifted to more negative values
upon addition of acid for stainless steel electrode. The behaviour of glassy carbon is as
anticipated for mixing the solutions of different corrosion potential values as per the
mixed potential theory.
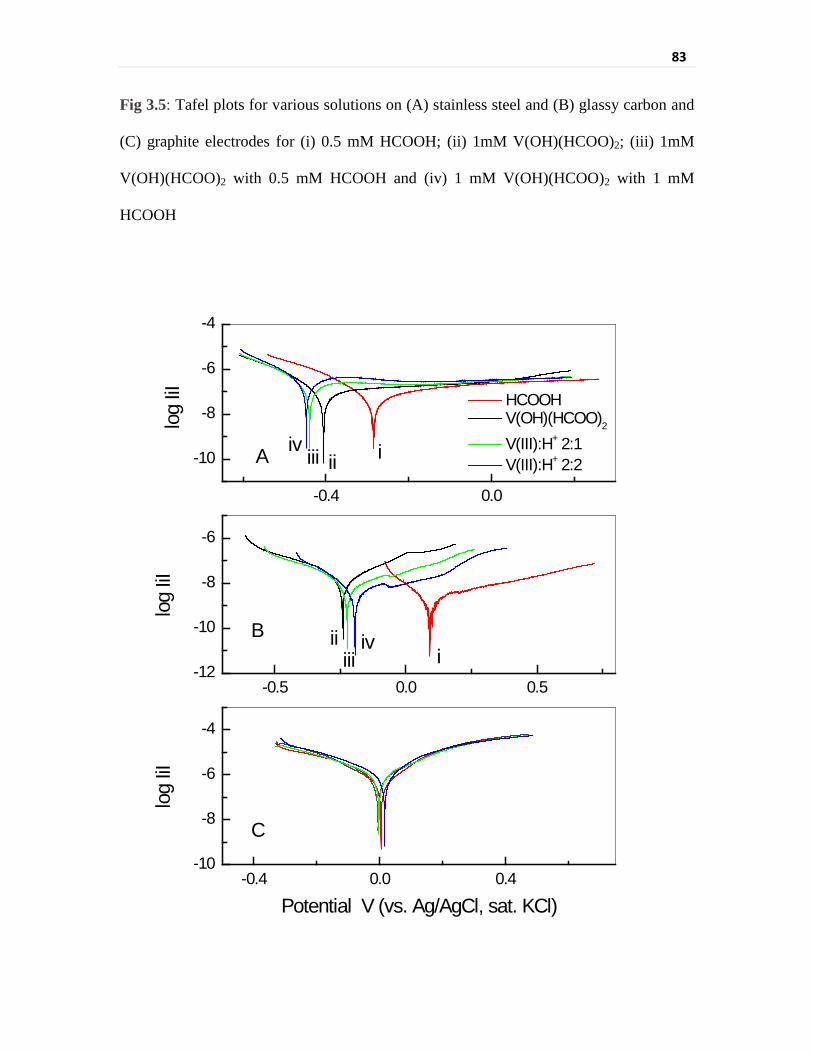
83
Fig 3.5: Tafel plots for various solutions on (A) stainless steel and (B) glassy carbon and
(C) graphite electrodes for (i) 0.5 mM HCOOH; (ii) 1mM V(OH)(HCOO)2; (iii) 1mM
V(OH)(HCOO)2 with 0.5 mM HCOOH and (iv) 1 mM V(OH)(HCOO)2 with 1 mM
HCOOH
-0.4 0.0
-10
-8
-6
-4
-0.5 0.0 0.5-12
-10
-8
-6
-0.4 0.0 0.4-10
-8
-6
-4
log
IiI HCOOH V(OH)(HCOO)2
V(III):H+ 2:1 V(III):H+ 2:2A iiiiiiiv
log
IiI
Bi
iiiii
iv
log
IiI
Potential V (vs. Ag/AgCl, sat. KCl)
C
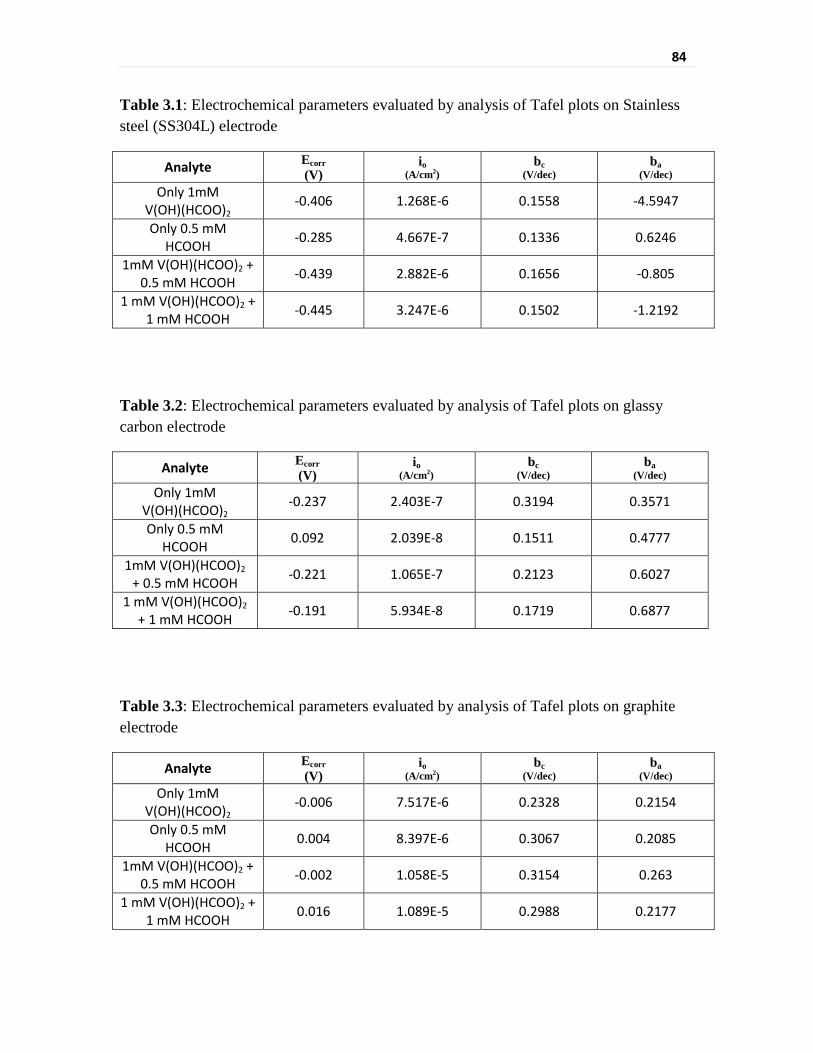
84
Table 3.1: Electrochemical parameters evaluated by analysis of Tafel plots on Stainless steel (SS304L) electrode
Analyte Ecorr (V)
io (A/cm2)
bc (V/dec)
ba (V/dec)
Only 1mM V(OH)(HCOO)2
-0.406 1.268E-6 0.1558 -4.5947
Only 0.5 mM HCOOH -0.285 4.667E-7 0.1336 0.6246
1mM V(OH)(HCOO)2 + 0.5 mM HCOOH -0.439 2.882E-6 0.1656 -0.805
1 mM V(OH)(HCOO)2 + 1 mM HCOOH -0.445 3.247E-6 0.1502 -1.2192
Table 3.2: Electrochemical parameters evaluated by analysis of Tafel plots on glassy carbon electrode
Analyte Ecorr (V)
io (A/cm2)
bc (V/dec)
ba (V/dec)
Only 1mM V(OH)(HCOO)2
-0.237 2.403E-7 0.3194 0.3571
Only 0.5 mM HCOOH 0.092 2.039E-8 0.1511 0.4777
1mM V(OH)(HCOO)2 + 0.5 mM HCOOH -0.221 1.065E-7 0.2123 0.6027
1 mM V(OH)(HCOO)2 + 1 mM HCOOH -0.191 5.934E-8 0.1719 0.6877
Table 3.3: Electrochemical parameters evaluated by analysis of Tafel plots on graphite electrode
Analyte Ecorr (V)
io (A/cm2)
bc (V/dec)
ba (V/dec)
Only 1mM V(OH)(HCOO)2
-0.006 7.517E-6 0.2328 0.2154
Only 0.5 mM HCOOH 0.004 8.397E-6 0.3067 0.2085
1mM V(OH)(HCOO)2 + 0.5 mM HCOOH -0.002 1.058E-5 0.3154 0.263
1 mM V(OH)(HCOO)2 + 1 mM HCOOH 0.016 1.089E-5 0.2988 0.2177

85
However, the behaviour of stainless steel electrode indicates deviation from
normal redox process on the electrode. The exchange current density is higher for V(III)
on stainless steel as compared to that on glassy carbon (~ 5 times). The exchange current
density for HCOOH itself is much higher for stainless steel electrode as compared to that
for glassy carbon (~23 times). The increase in exchange current density for V(III) as
compared to that for HCOOH is much more on glassy carbon electrode, 11.8 times as
compared to 2.7 times for stainless steel electrode. Exchange current density for V(III)
has shown two fold increase upon addition of equimolar concentration of HCOOH on
stainless steel electrode whereas it reduced to less than half on glassy carbon for similar
acid addition. Further addition of acid has changed the current densities on these two
electrodes in similar fashion though to different extents. There is a minor rise in the
current density in case of stainless steel while the current density reduced again to about
half in case of glassy carbon. This indicates that there is a reduction in active surface
availability for V(III) reduction on carbon surface with addition of acid. This was further
verified by similar addition of HNO3. The cathodic Tafel slopes for stainless steel
electrode remained similar for V(III) even after addition of HCOOH while on glassy
carbon, the addition of acid lead to significant decrease in the cathodic Tafel slope. This
indicates that addition of acid makes V(III) reduction kinetically more favourable on
carbon surfaces. The anodic side of the potentiodynamic graph has shown a non linearity
to Tafel behviour at high overpotentials on glassy carbon electrode. Non linearity to Tafel
behaviour on anodic polarization is more prominent and sets in at lower overpotentials on
stainless steel electrode. The shift in corrosion potential in variation with the mixed
potential theory and high increase of exchange current density on addition of acid in case
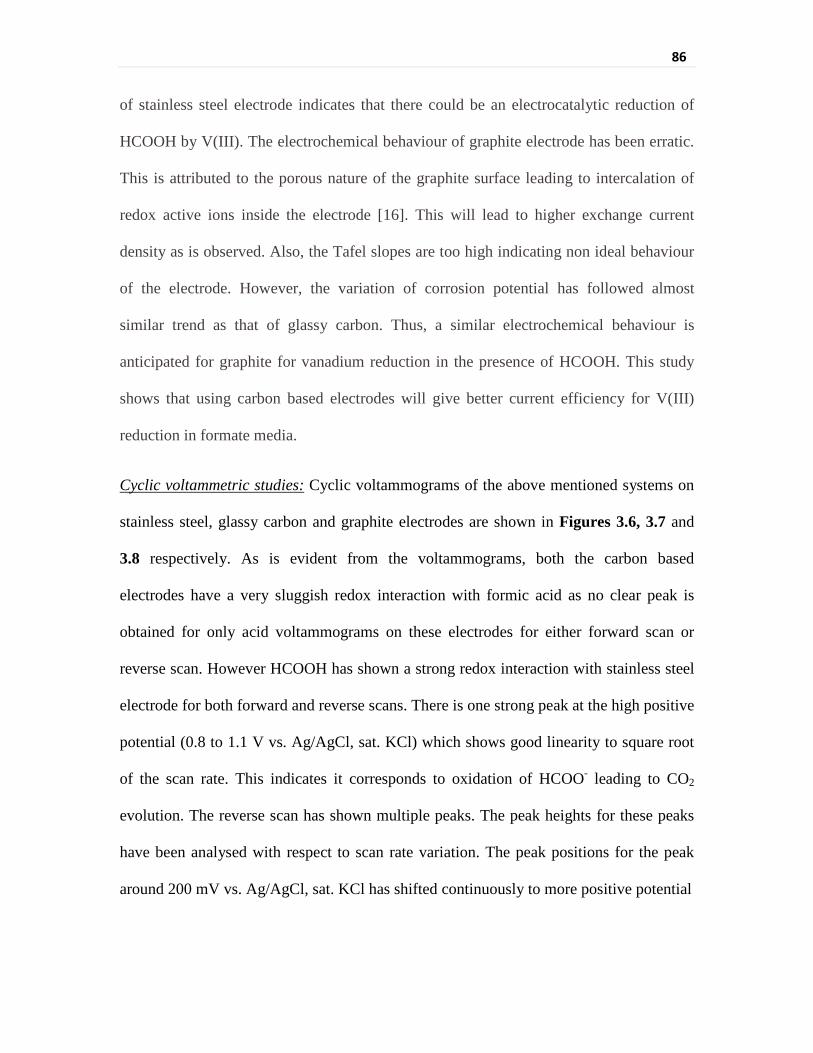
86
of stainless steel electrode indicates that there could be an electrocatalytic reduction of
HCOOH by V(III). The electrochemical behaviour of graphite electrode has been erratic.
This is attributed to the porous nature of the graphite surface leading to intercalation of
redox active ions inside the electrode [16]. This will lead to higher exchange current
density as is observed. Also, the Tafel slopes are too high indicating non ideal behaviour
of the electrode. However, the variation of corrosion potential has followed almost
similar trend as that of glassy carbon. Thus, a similar electrochemical behaviour is
anticipated for graphite for vanadium reduction in the presence of HCOOH. This study
shows that using carbon based electrodes will give better current efficiency for V(III)
reduction in formate media.
Cyclic voltammetric studies: Cyclic voltammograms of the above mentioned systems on
stainless steel, glassy carbon and graphite electrodes are shown in Figures 3.6, 3.7 and
3.8 respectively. As is evident from the voltammograms, both the carbon based
electrodes have a very sluggish redox interaction with formic acid as no clear peak is
obtained for only acid voltammograms on these electrodes for either forward scan or
reverse scan. However HCOOH has shown a strong redox interaction with stainless steel
electrode for both forward and reverse scans. There is one strong peak at the high positive
potential (0.8 to 1.1 V vs. Ag/AgCl, sat. KCl) which shows good linearity to square root
of the scan rate. This indicates it corresponds to oxidation of HCOO- leading to CO2
evolution. The reverse scan has shown multiple peaks. The peak heights for these peaks
have been analysed with respect to scan rate variation. The peak positions for the peak
around 200 mV vs. Ag/AgCl, sat. KCl has shifted continuously to more positive potential
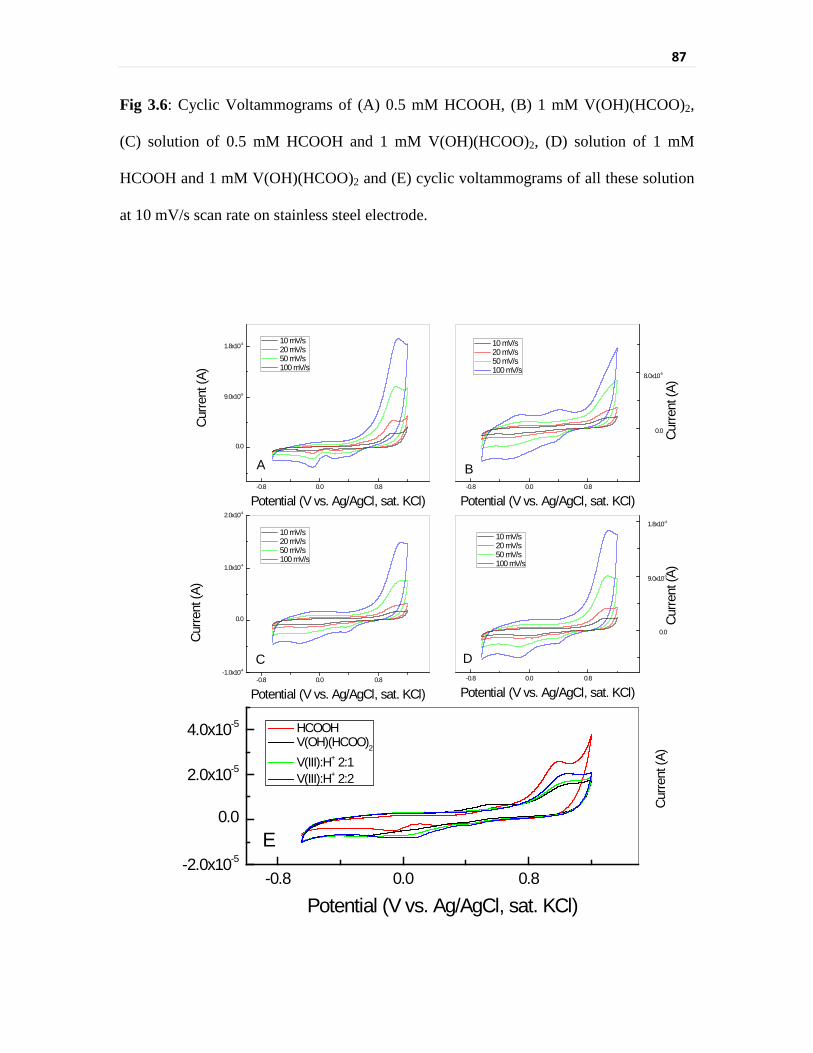
87
Fig 3.6: Cyclic Voltammograms of (A) 0.5 mM HCOOH, (B) 1 mM V(OH)(HCOO)2,
(C) solution of 0.5 mM HCOOH and 1 mM V(OH)(HCOO)2, (D) solution of 1 mM
HCOOH and 1 mM V(OH)(HCOO)2 and (E) cyclic voltammograms of all these solution
at 10 mV/s scan rate on stainless steel electrode.
-0.8 0.0 0.8
0.0
9.0x10⁻⁵
1.8x10⁻⁴
-0.8 0.0 0.8
0.0
8.0x10⁻⁵
-0.8 0.0 0.8-1.0x10⁻⁴
0.0
1.0x10⁻⁴
2.0x10⁻⁴
-0.8 0.0 0.8
0.0
9.0x10⁻⁵
1.8x10⁻⁴
-0.8 0.0 0.8-2.0x10⁻⁵
0.0
2.0x10⁻⁵
4.0x10⁻⁵
Curre
nt (A
)Cu
rrent
(A)
Curre
nt (A
)
Curre
nt (A
)Cu
rrent
(A)
Potential (V vs. Ag/AgCl, sat. KCl)
10 mV/s 20 mV/s 50 mV/s 100 mV/s
A
10 mV/s 20 mV/s 50 mV/s 100 mV/s
Potential (V vs. Ag/AgCl, sat. KCl)
B
10 mV/s 20 mV/s 50 mV/s 100 mV/s
Potential (V vs. Ag/AgCl, sat. KCl)
C
10 mV/s 20 mV/s 50 mV/s 100 mV/s
Potential (V vs. Ag/AgCl, sat. KCl)
D
HCOOH V(OH)(HCOO)2
V(III):H+ 2:1 V(III):H+ 2:2
Potential (V vs. Ag/AgCl, sat. KCl)
E

88
Fig 3.7: Cyclic Voltammograms of (A) 0.5 mM HCOOH, (B) 1 mM V(OH)(HCOO)2,
(C) solution of 0.5 mM HCOOH and 1 mM V(OH)(HCOO)2, (D) solution of 1 mM
HCOOH and 1 mM V(OH)(HCOO)2 and (E) cyclic voltammograms of all these solution
at 10 mV/s scan rate on glassy carbon electrode.
-0.8 0.0 0.8-6.0x10⁻⁶
0.0
6.0x10⁻⁶
1.2x10⁻⁵
-0.8 0.0 0.8
0.0
2.0x10⁻⁵
-0.8 0.0 0.8
0.0
1.0x10⁻⁵
2.0x10⁻⁵
-0.8 0.0 0.8 1.6
0.0
1.0x10⁻⁵
2.0x10⁻⁵
-0.8 0.0 0.8
0.0
4.0x10⁻⁶
Curre
nt (A
)
Potential (V wrt. Ag/AgCl, sat. KCl)
10 mV/s 20 mV/s 50 mV/s 100 mV/s
A
10 mV/s 20 mV/s 50 mV/s 100 mV/s
Curre
nt (A
)
Potential (V wrt. Ag/AgCl, sat. KCl)
B
10 mV/s 20 mV/s 50 mV/s
Curre
nt (A
)
Potential (V wrt. Ag/AgCl, sat. KCl)
C
Curre
nt (A
)
10 mV/s 20 mV/s 50 mV/s 100 mV/s
Curre
nt (A
)
Potential (V wrt. Ag/AgCl, sat. KCl)
D
HCOOH V(OH)(HCOO)2
V(III):H+ 2:1 V(III):H+ 2:2
Potential (V wrt. Ag/AgCl, sat. KCl)
E

89
Fig 3.8: Cyclic Voltammograms of (A) 0.5 mM HCOOH, (B) 1 mM V(OH)(HCOO)2,
(C) solution of 0.5 mM HCOOH and 1 mM V(OH)(HCOO)2, (D) solution of 1 mM
HCOOH and 1 mM V(OH)(HCOO)2 and (E) cyclic voltammograms of all these solution
at 10 mV/s scan rate on graphite electrode.
0 2
0.0
3.0x10⁻⁵
0 2
-3.0x10⁻⁵
0.0
3.0x10⁻⁵
0 2
-3.0x10⁻⁵
0.0
3.0x10⁻⁵
6.0x10⁻⁵
0 2
-3.0x10⁻⁵
0.0
3.0x10⁻⁵
6.0x10⁻⁵
0 2
-7.0x10⁻⁶
0.0
7.0x10⁻⁶
1.4x10⁻⁵
10 mV/s 20 mV/s 50 mV/s 100 mV/s
Curre
nt (A
)
Potential (V vs. Ag/AgCl, sat. KCl)
A
10 mV/s 20 mV/s 50 mV/s 100 mV/s
Curre
nt (A
)
Potential (V vs. Ag/AgCl, sat. KCl)
B
10 mV/s 20 mV/s 50 mV/s 100 mV/s
Curre
nt (A
)
Potential (V vs. Ag/AgCl, sat. KCl)
CCu
rrent
(A)
10 mV/s 20 mV/s 50 mV/s 100 mV/s
Curre
nt (A
)
Potential (V vs. Ag/AgCl, sat. KCl)
D
HCOOH V(OH)(HCOO)2
V(III):H+ 2:1 V(III):H+ 2:2
Potential (V vs. Ag/AgCl, sat. KCl)
E
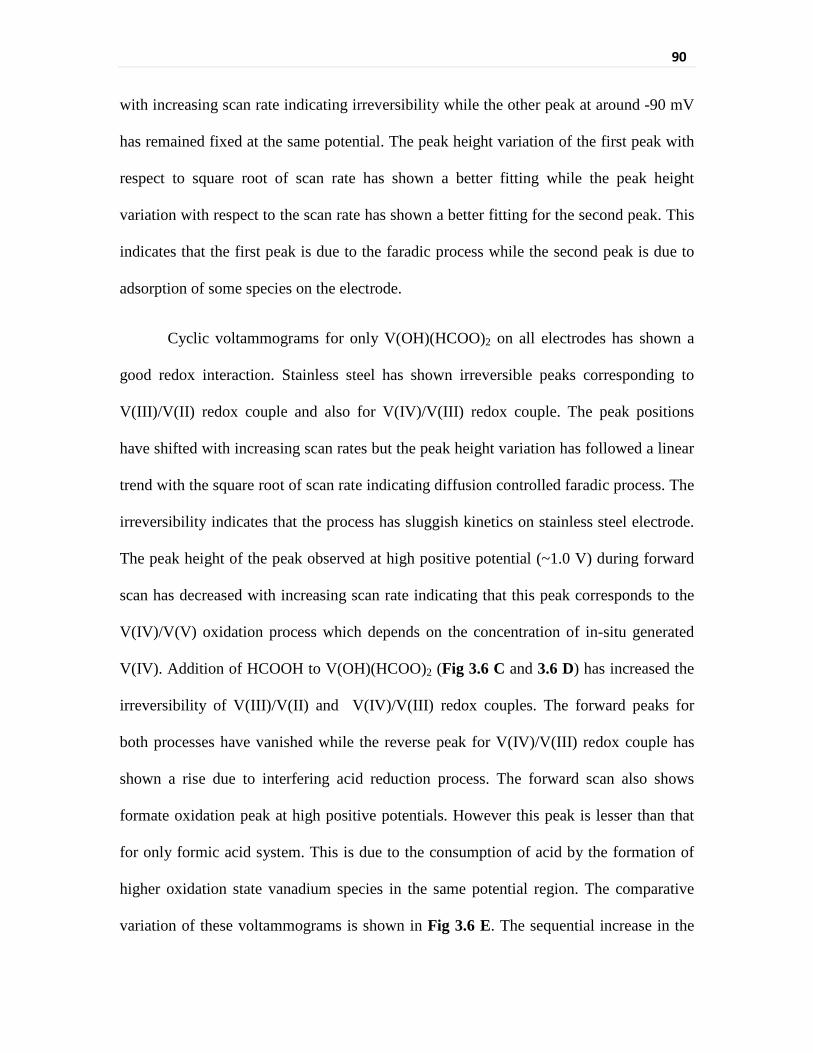
90
with increasing scan rate indicating irreversibility while the other peak at around -90 mV
has remained fixed at the same potential. The peak height variation of the first peak with
respect to square root of scan rate has shown a better fitting while the peak height
variation with respect to the scan rate has shown a better fitting for the second peak. This
indicates that the first peak is due to the faradic process while the second peak is due to
adsorption of some species on the electrode.
Cyclic voltammograms for only V(OH)(HCOO)2 on all electrodes has shown a
good redox interaction. Stainless steel has shown irreversible peaks corresponding to
V(III)/V(II) redox couple and also for V(IV)/V(III) redox couple. The peak positions
have shifted with increasing scan rates but the peak height variation has followed a linear
trend with the square root of scan rate indicating diffusion controlled faradic process. The
irreversibility indicates that the process has sluggish kinetics on stainless steel electrode.
The peak height of the peak observed at high positive potential (~1.0 V) during forward
scan has decreased with increasing scan rate indicating that this peak corresponds to the
V(IV)/V(V) oxidation process which depends on the concentration of in-situ generated
V(IV). Addition of HCOOH to V(OH)(HCOO)2 (Fig 3.6 C and 3.6 D) has increased the
irreversibility of V(III)/V(II) and V(IV)/V(III) redox couples. The forward peaks for
both processes have vanished while the reverse peak for V(IV)/V(III) redox couple has
shown a rise due to interfering acid reduction process. The forward scan also shows
formate oxidation peak at high positive potentials. However this peak is lesser than that
for only formic acid system. This is due to the consumption of acid by the formation of
higher oxidation state vanadium species in the same potential region. The comparative
variation of these voltammograms is shown in Fig 3.6 E. The sequential increase in the
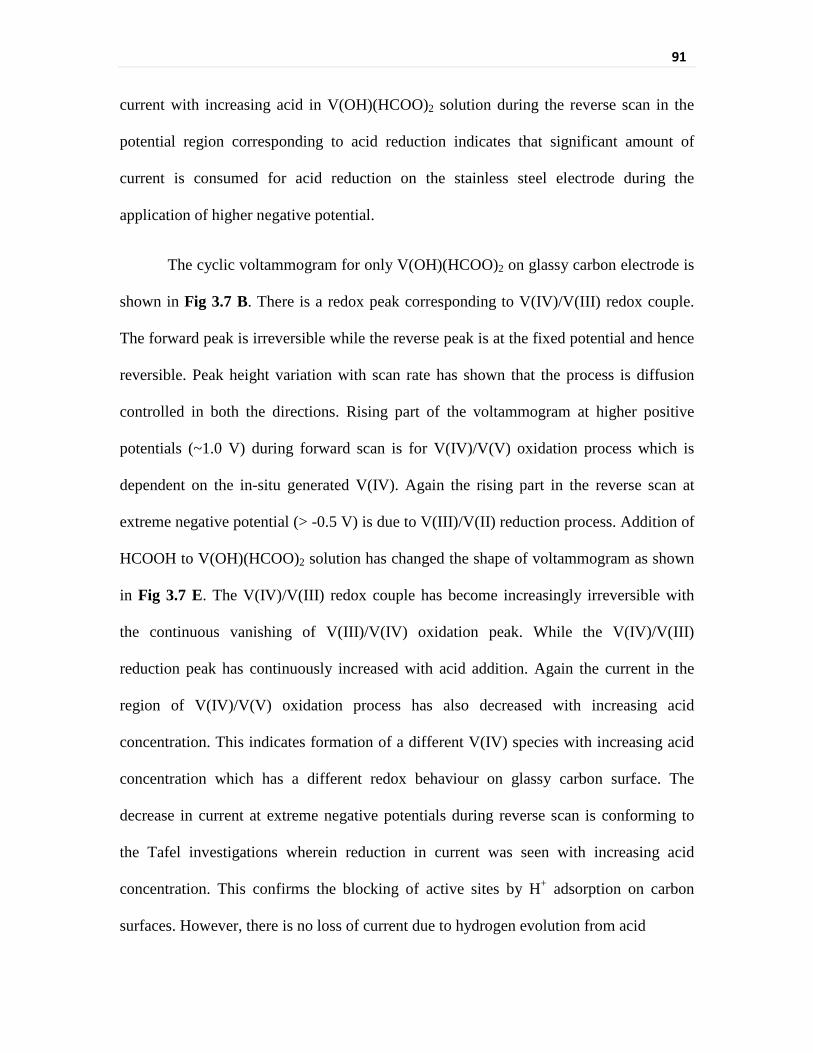
91
current with increasing acid in V(OH)(HCOO)2 solution during the reverse scan in the
potential region corresponding to acid reduction indicates that significant amount of
current is consumed for acid reduction on the stainless steel electrode during the
application of higher negative potential.
The cyclic voltammogram for only V(OH)(HCOO)2 on glassy carbon electrode is
shown in Fig 3.7 B. There is a redox peak corresponding to V(IV)/V(III) redox couple.
The forward peak is irreversible while the reverse peak is at the fixed potential and hence
reversible. Peak height variation with scan rate has shown that the process is diffusion
controlled in both the directions. Rising part of the voltammogram at higher positive
potentials (~1.0 V) during forward scan is for V(IV)/V(V) oxidation process which is
dependent on the in-situ generated V(IV). Again the rising part in the reverse scan at
extreme negative potential (> -0.5 V) is due to V(III)/V(II) reduction process. Addition of
HCOOH to V(OH)(HCOO)2 solution has changed the shape of voltammogram as shown
in Fig 3.7 E. The V(IV)/V(III) redox couple has become increasingly irreversible with
the continuous vanishing of V(III)/V(IV) oxidation peak. While the V(IV)/V(III)
reduction peak has continuously increased with acid addition. Again the current in the
region of V(IV)/V(V) oxidation process has also decreased with increasing acid
concentration. This indicates formation of a different V(IV) species with increasing acid
concentration which has a different redox behaviour on glassy carbon surface. The
decrease in current at extreme negative potentials during reverse scan is conforming to
the Tafel investigations wherein reduction in current was seen with increasing acid
concentration. This confirms the blocking of active sites by H+ adsorption on carbon
surfaces. However, there is no loss of current due to hydrogen evolution from acid
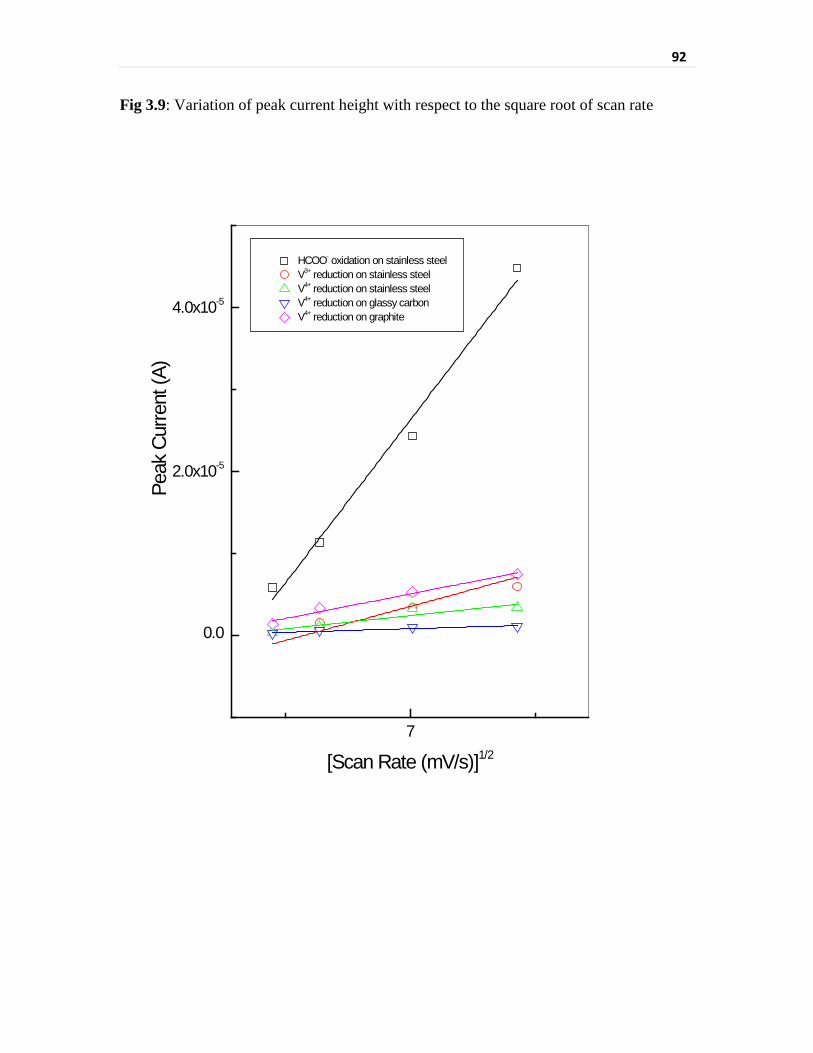
92
Fig 3.9: Variation of peak current height with respect to the square root of scan rate
7
0.0
2.0x10⁻⁵
4.0x10⁻⁵
HCOO- oxidation on stainless steel V3+ reduction on stainless steel V4+ reduction on stainless steel V4+ reduction on glassy carbon V4+ reduction on graphite
Peak
Cur
rent
(A)
[Scan Rate (mV/s)]1/2
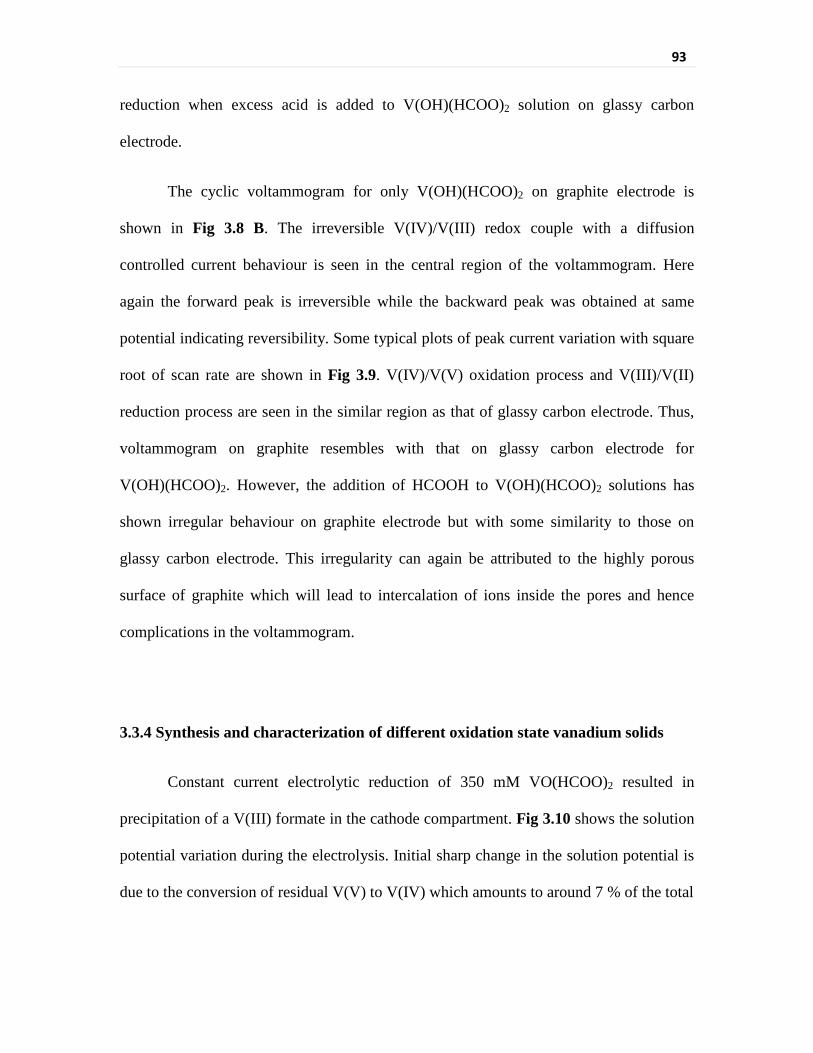
93
reduction when excess acid is added to V(OH)(HCOO)2 solution on glassy carbon
electrode.
The cyclic voltammogram for only V(OH)(HCOO)2 on graphite electrode is
shown in Fig 3.8 B. The irreversible V(IV)/V(III) redox couple with a diffusion
controlled current behaviour is seen in the central region of the voltammogram. Here
again the forward peak is irreversible while the backward peak was obtained at same
potential indicating reversibility. Some typical plots of peak current variation with square
root of scan rate are shown in Fig 3.9. V(IV)/V(V) oxidation process and V(III)/V(II)
reduction process are seen in the similar region as that of glassy carbon electrode. Thus,
voltammogram on graphite resembles with that on glassy carbon electrode for
V(OH)(HCOO)2. However, the addition of HCOOH to V(OH)(HCOO)2 solutions has
shown irregular behaviour on graphite electrode but with some similarity to those on
glassy carbon electrode. This irregularity can again be attributed to the highly porous
surface of graphite which will lead to intercalation of ions inside the pores and hence
complications in the voltammogram.
3.3.4 Synthesis and characterization of different oxidation state vanadium solids
Constant current electrolytic reduction of 350 mM VO(HCOO)2 resulted in
precipitation of a V(III) formate in the cathode compartment. Fig 3.10 shows the solution
potential variation during the electrolysis. Initial sharp change in the solution potential is
due to the conversion of residual V(V) to V(IV) which amounts to around 7 % of the total
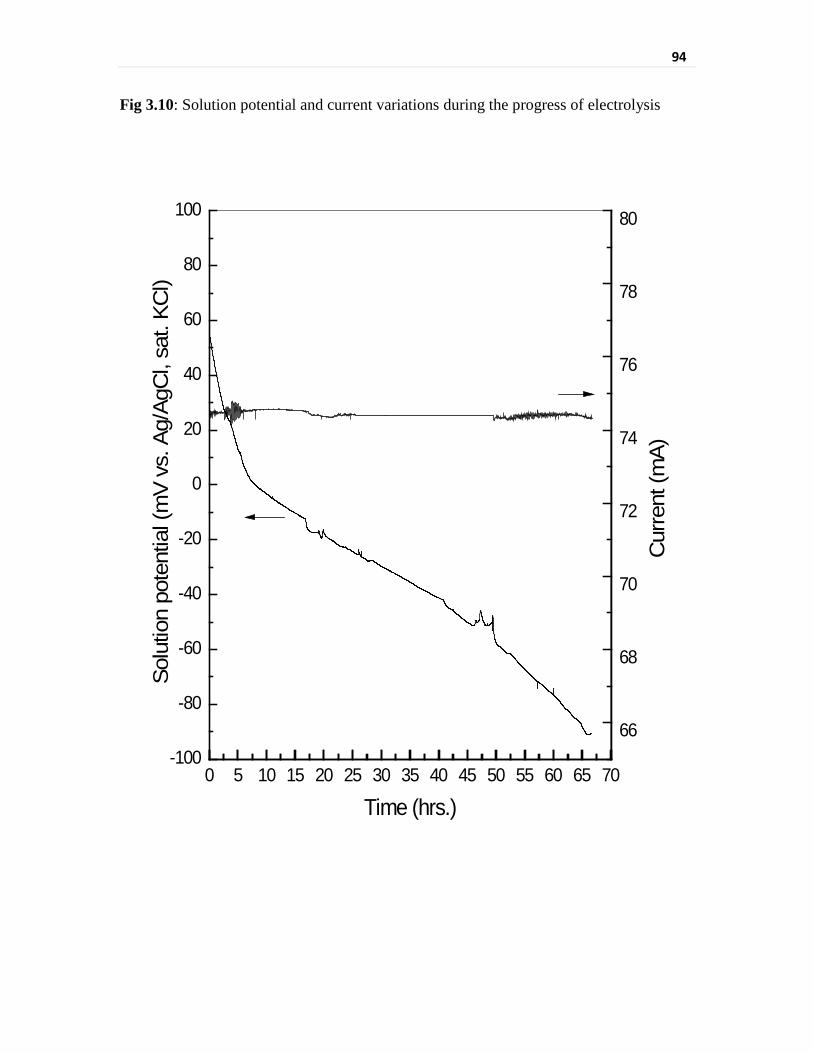
94
Fig 3.10: Solution potential and current variations during the progress of electrolysis
66
68
70
72
74
76
78
80
0 5 10 15 20 25 30 35 40 45 50 55 60 65 70-100
-80
-60
-40
-20
0
20
40
60
80
100
Cur
rent
(mA)
Time (hrs.)
Solu
tion
pote
ntia
l (m
V vs
. Ag/
AgC
l, sa
t. KC
l)

95
concentration as per the coulometric calculation. The subsequent shift in the slope
corresponds to V(IV) → V(III) reduction. There is a continuous consumption of acid in
cathode compartment as per equation (3.6) and a continuous rise in concentration of acid
in anode compartment as per equation (3.8) with the progress of electrolysis. This leads
to a gradual rise in pH in cathode compartment with progress of electrolysis.
There are two sharp peaks in solution potential variation graph in the region
corresponding to around 38 % conversion of V(IV). The sudden rise in solution potential
at this instance indicates that there is an instantaneous variation in V(IV) to V(III) ratio in
favour of V(IV). This indicated V(III) precipitation. The combination of coulometric
calculation and potential shift due to concentration as indicated by Nernst equation has
been used to evaluate the amount of V(III) precipitated out. The first peak corresponds to
precipitation of 25.2 mmols of V(III) and the second peak corresponds to 11.1 mmols of
V(III). While solution concentration of V(III) just before the rise of potentials were 133
mM and 105 mM respectively. This indicates that the precipitation of V(III) during the
electrolysis is dependent on both concentration of V(III) and pH. At higher pHs
precipitation occurs at lower V(III) concentration. Thus, the yield of the precipitate can
be further increased by increasing the pH. It may be noted here that at much lower initial
concentration of vanadium with similar solution composition, V(II)-formate solution is
obtained as the final product of electrolysis.
Compositional characterization of synthesized vanadium compounds: The synthesis of
other vanadium formate solids has been described in chapter 2. The solids were analyzed
for the chemical composition using atomic absorption spectrophotometer (AAS) and
inductively coupled plasma atomic emission spectrophotometer (ICP-AES) for the metal
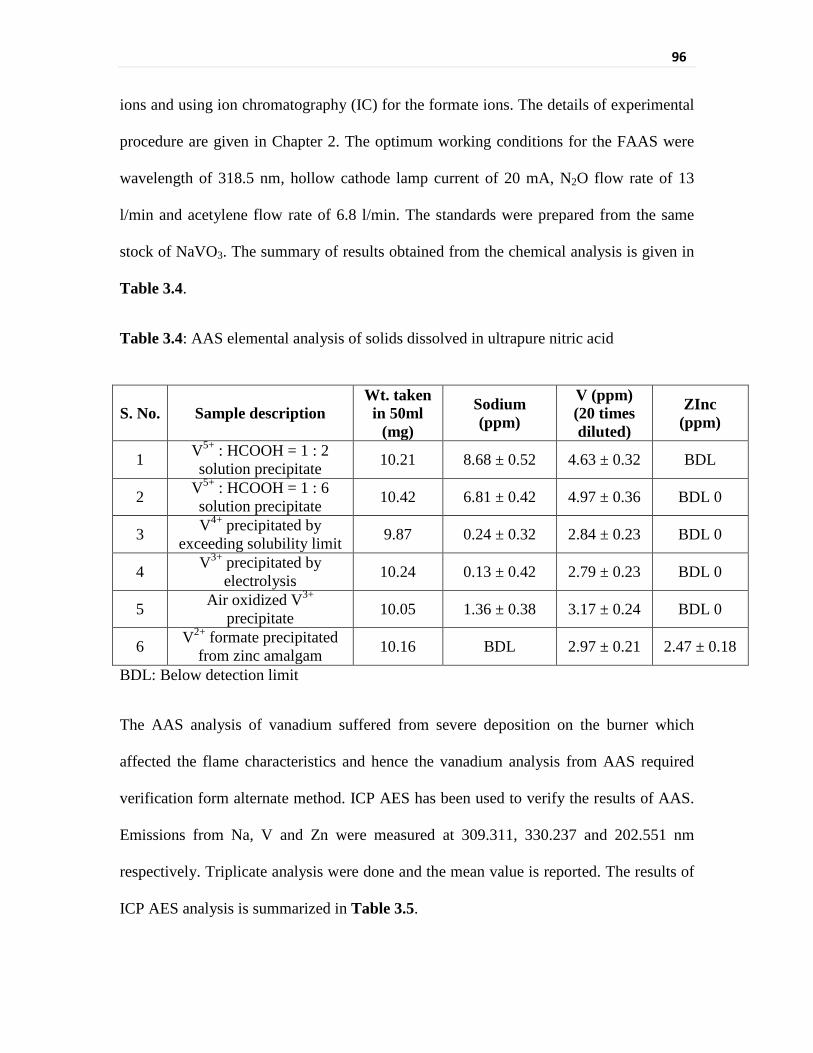
96
ions and using ion chromatography (IC) for the formate ions. The details of experimental
procedure are given in Chapter 2. The optimum working conditions for the FAAS were
wavelength of 318.5 nm, hollow cathode lamp current of 20 mA, N2O flow rate of 13
l/min and acetylene flow rate of 6.8 l/min. The standards were prepared from the same
stock of NaVO3. The summary of results obtained from the chemical analysis is given in
Table 3.4.
Table 3.4: AAS elemental analysis of solids dissolved in ultrapure nitric acid
BDL: Below detection limit
The AAS analysis of vanadium suffered from severe deposition on the burner which
affected the flame characteristics and hence the vanadium analysis from AAS required
verification form alternate method. ICP AES has been used to verify the results of AAS.
Emissions from Na, V and Zn were measured at 309.311, 330.237 and 202.551 nm
respectively. Triplicate analysis were done and the mean value is reported. The results of
ICP AES analysis is summarized in Table 3.5.
S. No. Sample description Wt. taken
in 50ml (mg)
Sodium (ppm)
V (ppm) (20 times diluted)
ZInc (ppm)
1 V5+ : HCOOH = 1 : 2 solution precipitate 10.21 8.68 ± 0.52 4.63 ± 0.32 BDL
2 V5+ : HCOOH = 1 : 6 solution precipitate 10.42 6.81 ± 0.42 4.97 ± 0.36 BDL 0
3 V4+ precipitated by exceeding solubility limit 9.87 0.24 ± 0.32 2.84 ± 0.23 BDL 0
4 V3+ precipitated by electrolysis 10.24 0.13 ± 0.42 2.79 ± 0.23 BDL 0
5 Air oxidized V3+ precipitate 10.05 1.36 ± 0.38 3.17 ± 0.24 BDL 0
6 V2+ formate precipitated from zinc amalgam 10.16 BDL 2.97 ± 0.21 2.47 ± 0.18
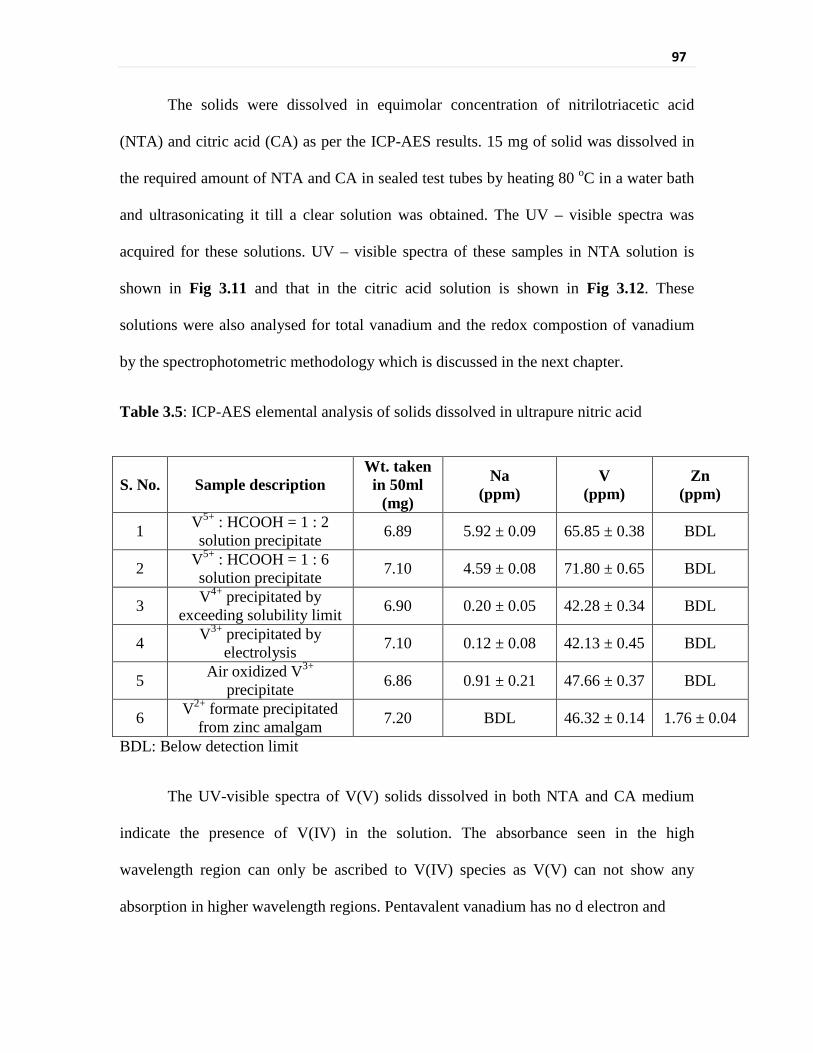
97
The solids were dissolved in equimolar concentration of nitrilotriacetic acid
(NTA) and citric acid (CA) as per the ICP-AES results. 15 mg of solid was dissolved in
the required amount of NTA and CA in sealed test tubes by heating 80 oC in a water bath
and ultrasonicating it till a clear solution was obtained. The UV – visible spectra was
acquired for these solutions. UV – visible spectra of these samples in NTA solution is
shown in Fig 3.11 and that in the citric acid solution is shown in Fig 3.12. These
solutions were also analysed for total vanadium and the redox compostion of vanadium
by the spectrophotometric methodology which is discussed in the next chapter.
Table 3.5: ICP-AES elemental analysis of solids dissolved in ultrapure nitric acid
BDL: Below detection limit
The UV-visible spectra of V(V) solids dissolved in both NTA and CA medium
indicate the presence of V(IV) in the solution. The absorbance seen in the high
wavelength region can only be ascribed to V(IV) species as V(V) can not show any
absorption in higher wavelength regions. Pentavalent vanadium has no d electron and
S. No. Sample description Wt. taken
in 50ml (mg)
Na (ppm)
V (ppm)
Zn (ppm)
1 V5+ : HCOOH = 1 : 2 solution precipitate 6.89 5.92 ± 0.09 65.85 ± 0.38 BDL
2 V5+ : HCOOH = 1 : 6 solution precipitate 7.10 4.59 ± 0.08 71.80 ± 0.65 BDL
3 V4+ precipitated by exceeding solubility limit 6.90 0.20 ± 0.05 42.28 ± 0.34 BDL
4 V3+ precipitated by electrolysis 7.10 0.12 ± 0.08 42.13 ± 0.45 BDL
5 Air oxidized V3+ precipitate 6.86 0.91 ± 0.21 47.66 ± 0.37 BDL
6 V2+ formate precipitated from zinc amalgam 7.20 BDL 46.32 ± 0.14 1.76 ± 0.04
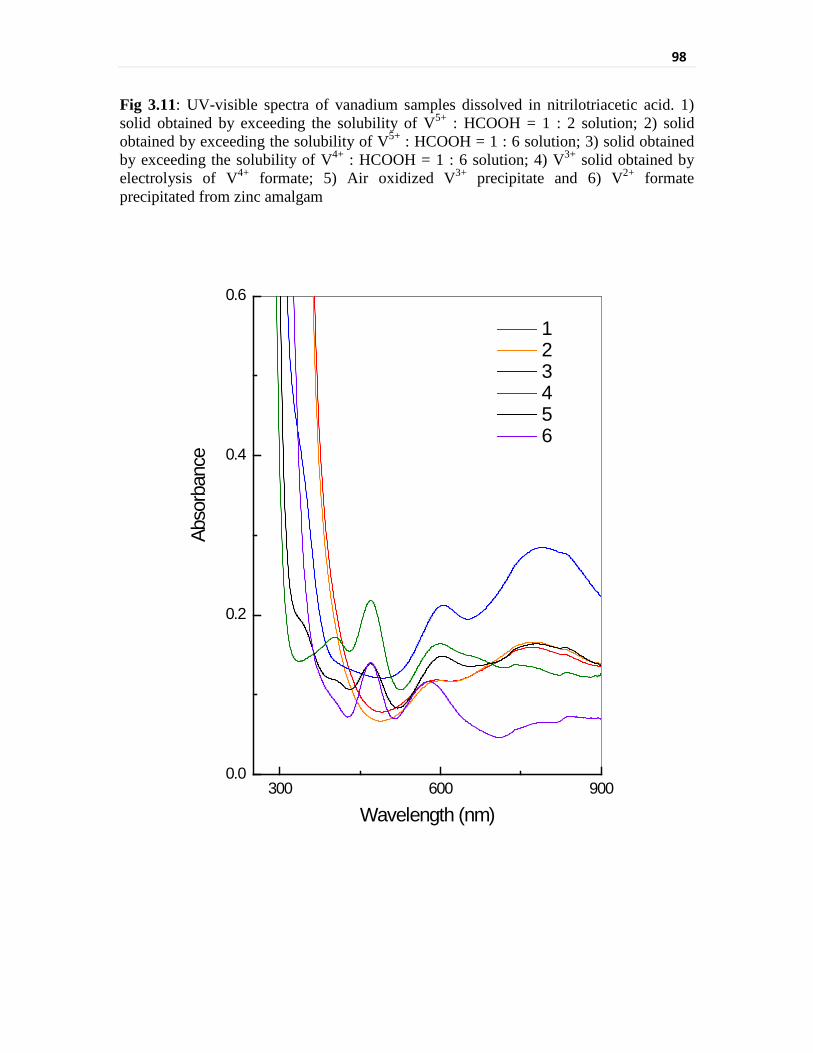
98
Fig 3.11: UV-visible spectra of vanadium samples dissolved in nitrilotriacetic acid. 1) solid obtained by exceeding the solubility of V5+ : HCOOH = 1 : 2 solution; 2) solid obtained by exceeding the solubility of V5+ : HCOOH = 1 : 6 solution; 3) solid obtained by exceeding the solubility of V4+ : HCOOH = 1 : 6 solution; 4) V3+ solid obtained by electrolysis of V4+ formate; 5) Air oxidized V3+ precipitate and 6) V2+ formate precipitated from zinc amalgam
300 600 9000.0
0.2
0.4
0.6
1 2 3 4 5 6
Abso
rban
ce
Wavelength (nm)
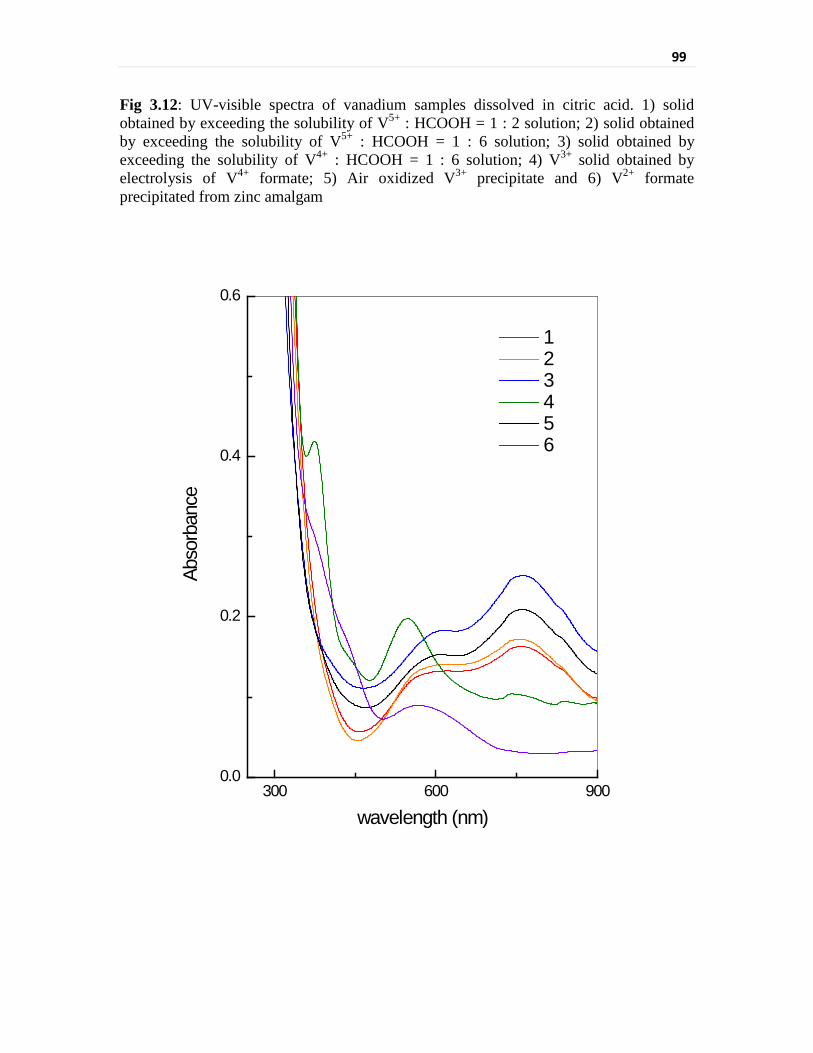
99
Fig 3.12: UV-visible spectra of vanadium samples dissolved in citric acid. 1) solid obtained by exceeding the solubility of V5+ : HCOOH = 1 : 2 solution; 2) solid obtained by exceeding the solubility of V5+ : HCOOH = 1 : 6 solution; 3) solid obtained by exceeding the solubility of V4+ : HCOOH = 1 : 6 solution; 4) V3+ solid obtained by electrolysis of V4+ formate; 5) Air oxidized V3+ precipitate and 6) V2+ formate precipitated from zinc amalgam
300 600 9000.0
0.2
0.4
0.6
Abso
rban
ce
wavelength (nm)
1 2 3 4 5 6

100
hence d-d transitions are not possible. The electronic absorption spectrum for V(V) are
ascribed to charge transfer bands which appear in the wavelength region of around 220 -
270 nm [17]. The dissolution was carried out under inert condition with the organic acid
ligands which have lower standard reduction potential values than that for V(V)/V(IV)
redox couple. This could have resulted in the formation of V(IV) during the dissolution
[18]. As per the spectrophotometric redox speciation analysis, 41.2 % V(V) was
converted into V(IV) in nitrilotriacetic acid medium while 63.7 % V(V) was converted
into V(IV) in citric acid medium.
The V(IV) electronic transition exhibits two bands characteristic of VO2+ ions in
tetragonal symmetry (not the octagonal symmetry because the distance between the V
atom and the axial ligand molecule is longer than that of the corresponding planar ligand
molecules). In the tetragonal C4V symmetry the electronic transitions are described by
2B2g → E2g and 2B2g → 2B1g respectively [19]. The intense band in the region of 780 nm
(2B2g → E2g) and a weak shoulder in the region of 600 nm (2B2g → 2B1g) are the
characteristic d-d transitions of aqueous vanadyl ion. The spectra of vanadyl in different
media is shown separately in plot A, Fig 3.13. The 2B2g → E2g transition remains
unaltered for NTA (789 nm) and formic acid medium but it has slightly shifted to lower
wavelength in citric acid medium (760 nm). The 2B2g → 2B1g transition has been more
intense in both NTA (605 nm) and citric acid (609 nm) medium as compared to formic
acid (635 nm) medium and also it is slightly shifted to lower wavelength in these
complexing media.
The UV-visible spectra of the compound precipitated by electrolysis indicates that
vanadium is present in only V(III) oxidation state. The aqueous solution of the compound
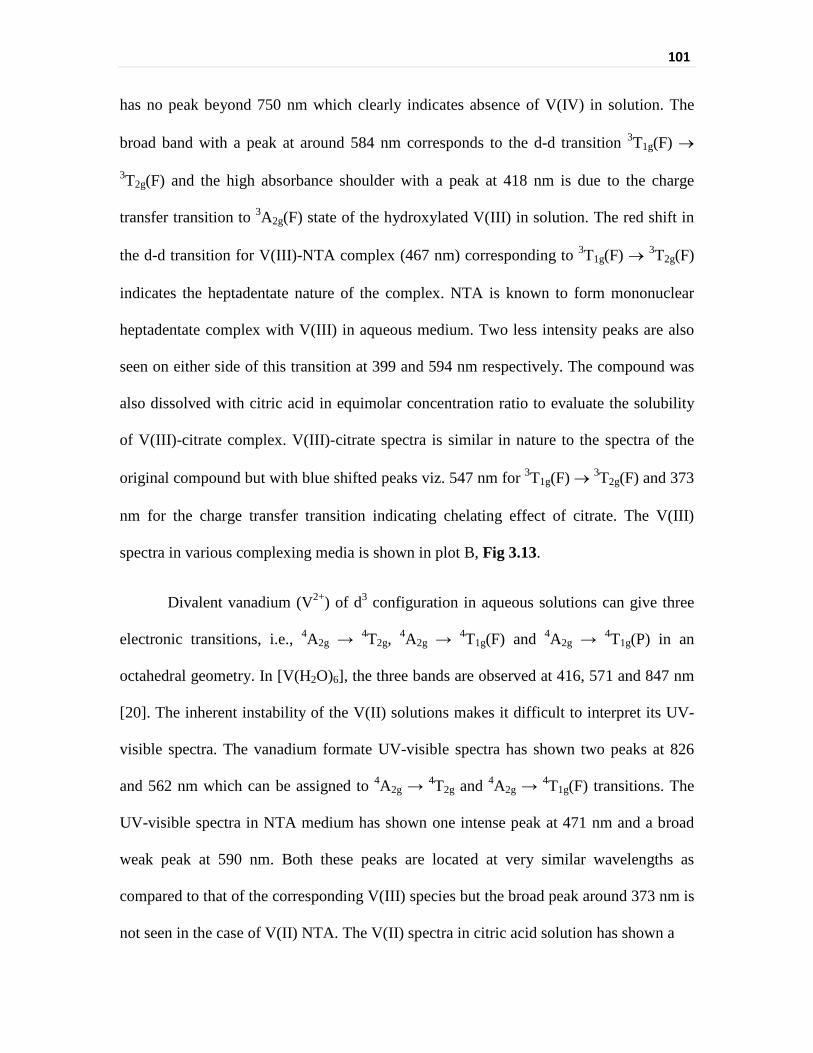
101
has no peak beyond 750 nm which clearly indicates absence of V(IV) in solution. The
broad band with a peak at around 584 nm corresponds to the d-d transition 3T1g(F) →
3T2g(F) and the high absorbance shoulder with a peak at 418 nm is due to the charge
transfer transition to 3A2g(F) state of the hydroxylated V(III) in solution. The red shift in
the d-d transition for V(III)-NTA complex (467 nm) corresponding to 3T1g(F) → 3T2g(F)
indicates the heptadentate nature of the complex. NTA is known to form mononuclear
heptadentate complex with V(III) in aqueous medium. Two less intensity peaks are also
seen on either side of this transition at 399 and 594 nm respectively. The compound was
also dissolved with citric acid in equimolar concentration ratio to evaluate the solubility
of V(III)-citrate complex. V(III)-citrate spectra is similar in nature to the spectra of the
original compound but with blue shifted peaks viz. 547 nm for 3T1g(F) → 3T2g(F) and 373
nm for the charge transfer transition indicating chelating effect of citrate. The V(III)
spectra in various complexing media is shown in plot B, Fig 3.13.
Divalent vanadium (V2+) of d3 configuration in aqueous solutions can give three
electronic transitions, i.e., 4A2g → 4T2g, 4A2g → 4T1g(F) and 4A2g → 4T1g(P) in an
octahedral geometry. In [V(H2O)6], the three bands are observed at 416, 571 and 847 nm
[20]. The inherent instability of the V(II) solutions makes it difficult to interpret its UV-
visible spectra. The vanadium formate UV-visible spectra has shown two peaks at 826
and 562 nm which can be assigned to 4A2g → 4T2g and 4A2g → 4T1g(F) transitions. The
UV-visible spectra in NTA medium has shown one intense peak at 471 nm and a broad
weak peak at 590 nm. Both these peaks are located at very similar wavelengths as
compared to that of the corresponding V(III) species but the broad peak around 373 nm is
not seen in the case of V(II) NTA. The V(II) spectra in citric acid solution has shown a

102
Fig 3.13: UV – visible spectra of (A) V(IV); (B) V(III) and (C) V(II) solids redissolved
in nitrilotriacetic acid (NTA); Citric acid (CA) and formic acid.
100 200 300 400 500 600 700 800 9000.00.10.20.30.40.50.6
100 200 300 400 500 600 700 800 9000.0
0.2
0.4
0.6
0.8
1.0
100 200 300 400 500 600 700 800 9000.0
0.1
0.2
0.3
0.4
NTA CA Formic acid
V(IV)A:
Abso
rban
ce
V(III)B:
Wavelength (nm)
V(II)C:
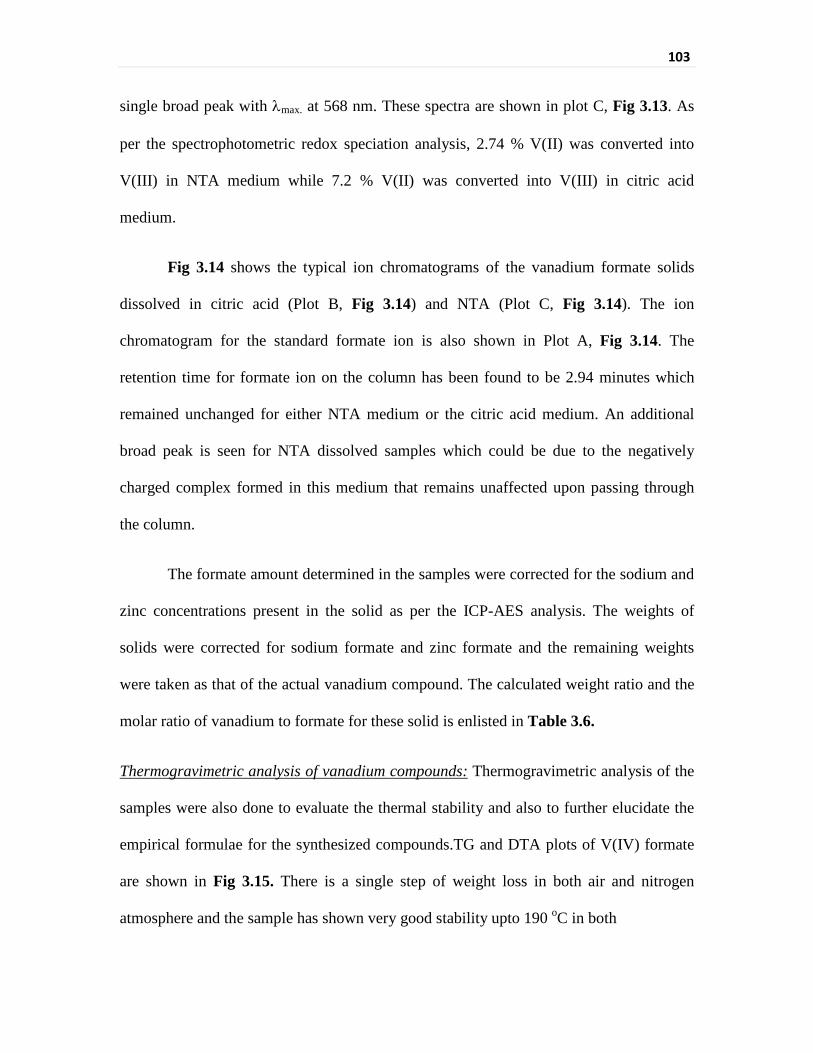
103
single broad peak with λmax. at 568 nm. These spectra are shown in plot C, Fig 3.13. As
per the spectrophotometric redox speciation analysis, 2.74 % V(II) was converted into
V(III) in NTA medium while 7.2 % V(II) was converted into V(III) in citric acid
medium.
Fig 3.14 shows the typical ion chromatograms of the vanadium formate solids
dissolved in citric acid (Plot B, Fig 3.14) and NTA (Plot C, Fig 3.14). The ion
chromatogram for the standard formate ion is also shown in Plot A, Fig 3.14. The
retention time for formate ion on the column has been found to be 2.94 minutes which
remained unchanged for either NTA medium or the citric acid medium. An additional
broad peak is seen for NTA dissolved samples which could be due to the negatively
charged complex formed in this medium that remains unaffected upon passing through
the column.
The formate amount determined in the samples were corrected for the sodium and
zinc concentrations present in the solid as per the ICP-AES analysis. The weights of
solids were corrected for sodium formate and zinc formate and the remaining weights
were taken as that of the actual vanadium compound. The calculated weight ratio and the
molar ratio of vanadium to formate for these solid is enlisted in Table 3.6.
Thermogravimetric analysis of vanadium compounds: Thermogravimetric analysis of the
samples were also done to evaluate the thermal stability and also to further elucidate the
empirical formulae for the synthesized compounds.TG and DTA plots of V(IV) formate
are shown in Fig 3.15. There is a single step of weight loss in both air and nitrogen
atmosphere and the sample has shown very good stability upto 190 oC in both

104
Fig 3.14: Typical chromatograms of (A) formate standard; (B) citric acid dissolved
vanadium formate solid and (C) nitrilotriacetic acid dissolved vanadium formate solid
-2 0 2 4 6 8 10 12 14 16
Co
nduc
tivity
(arb
. unit
s.)
Elution time (min)
A
B
C0 2 4 6
0
2
4
6
8
10
Cond
uctiv
ity (µ
S/cm
)Concentration (ppm)
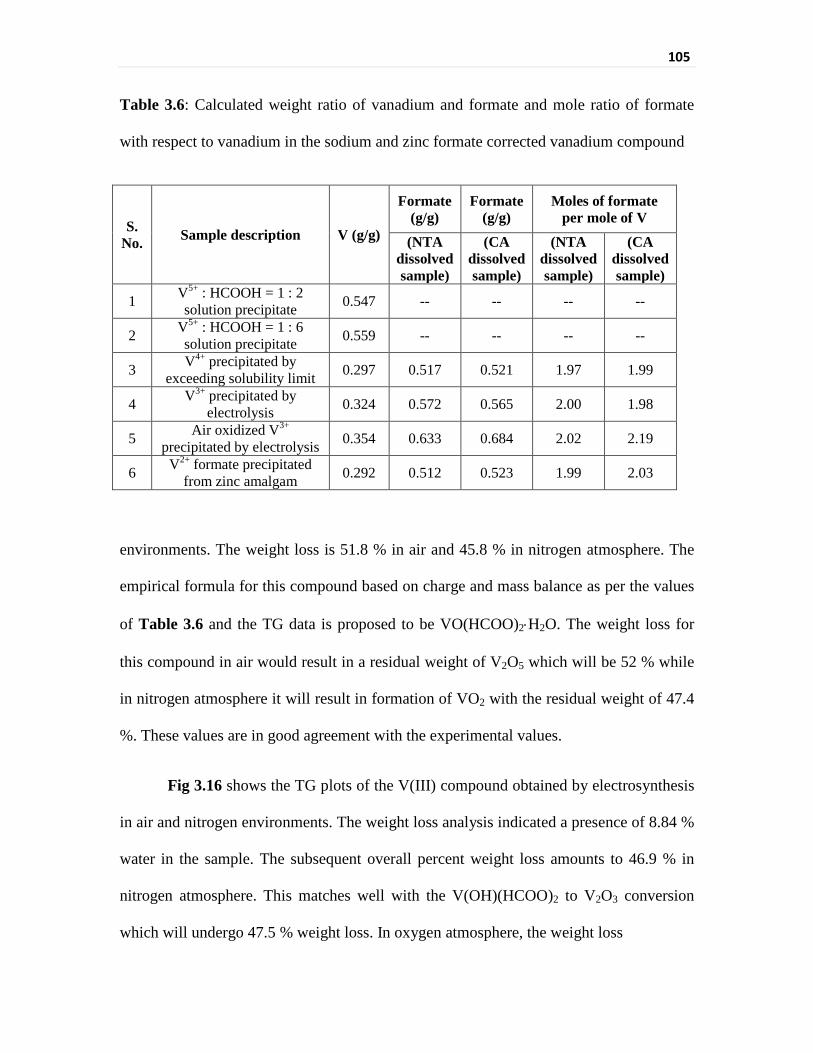
105
Table 3.6: Calculated weight ratio of vanadium and formate and mole ratio of formate
with respect to vanadium in the sodium and zinc formate corrected vanadium compound
environments. The weight loss is 51.8 % in air and 45.8 % in nitrogen atmosphere. The
empirical formula for this compound based on charge and mass balance as per the values
of Table 3.6 and the TG data is proposed to be VO(HCOO)2⋅H2O. The weight loss for
this compound in air would result in a residual weight of V2O5 which will be 52 % while
in nitrogen atmosphere it will result in formation of VO2 with the residual weight of 47.4
%. These values are in good agreement with the experimental values.
Fig 3.16 shows the TG plots of the V(III) compound obtained by electrosynthesis
in air and nitrogen environments. The weight loss analysis indicated a presence of 8.84 %
water in the sample. The subsequent overall percent weight loss amounts to 46.9 % in
nitrogen atmosphere. This matches well with the V(OH)(HCOO)2 to V2O3 conversion
which will undergo 47.5 % weight loss. In oxygen atmosphere, the weight loss
S. No. Sample description V (g/g)
Formate (g/g)
Formate (g/g)
Moles of formate per mole of V
(NTA dissolved sample)
(CA dissolved sample)
(NTA dissolved sample)
(CA dissolved sample)
1 V5+ : HCOOH = 1 : 2 solution precipitate 0.547 -- -- -- --
2 V5+ : HCOOH = 1 : 6 solution precipitate 0.559 -- -- -- --
3 V4+ precipitated by exceeding solubility limit 0.297 0.517 0.521 1.97 1.99
4 V3+ precipitated by electrolysis 0.324 0.572 0.565 2.00 1.98
5 Air oxidized V3+ precipitated by electrolysis 0.354 0.633 0.684 2.02 2.19
6 V2+ formate precipitated from zinc amalgam 0.292 0.512 0.523 1.99 2.03
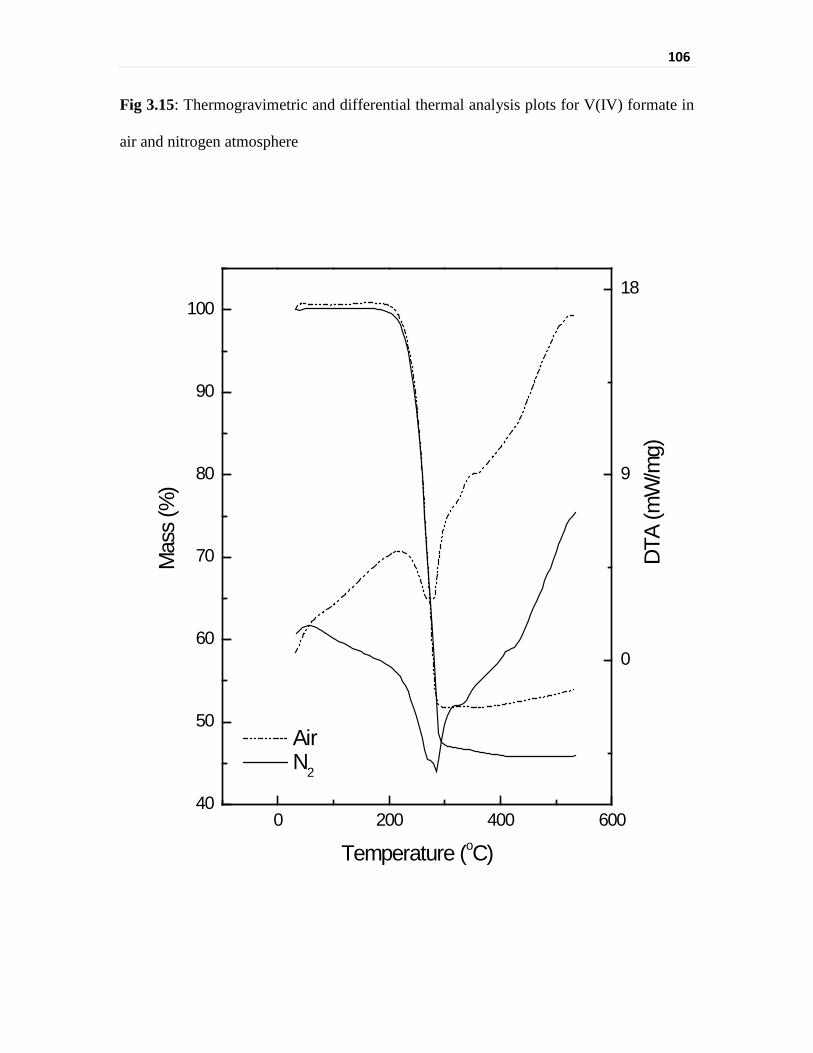
106
Fig 3.15: Thermogravimetric and differential thermal analysis plots for V(IV) formate in
air and nitrogen atmosphere
0 200 400 60040
50
60
70
80
90
100
DTA
(mW
/mg)
Mas
s (%
)
Temperature (oC)
Air N2
0
9
18
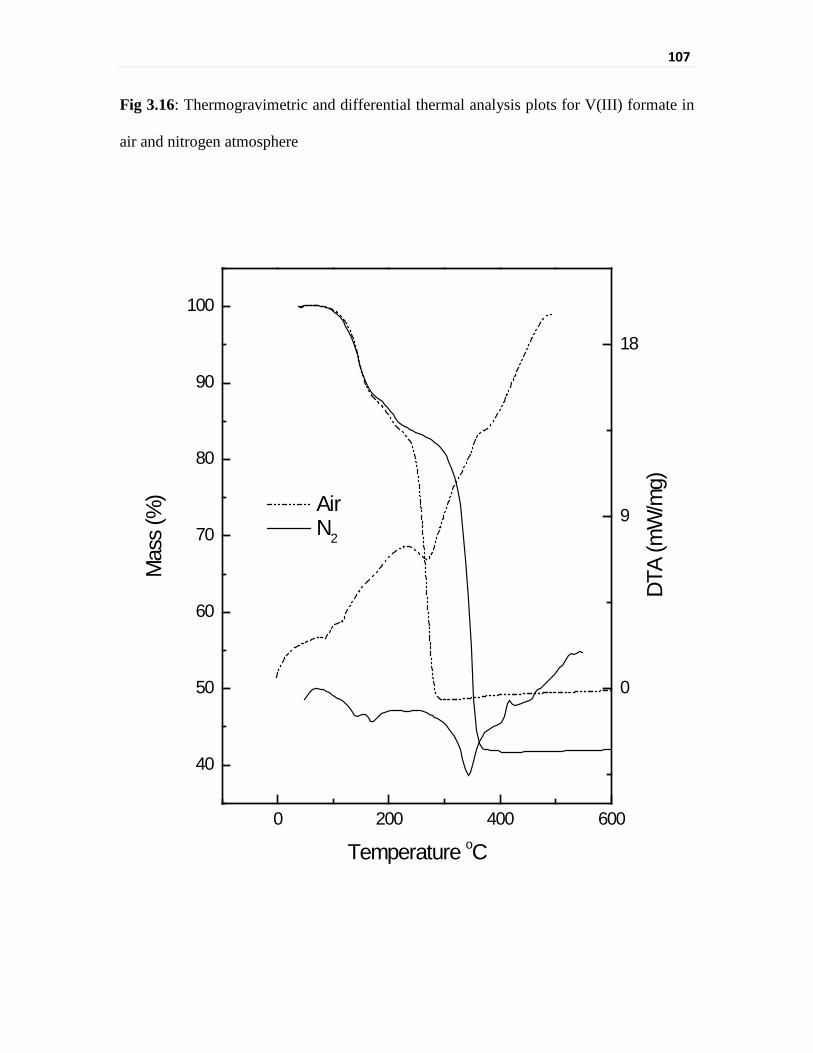
107
Fig 3.16: Thermogravimetric and differential thermal analysis plots for V(III) formate in
air and nitrogen atmosphere
0 200 400 600
40
50
60
70
80
90
100
Air N2
Mas
s (%
)
Temperature oC
0
9
18
DTA
(mW
/mg)
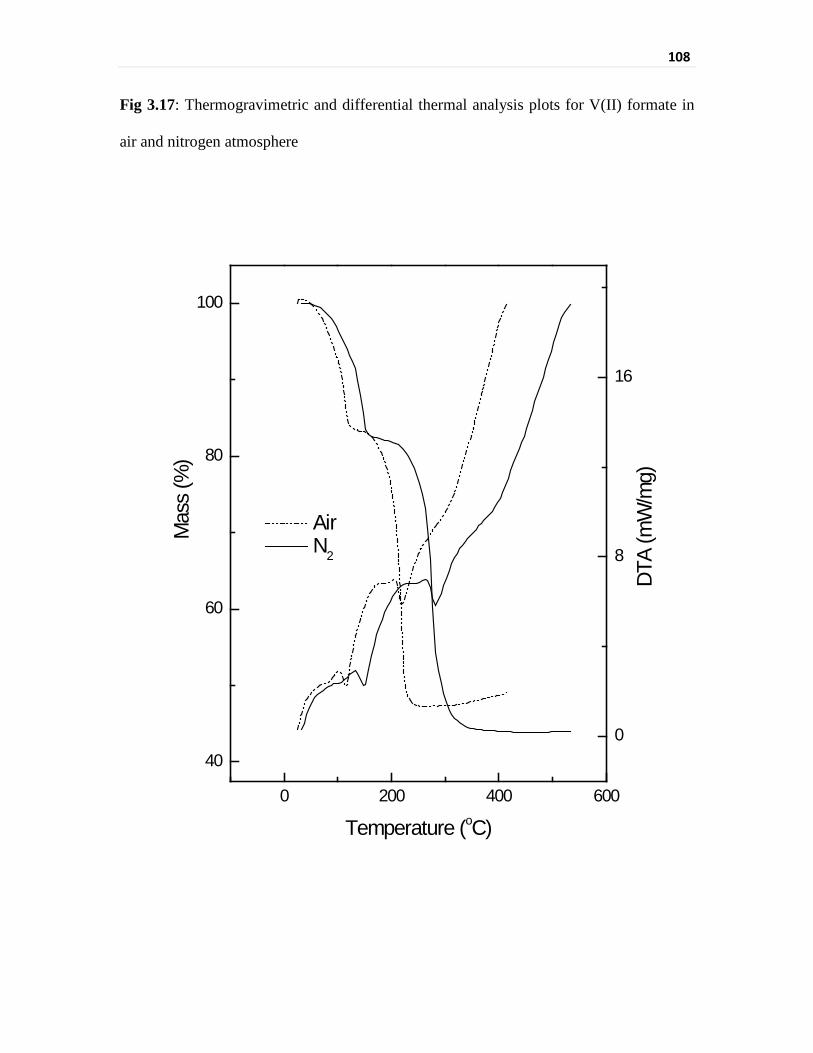
108
Fig 3.17: Thermogravimetric and differential thermal analysis plots for V(II) formate in
air and nitrogen atmosphere
0 200 400 600
40
60
80
100
Mas
s (%
)
Temperature (oC)
0
8
16
Air N2
DTA
(mW
/mg)

109
calculation after residual water correction comes to 54.5 % which matches well with the
V(OH)(HCOO)2 conversion to V2O5 amounting to a weight loss of 57.6 %. Thus, TG
analysis has also indicated the same chemical composition of the precipitate as the one
estimated by the chemical analysis. The TG pattern shows that the compound is stable
upto 160 oC in air atmosphere although the overall stability is more in nitrogen
atmosphere. There is a small hump in both atmospheres which correspond to a weight
loss of around 5.2 %. This can be attributed to dehydration of V(OH)(HCOO)2 resulting
in V2O(HCOO)4. The second step corresponds to V2O3 formation in case of nitrogen
atmosphere and V2O5 formation in air atmosphere.
Thermogravimetric and differential thermal analysis plots of V(II) formate in
nitrogen and air atmosphere are shown in Fig 3.17. There are two step decomposition
processes seen in both environments which are accompanied by endothermic peaks in
differential thermogram plots. The decomposition process starts from the initial stage of
heating itself in both the atmospheres, but the rate of decomposition is faster in air. The
overall residual weight in air remains to 48.9 % while it comes down to 43.8 % in
nitrogen atmosphere. These mass losses could be well explained if the formula weight of
the V(II) compound is taken as V(HCOO)2⋅2H2O. The overall decomposition processes
can be represented as
4V(HCOO)2⋅2H2O + 7O2 → 2V2O5 + 8CO2 + 12H2O (in air) (3.9)
2V(HCOO)2⋅2H2O → V2O3 + 4CO2 + H2O + 5H2 (in nitrogen) (3.10)
These decompositions would result in a residual weight of 51.4 % and 42.4 % in air and
nitrogen atmosphere respectively. The intermediate decomposition step results in the

110
residual weight of 83.17 % in air and 82.12 % in nitrogen indicating similar product
formation. The intermediate product can be formed by the oxidative dehydration of the
parent compound which can be represented by as
4V(HCOO)2⋅2H2O + O2 → 2V2O(HCOO)4 + 8H2O (in air) (3.11)
2V(HCOO)2⋅2H2O → V2O(HCOO)4 + 3H2O + H2 (in nitrogen) (3.12)
These decompositions would result in the residual weight of 84.2 % which is in
reasonable agreement with the experimental values. Thus the thermogravimetric analysis
has further elucidated the empirical chemical formula of the vanadium compounds.
Infrared spectral evaluation of the vanadium compounds: Infrared spectrum of the
vanadium solids are given in Fig 3.18. The infrared spectra of these compounds can be
broadly divided into three regions. The one is the broad peak in the region of 3800 to
2500 cm-1 which is due to the hydroxide or water molecule in the compound, the next
region corresponds to the asymmetric and symmetric vibrational modes of carboxyl
groups which are located in the region of 1580 to 1560 cm-1 or split in two or more peaks
and 1375 to 1350 cm-1 or split in two or more peaks respectively [21]. The third region
corresponds to the group of peaks below 1100 cm-1 which correspond to the various
possible V-O vibrational interactions.
Infrared spectrum of the V(V) compound, (plot A, Fig 3.18) shows a broad peak in the
higher wavenumber region which can be attributed to the absorbed water. The moderate
peak pattern in the intermediate region of 1750 to 1300 cm-1 can be attributed to the
presence of sodium formate impurity in the compound. A single broad peak has been
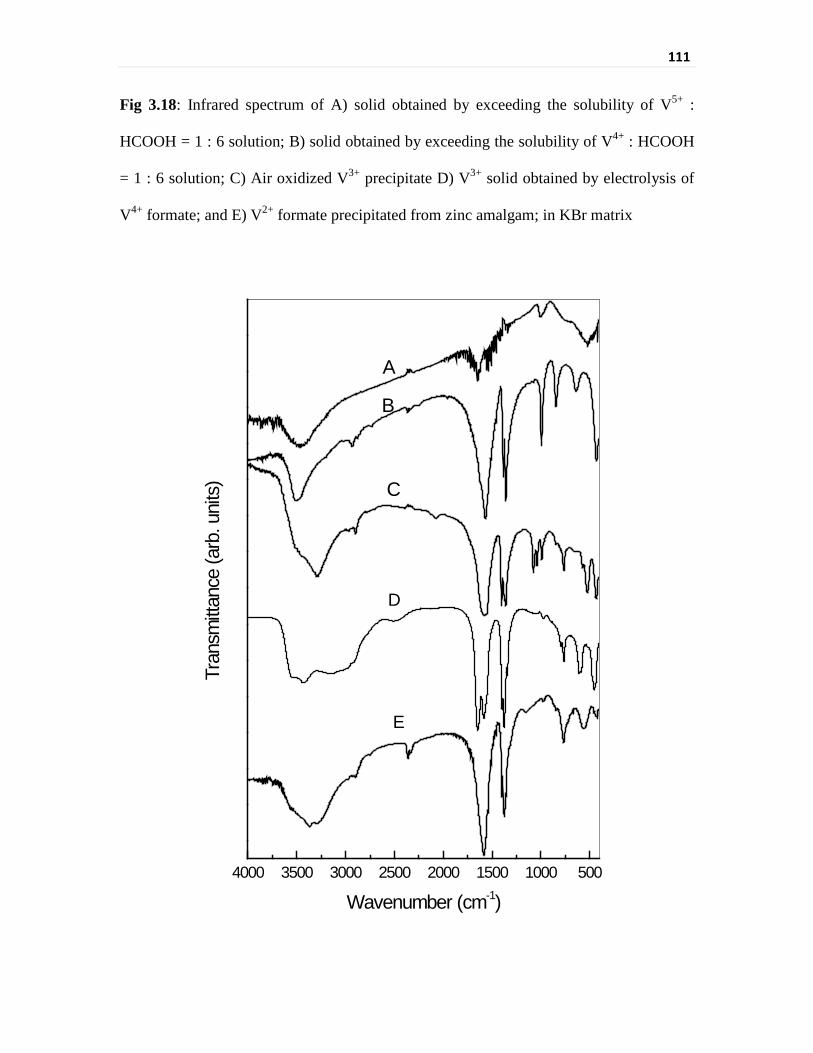
111
Fig 3.18: Infrared spectrum of A) solid obtained by exceeding the solubility of V5+ :
HCOOH = 1 : 6 solution; B) solid obtained by exceeding the solubility of V4+ : HCOOH
= 1 : 6 solution; C) Air oxidized V3+ precipitate D) V3+ solid obtained by electrolysis of
V4+ formate; and E) V2+ formate precipitated from zinc amalgam; in KBr matrix
4000 3500 3000 2500 2000 1500 1000 500
Tran
smitt
ance
(arb
. uni
ts)
Wavenumber (cm-1)
D
E
A
B
C

112
obtained in the region of 997 to 966 cm-1 which can be attributed to the V=O vibrational
interaction which shows a peak in this region [22].
Infrared spectrum of the V(IV) compound (plot B, Fig 3.18) has shown a broad
peak in the higher wavenumber region which indicates the presence of water molecule in
the compound. The peaks at 1565 and 1361 cm-1 correspond to the asymmetric and
symmetric vibrational modes of carboxyl groups. Frequency separation between
asymmetric and symmetric vibrational modes of carboxyl groups have been used to
differentiate the type of bonding between the metal and the ligand. The separation value
of more than 200 cm-1 indicates the presence of ionic carboxylic species or monodentate
coordination, whereas less than 150 cm-1 indicates chelating or bridging coordination
[23]. The separation for these peaks is around 204 cm-1 in the V(IV) compound indicating
absence of chelation or bridging coordination of carboxyl group. The sharp peak at 988
cm-1 correspond to the V=O vibrational interaction. The lower wavenumber peaks at 843
and 636 cm-1 could be due to other V-O vibrational interactions.
Infrared spectrum of the V(III) compound (plot D, Fig 3.18) has also shown a wide
peak in the 2900 to 3600 cm-1 region which is due to the –OH vibrational absorption. The
peaks at 1646 and 1375 cm-1 correspond to asymmetric and symmetric vibrational modes
of carboxyl groups. The separation for these peaks is around 270 cm-1 which indicate the
absence of chelation or bridging coordination of the carboxyl group in the V(III)
compound. Also, the asymmetric stretching peak is split in two indicating strong
interaction of V(III) with these vibrational levels. A weak band at around 1000 cm-1
which is the signature peak corresponding to V=O stretching mode indicates the presence
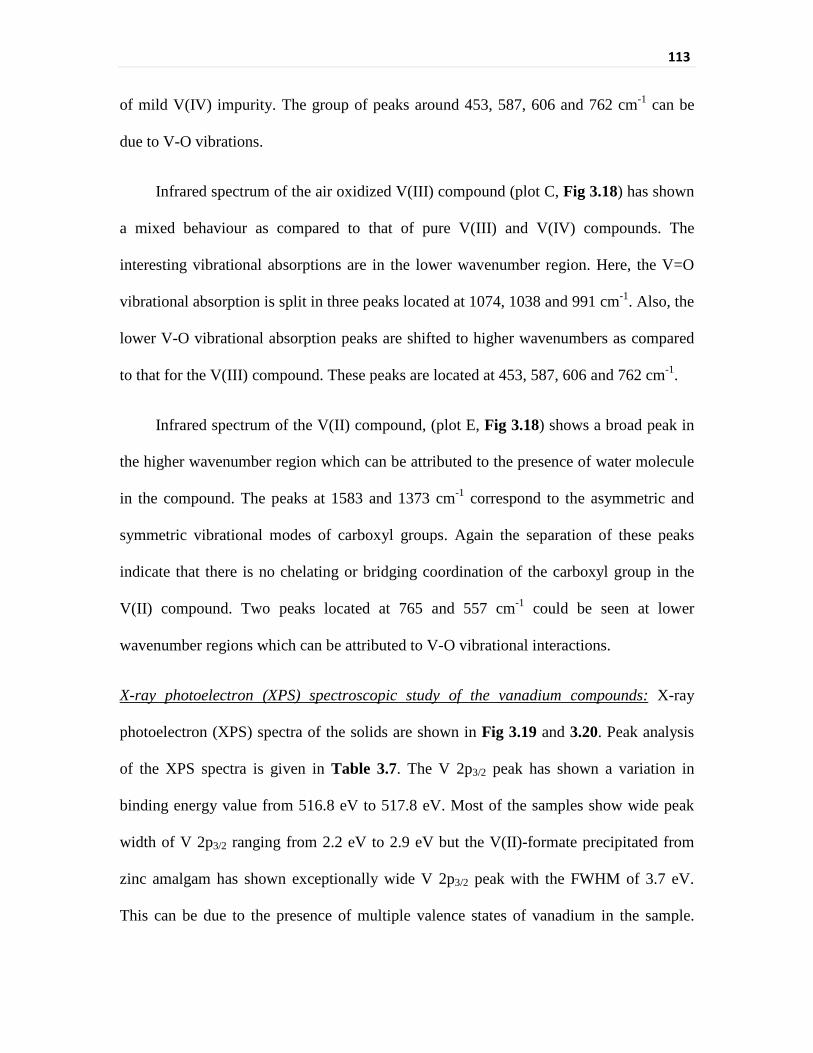
113
of mild V(IV) impurity. The group of peaks around 453, 587, 606 and 762 cm-1 can be
due to V-O vibrations.
Infrared spectrum of the air oxidized V(III) compound (plot C, Fig 3.18) has shown
a mixed behaviour as compared to that of pure V(III) and V(IV) compounds. The
interesting vibrational absorptions are in the lower wavenumber region. Here, the V=O
vibrational absorption is split in three peaks located at 1074, 1038 and 991 cm-1. Also, the
lower V-O vibrational absorption peaks are shifted to higher wavenumbers as compared
to that for the V(III) compound. These peaks are located at 453, 587, 606 and 762 cm-1.
Infrared spectrum of the V(II) compound, (plot E, Fig 3.18) shows a broad peak in
the higher wavenumber region which can be attributed to the presence of water molecule
in the compound. The peaks at 1583 and 1373 cm-1 correspond to the asymmetric and
symmetric vibrational modes of carboxyl groups. Again the separation of these peaks
indicate that there is no chelating or bridging coordination of the carboxyl group in the
V(II) compound. Two peaks located at 765 and 557 cm-1 could be seen at lower
wavenumber regions which can be attributed to V-O vibrational interactions.
X-ray photoelectron (XPS) spectroscopic study of the vanadium compounds: X-ray
photoelectron (XPS) spectra of the solids are shown in Fig 3.19 and 3.20. Peak analysis
of the XPS spectra is given in Table 3.7. The V 2p3/2 peak has shown a variation in
binding energy value from 516.8 eV to 517.8 eV. Most of the samples show wide peak
width of V 2p3/2 ranging from 2.2 eV to 2.9 eV but the V(II)-formate precipitated from
zinc amalgam has shown exceptionally wide V 2p3/2 peak with the FWHM of 3.7 eV.
This can be due to the presence of multiple valence states of vanadium in the sample.
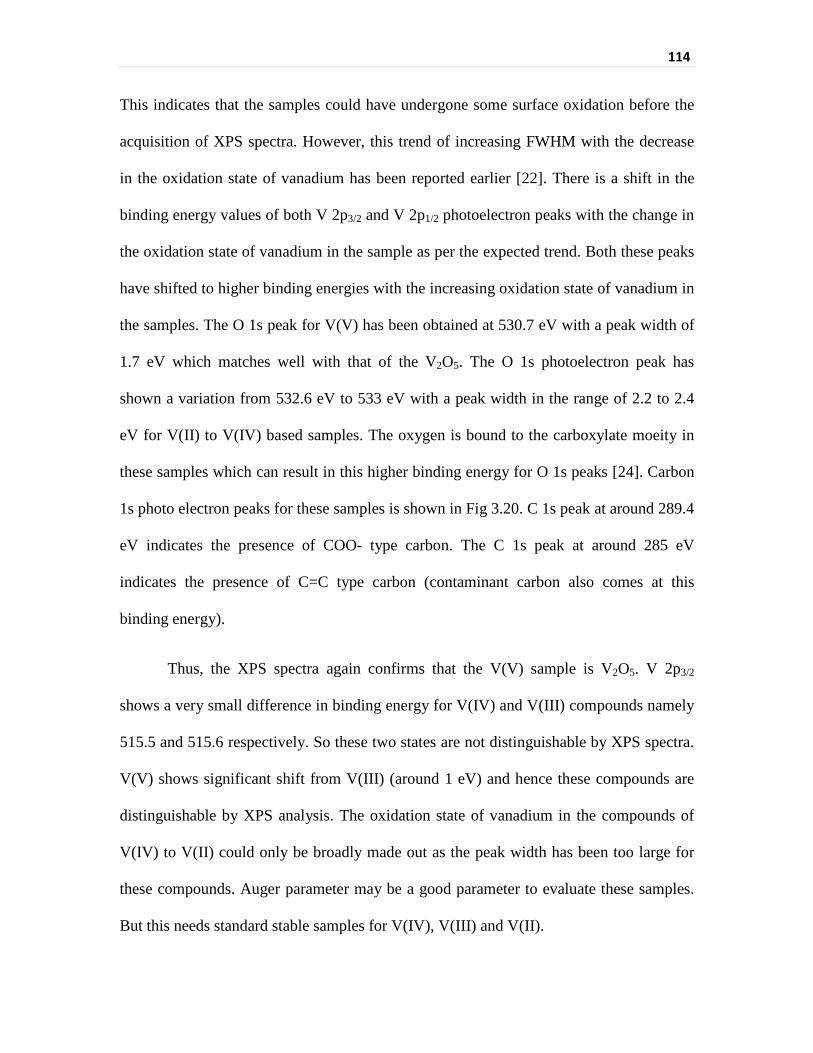
114
This indicates that the samples could have undergone some surface oxidation before the
acquisition of XPS spectra. However, this trend of increasing FWHM with the decrease
in the oxidation state of vanadium has been reported earlier [22]. There is a shift in the
binding energy values of both V 2p3/2 and V 2p1/2 photoelectron peaks with the change in
the oxidation state of vanadium in the sample as per the expected trend. Both these peaks
have shifted to higher binding energies with the increasing oxidation state of vanadium in
the samples. The O 1s peak for V(V) has been obtained at 530.7 eV with a peak width of
1.7 eV which matches well with that of the V2O5. The O 1s photoelectron peak has
shown a variation from 532.6 eV to 533 eV with a peak width in the range of 2.2 to 2.4
eV for V(II) to V(IV) based samples. The oxygen is bound to the carboxylate moeity in
these samples which can result in this higher binding energy for O 1s peaks [24]. Carbon
1s photo electron peaks for these samples is shown in Fig 3.20. C 1s peak at around 289.4
eV indicates the presence of COO- type carbon. The C 1s peak at around 285 eV
indicates the presence of C=C type carbon (contaminant carbon also comes at this
binding energy).
Thus, the XPS spectra again confirms that the V(V) sample is V2O5. V 2p3/2
shows a very small difference in binding energy for V(IV) and V(III) compounds namely
515.5 and 515.6 respectively. So these two states are not distinguishable by XPS spectra.
V(V) shows significant shift from V(III) (around 1 eV) and hence these compounds are
distinguishable by XPS analysis. The oxidation state of vanadium in the compounds of
V(IV) to V(II) could only be broadly made out as the peak width has been too large for
these compounds. Auger parameter may be a good parameter to evaluate these samples.
But this needs standard stable samples for V(IV), V(III) and V(II).
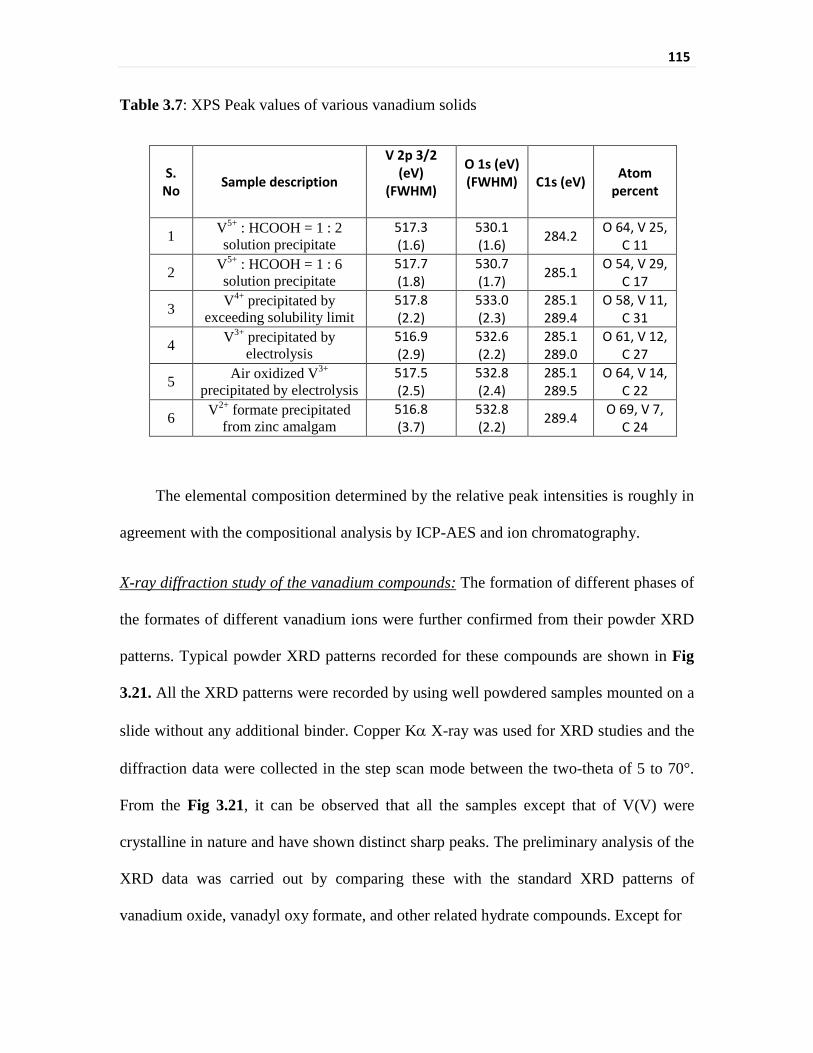
115
Table 3.7: XPS Peak values of various vanadium solids
S. No Sample description
V 2p 3/2 (eV)
(FWHM)
O 1s (eV) (FWHM) C1s (eV) Atom
percent
1 V5+ : HCOOH = 1 : 2 solution precipitate
517.3 (1.6)
530.1 (1.6) 284.2 O 64, V 25,
C 11
2 V5+ : HCOOH = 1 : 6 solution precipitate
517.7 (1.8)
530.7 (1.7) 285.1 O 54, V 29,
C 17
3 V4+ precipitated by exceeding solubility limit
517.8 (2.2)
533.0 (2.3)
285.1 289.4
O 58, V 11, C 31
4 V3+ precipitated by electrolysis
516.9 (2.9)
532.6 (2.2)
285.1 289.0
O 61, V 12, C 27
5 Air oxidized V3+ precipitated by electrolysis
517.5 (2.5)
532.8 (2.4)
285.1 289.5
O 64, V 14, C 22
6 V2+ formate precipitated from zinc amalgam
516.8 (3.7)
532.8 (2.2) 289.4 O 69, V 7,
C 24
The elemental composition determined by the relative peak intensities is roughly in
agreement with the compositional analysis by ICP-AES and ion chromatography.
X-ray diffraction study of the vanadium compounds: The formation of different phases of
the formates of different vanadium ions were further confirmed from their powder XRD
patterns. Typical powder XRD patterns recorded for these compounds are shown in Fig
3.21. All the XRD patterns were recorded by using well powdered samples mounted on a
slide without any additional binder. Copper Kα X-ray was used for XRD studies and the
diffraction data were collected in the step scan mode between the two-theta of 5 to 70°.
From the Fig 3.21, it can be observed that all the samples except that of V(V) were
crystalline in nature and have shown distinct sharp peaks. The preliminary analysis of the
XRD data was carried out by comparing these with the standard XRD patterns of
vanadium oxide, vanadyl oxy formate, and other related hydrate compounds. Except for
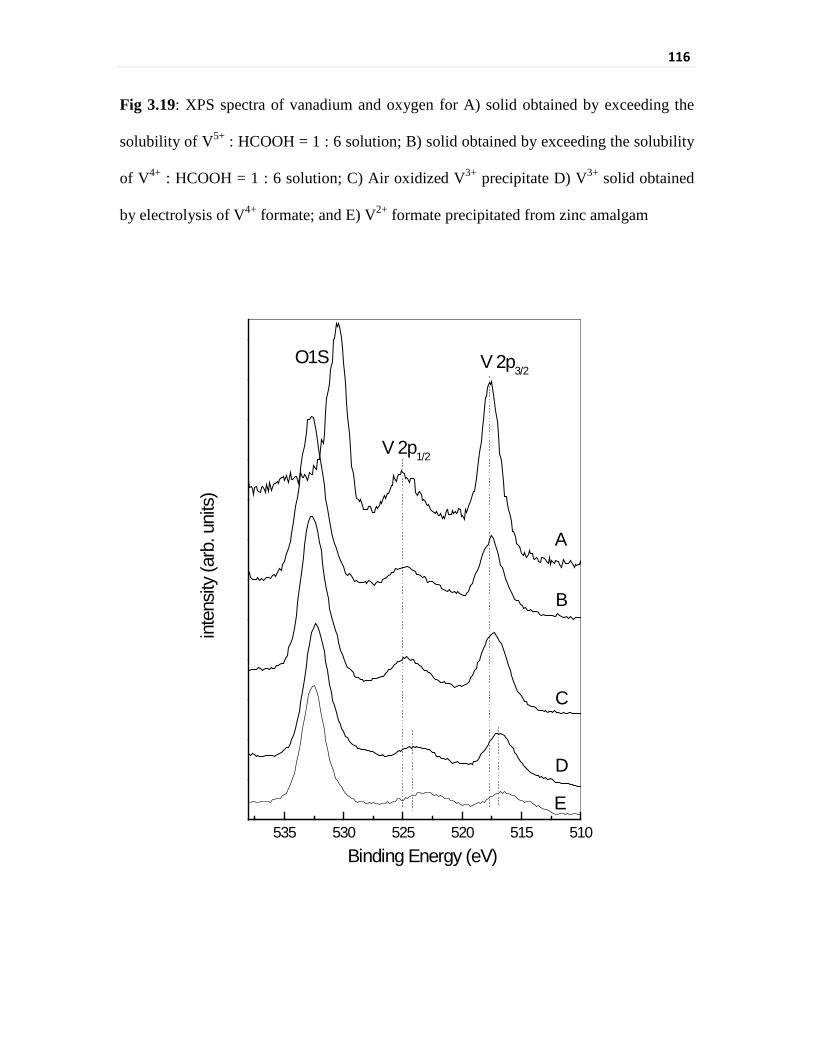
116
Fig 3.19: XPS spectra of vanadium and oxygen for A) solid obtained by exceeding the
solubility of V5+ : HCOOH = 1 : 6 solution; B) solid obtained by exceeding the solubility
of V4+ : HCOOH = 1 : 6 solution; C) Air oxidized V3+ precipitate D) V3+ solid obtained
by electrolysis of V4+ formate; and E) V2+ formate precipitated from zinc amalgam
535 530 525 520 515 510
inte
nsity
(arb
. uni
ts)
Binding Energy (eV)
D
E
C
A
B
O1S
V 2p1/2
V 2p3/2
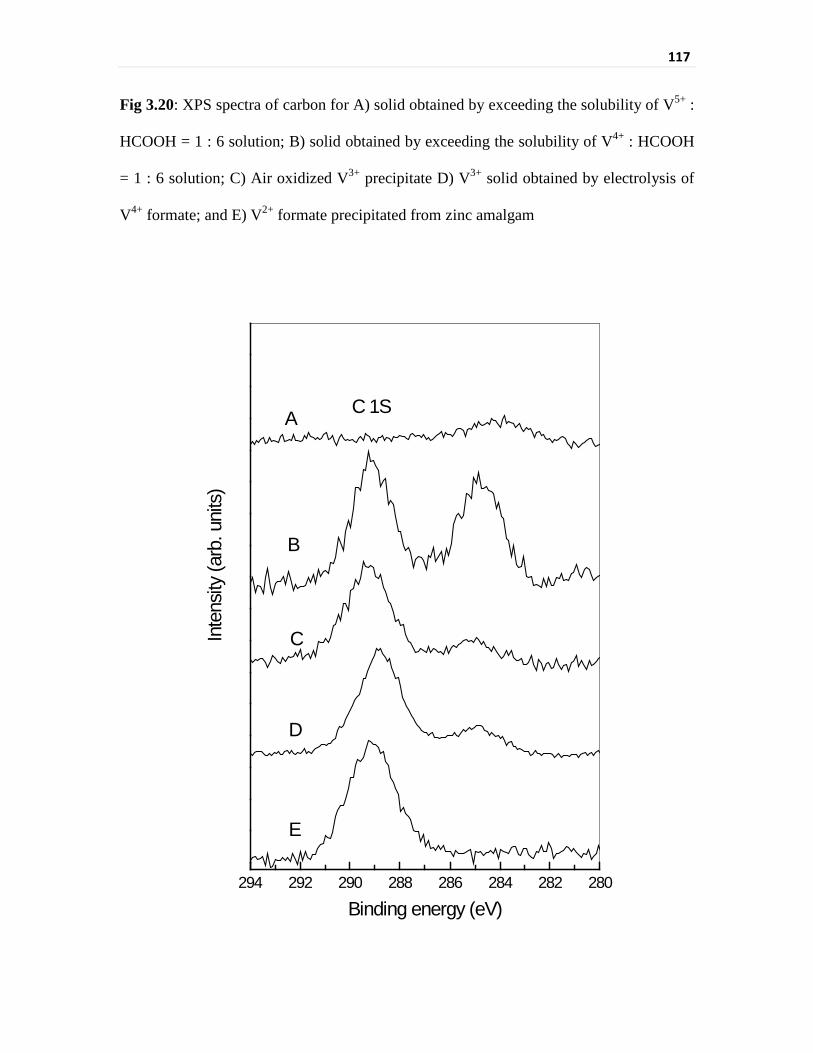
117
Fig 3.20: XPS spectra of carbon for A) solid obtained by exceeding the solubility of V5+ :
HCOOH = 1 : 6 solution; B) solid obtained by exceeding the solubility of V4+ : HCOOH
= 1 : 6 solution; C) Air oxidized V3+ precipitate D) V3+ solid obtained by electrolysis of
V4+ formate; and E) V2+ formate precipitated from zinc amalgam
294 292 290 288 286 284 282 280
Inte
nsity
(arb
. uni
ts)
Binding energy (eV)
E
A
B
C
D
C 1S
118
the V(IV) oxy formate, none of the XRD pattern could be assigned due to unavailability
of any standard reference patterns. The observed d-values in the powder XRD pattern of
V(IV) oxy formate were in close agreement with the reported vanadium oxy formate
hydrate, VO(HCOO)2⋅H2O phase of V(IV) (JCPDS-PCPDF- 01-074-6946). Thus the
observed formate of the V(IV) could be assigned to this compound. However, the
observed XRD pattern has shown shifts in the positions of some peaks and differences in
the intensity distribution from the reported data. This could be due to either presence of
preferred orientations or feeble but noticeable differences in the structure. The matched
XRD pattern of the V(IV) formate compound with the Vanadium oxy formate Hydrate
VO(HCOO)2⋅H2O, reported in the PCPDF database is shown in Fig 3.22.
The XRD pattern of V(III) and V(II) formate were subsequently analyzed by
comparing the observed d-values and intensities with the JCPDS-PCPDF database. Any
isostructural compound or phases in the available database (PDF2, version - 6.2) could
not be matched to the observed peaks of the V(III) compound. Thus, the composition
could be assumed as new structure type and hence needs more detailed investigation for
the structure. Similar analysis for the XRD pattern of the V(II) formate revealed a close
similarity to the reported pattern for Fe(HCOO)2⋅2H2O (JCPDS-PCPDF-19-0604). This
compound is probably isomorphous with several other formate dehydrates of group 3A
divalent transition metal ions like Ni2+, Cu2+, Zn2+. The matched XRD pattern of the V(II)
formate compound with the cupric formate diydrate Cu(HCOO)2⋅2H2O, reported in the
PCPDF database is shown in Fig 3.23.
The phase analysis of the compounds were further done to get some insight into their
structures. The observed reflections were indexed to get unit cell parameters. All the

119
Fig 3.21: XRD pattern of A) solid obtained by exceeding the solubility of V5+ : HCOOH
= 1 : 6 solution; B) solid obtained by exceeding the solubility of V4+ : HCOOH = 1 : 6
solution; C) V3+ solid obtained by electrolysis of V4+ formate; and D) V2+ formate
precipitated from zinc amalgam
0 10 20 30 40 50 60 70
Inte
nsity
2 θ
D: V(II) formate
C: V(III) formate
B: V(IV) formate
A: V(V) ppt.

120
Fig 3.22: Comparison of the XRD pattern of V(IV) formate with the matched reference
0 10 20 30 40 50 60 70
Inte
nsity
(arb
. uni
ts)
2 theta
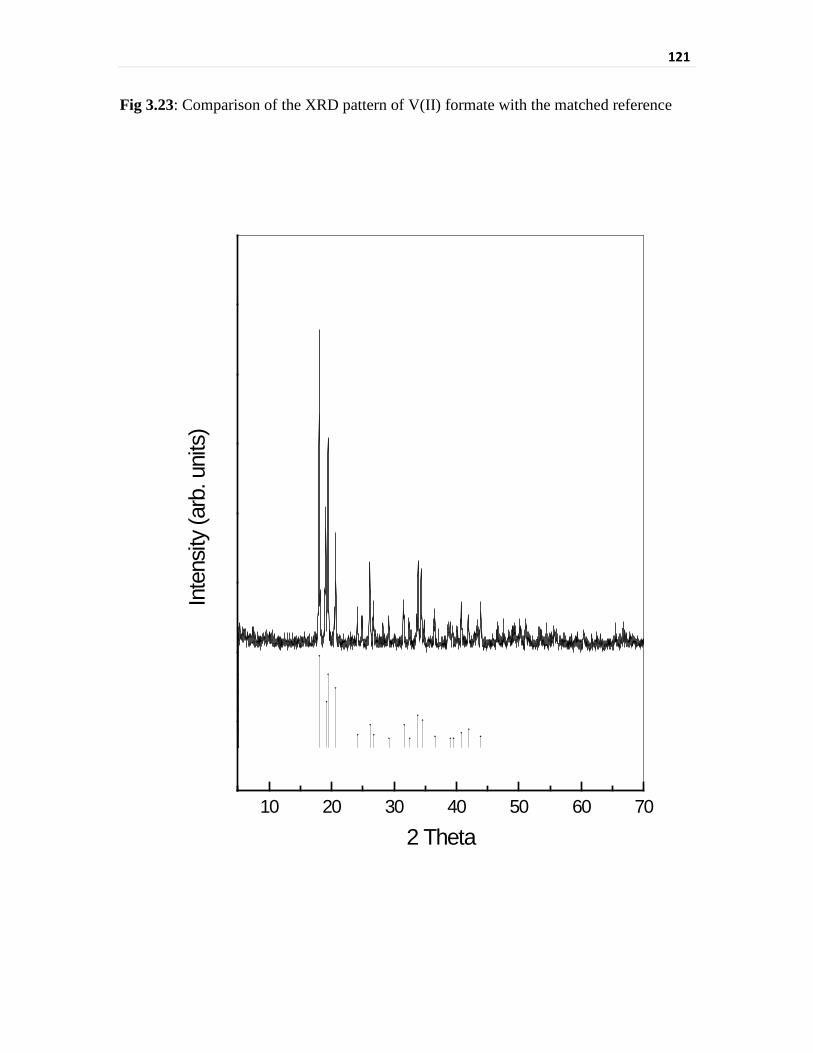
121
Fig 3.23: Comparison of the XRD pattern of V(II) formate with the matched reference
10 20 30 40 50 60 70
Inte
nsity
(arb
. uni
ts)
2 Theta
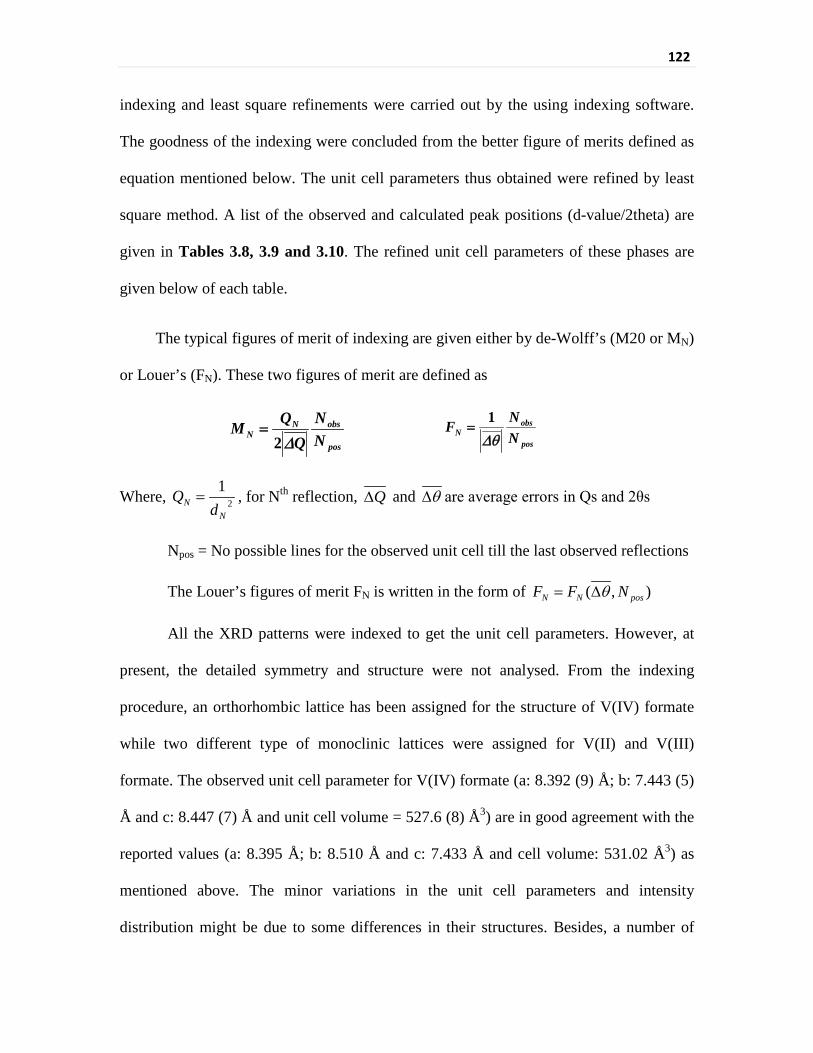
122
indexing and least square refinements were carried out by the using indexing software.
The goodness of the indexing were concluded from the better figure of merits defined as
equation mentioned below. The unit cell parameters thus obtained were refined by least
square method. A list of the observed and calculated peak positions (d-value/2theta) are
given in Tables 3.8, 3.9 and 3.10. The refined unit cell parameters of these phases are
given below of each table.
The typical figures of merit of indexing are given either by de-Wolff’s (M20 or MN)
or Louer’s (FN). These two figures of merit are defined as
Where, 21
NN d
Q = , for Nth reflection, Q∆ and θ∆ are average errors in Qs and 2θs
Npos = No possible lines for the observed unit cell till the last observed reflections
The Louer’s figures of merit FN is written in the form of ),( posNN NFF θ∆=
All the XRD patterns were indexed to get the unit cell parameters. However, at
present, the detailed symmetry and structure were not analysed. From the indexing
procedure, an orthorhombic lattice has been assigned for the structure of V(IV) formate
while two different type of monoclinic lattices were assigned for V(II) and V(III)
formate. The observed unit cell parameter for V(IV) formate (a: 8.392 (9) Å; b: 7.443 (5)
Å and c: 8.447 (7) Å and unit cell volume = 527.6 (8) Å3) are in good agreement with the
reported values (a: 8.395 Å; b: 8.510 Å and c: 7.433 Å and cell volume: 531.02 Å3) as
mentioned above. The minor variations in the unit cell parameters and intensity
distribution might be due to some differences in their structures. Besides, a number of
pos
obsNN N
NQ
QM∆2
=pos
obsN N
NFθ∆1
=
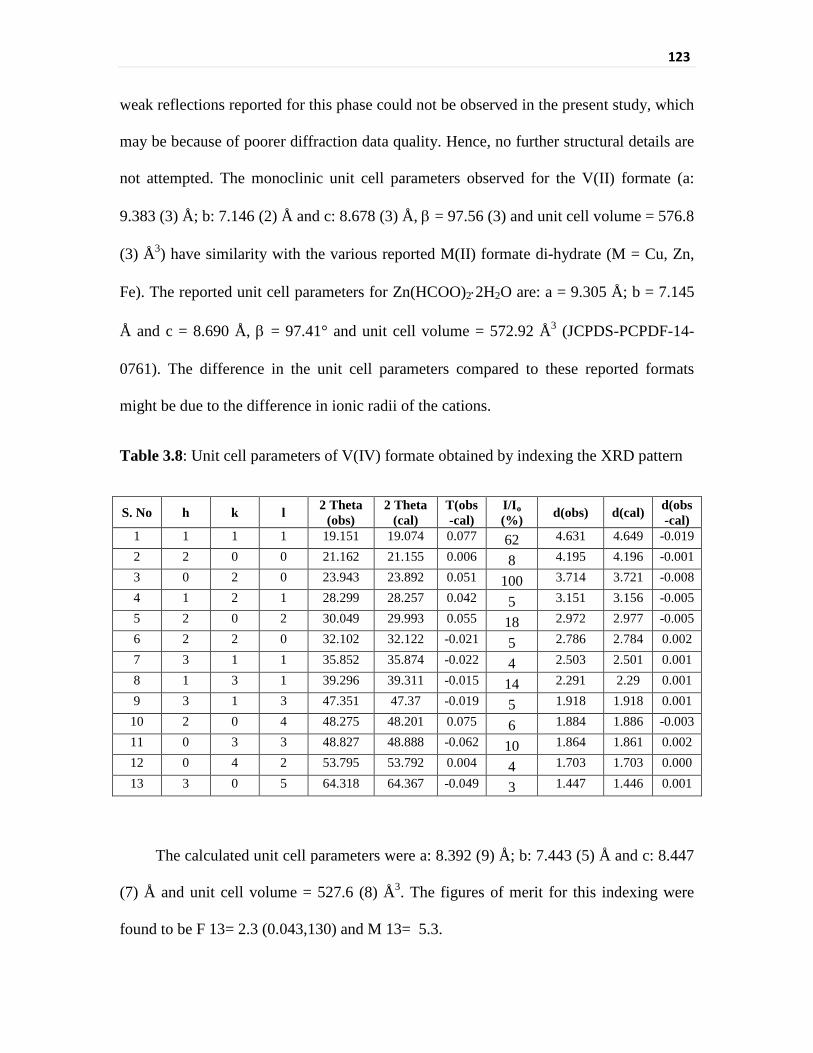
123
weak reflections reported for this phase could not be observed in the present study, which
may be because of poorer diffraction data quality. Hence, no further structural details are
not attempted. The monoclinic unit cell parameters observed for the V(II) formate (a:
9.383 (3) Å; b: 7.146 (2) Å and c: 8.678 (3) Å, β = 97.56 (3) and unit cell volume = 576.8
(3) Å3) have similarity with the various reported M(II) formate di-hydrate (M = Cu, Zn,
Fe). The reported unit cell parameters for Zn(HCOO)2⋅2H2O are: a = 9.305 Å; b = 7.145
Å and c = 8.690 Å, β = 97.41° and unit cell volume = 572.92 Å3 (JCPDS-PCPDF-14-
0761). The difference in the unit cell parameters compared to these reported formats
might be due to the difference in ionic radii of the cations.
Table 3.8: Unit cell parameters of V(IV) formate obtained by indexing the XRD pattern
S. No h k l 2 Theta (obs)
2 Theta (cal)
T(obs-cal)
I/Io (%) d(obs) d(cal) d(obs
-cal) 1 1 1 1 19.151 19.074 0.077 62 4.631 4.649 -0.019 2 2 0 0 21.162 21.155 0.006 8 4.195 4.196 -0.001 3 0 2 0 23.943 23.892 0.051 100 3.714 3.721 -0.008 4 1 2 1 28.299 28.257 0.042 5 3.151 3.156 -0.005 5 2 0 2 30.049 29.993 0.055 18 2.972 2.977 -0.005 6 2 2 0 32.102 32.122 -0.021 5 2.786 2.784 0.002 7 3 1 1 35.852 35.874 -0.022 4 2.503 2.501 0.001 8 1 3 1 39.296 39.311 -0.015 14 2.291 2.29 0.001 9 3 1 3 47.351 47.37 -0.019 5 1.918 1.918 0.001
10 2 0 4 48.275 48.201 0.075 6 1.884 1.886 -0.003 11 0 3 3 48.827 48.888 -0.062 10 1.864 1.861 0.002 12 0 4 2 53.795 53.792 0.004 4 1.703 1.703 0.000 13 3 0 5 64.318 64.367 -0.049 3 1.447 1.446 0.001
The calculated unit cell parameters were a: 8.392 (9) Å; b: 7.443 (5) Å and c: 8.447
(7) Å and unit cell volume = 527.6 (8) Å3. The figures of merit for this indexing were
found to be F 13= 2.3 (0.043,130) and M 13= 5.3.

124
Table 3.9: Unit cell parameters of V(III) formate obtained by indexing the XRD pattern
S No h k l 2Theta (obs)
2Theta (cal)
T(obs-cal)
I/Io (%) d(obs) d(cal) d(obs-
cal) 1 -1 0 1 9.013 9.014 0.000 100 9.811 9.811 0.001 2 1 0 1 13.484 13.479 0.004 52 6.567 6.569 -0.002 3 0 0 2 13.618 13.615 0.004 51 6.502 6.504 -0.002 4 0 1 1 15.83 15.822 0.008 36 5.598 5.601 -0.003 5 1 1 0 17.087 17.018 0.07 19 5.189 5.21 -0.021 6 -2 0 2 17.976 18.084 -0.108 10 4.935 4.905 0.029 7 2 0 0 18.442 18.502 -0.061 9 4.811 4.795 0.016 8 -1 0 3 18.979 18.8 0.179 31 4.676 4.72 -0.044 9 0 0 3 20.614 20.483 0.131 10 4.309 4.336 -0.027 10 -2 1 2 23.062 23.112 -0.049 17 3.856 3.848 0.008 11 2 1 0 23.447 23.444 0.003 12 3.794 3.794 0.000 12 -1 1 3 23.637 23.682 -0.045 14 3.764 3.757 0.007 13 1 1 2 24.086 24.088 -0.002 10 3.695 3.694 0.000 14 -1 0 4 25.206 25.166 0.04 3 3.533 3.538 -0.005 15 1 0 3 25.704 25.702 0.002 47 3.466 3.466 0.000 16 -2 0 4 26.127 26.272 -0.146 10 3.411 3.392 0.019 17 2 0 2 27.04 27.15 -0.109 33 3.297 3.284 0.013 18 -1 1 4 28.966 29.048 -0.082 14 3.082 3.074 0.008 19 0 2 1 29.621 29.596 0.025 16 3.016 3.018 -0.002 20 2 1 2 30.8 30.801 0.000 13 2.903 2.903 0.000 21 3 1 0 31.487 31.479 0.009 9 2.841 2.842 -0.001 22 -1 0 5 31.865 31.848 0.017 7 2.808 2.81 -0.001 23 1 0 4 32.417 32.404 0.013 8 2.762 2.763 -0.001 24 2 0 3 32.915 32.913 0.002 16 2.721 2.721 0.000 25 -2 2 1 33.43 33.588 -0.158 11 2.68 2.668 0.012 26 2 2 0 34.447 34.426 0.021 6 2.603 2.605 -0.002 27 -4 0 1 35.366 35.253 0.113 8 2.538 2.546 -0.008 28 -2 2 3 36.296 36.174 0.122 6 2.475 2.483 -0.008 29 -4 1 2 37.27 37.339 -0.068 4 2.412 2.408 0.004 30 -3 1 5 37.726 37.703 0.023 10 2.384 2.386 -0.001 31 -1 0 6 38.748 38.76 -0.011 5 2.324 2.323 0.001 32 1 0 5 39.301 39.334 -0.033 5 2.292 2.291 0.002 33 -4 1 4 39.576 39.506 0.07 6 2.277 2.281 -0.004
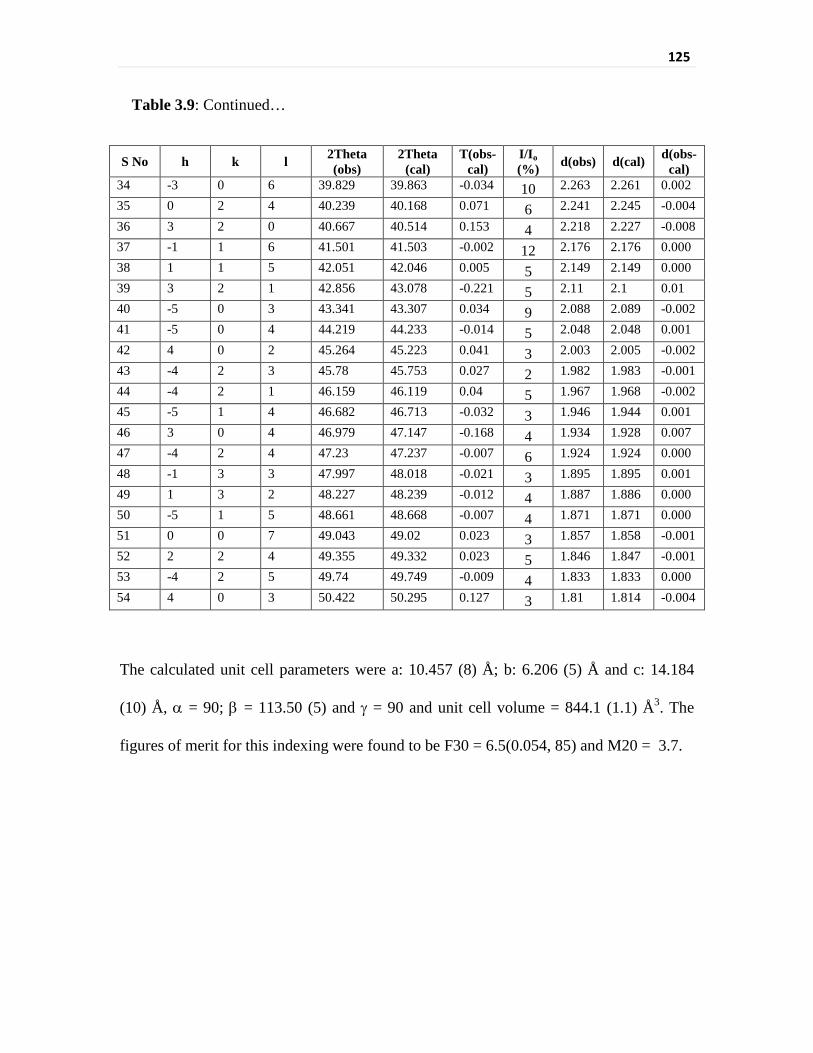
125
Table 3.9: Continued…
S No h k l 2Theta (obs)
2Theta (cal)
T(obs-cal)
I/Io (%) d(obs) d(cal) d(obs-
cal) 34 -3 0 6 39.829 39.863 -0.034 10 2.263 2.261 0.002 35 0 2 4 40.239 40.168 0.071 6 2.241 2.245 -0.004 36 3 2 0 40.667 40.514 0.153 4 2.218 2.227 -0.008 37 -1 1 6 41.501 41.503 -0.002 12 2.176 2.176 0.000 38 1 1 5 42.051 42.046 0.005 5 2.149 2.149 0.000 39 3 2 1 42.856 43.078 -0.221 5 2.11 2.1 0.01 40 -5 0 3 43.341 43.307 0.034 9 2.088 2.089 -0.002 41 -5 0 4 44.219 44.233 -0.014 5 2.048 2.048 0.001 42 4 0 2 45.264 45.223 0.041 3 2.003 2.005 -0.002 43 -4 2 3 45.78 45.753 0.027 2 1.982 1.983 -0.001 44 -4 2 1 46.159 46.119 0.04 5 1.967 1.968 -0.002 45 -5 1 4 46.682 46.713 -0.032 3 1.946 1.944 0.001 46 3 0 4 46.979 47.147 -0.168 4 1.934 1.928 0.007 47 -4 2 4 47.23 47.237 -0.007 6 1.924 1.924 0.000 48 -1 3 3 47.997 48.018 -0.021 3 1.895 1.895 0.001 49 1 3 2 48.227 48.239 -0.012 4 1.887 1.886 0.000 50 -5 1 5 48.661 48.668 -0.007 4 1.871 1.871 0.000 51 0 0 7 49.043 49.02 0.023 3 1.857 1.858 -0.001 52 2 2 4 49.355 49.332 0.023 5 1.846 1.847 -0.001 53 -4 2 5 49.74 49.749 -0.009 4 1.833 1.833 0.000 54 4 0 3 50.422 50.295 0.127 3 1.81 1.814 -0.004
The calculated unit cell parameters were a: 10.457 (8) Å; b: 6.206 (5) Å and c: 14.184
(10) Å, α = 90; β = 113.50 (5) and γ = 90 and unit cell volume = 844.1 (1.1) Å3. The
figures of merit for this indexing were found to be F30 = 6.5(0.054, 85) and M20 = 3.7.
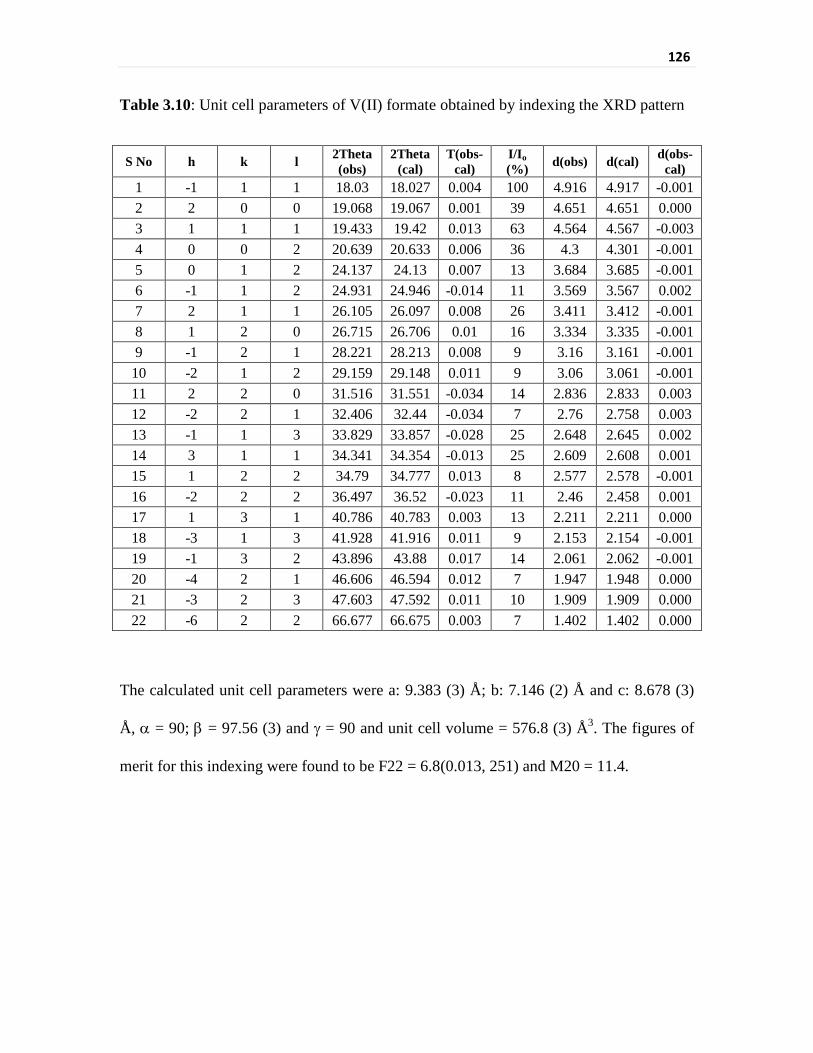
126
Table 3.10: Unit cell parameters of V(II) formate obtained by indexing the XRD pattern
S No h k l 2Theta (obs)
2Theta (cal)
T(obs-cal)
I/Io (%) d(obs) d(cal) d(obs-
cal) 1 -1 1 1 18.03 18.027 0.004 100 4.916 4.917 -0.001 2 2 0 0 19.068 19.067 0.001 39 4.651 4.651 0.000 3 1 1 1 19.433 19.42 0.013 63 4.564 4.567 -0.003 4 0 0 2 20.639 20.633 0.006 36 4.3 4.301 -0.001 5 0 1 2 24.137 24.13 0.007 13 3.684 3.685 -0.001 6 -1 1 2 24.931 24.946 -0.014 11 3.569 3.567 0.002 7 2 1 1 26.105 26.097 0.008 26 3.411 3.412 -0.001 8 1 2 0 26.715 26.706 0.01 16 3.334 3.335 -0.001 9 -1 2 1 28.221 28.213 0.008 9 3.16 3.161 -0.001
10 -2 1 2 29.159 29.148 0.011 9 3.06 3.061 -0.001 11 2 2 0 31.516 31.551 -0.034 14 2.836 2.833 0.003 12 -2 2 1 32.406 32.44 -0.034 7 2.76 2.758 0.003 13 -1 1 3 33.829 33.857 -0.028 25 2.648 2.645 0.002 14 3 1 1 34.341 34.354 -0.013 25 2.609 2.608 0.001 15 1 2 2 34.79 34.777 0.013 8 2.577 2.578 -0.001 16 -2 2 2 36.497 36.52 -0.023 11 2.46 2.458 0.001 17 1 3 1 40.786 40.783 0.003 13 2.211 2.211 0.000 18 -3 1 3 41.928 41.916 0.011 9 2.153 2.154 -0.001 19 -1 3 2 43.896 43.88 0.017 14 2.061 2.062 -0.001 20 -4 2 1 46.606 46.594 0.012 7 1.947 1.948 0.000 21 -3 2 3 47.603 47.592 0.011 10 1.909 1.909 0.000 22 -6 2 2 66.677 66.675 0.003 7 1.402 1.402 0.000
The calculated unit cell parameters were a: 9.383 (3) Å; b: 7.146 (2) Å and c: 8.678 (3)
Å, α = 90; β = 97.56 (3) and γ = 90 and unit cell volume = 576.8 (3) Å3. The figures of
merit for this indexing were found to be F22 = 6.8(0.013, 251) and M20 = 11.4.
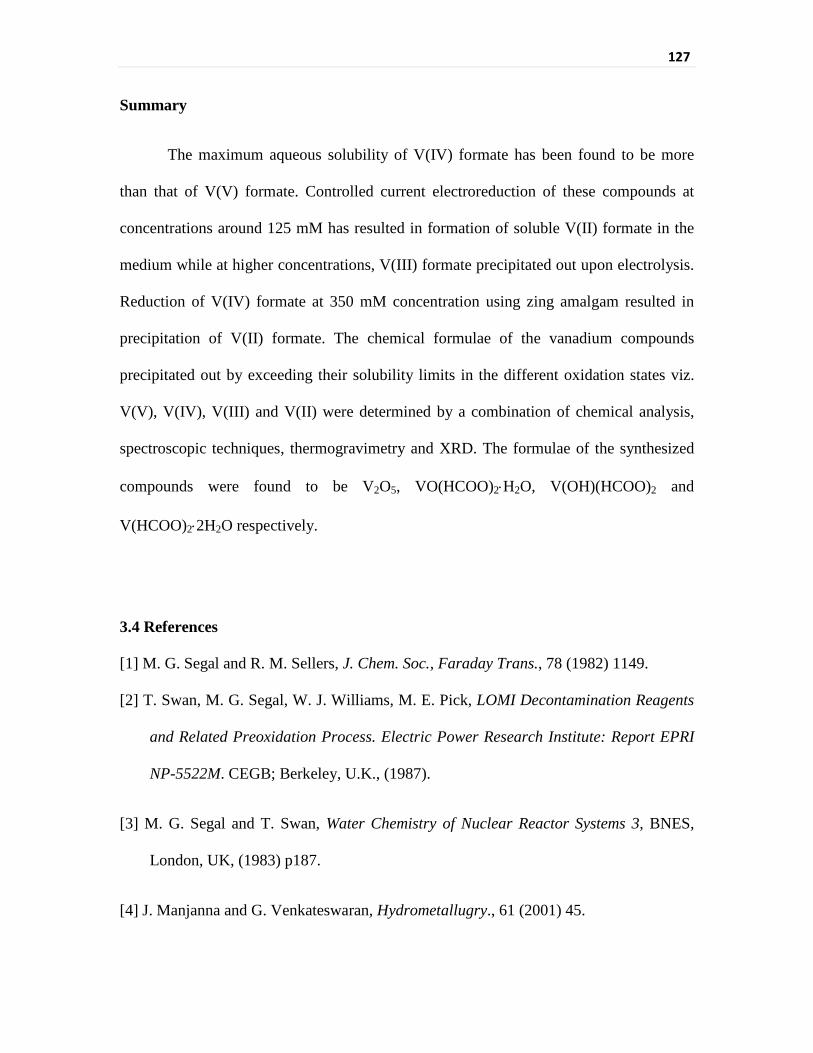
127
Summary
The maximum aqueous solubility of V(IV) formate has been found to be more
than that of V(V) formate. Controlled current electroreduction of these compounds at
concentrations around 125 mM has resulted in formation of soluble V(II) formate in the
medium while at higher concentrations, V(III) formate precipitated out upon electrolysis.
Reduction of V(IV) formate at 350 mM concentration using zing amalgam resulted in
precipitation of V(II) formate. The chemical formulae of the vanadium compounds
precipitated out by exceeding their solubility limits in the different oxidation states viz.
V(V), V(IV), V(III) and V(II) were determined by a combination of chemical analysis,
spectroscopic techniques, thermogravimetry and XRD. The formulae of the synthesized
compounds were found to be V2O5, VO(HCOO)2⋅H2O, V(OH)(HCOO)2 and
V(HCOO)2⋅2H2O respectively.
3.4 References
[1] M. G. Segal and R. M. Sellers, J. Chem. Soc., Faraday Trans., 78 (1982) 1149.
[2] T. Swan, M. G. Segal, W. J. Williams, M. E. Pick, LOMI Decontamination Reagents
and Related Preoxidation Process. Electric Power Research Institute: Report EPRI
NP-5522M. CEGB; Berkeley, U.K., (1987).
[3] M. G. Segal and T. Swan, Water Chemistry of Nuclear Reactor Systems 3, BNES,
London, UK, (1983) p187.
[4] J. Manjanna and G. Venkateswaran, Hydrometallugry., 61 (2001) 45.
128
[5] D. Bradbury, M. G. Segal, T. Swan, G. C. W. Comley and D. J. Ferrett, Nucl. Enegry,
20 (1981) 403.
[6] L. N. Moskvin, V. V. Krivobokov, A. K. Andrianov, and A. A. Efimov,
Radiochemistry, 52 (2010) 585.
[7] V. S. Tripathi, J. Manjanna, G. Venkateswaran, B. K. Gokhale, and V. Balaji, Ind.
Eng. Chem. Res., 43 (2004) 5989.
[8] C. J. Wood, Progress in Nuclear Energy, 23 (1990) 35.
[9] Decontamination Handbook, EPRI, TR-112352, Palo Alto, CA: July 1999.
[10] A. J. Bard and L. R. Faulkner, Electrochemical Methods Fundamentals and
Applications: Second Edition, John Wiley & Sons, Inc. 2001.
[11] B. E. Conway and J. O'M. Bockris, J. Chem. Phys., 26 (1957) 532.
[12] M. Vijayakumar, L. Li, G. Graff, J. Liu, H. Zhang, Z. Yang and J. Z. Hu, J. Power
Sources, 196 (2011) 3669.
[13] Z.L.K.Z.C. Wang, Functional and Smart Materials—Structural Evolution and
Structure Analysis, Springer-Verlag, 1998.
[14] M. S. Kazacos, C. Menictas and M. Kazacos, J. Electrochem. Soc., Vol. 143 (1996)
L86.
[15] Yi-Chen Kao and Chein-Hsiun Tu, J. Chem. Eng. Data, 54 (2009) 1927.
[16] Q. Yin, N.P. Brandon and G.H. Kelsall, J. App. Electrochem., 30 (2000) 1109.
[17] S. Lakshmi Reddy, Tamio Endo and G. Siva Reddy, Electronic (Absorption) Spectra
of 3d Transition Metal Complexes, Chapter 1, http://dx.doi.org/10.5772/50128.
[18] R. N. Keller, Coordination Chemistry of group (IV) and (V) metals, ARL 66-0082,
1966.
129
[19] M. Vijayakumar, S. D. Burton, C. Huang, L. Li, Z. Yang, G. L. Graff, J. Liu, J. Hua,
M. Skyllas-Kazacos, J. Power Sources, 195 (2010) 7709.
[20] O. G. Holmes and D. S. McClure, J. Chem. Phys., 26 (1957) 1686.
[21] I. Asif, S. Ali, S. Shahzadi and S. Mahmood, J. Chin. Chem. Soc., 54 (2007) 23.
[22] I.L. Botto, M.B. Vassallo, E.J. Baran and G. Minelli, Mater. Chem. Phys., 50 (1997)
267.
[23] P. Persson, M. Karlsson, and Lars-Olof Öhman, Geochimica et Cosmochimica Acta,
62 (1998) 3657.
[24] C. He, Y. Liu, Z. Xue, M. Zheng, H. Wang, Y. Xiao, H. Dong, H. Zhang, B. Lei, Int.
J. Electrochem. Sci., 8 (2013) 7088.

130
CHAPTER-4
Redox Speciation Studies of Aqueous Vanadium Solutions
4.1 Introduction
Vanadium ions exists in aqueous solution as V(II), V(III), V(IV), or V(V), or as a
mixture of any two contiguous valence states [1]. The lower oxidation states are air
sensitive and hence the synthesis of lower oxidation state vanadium compounds in
aqueous solution require continuous monitoring to ensure inert atmosphere in the
experimental setup. Thus redox speciation of aqueous vanadium is an essential
prerequisite for efficient synthesis of lower oxidation state aqueous vanadium compounds
in aqueous solutions.
Synthesis of vanadous formulation through electrolytic reduction is a viable
option for the purpose of its use in the decontamination formulation as electrolysis
provides the advantage of selecting a non corrosive medium while avoiding any spare
ionic species in the final product [2]. These are primary objectives for nuclear power
plant application owing to structural integrity and active waste volume generation
concerns. The prevalent oxidation states of vanadium compounds are (V) and (IV) and
preparation of V(II) from these states require proper monitoring of the process. V(II) and
even V(III) formulations are air sensitive and hence a stringent inert atmosphere has to be
maintained throughout the preparation process. Thus, a reliable on-line vanadium redox
species measurement based on minimum intervention and fast response is required to
monitor the progress of electrolysis. Redox potential monitoring has been explored for

131
on-line measurement during electrolytic preparation of lower oxidation state aqueous
vanadium compounds. Solution potential monitoring with a redox electrode impressed
with a high frequency of 1.13 kHz, 10 mV alternating voltage to overcome polarization
of the electrode has been evolved for evaluating the progress of electrolysis.
Spectrophotometric determination of aqueous vanadium is the method of choice
when rapid redox speciation is required [3]. However, direct spectrophotometric
determination of vanadium suffers from poor sensitivity and selectivity. Extraction to
organic phase followed by spectrophotometric determination using suitable
chromophores is normally practiced to improve sensitivity and selectivity [4, 5]. Catalytic
spectrophotometric methods are also used for sensitive spectrophotometric determination
of V(V) [6]. However, these methods require extensive processing of the sample,
maintaining specific concentration ratio of reagents and providing specific reaction
conditions for good results. A modified method used by King and Garner [7] has been
used for spectrophotometric redox speciation. The vanadium samples are initially
analysed for total V(V) reducing strength. This is done by converting the sample to
V(V)/V(IV) mixture by adding known excess of V(V) solution. Also, another aliquot of
the sample is completely oxidized to V(V) by acidic KMnO4 [8]. Redox interaction of
V(V) with Fe(II) is known to be instantaneous in acidic aqueous medium and has been
used to evaluate the V(V) concentration [9]. The same route but with the estimation of
Fe(III) by the established spectrophotometric Fe(III)-sulfosalicylate complex method [10]
has been followed. The figures of merit has already been evaluated for the method [11].
The interference of V(IV) and Mn(II) on the method has been evaluated as these ions will
132
be a part of the sample matrix. Direct spectrophotometric method for V(III)/(II)
speciation based on thiocyanate complex formation is also explored.
4.2 Experimental
125 mM sodium metavanadate was electrolyzed in 750 mM formic acid medium
using a two compartment electrolysis cell. Graphite felt was used as the cathode while
stainless steel AISI 304 was used as the anode and the compartments were separated by a
commercial anion exchange membrane. Constant current electrolysis with a current
density of around 55 mA/cm2 across the anion exchange membrane was used to
electrolyze 550 ml of the solution. One of the two plates of the conductivity probe of the
conductivity meter (TH-2300, El-Hamma Instruments) has been used to measure solution
potential with respect to a Ag/AgCl, sat. KCl reference electrode with the help of a digital
multimeter (81K-TRMS, MECO) connected to PC. The conductivity meter applies a high
frequency of 1.13 kHz, 10 mV alternating voltage signal on the redox probe.
0.5 ml of sample was periodically collected at an interval of 30 minutes with a 5
ml liquid syringe and was mixed with an aliquot of stock V(V) solution (125 mM NaVO3
in 750 mM HCOOH). The ratio of the mixture was varied form 1:1 to 1:3 and finally to
1:4 for the sample volume to initial stock volume respectively with the progressing stages
of electrolysis. These variations in the composition were done when V(V) concentration
in the mixture came down to 62.5 mM for the first two stages of electrolysis (as per the
analysis). The mixture was initially diluted to 41.6 times with deaerated water in a 25 ml
volumetric flask (0.6 ml of mixture taken) under inert atmosphere and then finally to
another 25 times in a 1 cm path length spectrophotometric quartz cuvette of 12.5 ml
133
volume (0.5 ml of diluted mixture taken) again under the inert atmosphere. 1 ml of 3 mM
FeSO4 stock solution in 50 mM H2SO4 was added to the cuvette. Finally, 5 ml of 2 M
CH3COOH and 1.1 M CH3COONa buffer solution was added before adding 5 ml of 40
mM sulfosalicylic acid solution to the cuvette and making up the solution to 12.5 ml by
adding water. The absorbance was measured at 465 nm.
Total vanadium concentration was separately determined by using 10 ml of 41.6
times diluted V(V)/V(IV) mixture. The mixture was converted to pure V(V) solution by
drop wise addition of acidified KMnO4 (5 mM KMnO4 in 40 mM H2SO4 solution) at 80
oC until a stable purple color solution is obtained. The solution was made up to 20 ml
after cooling and was analysed by ferric sulfosalicylic acid method as described above.
V(IV) formate was prepared by reducing NaVO3 by hydrazine in formic acid
medium [12]. It was mixed with initial stock V(V) solution (125 mM NaVO3 in 750 mM
HCOOH) in a molar ratio of 0.1 to 30. The resulting mixture was analysed by the above
mentioned procedure to evaluate the V(IV) interference in the analysis. MnSO4 was also
mixed with stock V(V) solution in 0.1 to 30 molar ratio and the solution was analysed for
the Mn2+ interference in the analysis process.
Direct spectrophotometric determination of V(III) and V(II) solutions has also
been evaluated. This is explored to further simplify the analysis of these solutions. The
V(III)/V(II) solution formed during the electrolysis was added to a solution of 0.5 M
KSCN in 1 M HCl and the UV-visible spectra was recorded.
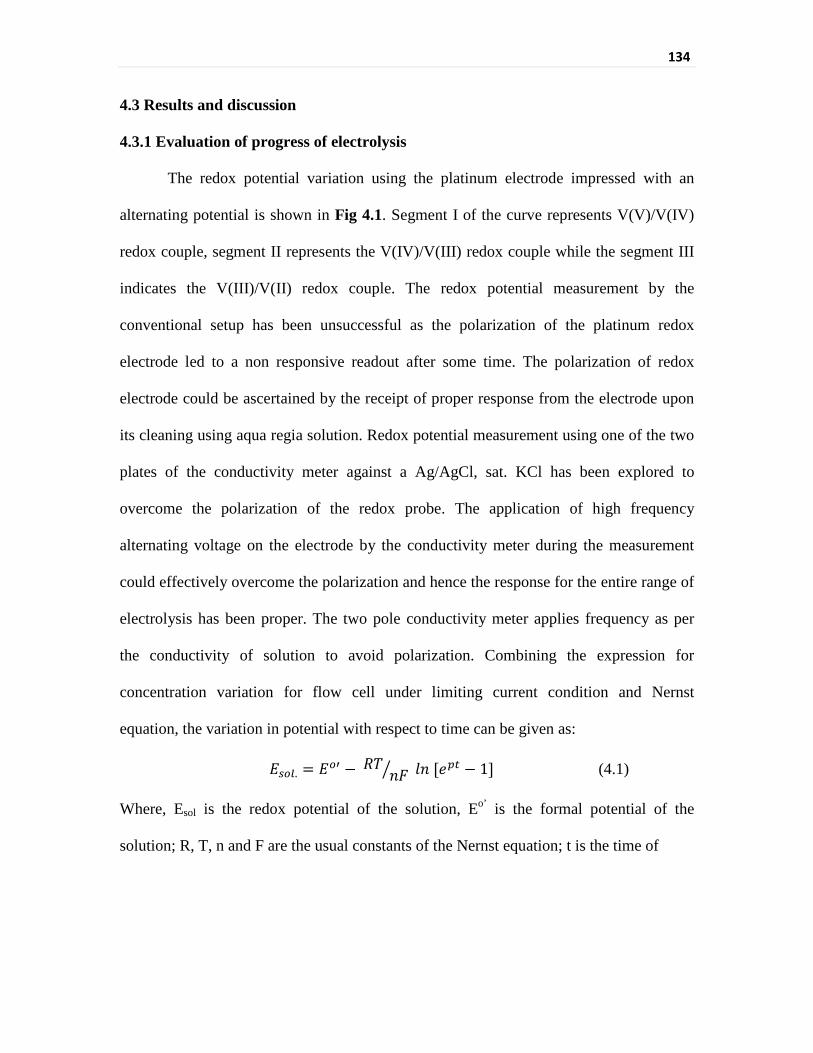
134
4.3 Results and discussion
4.3.1 Evaluation of progress of electrolysis
The redox potential variation using the platinum electrode impressed with an
alternating potential is shown in Fig 4.1. Segment I of the curve represents V(V)/V(IV)
redox couple, segment II represents the V(IV)/V(III) redox couple while the segment III
indicates the V(III)/V(II) redox couple. The redox potential measurement by the
conventional setup has been unsuccessful as the polarization of the platinum redox
electrode led to a non responsive readout after some time. The polarization of redox
electrode could be ascertained by the receipt of proper response from the electrode upon
its cleaning using aqua regia solution. Redox potential measurement using one of the two
plates of the conductivity meter against a Ag/AgCl, sat. KCl has been explored to
overcome the polarization of the redox probe. The application of high frequency
alternating voltage on the electrode by the conductivity meter during the measurement
could effectively overcome the polarization and hence the response for the entire range of
electrolysis has been proper. The two pole conductivity meter applies frequency as per
the conductivity of solution to avoid polarization. Combining the expression for
concentration variation for flow cell under limiting current condition and Nernst
equation, the variation in potential with respect to time can be given as:
𝐸𝑠𝑜𝑙. = 𝐸𝑜′ − 𝑅𝑇 𝑛𝐹 𝑙𝑛 [𝑒𝑝𝑡 − 1] (4.1)
Where, Esol is the redox potential of the solution, Eo’ is the formal potential of the
solution; R, T, n and F are the usual constants of the Nernst equation; t is the time of
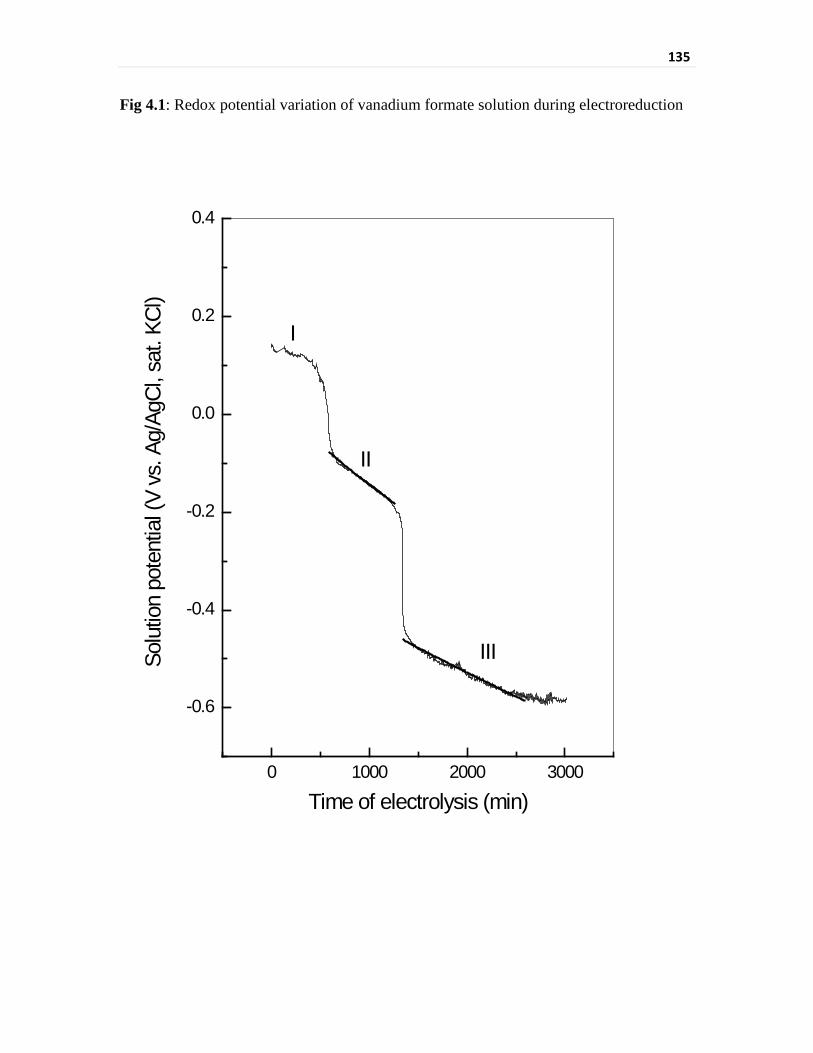
135
Fig 4.1: Redox potential variation of vanadium formate solution during electroreduction
0 1000 2000 3000
-0.6
-0.4
-0.2
0.0
0.2
0.4
Solu
tion
pote
ntia
l (V
vs. A
g/Ag
Cl, s
at. K
Cl)
Time of electrolysis (min)
III
II
I
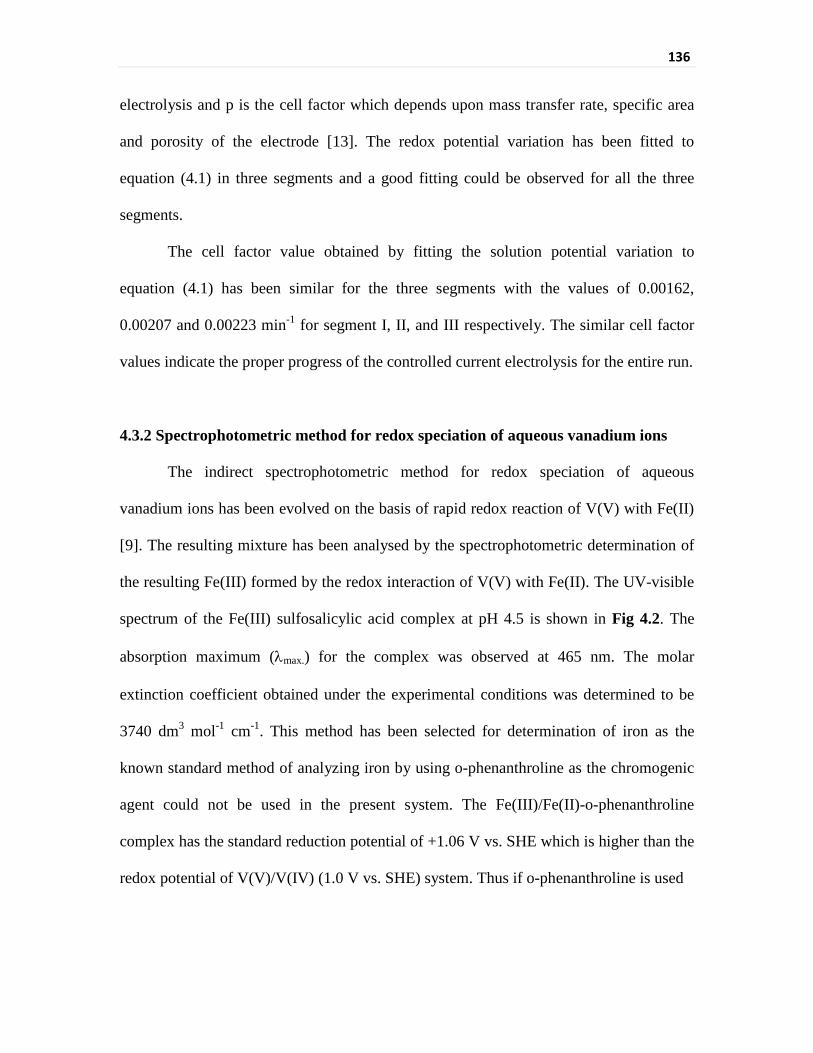
136
electrolysis and p is the cell factor which depends upon mass transfer rate, specific area
and porosity of the electrode [13]. The redox potential variation has been fitted to
equation (4.1) in three segments and a good fitting could be observed for all the three
segments.
The cell factor value obtained by fitting the solution potential variation to
equation (4.1) has been similar for the three segments with the values of 0.00162,
0.00207 and 0.00223 min-1 for segment I, II, and III respectively. The similar cell factor
values indicate the proper progress of the controlled current electrolysis for the entire run.
4.3.2 Spectrophotometric method for redox speciation of aqueous vanadium ions
The indirect spectrophotometric method for redox speciation of aqueous
vanadium ions has been evolved on the basis of rapid redox reaction of V(V) with Fe(II)
[9]. The resulting mixture has been analysed by the spectrophotometric determination of
the resulting Fe(III) formed by the redox interaction of V(V) with Fe(II). The UV-visible
spectrum of the Fe(III) sulfosalicylic acid complex at pH 4.5 is shown in Fig 4.2. The
absorption maximum (λmax.) for the complex was observed at 465 nm. The molar
extinction coefficient obtained under the experimental conditions was determined to be
3740 dm3 mol-1 cm-1. This method has been selected for determination of iron as the
known standard method of analyzing iron by using o-phenanthroline as the chromogenic
agent could not be used in the present system. The Fe(III)/Fe(II)-o-phenanthroline
complex has the standard reduction potential of +1.06 V vs. SHE which is higher than the
redox potential of V(V)/V(IV) (1.0 V vs. SHE) system. Thus if o-phenanthroline is used
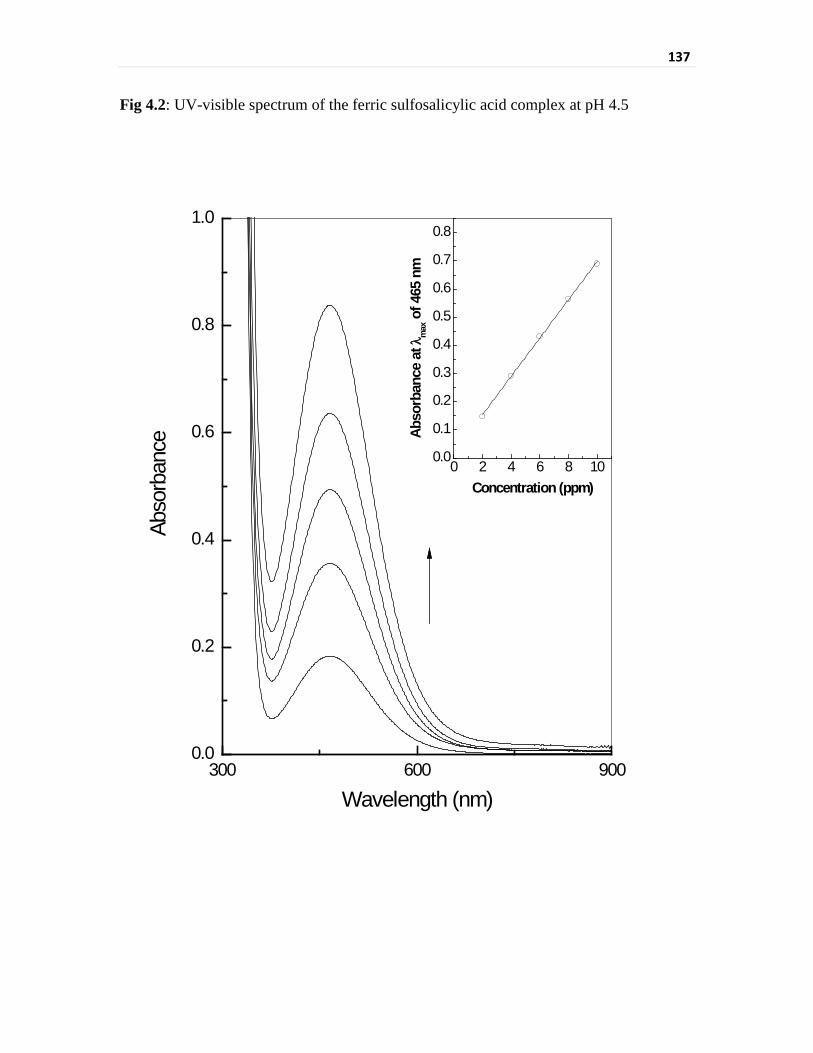
137
Fig 4.2: UV-visible spectrum of the ferric sulfosalicylic acid complex at pH 4.5
300 600 9000.0
0.2
0.4
0.6
0.8
1.0
Abso
rban
ce
Wavelength (nm)
0 2 4 6 8 100.0
0.1
0.2
0.3
0.4
0.5
0.6
0.7
0.8
Abso
rban
ce a
t λm
ax o
f 465
nm
Concentration (ppm)

138
for the analyzing the residual Fe(II), erroneous results will be obtained due to the
oxidation of V(IV) by Fe(III)-o-phenanthroline in the solution. Such an interaction
between Fe(III)-sulfosalicylic acid complex and V(V)/V(IV) solution is not observed.
The analysis procedure was developed in a way where minimum other chemicals
are added to the system to avoid large matrix variations. Hence initial V(V) solution
alone was used for oxidation of all vanadium solutions having different oxidation states
which were formed during the course of electrolysis. The procedure was verified by the
triplicate analysis of the known redox mixtures of vanadium formate which were
prepared by mixing V(II) formate and V(V) formate. The results of the analysis are given
in Tables 4.1 and 4.2.
Table 4.1: Results of analysis of V(III)-V(IV) mixture (triplicate analysis)
Mixture Taken V(III) + V(IV) (mM) V(III) analysed (mM) V(IV) analysed (mM)
5 + 5 4.9 ± 0.13 4.9 ± 0.11 10 + 10 10.01 ± 0.13 9.9 ± 0.06 5 + 10 4.95 ± 0.15 10.1 ±0.05 10 + 5 9.9 ± 0.07 5.1 ± 0.14
Table 4.2: Results of analysis of V(II)-V(III) mixture (triplicate analysis)
Mixture Taken V(II) + V(III) (mM) V(II) analysed (mM) V(III) analysed (mM)
5 + 5 5.52 ± 0.29 5.1 ± 0.18 10 + 10 9.74 ± 0.04 10.2 ± 0.09 5 + 10 4.94 ± 0.38 10.1 ± 0.08 10 + 5 10.3 ± 0.02 5.1 ± 0.11

139
This method has been found to have no interference from the excess V(IV) in solution.
Any change in absorbance values could not be seen even upon adding 10 mM
concentration of V(IV) in the analysis solution which is about 50 times the concentration
of the V(IV) normally expected in the analysis solution. Also, the interference from
manganese (Mn2+) has also been checked. Any interference of Mn2+ in the Fe(III)
slfosalicylic acid spectrophotometric determination could not be observed.
Thus, this method could be used to assess the progress of electrolysis during the
preparation of V(II) formate. The variation in concentration of the various aqueous
vanadium redox species during the electrolysis of V(V) formate solution is shown in Fig
4.3. The change in concentration could be seen to closely follow the redox potential
variation as shown in Fig 4.1. Thus, this indirect spectrophotometric method is a useful
and rapid method of analyzing various redox mixtures of vanadium species in an aqueous
medium.
4.3.2 Direct spectrophotometric determination of aqueous V(III)/V(II) redox couple
Aqueous V(III) and V(II) ions have relatively sharp absorbance peaks as
compared to V(IV) or V(V) and hence the direct spectrophotometric determination of
these species has been evaluated. The spectral behaviour of V(II) and V(III) formate is
shown in Fig 4.4. V(II) formate has shown two peaks, one at 562 nm and other at 843 nm
while V(III) formate has shown a peak at 591 nm and a hump around 420 nm. The
calibration plot for these peak absorbance values is shown in Fig 4.5. The absorbance
values have shown a good linear fitting with the slope of 0.00727 and 0.0854 for V(II) at
562 and 842 nm respectively while a slope of 0.03225 was obtained for V(III) at 591 nm.

140
Fig 4.3: Variation in the concentration of various vanadium redox species during
controlled current electroreduction of V(V)
0 1000 2000 3000
-20
0
20
40
60
80
100
120
140
Conc
entra
tion
of v
anad
ium
ion
(mM
)
Time (Min.)
V(V) V(IV) V(III) V(II)
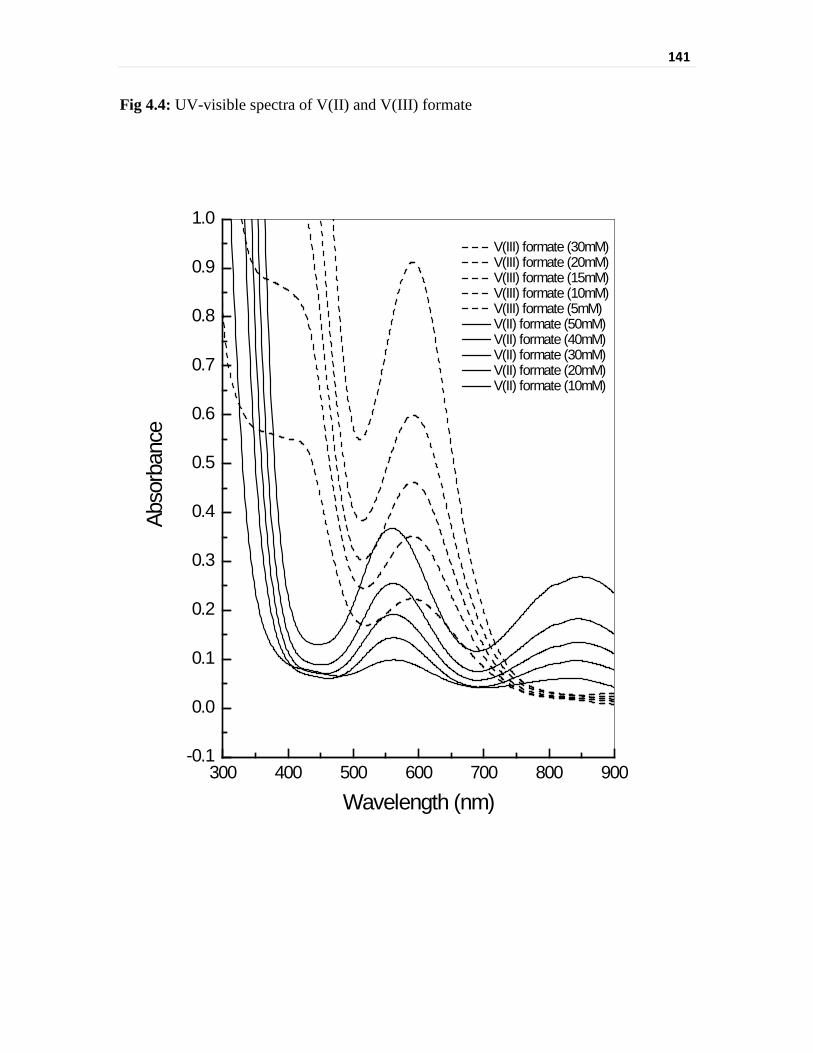
141
Fig 4.4: UV-visible spectra of V(II) and V(III) formate
300 400 500 600 700 800 900-0.1
0.0
0.1
0.2
0.3
0.4
0.5
0.6
0.7
0.8
0.9
1.0
Abso
rban
ce
Wavelength (nm)
V(III) formate (30mM) V(III) formate (20mM) V(III) formate (15mM) V(III) formate (10mM) V(III) formate (5mM) V(II) formate (50mM) V(II) formate (40mM) V(II) formate (30mM) V(II) formate (20mM) V(II) formate (10mM)
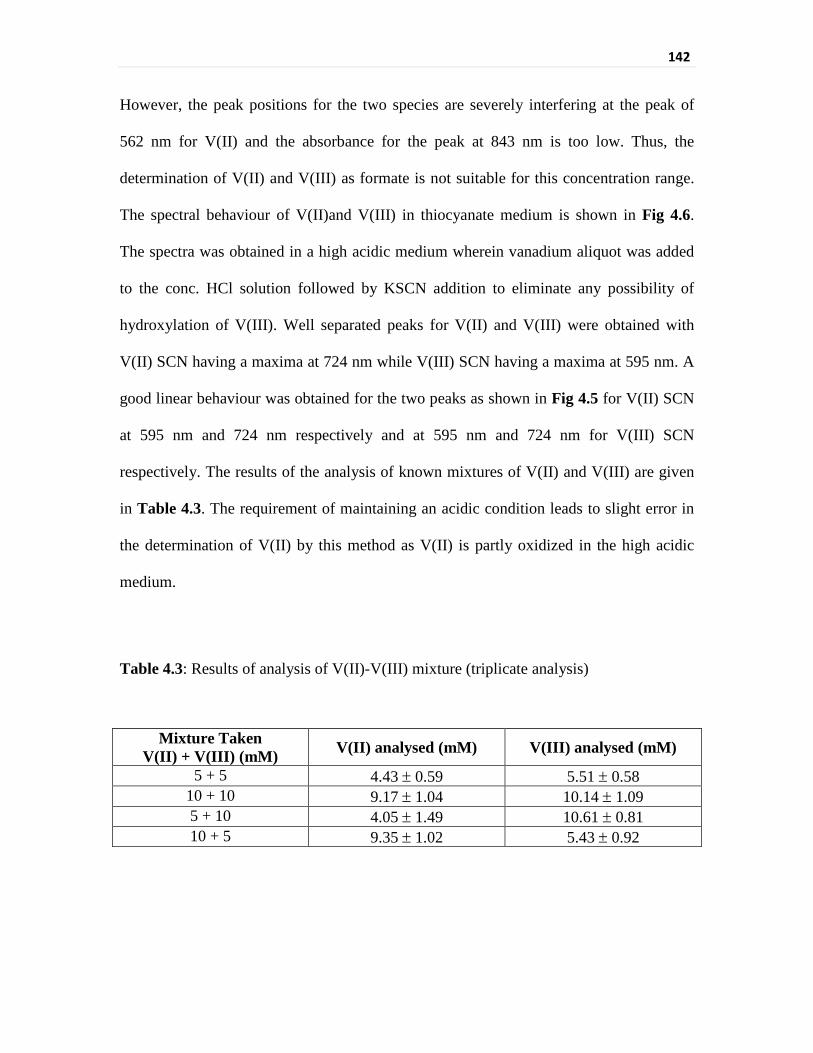
142
However, the peak positions for the two species are severely interfering at the peak of
562 nm for V(II) and the absorbance for the peak at 843 nm is too low. Thus, the
determination of V(II) and V(III) as formate is not suitable for this concentration range.
The spectral behaviour of V(II)and V(III) in thiocyanate medium is shown in Fig 4.6.
The spectra was obtained in a high acidic medium wherein vanadium aliquot was added
to the conc. HCl solution followed by KSCN addition to eliminate any possibility of
hydroxylation of V(III). Well separated peaks for V(II) and V(III) were obtained with
V(II) SCN having a maxima at 724 nm while V(III) SCN having a maxima at 595 nm. A
good linear behaviour was obtained for the two peaks as shown in Fig 4.5 for V(II) SCN
at 595 nm and 724 nm respectively and at 595 nm and 724 nm for V(III) SCN
respectively. The results of the analysis of known mixtures of V(II) and V(III) are given
in Table 4.3. The requirement of maintaining an acidic condition leads to slight error in
the determination of V(II) by this method as V(II) is partly oxidized in the high acidic
medium.
Table 4.3: Results of analysis of V(II)-V(III) mixture (triplicate analysis)
Mixture Taken V(II) + V(III) (mM) V(II) analysed (mM) V(III) analysed (mM)
5 + 5 4.43 ± 0.59 5.51 ± 0.58 10 + 10 9.17 ± 1.04 10.14 ± 1.09 5 + 10 4.05 ± 1.49 10.61 ± 0.81 10 + 5 9.35 ± 1.02 5.43 ± 0.92

143
Fig 4.5: Calibration plots of various V(II) and V(III) species
0 10 20 30 40 500.0
0.2
0.4
0.6
0.8
1.0
V(II) formate@562nm V(II) formate@843nm V(III) formate@591nm V(III) SCN@724nm V(II) SCN@595nm V(III) SCN@595nm V(II) SCN@724nm
Abso
rban
ce
Concentration(mM)

144
Fig 4.6: UV-visible spectra of V(II) and V(III) thiocynate
300 400 500 600 700 800 900-0.1
0.0
0.1
0.2
0.3
0.4
0.5
0.6
0.7
0.8
0.9
1.0
1.1
1.2
1.3
1.4
1.5
Abso
rban
ce
Wavelength (nm)
V(III) SCN (25 mM) V(III) SCN (20 mM) V(III) SCN (15 mM) V(III) SCN (10 mM) V(III) SCN (5 mM) V(II) SCN (10 mM) V(II) SCN (8 mM) V(II) SCN (6 mM) V(II) SCN (4 mM) V(II) SCN (2 mM)
145
Summary
The on line monitoring methodology for electrolytic synthesis of low oxidation state
of vanadium by solution potential monitoring with AC impressed probe has been
developed. A simple and rapid redox speciation methodology for aqueous vanadium ions
solutions of all possible oxidation states has been developed. It is an indirect
spectrophotometric method based on the redox interaction of ferrous with V(V) and the
subsequent analysis of the ferric sulfosalicylic acid complex. A direct spectrophotometric
method for evaluating V(III)/V(II) mixture based on analyzing the thiocyanate complex
has also been studied.
4.4 References
[1] E. L. Martin and K. E. Bentley, Anal. Chem., 34 (1962) 354.
[2] C. J. Wood, Progress in Nuclear Energy, 23 (1990) 35.
[3] M. J. C. Taylor and J. F. van Staden, Analyst, 119 (1994) 1263.
[4] C. Agarwal, M. K. Deb, R. K. Mishra, Analytical Letters, 23 (1990) 2063.
[5] S. A. Abbasi, Analytical Letters, 9 (1976) 113.
[6] M. R. Shishehbore and R. Jokar, Anal. Methods, 3 (2011) 2815.
[7] W. R. King, and C. S. Garner, J. Phys. Chem., 58 (1954) 29.
[8] C. L. Rulfs, J. J. Lagowski, and R. E. Bahor, Anal. Chem., 28 (1956) 84.
[9] H. Willard and P. Young, Ind. Eng. Chem., 6 (1934) 48.
[10] K. Ogawa and N. Tobe, Bull. Chem. Soc. Japan, 39 (1996) 223.
[11] D. G. Karamanev, L. N. Nikolov, V. Mamatarkova, Minerals Engineering, 15 (2002) 341.
[12] V. S. Tripathi, J. Manjanna, G. Venkateswaran, B. K. Gokhale and V. Balaji, Ind. Eng.
Chem. Res., 43 (2004) 5989.
[13] A. J. Bard and L. R. Faulkner, Electrochemical Methods Fundamentals and Applications:
Second Edition, John Wiley & Sons, Inc., 2001, pp 445.
146
CHAPTER-5
Chromate Sorption over Magnetite in Presence of Gamma Irradiation
5.1 Introduction
Aqueous chromate removal on various iron oxides has been evaluated in several
studies [1, 2]. Chromate has been in use as a corrosion inhibitor for various applications
where iron based alloys are used [3]. In the shutdown cooling heat exchanger (closed
system) in reactor systems such as BWRs, chromate is still in use as the corrosion
inhibitor. Under certain operational conditions this chromate can come into primary
coolant recirculation circuit and can interact with the magnetite bearing surface of the
structural materials. Here, the presence of ionizing radiation will be an important
parameter to be accounted for the interaction of chromate with magnetite. Structural
modification of the oxide surface of the recirculation system due to concomitant presence
of chromate and irradiation is of immense importance. Presence of chromium bearing
outer oxide surface has various important implications. One of the important implications
of the chromium bearing oxide surface is modification in the chemical formulation to be
employed for decontamination of the recirculation system. The effect of radiation on the
dissolution formulations has been studied by several authors [4, 5] but the effect of
irradiation on oxide modification in concomitant presence of a particular chemical
species which can alter the nature of the required dissolution formulation has not been
reported so far. Immobilization of carcinogenic chromate using ferrous containing
substrates has been evaluated by several authors [6-8]. Magnetite is one of the feasible

147
substrates reported for the purpose. However, concomitant presence of irradiation has not
been investigated so far. Although effect of γ-irradiation on solids have been studied
extensively [9-12], the effect of irradiation on this heterogeneous chemical interaction has
not yet been reported. Chromate interaction with magnetite in the presence of gamma
irradiation has been studied and compared with the corresponding isothermal interaction.
5.2 Experimental
Magnetite was prepared through the hydrothermal route by heating Fe(OH)2
under nitrogen atmosphere at 600 oC [13, 14]. Magnetite was equilibrated with potassium
dichromate solutions at different temperatures viz. 40, 60 and 80 oC, at a given surface
area to volume ratio and also irradiated at different absorbed doses in the range of 20 -
1000 kGy using a 60Co source. For isothermal experiments at different temperatures, 50
ml of 2 mM chromate solution was equilibrated with 1.0 g of magnetite whereas for
gamma irradiation studies, 25 ml of 2.0 mM chromate solution was equilibrated with 0.5
g of magnetite at each dose. Kinetics of chromate reduction was followed for the
equilibration experiments at different temperatures. Irradiation experiments were also
carried out in the presence of nitrous oxide. At the end of the equilibration experiments
the oxides were recovered and were characterized by XRD and XPS. For XPS analysis,
the dried powder samples were pressed on Indium foil and were loaded in the fast entry
chamber, and shifted to the analysis chamber after half an hour. The drying process is
natural and as these materials are very stable in ambient atmosphere, no change is
expected. Excitation source was non-monochromatic Al kα with energy 1486.6 eV. The
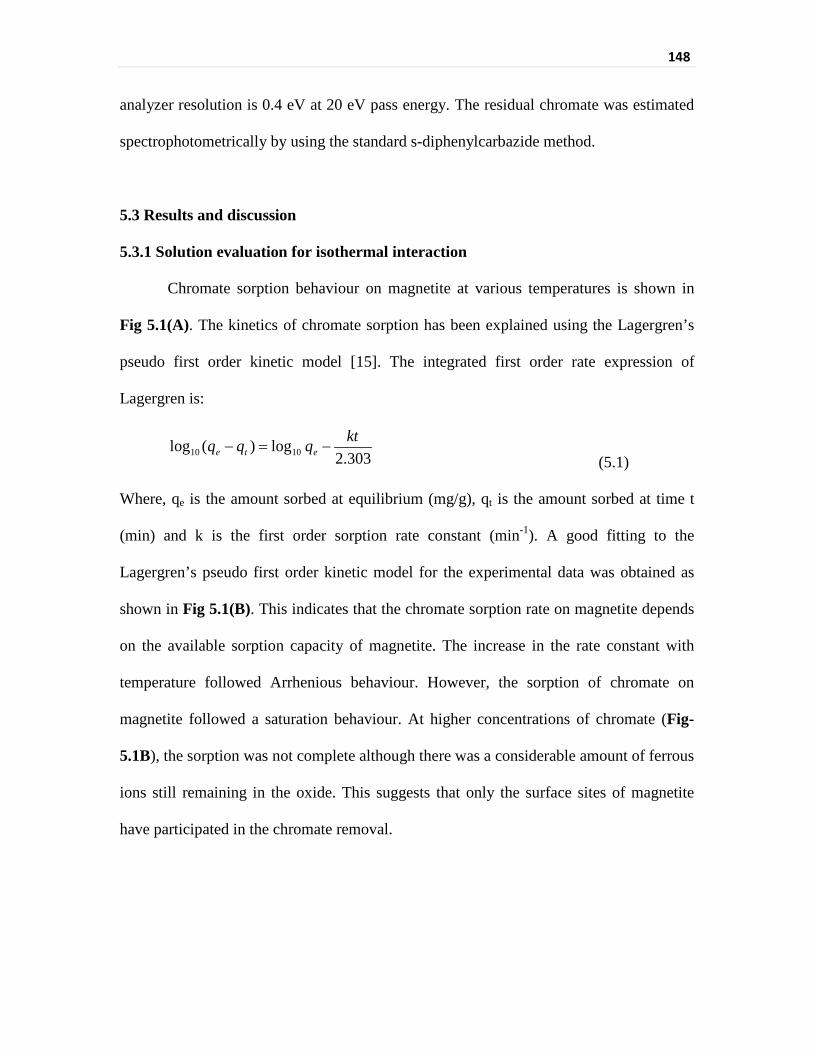
148
analyzer resolution is 0.4 eV at 20 eV pass energy. The residual chromate was estimated
spectrophotometrically by using the standard s-diphenylcarbazide method.
5.3 Results and discussion
5.3.1 Solution evaluation for isothermal interaction
Chromate sorption behaviour on magnetite at various temperatures is shown in
Fig 5.1(A). The kinetics of chromate sorption has been explained using the Lagergren’s
pseudo first order kinetic model [15]. The integrated first order rate expression of
Lagergren is:
(5.1)
Where, qe is the amount sorbed at equilibrium (mg/g), qt is the amount sorbed at time t
(min) and k is the first order sorption rate constant (min-1). A good fitting to the
Lagergren’s pseudo first order kinetic model for the experimental data was obtained as
shown in Fig 5.1(B). This indicates that the chromate sorption rate on magnetite depends
on the available sorption capacity of magnetite. The increase in the rate constant with
temperature followed Arrhenious behaviour. However, the sorption of chromate on
magnetite followed a saturation behaviour. At higher concentrations of chromate (Fig-
5.1B), the sorption was not complete although there was a considerable amount of ferrous
ions still remaining in the oxide. This suggests that only the surface sites of magnetite
have participated in the chromate removal.
303.2log)(log 1010
ktqqq ete −=−

149
Fig 5.1: (A) Chromate removal on magnetite with varying temperature (50 ml of 2 mM
chromate solution equilibrated with 1.0 g of magnetite) (B) Lagergren’s pseudo first
order kinetic model fitting for sorption of 50 ml of 10 mM chromate on 1 g of magnetite
0 50 100 150 200 2500.0
0.5
1.0
1.5
2.0
3.6
3.7
3.8
3.9
4.0
4.1
4.2
4.3
4.4
0 50 100 150 200 250
40 oC 60 oC 80 oC
Chro
mat
e re
mov
ed (m
M)
Time (min)
A
Log
(qe-q
t)
B
Time (min)
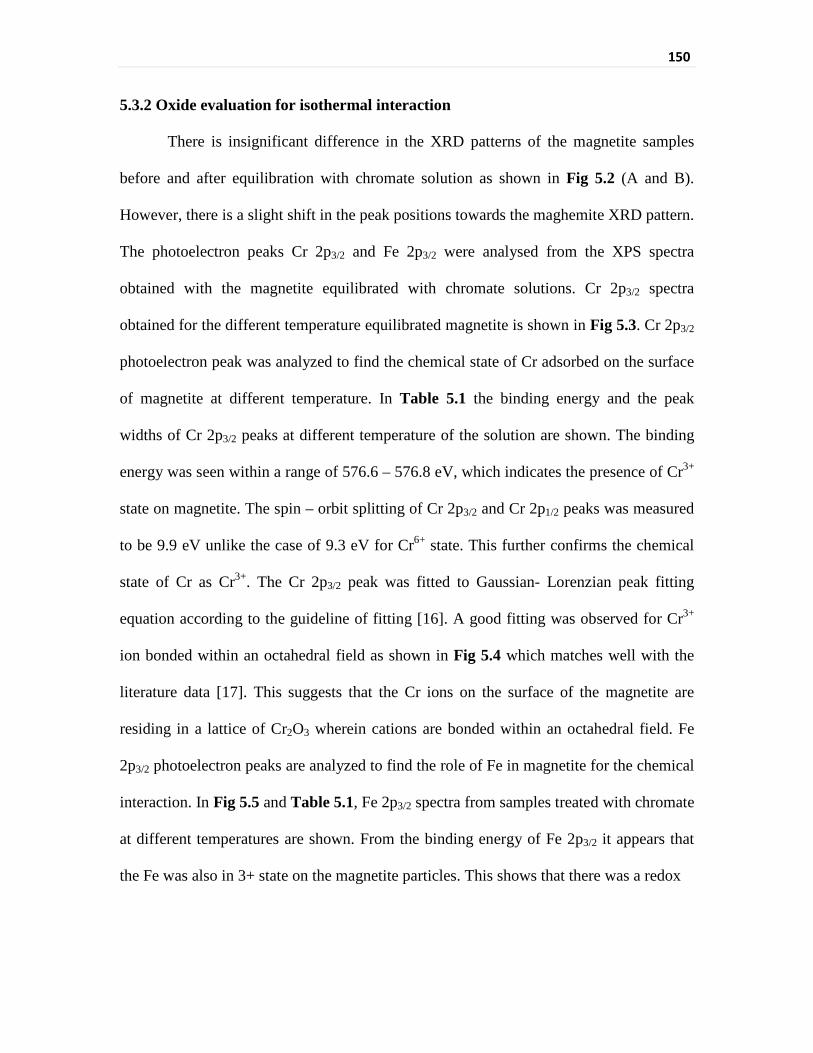
150
5.3.2 Oxide evaluation for isothermal interaction
There is insignificant difference in the XRD patterns of the magnetite samples
before and after equilibration with chromate solution as shown in Fig 5.2 (A and B).
However, there is a slight shift in the peak positions towards the maghemite XRD pattern.
The photoelectron peaks Cr 2p3/2 and Fe 2p3/2 were analysed from the XPS spectra
obtained with the magnetite equilibrated with chromate solutions. Cr 2p3/2 spectra
obtained for the different temperature equilibrated magnetite is shown in Fig 5.3. Cr 2p3/2
photoelectron peak was analyzed to find the chemical state of Cr adsorbed on the surface
of magnetite at different temperature. In Table 5.1 the binding energy and the peak
widths of Cr 2p3/2 peaks at different temperature of the solution are shown. The binding
energy was seen within a range of 576.6 – 576.8 eV, which indicates the presence of Cr3+
state on magnetite. The spin – orbit splitting of Cr 2p3/2 and Cr 2p1/2 peaks was measured
to be 9.9 eV unlike the case of 9.3 eV for Cr6+ state. This further confirms the chemical
state of Cr as Cr3+. The Cr 2p3/2 peak was fitted to Gaussian- Lorenzian peak fitting
equation according to the guideline of fitting [16]. A good fitting was observed for Cr3+
ion bonded within an octahedral field as shown in Fig 5.4 which matches well with the
literature data [17]. This suggests that the Cr ions on the surface of the magnetite are
residing in a lattice of Cr2O3 wherein cations are bonded within an octahedral field. Fe
2p3/2 photoelectron peaks are analyzed to find the role of Fe in magnetite for the chemical
interaction. In Fig 5.5 and Table 5.1, Fe 2p3/2 spectra from samples treated with chromate
at different temperatures are shown. From the binding energy of Fe 2p3/2 it appears that
the Fe was also in 3+ state on the magnetite particles. This shows that there was a redox

151
Fig 5.2: XRD pattern of (A) pure magnetite, (B) magnetite treated with chromate at 60 oC
and (C) magnetite treated with chromate at 350 KGy gamma dose.
0 10 20 30 40 50 60 70 80 90
0
20
40
60
80
1000 10 20 30 40 50 60 70 80 90
020406080
100120140160
0 10 20 30 40 50 60 70 80 90
020406080
100
Angle (2θ)
A
Inte
nsity
(arb
uni
ts)
B
C
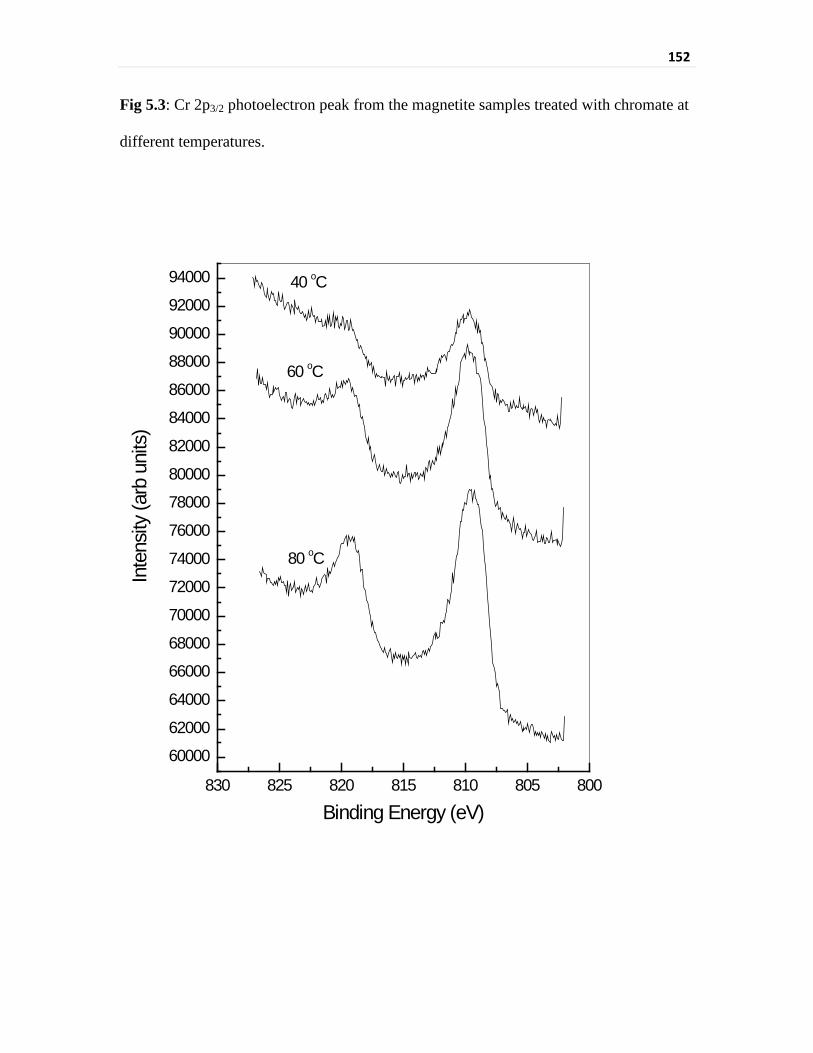
152
Fig 5.3: Cr 2p3/2 photoelectron peak from the magnetite samples treated with chromate at
different temperatures.
830 825 820 815 810 805 800
60000
62000
64000
66000
68000
70000
72000
74000
76000
78000
80000
82000
84000
86000
88000
90000
92000
94000
Inte
nsity
(arb
uni
ts)
Binding Energy (eV)
40 oC
60 oC
80 oC
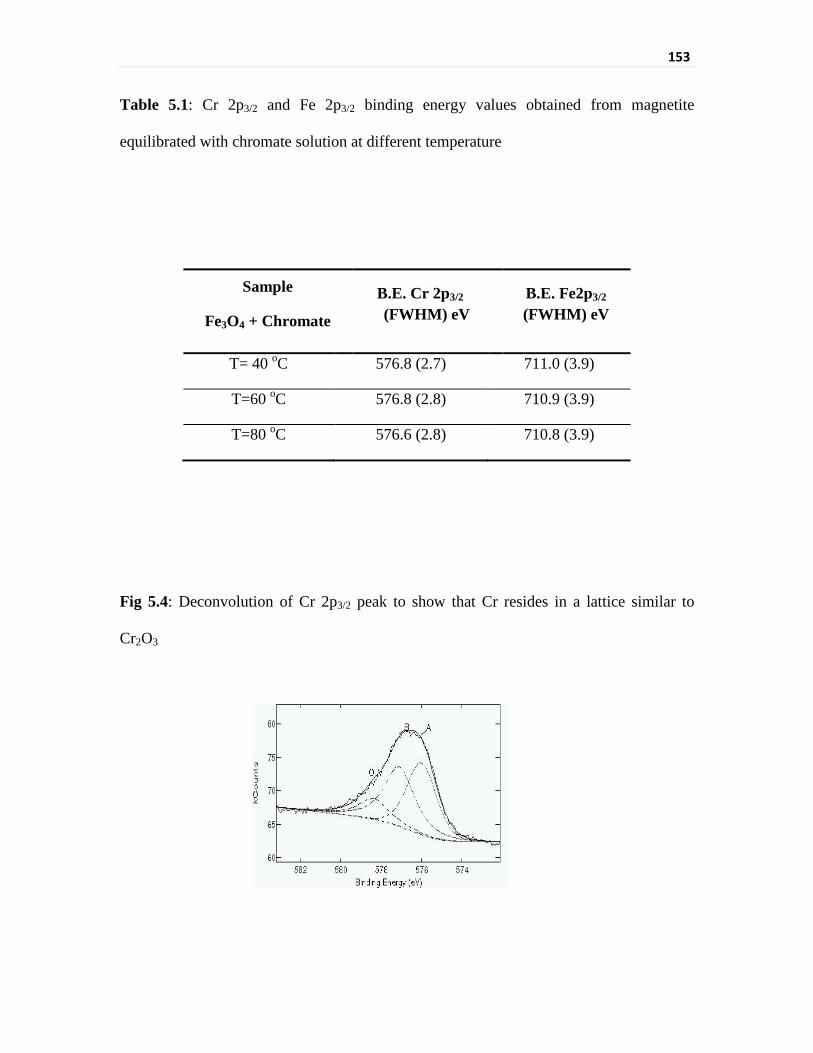
153
Table 5.1: Cr 2p3/2 and Fe 2p3/2 binding energy values obtained from magnetite
equilibrated with chromate solution at different temperature
Fig 5.4: Deconvolution of Cr 2p3/2 peak to show that Cr resides in a lattice similar to
Cr2O3
Sample
Fe3O4 + Chromate
B.E. Cr 2p3/2 (FWHM) eV
B.E. Fe2p3/2 (FWHM) eV
T= 40 oC 576.8 (2.7) 711.0 (3.9)
T=60 oC 576.8 (2.8) 710.9 (3.9)
T=80 oC 576.6 (2.8) 710.8 (3.9)

154
Fig 5.5: Fe 2p photoelectron peak from the magnetite samples treated with chromate at
different temperature
740 730 720 710 700140000
160000
180000
200000
220000
240000
260000
Inte
nsity
(arb
uni
ts)
Binding Energy (eV)
40 oC
60 oC
80 oC
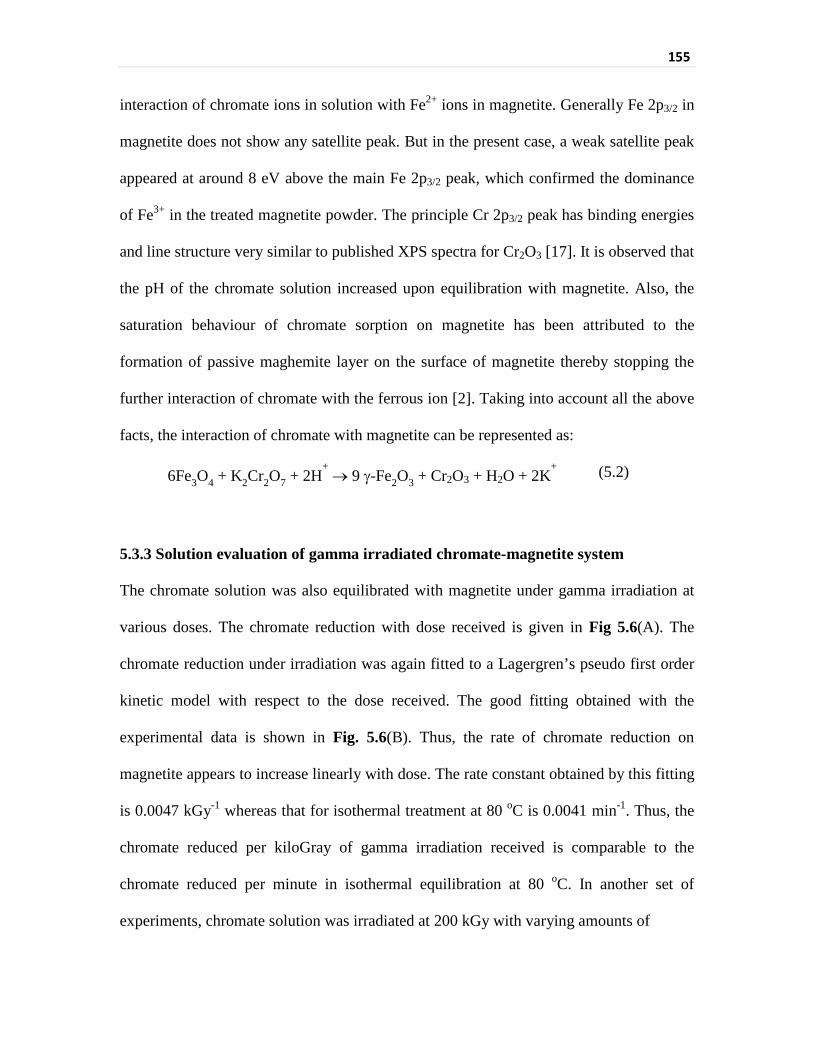
155
interaction of chromate ions in solution with Fe2+ ions in magnetite. Generally Fe 2p3/2 in
magnetite does not show any satellite peak. But in the present case, a weak satellite peak
appeared at around 8 eV above the main Fe 2p3/2 peak, which confirmed the dominance
of Fe3+ in the treated magnetite powder. The principle Cr 2p3/2 peak has binding energies
and line structure very similar to published XPS spectra for Cr2O3 [17]. It is observed that
the pH of the chromate solution increased upon equilibration with magnetite. Also, the
saturation behaviour of chromate sorption on magnetite has been attributed to the
formation of passive maghemite layer on the surface of magnetite thereby stopping the
further interaction of chromate with the ferrous ion [2]. Taking into account all the above
facts, the interaction of chromate with magnetite can be represented as:
6Fe3O4 + K2Cr2O7 + 2H+ → 9 γ-Fe2O3 + Cr2O3 + H2O + 2K
+ (5.2)
5.3.3 Solution evaluation of gamma irradiated chromate-magnetite system
The chromate solution was also equilibrated with magnetite under gamma irradiation at
various doses. The chromate reduction with dose received is given in Fig 5.6(A). The
chromate reduction under irradiation was again fitted to a Lagergren’s pseudo first order
kinetic model with respect to the dose received. The good fitting obtained with the
experimental data is shown in Fig. 5.6(B). Thus, the rate of chromate reduction on
magnetite appears to increase linearly with dose. The rate constant obtained by this fitting
is 0.0047 kGy-1 whereas that for isothermal treatment at 80 oC is 0.0041 min-1. Thus, the
chromate reduced per kiloGray of gamma irradiation received is comparable to the
chromate reduced per minute in isothermal equilibration at 80 oC. In another set of
experiments, chromate solution was irradiated at 200 kGy with varying amounts of
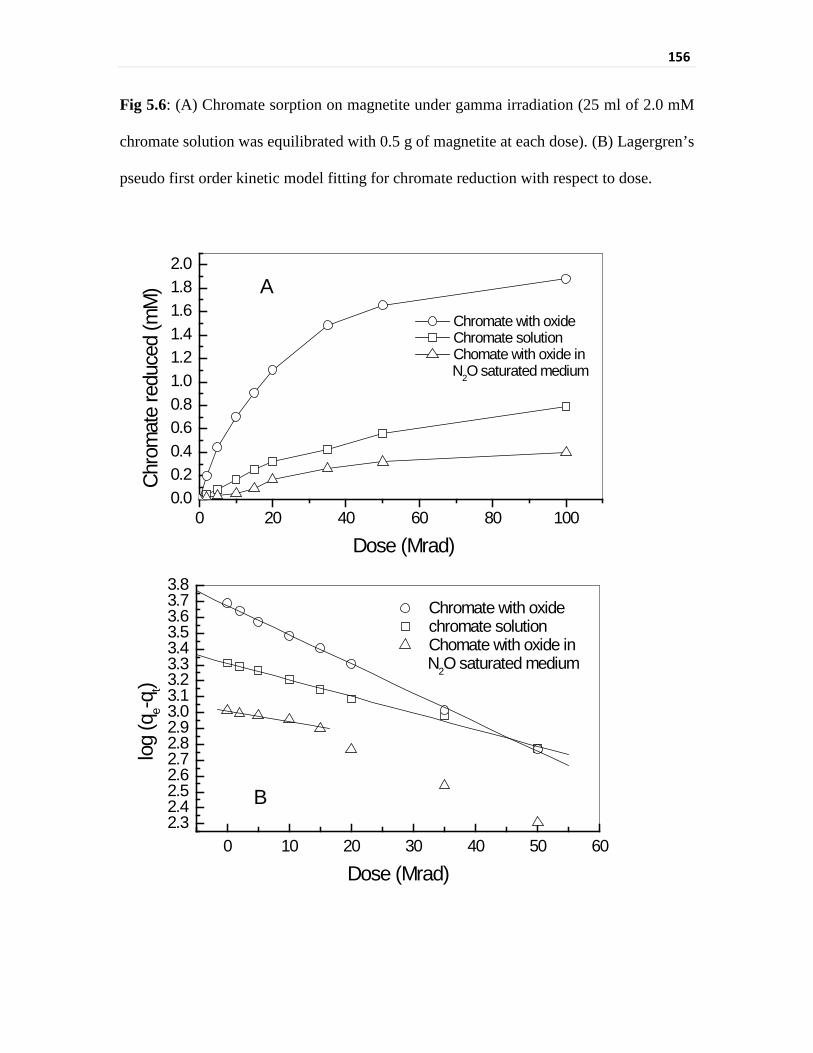
156
Fig 5.6: (A) Chromate sorption on magnetite under gamma irradiation (25 ml of 2.0 mM
chromate solution was equilibrated with 0.5 g of magnetite at each dose). (B) Lagergren’s
pseudo first order kinetic model fitting for chromate reduction with respect to dose.
0 20 40 60 80 1000.00.20.40.60.81.01.21.41.61.82.0
0 10 20 30 40 50 602.32.42.52.62.72.82.93.03.13.23.33.43.53.63.73.8
Chro
mat
e re
duce
d (m
M)
Dose (Mrad)
Chromate with oxide Chromate solution Chomate with oxide in
N2O saturated medium
A
Chromate with oxide chromate solution Chomate with oxide in
N2O saturated medium
log
(qe-q
t)
Dose (Mrad)
B
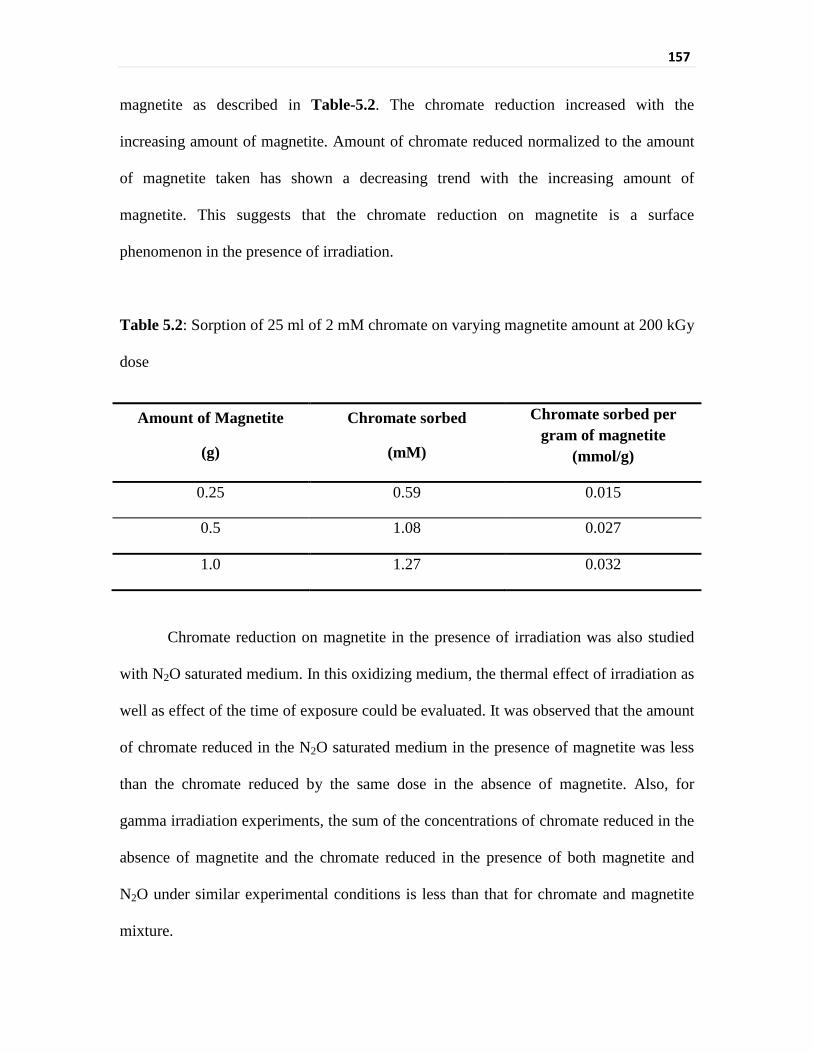
157
magnetite as described in Table-5.2. The chromate reduction increased with the
increasing amount of magnetite. Amount of chromate reduced normalized to the amount
of magnetite taken has shown a decreasing trend with the increasing amount of
magnetite. This suggests that the chromate reduction on magnetite is a surface
phenomenon in the presence of irradiation.
Table 5.2: Sorption of 25 ml of 2 mM chromate on varying magnetite amount at 200 kGy
dose
Amount of Magnetite
(g)
Chromate sorbed
(mM)
Chromate sorbed per gram of magnetite
(mmol/g)
0.25 0.59 0.015
0.5 1.08 0.027
1.0 1.27 0.032
Chromate reduction on magnetite in the presence of irradiation was also studied
with N2O saturated medium. In this oxidizing medium, the thermal effect of irradiation as
well as effect of the time of exposure could be evaluated. It was observed that the amount
of chromate reduced in the N2O saturated medium in the presence of magnetite was less
than the chromate reduced by the same dose in the absence of magnetite. Also, for
gamma irradiation experiments, the sum of the concentrations of chromate reduced in the
absence of magnetite and the chromate reduced in the presence of both magnetite and
N2O under similar experimental conditions is less than that for chromate and magnetite
mixture.
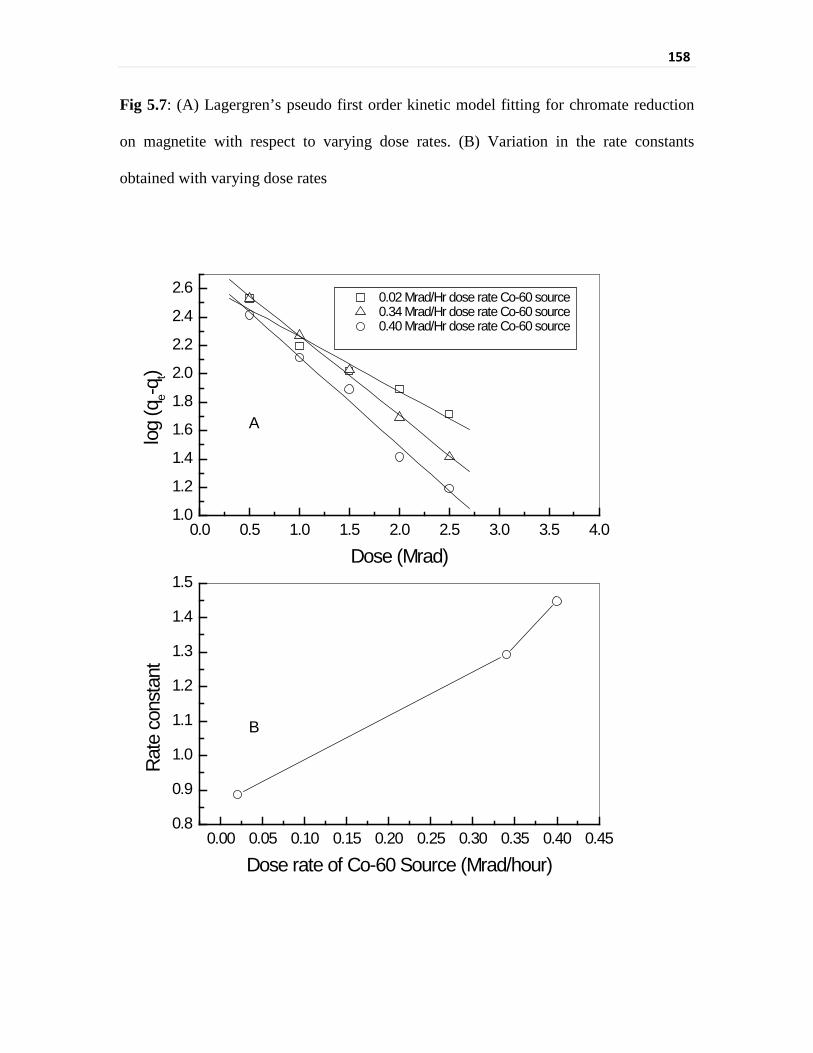
158
Fig 5.7: (A) Lagergren’s pseudo first order kinetic model fitting for chromate reduction
on magnetite with respect to varying dose rates. (B) Variation in the rate constants
obtained with varying dose rates
0.00 0.05 0.10 0.15 0.20 0.25 0.30 0.35 0.40 0.450.8
0.9
1.0
1.1
1.2
1.3
1.4
1.5
0.0 0.5 1.0 1.5 2.0 2.5 3.0 3.5 4.01.0
1.2
1.4
1.6
1.8
2.0
2.2
2.4
2.6
Rate
con
stan
t
Dose rate of Co-60 Source (Mrad/hour)
B
0.02 Mrad/Hr dose rate Co-60 source 0.34 Mrad/Hr dose rate Co-60 source 0.40 Mrad/Hr dose rate Co-60 source
log
(qe-q
t)
Dose (Mrad)
A

159
Thus, the cumulative effect of irradiation in the absence of magnetite and irradiation in
oxidizing condition on chromate reduction is less than that in presence of magnetite in
neutral aqueous environment. This indicates that the gamma irradiation has an effect on
both chromate and magnetite surface. The effect of irradiation on the oxide surface can
be attributed to formation of additional nucleation centers [18] which will enhance the
heterogeneous redox interaction. Chromate reduction on the magnetite surface was also
studied using different Co-60 gamma sources having different dose rates. The chromate-
magnetite systems were exposed to same overall accumulated doses in all the gamma
sources. The pseudo first order fitting of the experimental data is shown in Fig 5.7(A).
The values of the rate constants obtained by the fitting of the experimental data to the
Lagergren’s pseudo first order kinetic model have shown direct dependence on the dose
rates of the source as shown in Fig 5.7(B). The rate constants increased with the increase
in the dose rate of the source. This shows that the chromate reduction on magnetite
directly depends upon the water radiolysis. At higher dose rates, the concentration of the
radiolytic products is more and hence a higher rate constant value is obtained indicating a
faster reduction process.
5.3.4 Oxide evaluation of gamma irradiated chromate-magnetite system
Fig 5.8 and Table 5.3 show the Cr 2p3/2 photoelectron peak and their binding
energy under different radiation dose of chromate treatment with magnetite. Chromium
was found to increase with the radiation dose as shown in Fig 5.8. The binding energy of
Cr 2p3/2 showed the presence of Cr3+ on magnetite after the treatment. In the irradiated
case,
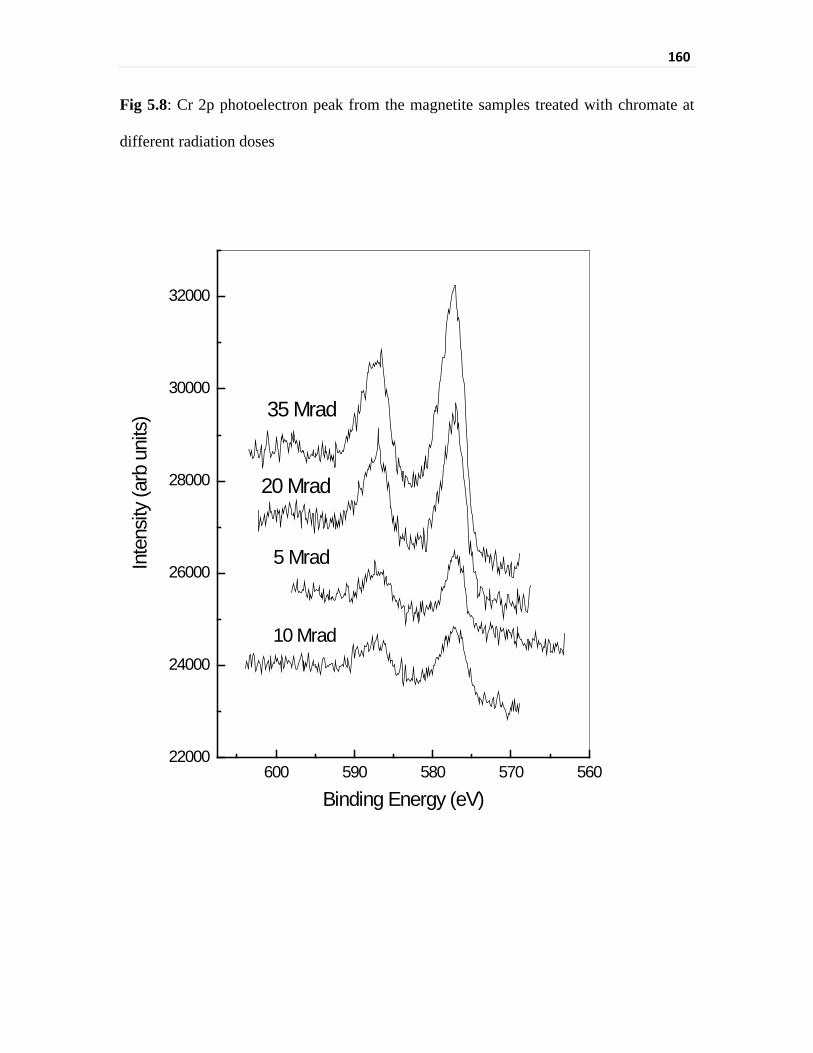
160
Fig 5.8: Cr 2p photoelectron peak from the magnetite samples treated with chromate at
different radiation doses
600 590 580 570 56022000
24000
26000
28000
30000
32000
10 Mrad
5 Mrad
20 Mrad
Inte
nsity
(arb
uni
ts)
Binding Energy (eV)
35 Mrad
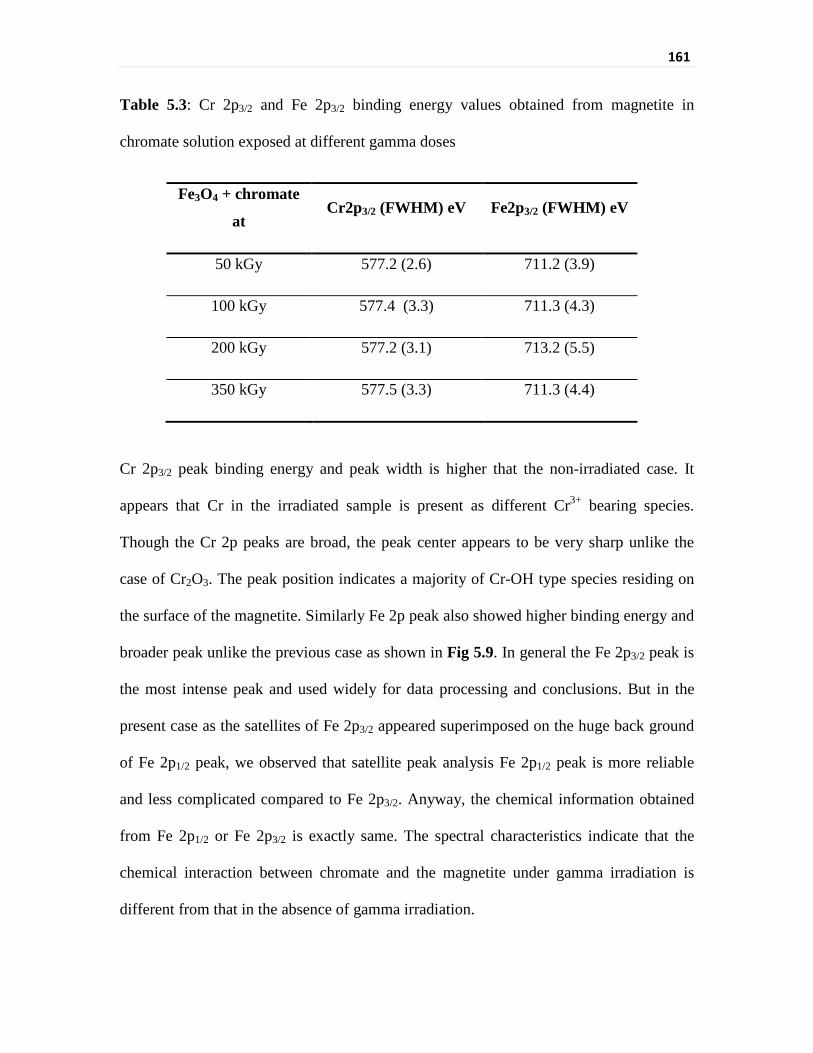
161
Table 5.3: Cr 2p3/2 and Fe 2p3/2 binding energy values obtained from magnetite in
chromate solution exposed at different gamma doses
Fe3O4 + chromate
at Cr2p3/2 (FWHM) eV Fe2p3/2 (FWHM) eV
50 kGy 577.2 (2.6) 711.2 (3.9)
100 kGy 577.4 (3.3) 711.3 (4.3)
200 kGy 577.2 (3.1) 713.2 (5.5)
350 kGy 577.5 (3.3) 711.3 (4.4)
Cr 2p3/2 peak binding energy and peak width is higher that the non-irradiated case. It
appears that Cr in the irradiated sample is present as different Cr3+ bearing species.
Though the Cr 2p peaks are broad, the peak center appears to be very sharp unlike the
case of Cr2O3. The peak position indicates a majority of Cr-OH type species residing on
the surface of the magnetite. Similarly Fe 2p peak also showed higher binding energy and
broader peak unlike the previous case as shown in Fig 5.9. In general the Fe 2p3/2 peak is
the most intense peak and used widely for data processing and conclusions. But in the
present case as the satellites of Fe 2p3/2 appeared superimposed on the huge back ground
of Fe 2p1/2 peak, we observed that satellite peak analysis Fe 2p1/2 peak is more reliable
and less complicated compared to Fe 2p3/2. Anyway, the chemical information obtained
from Fe 2p1/2 or Fe 2p3/2 is exactly same. The spectral characteristics indicate that the
chemical interaction between chromate and the magnetite under gamma irradiation is
different from that in the absence of gamma irradiation.
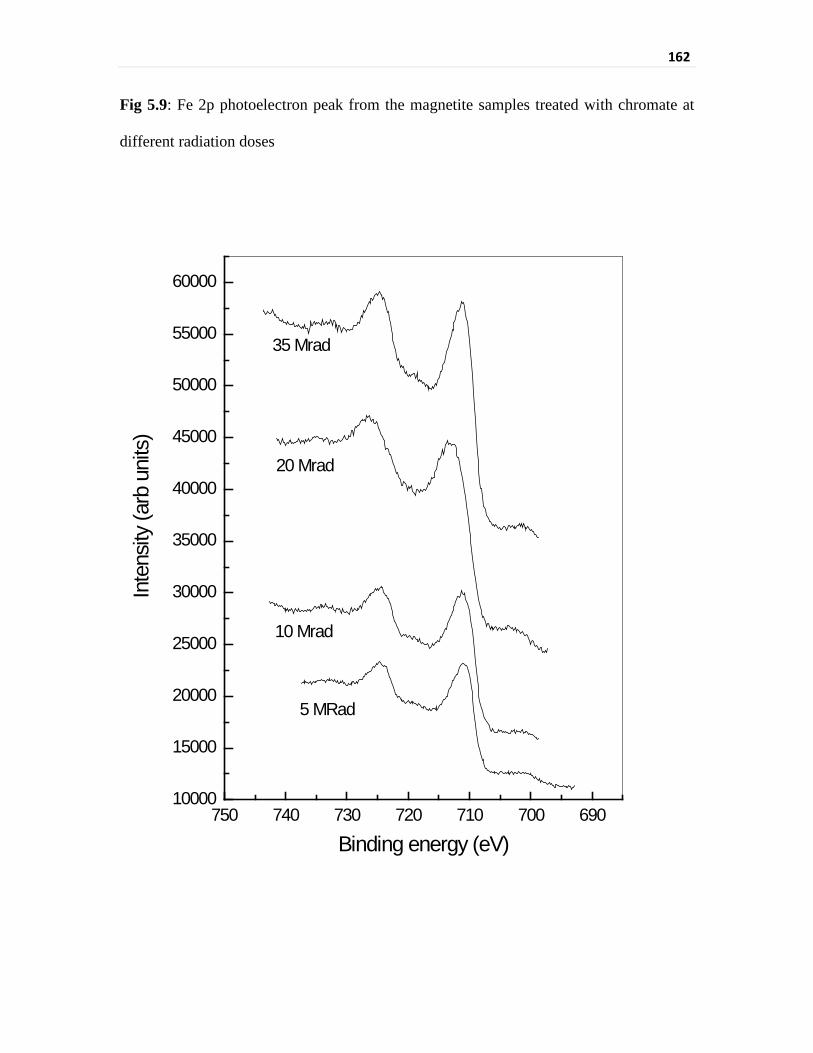
162
Fig 5.9: Fe 2p photoelectron peak from the magnetite samples treated with chromate at
different radiation doses
750 740 730 720 710 700 69010000
15000
20000
25000
30000
35000
40000
45000
50000
55000
60000
35 Mrad
20 Mrad
10 Mrad
Inte
nsity
(arb
uni
ts)
Binding energy (eV)
5 MRad

163
Fig 5.10: O1s photoelectron spectra for magnetite equilibrated with chromate under
different conditions
550 545 540 535 530 525 520
5000
10000
15000
20000
25000
30000
20 Mrad
80oC
Inte
nsity
(arb
uni
ts)
Binding Energy (eV)
40oC
35 Mrad
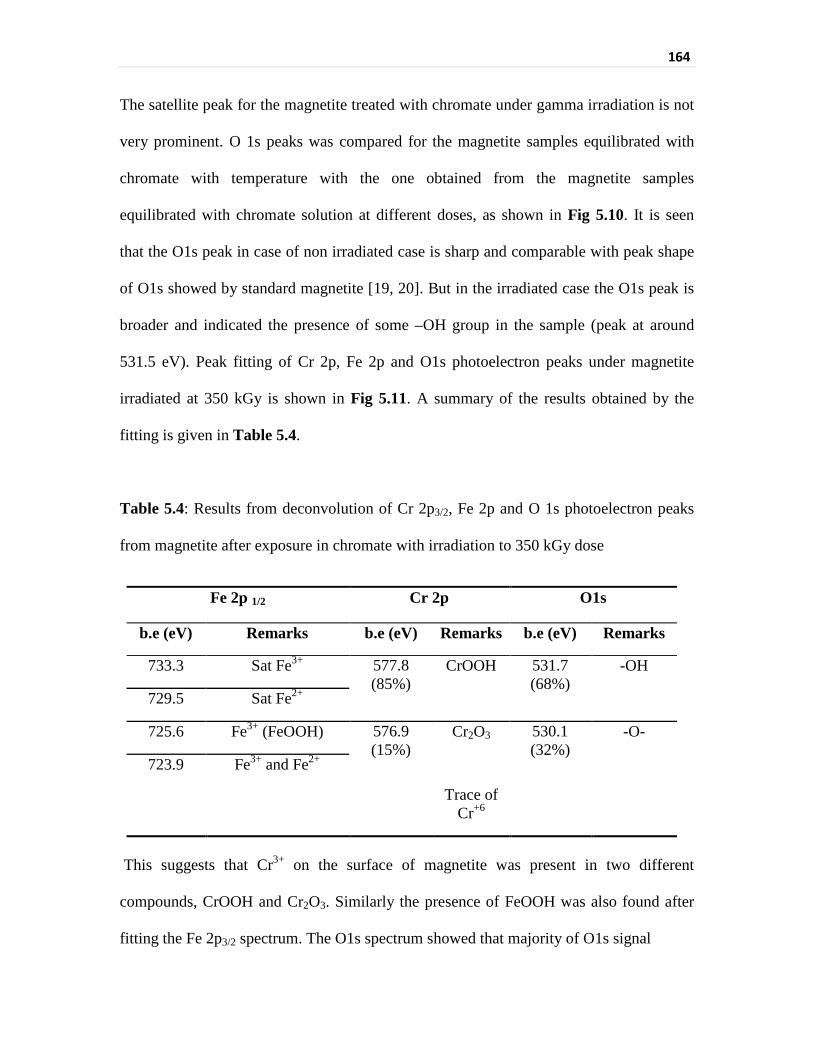
164
The satellite peak for the magnetite treated with chromate under gamma irradiation is not
very prominent. O 1s peaks was compared for the magnetite samples equilibrated with
chromate with temperature with the one obtained from the magnetite samples
equilibrated with chromate solution at different doses, as shown in Fig 5.10. It is seen
that the O1s peak in case of non irradiated case is sharp and comparable with peak shape
of O1s showed by standard magnetite [19, 20]. But in the irradiated case the O1s peak is
broader and indicated the presence of some –OH group in the sample (peak at around
531.5 eV). Peak fitting of Cr 2p, Fe 2p and O1s photoelectron peaks under magnetite
irradiated at 350 kGy is shown in Fig 5.11. A summary of the results obtained by the
fitting is given in Table 5.4.
Table 5.4: Results from deconvolution of Cr 2p3/2, Fe 2p and O 1s photoelectron peaks
from magnetite after exposure in chromate with irradiation to 350 kGy dose
Fe 2p 1/2 Cr 2p O1s
b.e (eV) Remarks b.e (eV) Remarks b.e (eV) Remarks
733.3 Sat Fe3+ 577.8 (85%)
CrOOH 531.7 (68%)
-OH
729.5 Sat Fe2+
725.6 Fe3+ (FeOOH) 576.9 (15%)
Cr2O3
Trace of Cr+6
530.1 (32%)
-O-
723.9 Fe3+ and Fe2+
This suggests that Cr3+ on the surface of magnetite was present in two different
compounds, CrOOH and Cr2O3. Similarly the presence of FeOOH was also found after
fitting the Fe 2p3/2 spectrum. The O1s spectrum showed that majority of O1s signal
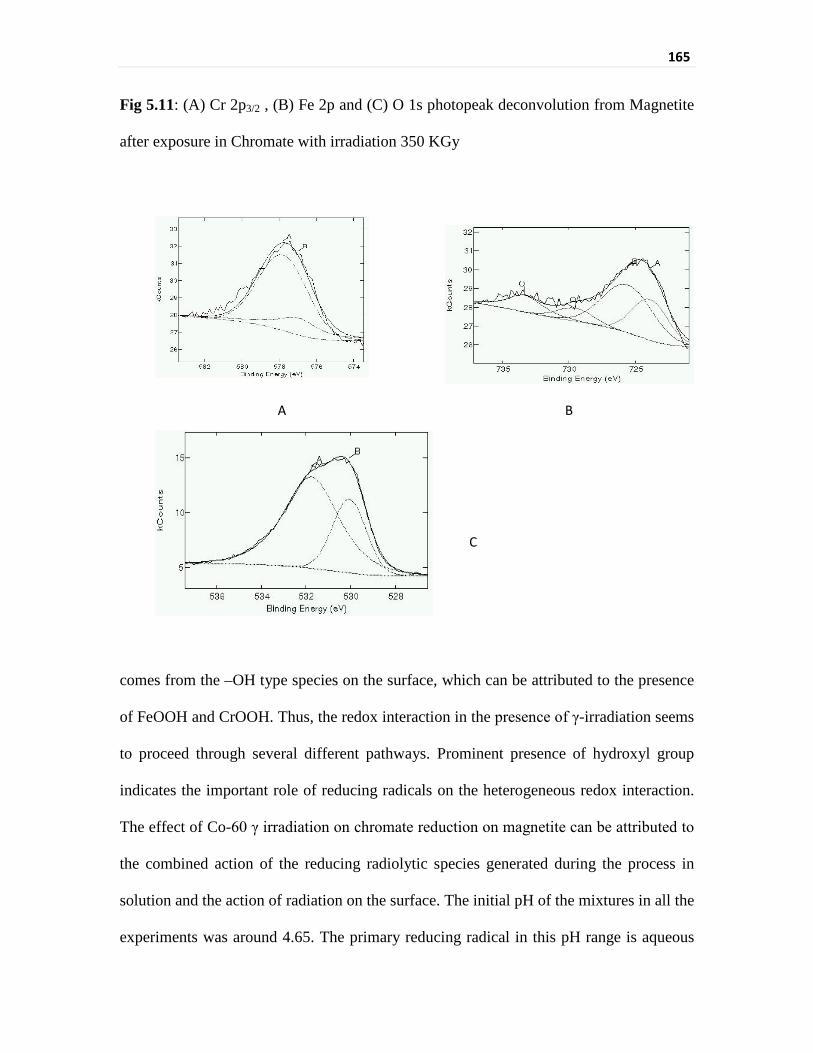
165
Fig 5.11: (A) Cr 2p3/2 , (B) Fe 2p and (C) O 1s photopeak deconvolution from Magnetite
after exposure in Chromate with irradiation 350 KGy
comes from the –OH type species on the surface, which can be attributed to the presence
of FeOOH and CrOOH. Thus, the redox interaction in the presence of γ-irradiation seems
to proceed through several different pathways. Prominent presence of hydroxyl group
indicates the important role of reducing radicals on the heterogeneous redox interaction.
The effect of Co-60 γ irradiation on chromate reduction on magnetite can be attributed to
the combined action of the reducing radiolytic species generated during the process in
solution and the action of radiation on the surface. The initial pH of the mixtures in all the
experiments was around 4.65. The primary reducing radical in this pH range is aqueous
B A
C
166
electron and hydrogen radical whose G value remains constant upto the pH of around 10
in pure water [21]. Also, the molecular product yield at higher pHs are low and hence the
reducing radicals can directly act on the chromate.
Summary
Chromate reduction on magnetite in presence of γ irradiation has followed a
Lagergren’s pseudo first order kinetic model with respect to the applied dose. The extent
of chromate reduction with increasing magnetite amount has indicated that the process is
a surface phenomenon. Also, the effect of radiolytic species on both the chromate
solution and the magnetite surface could be established by studying the N2O saturated
solution of chromate and studying chromate reduction on magnetite using different γ
sources. XPS data has shown a difference in the surface composition of magnetite
equilibrated with chromate due to the effect of irradiation and it corroborates the solution
analysis results.
5.4 References
[1] H. Abdel-Samad, and P. R. Watson, App. Surf. Sci., 108 (1997) 371.
[2] M. L. Peterson, A. F. White, G. E. Brown and G. A. Parks, Environ. Sci. Technol., 31 (1997)
1573.
[3] E. McCafferty, M. D. Bernett and J. S. Murday, Corrosion Science, 28 (1988) 559.
[4] R. M. Sellers, Radiat. Phys. Chem., 21 (1983) 295.
[5] S. J. Keny, A. G. Kumbhar, G. Venkateswaran and K. Kishore, Radiat. Phys. Chem., 72
(2005) 475.

167
[6] J. M. Zachara, D. C. Girvin, R. L Schmidt and C. T. Resch, Environ. Sci. Technol., 21 (1987)
589.
[7] R. M. Powell, R. W. Puls, S. K. Hightower and D. A. Sabatini, Environ.Sci. Technol., 29
(1995) 1913.
[8] S. E. Fendorf and G. Li, Environ. Sci. Technol. 1996, 30, 1614-1617.
[9] N. Fujita and C. Matsura, Radiat. Phys. Chem., 43 (1994) 205.
[10] S. Wang and H. Xin, Radiat. Phys. Chem., 56 (1999) 567.
[11] A. B. El-Bediwi, M. Saada, A. A. El-Fallal and S. El-Khaligy, Radiation Effects and Defects
in Solids, 166 (2011) 223.
[12] M. dos Santos Afonso and C. Di Risio, Radiat. Phys. Chem., 58 (2000) 261.
[13] G. Visalakshi, G. Venkateswaran, S. K. Kulashreshtha and P. N. Moorthy, Mater. Res. Bull.,
28 (1993) 829.
[14] E. Matijevic, Ann. Rev. Mater. Sci., 15 (1985) 483.
[15] E. Demirbas, M. Kobya, E. Senturk and T. Ozkan, Water SA, 30 (2004) 533.
[16] A. R. Pratt, D. W. Blowes and C. J. Ptacek, Environ. Sci. Technol., 31 (1997) 2492.
[17] I. Grohmann, E. Kemnitz, A. Lippitz and W. E. S. Unger, Surface Interface Analysis, 23
(1995) 887.
[18] R. M. Mahfouz, S. M. Al-Shehri, M. A. S. Monshi and N. M. Abd El-Salam, Radiation
Effects and Defects in Solids, 157 (2002) 515.
[19] X. Wei-Xing, W. Lu-Chun, W. Rui and F. Xian-Cai, J. Colloid Interface Sci., 179 (1996)
350.
[20] K. Wandelt, Surf. Sci. Rep., 2 (1982) 1.
[21] J. W. T. Spinks and R. J. Woods, An Introduction to Radiation Chemistry, third ed.; John
Wiley: New York, 1990, pp 255-263.
168
CHAPTER-6
Water Chemistry Control by Weak Base Anion Exchanger
6.1 Introduction
Soluble burnable poison in the moderator has been selected for reactivity control
during startup and shutdown (secondary shutdown system) of the 540 MWe pressurized
heavy water reactors (PHWRs) in India. Gadolinium as gadolinium nitrate is added into
the heavy water moderator system for this purpose. This is accomplished by adding the
secondary shutdown system (SDS) inventory which is a concentrated acidic Gd(NO3)3
solution to the moderator system. The pH range of operation for the moderator system is
specified to be 5.0-5.5 as long as gadolinium is present and the conductivity in µS cm-1
has to obey an approximate empirical relationship κ = 4 [Gd] + 2, where κ is
conductivity in µS cm-1, [Gd] is the concentration of gadolinium in mg kg-1, the constant
4 carries µS kg cm-1 mg-1 and the constant 2 carries µS cm-1 unit. The upper limit for pH
is restricted to avoid any precipitation of gadolinium in the system [1-4] and the lower
limit is fixed to maintain the material compatibility of the different structural materials of
the composite moderator system [5, 6]. Colloidal hydroxide/hydrous oxide/oxide
formation has been reported for rare earths in the pH range of 4.5 to 6.0 at relatively
much higher concentrations by forced hydrolysis [7]. Reactor operation or criticality
depends on the Gd concentration in the moderator. The concentration of gadolinium
before first approach to criticality was held at 2 mg kg-1, and after ~140 efficient full
power days it was kept at 0.7 mg kg-1 at the time of startup while as a secondary
169
shutdown tool gadolinium is used at 15 mg kg-1 concentration in the moderator system.
Removal of gadolinium from moderator system involves a mixed bed of strong acid
cation exchanger (SAC) and weak base anion exchanger (WBA). Weak base anion
exchanger is used to avoid any precipitation of gadolinium as Gd(OH)3 due to removal of
nitrate prior to Gd3+ removal on SAC. This is possible when strong base anion exchanger
is used in place weak base anion exchanger. The use of WBA also facilitates selective
removal of gadolinium over boron. Boron is present as a conjugate base of a weakly
acidic species in aqueous medium. This cannot be removed on weak base anion
exchanger. Thus, from a mixture of boric acid and gadolinium nitrate, nitrate ion will be
selectively removed on weak base anion exchanger column. Boric acid was used during
the first approach to criticality for fine adjustments of reactivity (reactivity change
brought about for unit change in its concentration is less for boron as compared to
gadolinium) since it has a lower neutron absorption cross section (~780 barns for natural
boron) as compared to gadolinium ( ~ 48 000 barns for natural gadolinium). During the
removal of gadolinium through such a column, in the initial stages the pH at the outlet of
the column went above 5.5 and remained above 5.5 for about one half life of recirculation
( ~ 6 hours) through the column. However, the bulk moderator system pH remained
within the specified limit throughout the run. Feasibility of maintaining the pH of the ion
exchange column outlet within the specified limits of the bulk moderator system by the
leach out of nitric acid from the weak base resin of the column has been studied. The
leach out characteristics of nitric acid from weak base resin as a function of nitric acid
loading and initial inlet concentration at a particular flow rate is evaluated. Based on the
evaluation of leaching from the nitric acid loaded weak base anion exchanger, a column
170
configuration is suggested for maintaining the column outlet pH within the specified
limits during the Gd3+ removal from the moderator system.
6.2 Experimental
Macroporous weak base anion exchanger (Auchtel duolite ARA 9369 WBA with
macroporous polystyrene matrix, tertiary amine functional group and total exchange
capacity of 1.4 meq ml-1) resin was used for studying the nitric acid leachout
characteristics in both once through and recirculation modes. Nano pure water (specific
resistance: 18.2 MΩ-cm) was used for all the experiments. Once through mode elution
studies involved passing nano pure water through different nitric acid loaded weak base
anion exchanger (NLWBA) mixtures with fresh weak base anion exchanger columns and
also eluting nitric acid solutions at various pHs through different nitric acid loaded weak
base anion exchanger mixtures with fresh weak base anion exchanger columns. In the
recirculation mode experiments, nano pure water was recirculated through different nitric
acid loaded weak base anion exchanger mixtures with fresh WBA and also an equivalent
amount of nitric acid in solution was recirculated through a fresh weak base anion
exchanger column. In all these experiments, 10 l solution was passed through 10 ml of
the resin (column diameter was 1.5 cm while the average resin bead diameter was around
0.05 cm and hence wall effects were negligible) at a flow velocity of 170 cm min-1 which
simulates the flow velocity in the moderator purification circuit in the Indian 540 MWe
PHWRs.

171
In another set of experiments, Gd(NO3)3 removal from TAPP 3&4 moderator
system was simulated. The moderator inventory is 2,66,363 liters of heavy water while
the ion exchange columns have a volume of 200 liters. In the laboratory studies, 60 liters
of 4 and 15 mg kg-1 solution of Gd(NO3)3 at pH 5 was circulated through 80 ml resin
column. The column consisted of 16 ml strong acid cation exchanger (Auchtel duolite
ARC 9351 in H+ form with macroporous polystyrene matrix, sulfonic acid functional
group and exchange capacity of 1.8 meq ml-1) topped mixed bed of 8 ml strong acid
cation exchanger and 48 ml weak base anion exchanger as such and in another
experiment, a similar column with a bottom packing of 8 mL of 5 % NLWBA mixture
with fresh weak base anion exchanger. Thus, the ratio of total solution to total resin
volume in the experimental condition was almost half of that in the reactor. For removal
of 15 mg kg-1 gadolinium, the amount of weak base anion exchanger taken was resulting
in about 20 % loading upon complete removal of gadolinium from the system while the
amount of strong acid cation exchanger taken was for about 40 % loading upon complete
removal of gadolinium. Strong acid acid exchanger topping was provided for sequential
removal of Gd3+ on top strong acid cation exchanger followed by removal of resulting
HNO3 on the mixed bed to avoid any possibility of precipitation of gadolinium due to
initial removal of nitric acid and hence increase in pH.
pH and conductivity were measured at regular intervals of time in all experiments
using PHAN pH meter from Lab India with a resolution of 0.01 pH units and CON 1500
conductivity meter from Eutech Instruments with four probe electrode and resolution of
0.001 µS cm-1. In nitric acid elution experiments, concentration of nitric acid was
172
determined from the pH values. Gd was measured spectrophotometrically by
Arsenazo(III) method at 650 nm [8].
6.3 Results and Discussion
6.3.1 Leachout behaviour of WBA column
Leaching characteristics of nitric acid from various nitric acid loaded weak base anion
exchanger mixtures with fresh weak base anion exchanger have been analyzed for the
once-through column experiments. Sorption behaviour of strong acids on weak base resin
has been studied in details in earlier works [9, 10]. Bhandari et al. [9] observed
significant reversibility even at high hydrochloric or nitric acid concentrations and they
proposed a model accounting for sorption equilibria and dynamics by considering an
electrical double layer at the pore walls. In the present work, we have used a simple
empirical approach to evaluate the nitric acid sorption-desorption behaviour on weak
base resin under given experimental conditions. This approach is sufficient to serve our
purpose of calculating the required amount of nitric acid loaded weak base anion
exchanger mixture with fresh weak base anion exchanger to be used as a bottom layer of
the column to achieve the desired pH at the outlet during Gd3+ removal with the given
flow velocity and the ratio of resin volume to amount of Gd3+ to be removed.
Nitric acid leaching from nitric acid loaded weak base anion exchanger on eluting
pure water at a fixed flow velocity is assumed to depend only on the amount of nitric acid
sorbed on the nitric acid loaded weak base anion exchanger. This implies that upon
eluting pure water through a nitric acid loaded weak base anion exchanger mixed with

173
fresh weak base anion exchanger column, the column outlet nitric acid concentration or
conductivity would vary as a first order decrease with respect to time. Therefore, plot of
the outlet conductivity against time for weak base anion exchanger columns loaded with
nitric acid loaded weak base anion exchanger mixed with fresh weak base anion
exchanger to different extents is fitted to a first order decrease according to the equation:
exp( )ox x tλ= − (6.1)
where x is the conductivity of the column outlet solution in µS/cm, xo is
the conductivity equivalent of the total nitric acid loaded on the column, λ is the leaching
constant in min-1 and t is time in minutes.
Levenberg-Marquardt algorithm is used for fitting and parameter evaluation
through ‘origin’ software. For lesser loading of the column, a good fitting is obtained as
indicated by the low chi square values. Also, the leaching constant obtained by the fitting
is almost similar upto 50 % nitric acid loaded weak base anion exchanger mixture with
fresh weak base anion exchanger. Here, xo is an experimentally known parameter but we
have not fixed it during the fitting. This approach was taken to maintain uniformity in the
procedure followed for single mode of leaching and multiple mode of leaching which is
discussed later. The fitting of column outlet conductivity to the first order decrease is not
satisfactory for experiments of higher loading of the resin. The leachout behaviour is then
visualized as a sum of several simultaneous leaching modes with each of the mode
following a first order decrease. This will lead to a leaching behaviour where the total
nitric acid leachout is the sum of leachout from sites with varying strength of nitric acid
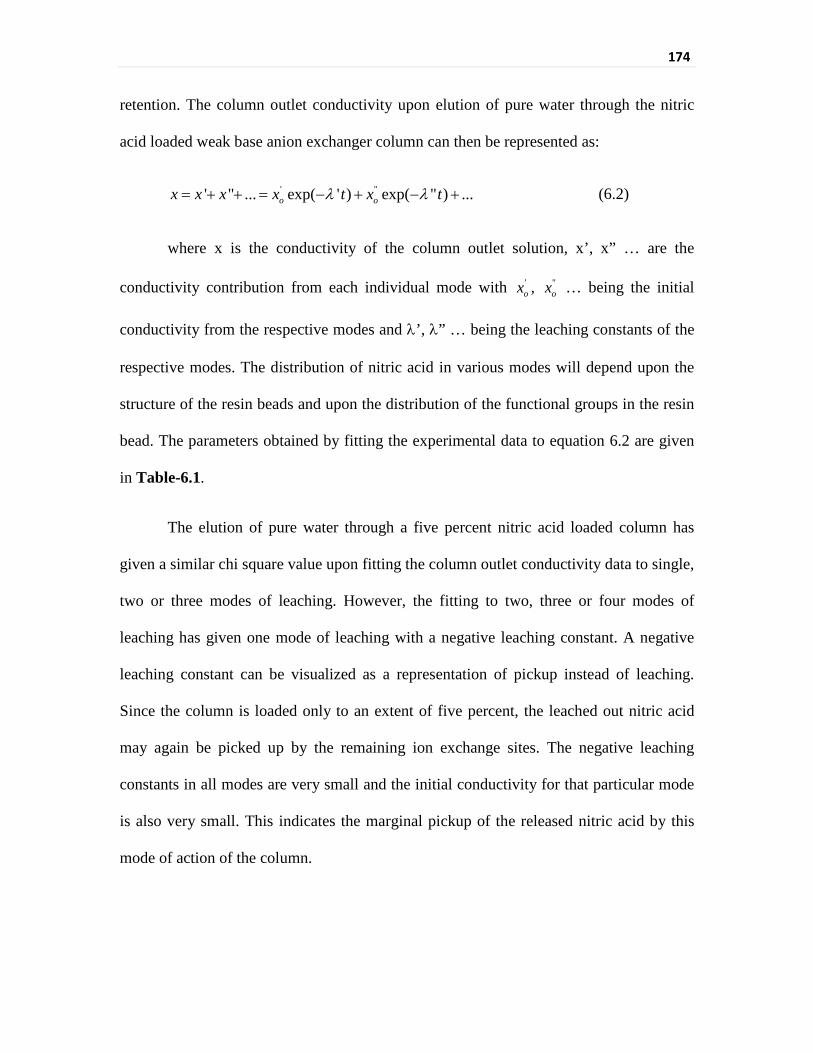
174
retention. The column outlet conductivity upon elution of pure water through the nitric
acid loaded weak base anion exchanger column can then be represented as:
' "' " ... exp( ' ) exp( " ) ...o ox x x x t x tλ λ= + + = − + − + (6.2)
where x is the conductivity of the column outlet solution, x’, x” … are the
conductivity contribution from each individual mode with 'ox , "
ox … being the initial
conductivity from the respective modes and λ’, λ” … being the leaching constants of the
respective modes. The distribution of nitric acid in various modes will depend upon the
structure of the resin beads and upon the distribution of the functional groups in the resin
bead. The parameters obtained by fitting the experimental data to equation 6.2 are given
in Table-6.1.
The elution of pure water through a five percent nitric acid loaded column has
given a similar chi square value upon fitting the column outlet conductivity data to single,
two or three modes of leaching. However, the fitting to two, three or four modes of
leaching has given one mode of leaching with a negative leaching constant. A negative
leaching constant can be visualized as a representation of pickup instead of leaching.
Since the column is loaded only to an extent of five percent, the leached out nitric acid
may again be picked up by the remaining ion exchange sites. The negative leaching
constants in all modes are very small and the initial conductivity for that particular mode
is also very small. This indicates the marginal pickup of the released nitric acid by this
mode of action of the column.
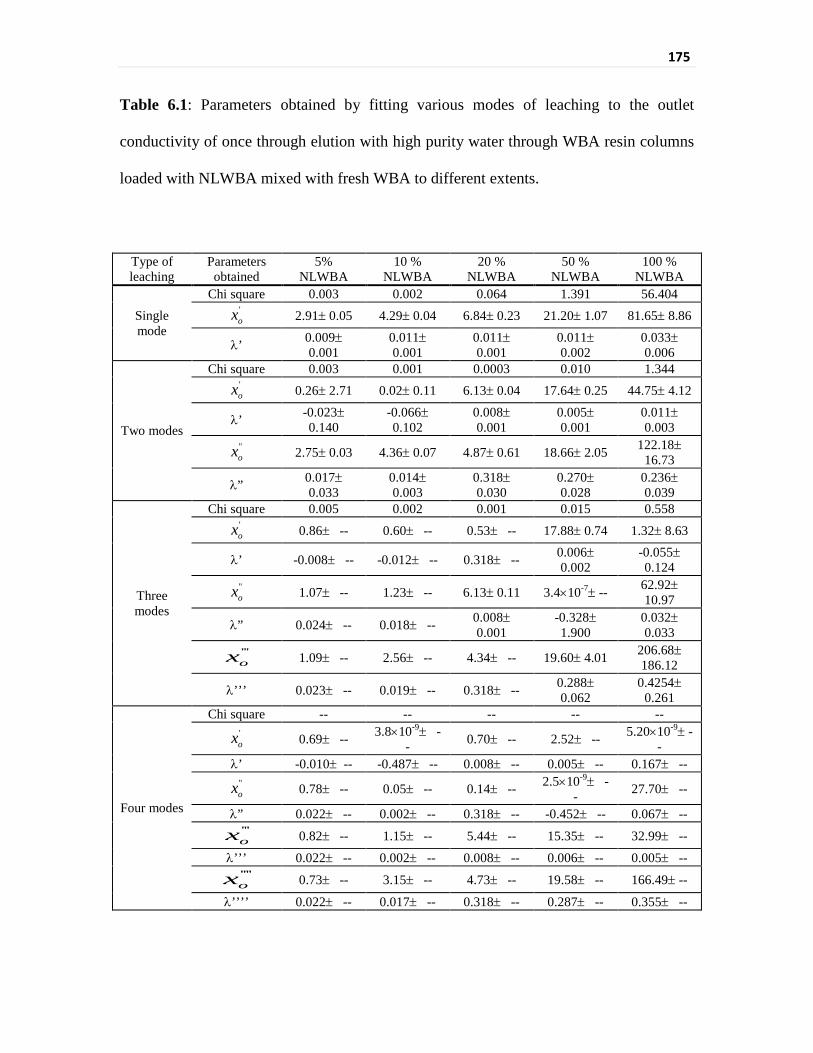
175
Table 6.1: Parameters obtained by fitting various modes of leaching to the outlet
conductivity of once through elution with high purity water through WBA resin columns
loaded with NLWBA mixed with fresh WBA to different extents.
Type of leaching
Parameters obtained
5% NLWBA
10 % NLWBA
20 % NLWBA
50 % NLWBA
100 % NLWBA
Single mode
Chi square 0.003 0.002 0.064 1.391 56.404 'ox 2.91± 0.05 4.29± 0.04 6.84± 0.23 21.20± 1.07 81.65± 8.86
λ’ 0.009± 0.001
0.011± 0.001
0.011± 0.001
0.011± 0.002
0.033± 0.006
Two modes
Chi square 0.003 0.001 0.0003 0.010 1.344 'ox 0.26± 2.71 0.02± 0.11 6.13± 0.04 17.64± 0.25 44.75± 4.12
λ’ -0.023± 0.140
-0.066± 0.102
0.008± 0.001
0.005± 0.001
0.011± 0.003
"ox 2.75± 0.03 4.36± 0.07 4.87± 0.61 18.66± 2.05 122.18±
16.73
λ” 0.017± 0.033
0.014± 0.003
0.318± 0.030
0.270± 0.028
0.236± 0.039
Three modes
Chi square 0.005 0.002 0.001 0.015 0.558 'ox 0.86± -- 0.60± -- 0.53± -- 17.88± 0.74 1.32± 8.63
λ’ -0.008± -- -0.012± -- 0.318± -- 0.006± 0.002
-0.055± 0.124
"ox 1.07± -- 1.23± -- 6.13± 0.11 3.4×10⁻⁷± -- 62.92±
10.97
λ” 0.024± -- 0.018± -- 0.008± 0.001
-0.328± 1.900
0.032± 0.033
'''ox 1.09± -- 2.56± -- 4.34± -- 19.60± 4.01 206.68±
186.12
λ’’’ 0.023± -- 0.019± -- 0.318± -- 0.288± 0.062
0.4254± 0.261
Four modes
Chi square -- -- -- -- -- 'ox 0.69± -- 3.8×10⁻⁹± -
- 0.70± -- 2.52± -- 5.20×10⁻⁹± --
λ’ -0.010± -- -0.487± -- 0.008± -- 0.005± -- 0.167± -- "ox 0.78± -- 0.05± -- 0.14± -- 2.5×10⁻⁹± -
- 27.70± --
λ” 0.022± -- 0.002± -- 0.318± -- -0.452± -- 0.067± -- '''ox 0.82± -- 1.15± -- 5.44± -- 15.35± -- 32.99± --
λ’’’ 0.022± -- 0.002± -- 0.008± -- 0.006± -- 0.005± -- ''''ox 0.73± -- 3.15± -- 4.73± -- 19.58± -- 166.49± --
λ’’’’ 0.022± -- 0.017± -- 0.318± -- 0.287± -- 0.355± --
176
Similar results are obtained with the column having ten percent nitric acid
loading. Chi square values obtained from the fitting to single mode of leaching for both
cases are comparable and very small. Also, the leaching constant for single mode of
leaching for these two cases is comparable. Thus for all practical purposes, the leaching
behaviour of ten or five percent nitric acid loaded columns can be assumed to follow
single mode of leaching following a first order release of nitric acid at a given flow rate.
The chi square value obtained by fitting the outlet conductivity data of elution of
pure water through the twenty percent nitric acid loaded weak base anion exchanger
column to single mode of leaching was higher by two order of magnitudes when
compared to that for two or three modes of leaching. Fitting to two or three modes of
leaching indicates that the major amount of nitric acid is held at the ion exchange sites of
the column with a smaller leaching rate constant. Fitting to a single mode of leaching
behaviour has given a similar leaching rate constant as that obtained for five or ten
percent nitric acid loaded weak base anion exchanger columns though the chi square
value for single mode of leaching fitting has increased by an order of magnitude. The
leaching behaviour for twenty percent nitric acid loaded weak base anion exchanger
column should be assumed to follow more than one mode of leaching based on the
respective chi square values obtained.
Fifty and hundred percent nitric acid loaded weak base anion exchanger columns
outlet conductivity data gave a very poor fitting to single mode of leaching. Fittings for
multiple modes of leaching to these data have given better results. Parameters obtained
by fittings for multiple modes of leaching show that major contribution to conductivity
came from the mode with a higher leaching rate constant. This indicates that the major
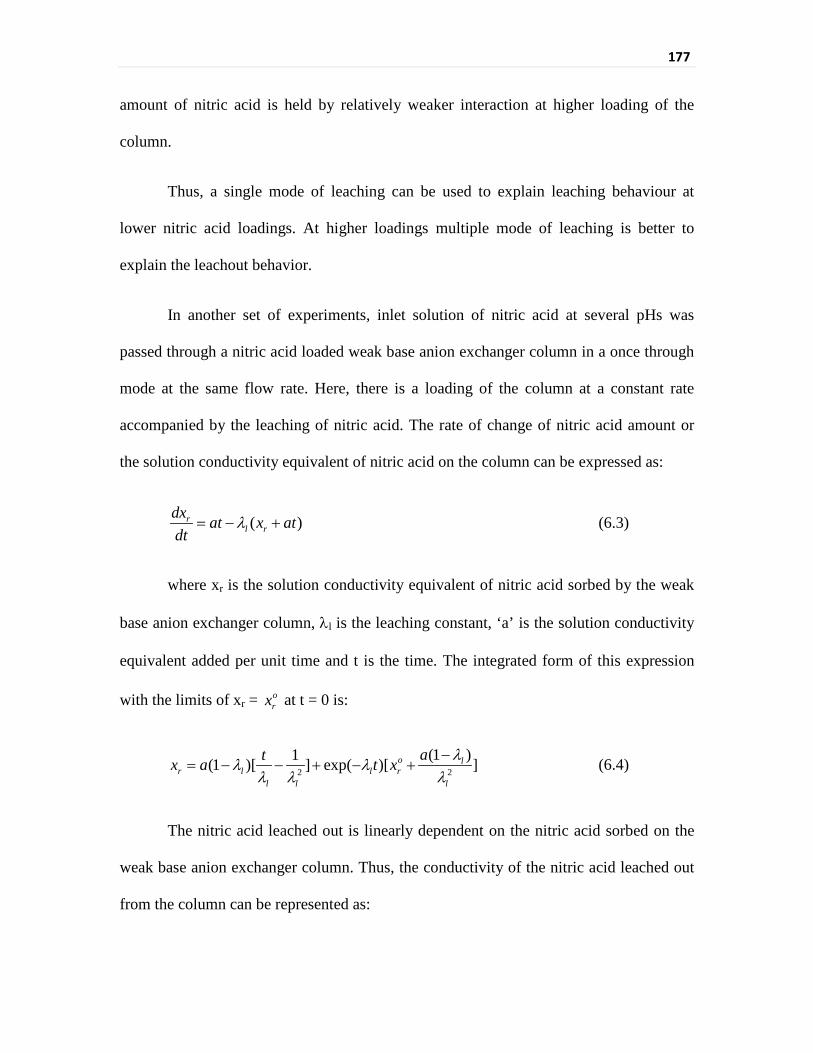
177
amount of nitric acid is held by relatively weaker interaction at higher loading of the
column.
Thus, a single mode of leaching can be used to explain leaching behaviour at
lower nitric acid loadings. At higher loadings multiple mode of leaching is better to
explain the leachout behavior.
In another set of experiments, inlet solution of nitric acid at several pHs was
passed through a nitric acid loaded weak base anion exchanger column in a once through
mode at the same flow rate. Here, there is a loading of the column at a constant rate
accompanied by the leaching of nitric acid. The rate of change of nitric acid amount or
the solution conductivity equivalent of nitric acid on the column can be expressed as:
( )rl r
dx at x atdt
λ= − + (6.3)
where xr is the solution conductivity equivalent of nitric acid sorbed by the weak
base anion exchanger column, λl is the leaching constant, ‘a’ is the solution conductivity
equivalent added per unit time and t is the time. The integrated form of this expression
with the limits of xr = orx at t = 0 is:
2 2
(1 )1(1 )[ ] exp( )[ ]o lr l l r
l l l
atx a t x λλ λλ λ λ
−= − − + − + (6.4)
The nitric acid leached out is linearly dependent on the nitric acid sorbed on the
weak base anion exchanger column. Thus, the conductivity of the nitric acid leached out
from the column can be represented as:

178
2 2
(1 )1 (1 )[ ] exp( )[ ]o ls l l r
l l l
atx b a t x λλ λλ λ λ
−= − − + − + (6.5)
where xs is the solution conductivity and ‘b’ is the fraction of the sorbed nitric
acid coming into the solution. The parameters obtained by fitting the experimental data to
the equation (6.5) are given in Table 6.2.
Table 6.2: Parameters obtained by fitting the experimental outlet conductivity data of
elution of varying inlet pH solutions through different columns loaded with nitric acid
loaded weak base anion exchanger mixed with fresh WBA to different extents in a once
through mode.
Parameters obtained
20% NLWBA with I/L pH:4.0
20% NLWBA with I/L pH:4.5
5% NLWBA with I/L pH:4.5
5% NLWBA with I/L pH:4.7
Chi square 0.069 0.003 0.001 0.001 b 0.004±0.007 0.016±0.004 0.006±0.001 0.005±0.001
a (fixed) 0.455 0.1664 0.1678 0.1612 λl 0.013±0.004 0.0141±0.003 0.0136±0.002 0.018±0.002
orx 107.63±3.60 98.60±1.30 22.53±0.90 24.70±0.87
Here, the value of ‘a’, the solution conductivity equivalent added to the column
per unit time was fixed as the calculated one based on the inlet solution conductivity,
total inlet solution volume and the flow rate. The values of leaching constant obtained by
this fitting are comparable to that for the once through leaching cases. However, there is a
slight increase in the leaching rate constant with the increase in the pH of the inlet for any
particular column configuration. This again indicates that leaching of nitric acid from
weak base anion exchanger column is a combined effect of concentration or mass action
and electrostatic repulsion.
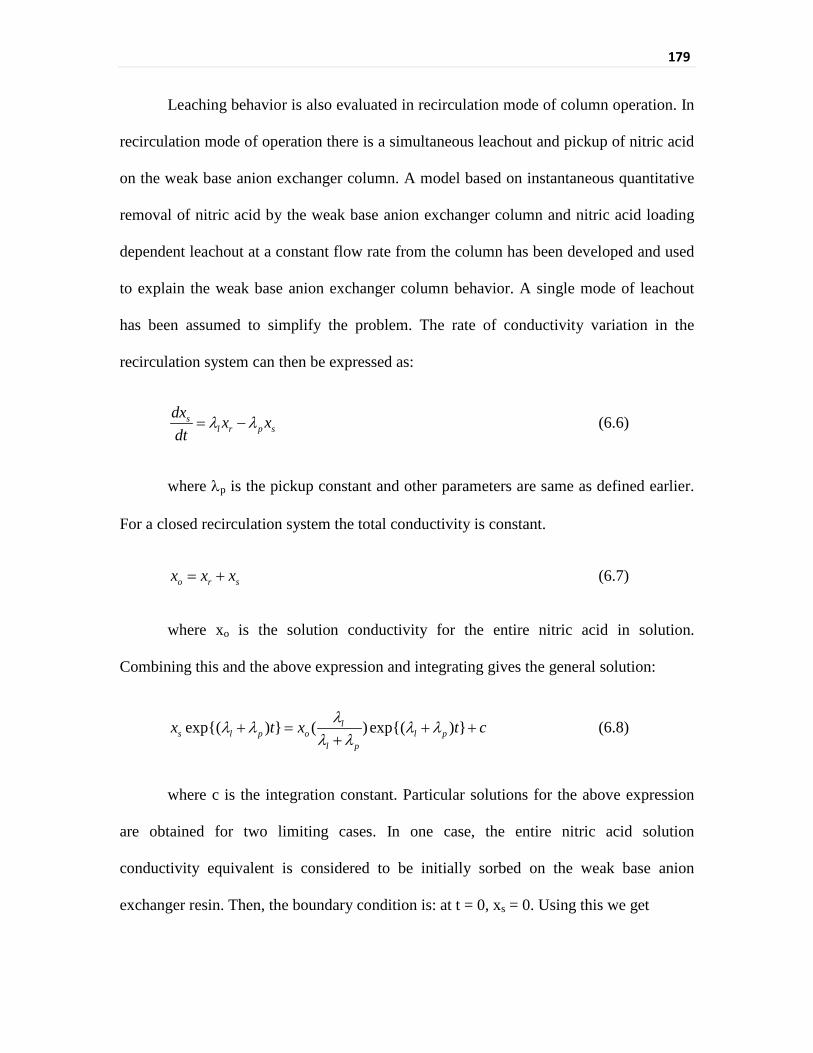
179
Leaching behavior is also evaluated in recirculation mode of column operation. In
recirculation mode of operation there is a simultaneous leachout and pickup of nitric acid
on the weak base anion exchanger column. A model based on instantaneous quantitative
removal of nitric acid by the weak base anion exchanger column and nitric acid loading
dependent leachout at a constant flow rate from the column has been developed and used
to explain the weak base anion exchanger column behavior. A single mode of leachout
has been assumed to simplify the problem. The rate of conductivity variation in the
recirculation system can then be expressed as:
sl r p s
dx x xdt
λ λ= − (6.6)
where λp is the pickup constant and other parameters are same as defined earlier.
For a closed recirculation system the total conductivity is constant.
o r sx x x= + (6.7)
where xo is the solution conductivity for the entire nitric acid in solution.
Combining this and the above expression and integrating gives the general solution:
exp( ) ( ) exp( ) ls l p o l p
l p
x t x t cλλ λ λ λλ λ
+ = + ++
(6.8)
where c is the integration constant. Particular solutions for the above expression
are obtained for two limiting cases. In one case, the entire nitric acid solution
conductivity equivalent is considered to be initially sorbed on the weak base anion
exchanger resin. Then, the boundary condition is: at t = 0, xs = 0. Using this we get
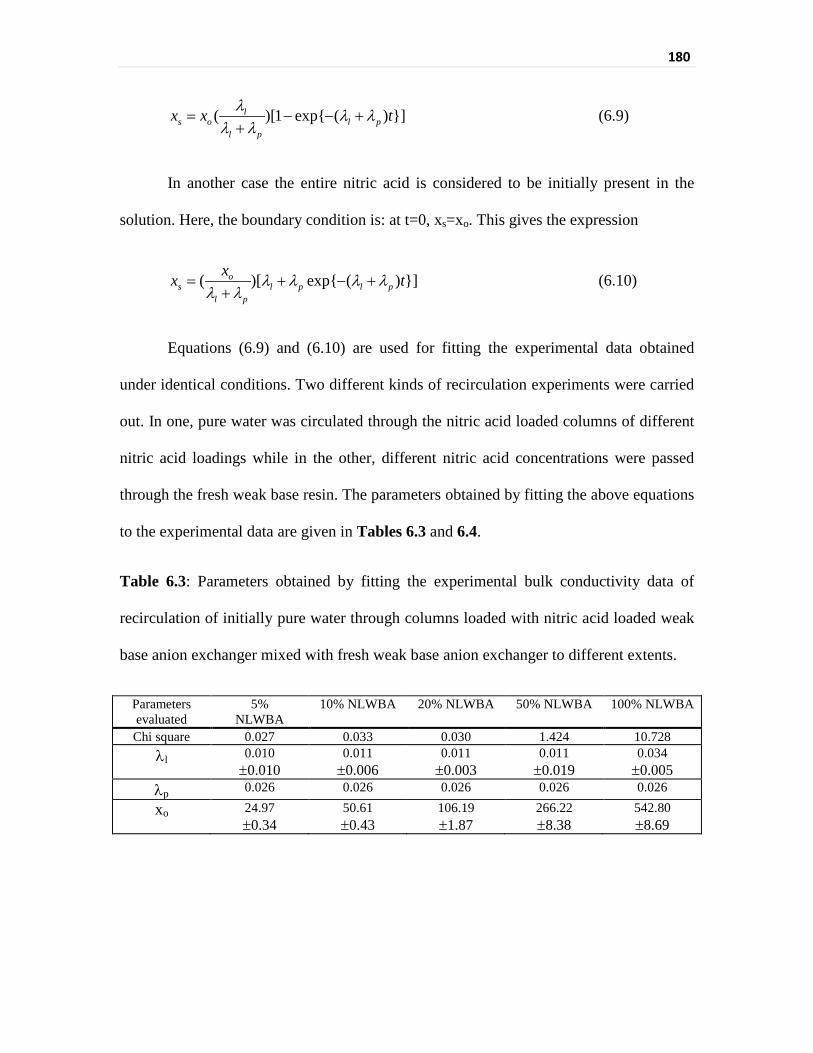
180
( )[1 exp ( ) ]ls o l p
l p
x x tλ λ λλ λ
= − − ++
(6.9)
In another case the entire nitric acid is considered to be initially present in the
solution. Here, the boundary condition is: at t=0, xs=xo. This gives the expression
( )[ exp ( ) ]os l p l p
l p
xx tλ λ λ λλ λ
= + − ++
(6.10)
Equations (6.9) and (6.10) are used for fitting the experimental data obtained
under identical conditions. Two different kinds of recirculation experiments were carried
out. In one, pure water was circulated through the nitric acid loaded columns of different
nitric acid loadings while in the other, different nitric acid concentrations were passed
through the fresh weak base resin. The parameters obtained by fitting the above equations
to the experimental data are given in Tables 6.3 and 6.4.
Table 6.3: Parameters obtained by fitting the experimental bulk conductivity data of
recirculation of initially pure water through columns loaded with nitric acid loaded weak
base anion exchanger mixed with fresh weak base anion exchanger to different extents.
Parameters evaluated
5% NLWBA
10% NLWBA 20% NLWBA 50% NLWBA 100% NLWBA
Chi square 0.027 0.033 0.030 1.424 10.728 λl 0.010
±0.010 0.011 ±0.006
0.011 ±0.003
0.011 ±0.019
0.034 ±0.005
λp 0.026 0.026 0.026 0.026 0.026
xo 24.97 ±0.34
50.61 ±0.43
106.19 ±1.87
266.22 ±8.38
542.80 ±8.69

181
Table 6.4: Parameters obtained by fitting the experimental bulk conductivity data of
recirculation of different concentrations of nitric acid solution through fresh weak base
anion exchange columns.
Parameters evaluated
Nitric acid concentration equivalent to 5% NLWBA
Nitric acid concentration equivalent to
10% NLWBA
Nitric acid concentration equivalent to
20% NLWBA
Nitric acid concentration equivalent to
50% NLWBA
Nitric acid concentration equivalent to
100% NLWBA Chi square 0.032 0.219 2.141 57.252 211.800
λl 0.002±0.000 0.001±0.000 0.001±0.000 0.002±0.000 0.003±0.001 λp 0.026 0.026 0.026 0.026 0.026 xo 27.93
±0.02 49.90 ±0.47 102.85 ±1.32 268.22±6.32 535.35±10.94
The results of recirculation of pure water through various nitric acid loaded weak
base anion exchangers were similar to that obtained for once through elution of pure
water through same nitric acid loaded weak base anion exchangers in terms of leaching
constants. The relatively poor fitting at higher loadings or at higher concentrations of
nitric acid in solution are similar to that for once through experiments and can be
explained by the same reasoning. However, the leaching constants obtained upon
recirculation of nitric acid solutions through fresh weak base anion exchangers were an
order of magnitude lower than that for the recirculation of pure water through equivalent
amount of nitric acid containing nitric acid loaded weak base anion exchanger. For the
column loaded with nitric acid the pure water entering the column will be in contact with
the nitric acid loaded resin, whereas in the case of nitric acid solution recirculation
through a fresh weak base anion exchanger, the nitric acid loaded resin part will be in
contact with the solution having high concentration of nitric acid for most of the time.
Thus leaching of nitric acid depends on both the amount of nitric acid sorbed on the weak
base anion exchanger column and on the nitric acid concentration in solution. Thus the
182
equilibrium effect becomes very important in the recirculation case. Equilibrium
constants were determined for these experiments. The equilibrium constant for sorption
of nitric acid on weak base anion exchanger can be represented by the process [11]
HNO3 + P–NR2 ↔ P–R2NH+–NO3- (6.11)
where P is the polymeric matrix of the weak base anion exchanger and R is the alkyl
group attached to the nitrogen is given by the expression
3
3[ ]HNO
eqWBA
qK q HNO= × , where Keq is the equilibrium constant (l mmol-1),
qHNO3 is the capacity of nitric acid on weak base anion exchanger (meq/ml) and qWBA is
the remaining capacity of the weak base anion exchanger and [HNO3] is the nitric acid
concentration in solution (mM) under equilibrium conditions.
The recirculation of pure water through various nitric acid loaded columns has
been evaluated by fitting the experimental values of solution nitric acid concentration to
equation (6.9) and thus determining the total nitric acid amount. The total nitric acid
amount for each case was then taken from the weighted average of the values obtained
from all cases. The equilibrium constants for the 5 %, 10 %, 20 %, 50 % and 100 % weak
nitric acid loaded base anion exchanger mixtures with fresh weak base anion exchanger
thus determined were 5.8, 7.2, 10.5, 9.2 and 8.7 respectively. For lower loadings a large
number of unused weak base anion exchanger capacity is there although small
concentration of nitric acid is still remaining there in solution. At very high loading the
remaining concentration of nitric acid in solution is high and this again decreases the
equilibrium constant. The equilibrium constants evaluated for the experiments where
183
nitric acid concentration equivalent to 5 %, 10 %, 20 %, 50 % and 100 % loading were
recirculated through fresh resin were 9.1, 13.5, 20.3, 6.5 and 6.2 respectively. Ideally the
equilibrium constant should be same for all concentrations but the experimental values
have a variation. This again indicates there is a varying pickup behaviour of weak base
anion exchanger with changing concentration of nitric acid. The high equilibrium
constant value for 20 % nitric acid loaded weak base anion exchanger mixture with fresh
weak base anion exchanger can be correlated with the lesser leaching constant obtained
for the same experiment.
Thus, an empirical quantitative estimation of nitric acid leachout from weak base
anion exchanger column under given experimental conditions could be achieved. A
single mode of leaching could satisfactorily explain the nitric acid pickup behaviour for
upto 20 % loading or for 20 % nitric acid loaded weak base anion exchanger mixture with
fresh weak base anion exchanger. The efficient removal of nitric acid on weak base anion
exchanger is possible if the percentage loading is kept in the range of around 20 %.
6.3.2 Removal of gadolinium from solution
Gadolinium as Gd(NO3)3 solution is used for reactivity control in moderator at
two concentrations of 2 mg kg-1 and 15 mg kg-1 in the 540 MWe PHWRs (Tarapur
Atomic Power Station Units 3 and 4). 2 mg kg-1 gadolinium is used for first approach to
criticality or startup after a Xe-135 poisoned shutdown while 15 mg kg-1 gadolinium is
used for shutdown purposes. During the presence of gadolinium in solution, the pH of the
moderator system is specified to remain between 5.0 to 5.5. Precipitation of gadolinium
184
at higher pHs as hydroxide, carbonates, silicates etc. and structural material integrity
concerns at lower pHs is the basis for this limit of pH. Removal of gadolinium from
solution is carried out by using a combination of strong acid cation exchanger and weak
base anion exchanger resins. Weak base anion exchanger resin has to be used since
gadolinium is also used along with boron for fine control of reactivity insertion. Weak
base anion exchanger is used so that boron is not removed and since it cannot remove
nitrate as long as the counter ion is Gd3+. On weak base anion exchanger, nitrate can be
removed as nitric acid only as shown by equation (6.11). In the laboratory experiment for
removal of 15 mg kg-1 gadolinium, the amount of weak base anion exchanger taken was
resulting in about 20 % loading upon complete removal of gadolinium from the system
while the amount of strong acid cation exchanger taken was for about 40 % loading upon
complete removal of gadolinium. The column configuration used was a strong acid cation
exchanger topped mixed bed of strong acid cation exchanger and weak base anion
exchanger. The ratio of strong acid cation exchanger to weak base anion exchanger in the
column was 1:2 in terms of volume and the distribution of strong acid cation exchanger
was again 1:2 in terms of volume in the mixed bed layer and the top layer respectively.
strong acid cation exchanger topping was provided for sequential removal of Gd3+ on top
strong acid cation exchanger and of HNO3 on the mixed bed to avoid any possibility of
precipitation of gadolinium due to initial removal of nitrate. The hardware limitations of
the plant require at the maximum the use of only two columns for 15 mg kg-1 gadolinium
removal from the moderator system with each one taking half of the total ionic load. In
our experiments we have reduced the solution volume to resin volume ratio to half of that
of the system and removed the whole ionic load corresponding to 15 mg kg-1 [Gd] on one
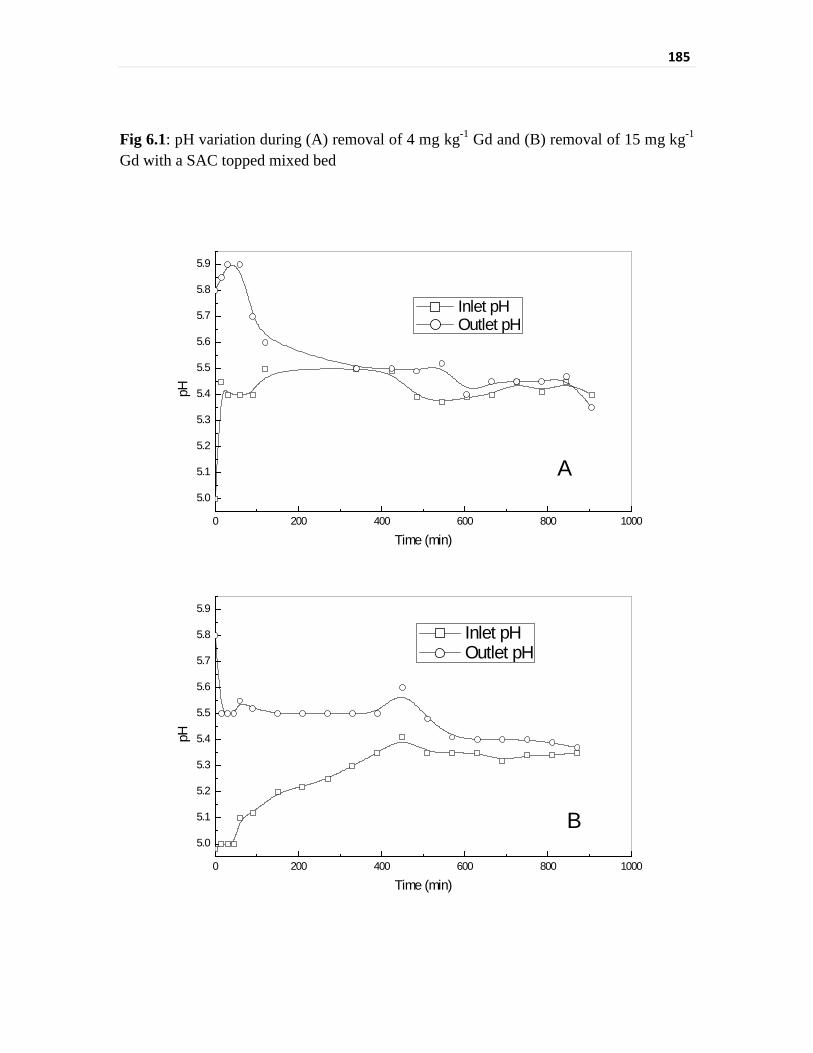
185
Fig 6.1: pH variation during (A) removal of 4 mg kg-1 Gd and (B) removal of 15 mg kg-1 Gd with a SAC topped mixed bed
0 200 400 600 800 1000
5.0
5.1
5.2
5.3
5.4
5.5
5.6
5.7
5.8
5.9
0 200 400 600 800 1000
5.0
5.1
5.2
5.3
5.4
5.5
5.6
5.7
5.8
5.9
Inlet pH Outlet pH
pH
Time (min)
B
Inlet pH Outlet pH
pH
Time (min)
A
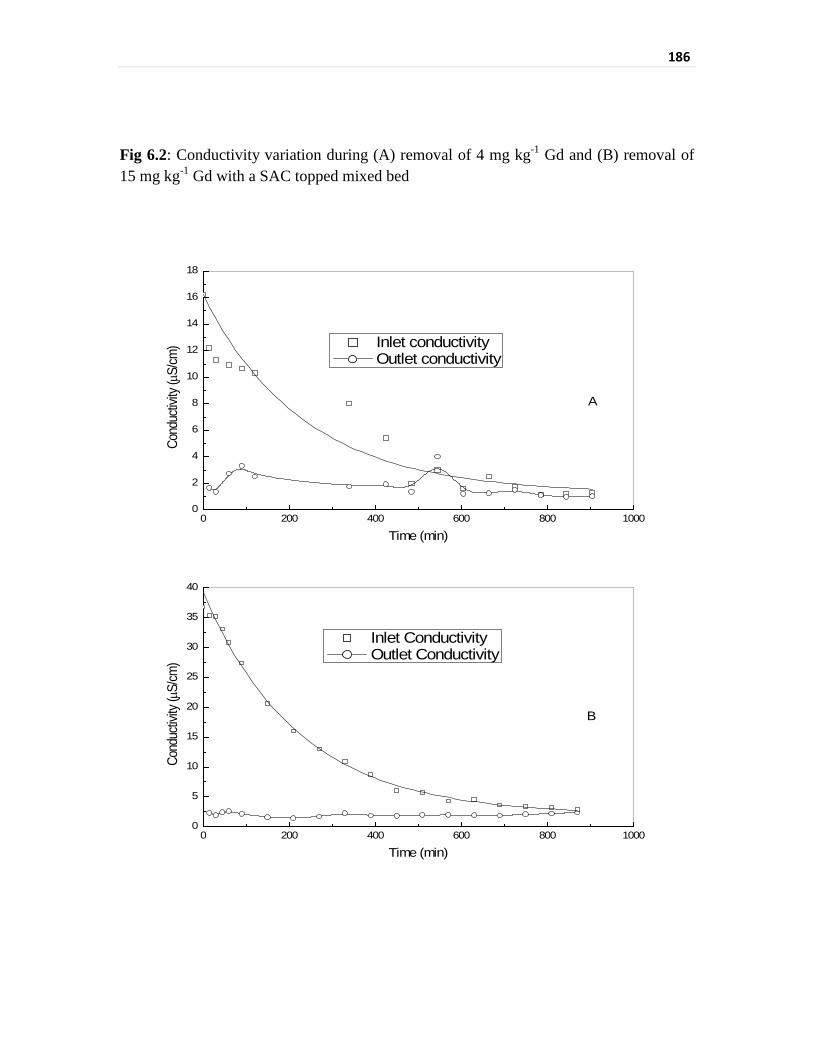
186
Fig 6.2: Conductivity variation during (A) removal of 4 mg kg-1 Gd and (B) removal of 15 mg kg-1 Gd with a SAC topped mixed bed
0 200 400 600 800 10000
2
4
6
8
10
12
14
16
18
0 200 400 600 800 10000
5
10
15
20
25
30
35
40
Inlet conductivity Outlet conductivity
Cond
uctiv
ity (µ
S/cm
)
Time (min)
A
Inlet Conductivity Outlet Conductivity
Cond
uctiv
ity (µ
S/cm
)
Time (min)
B
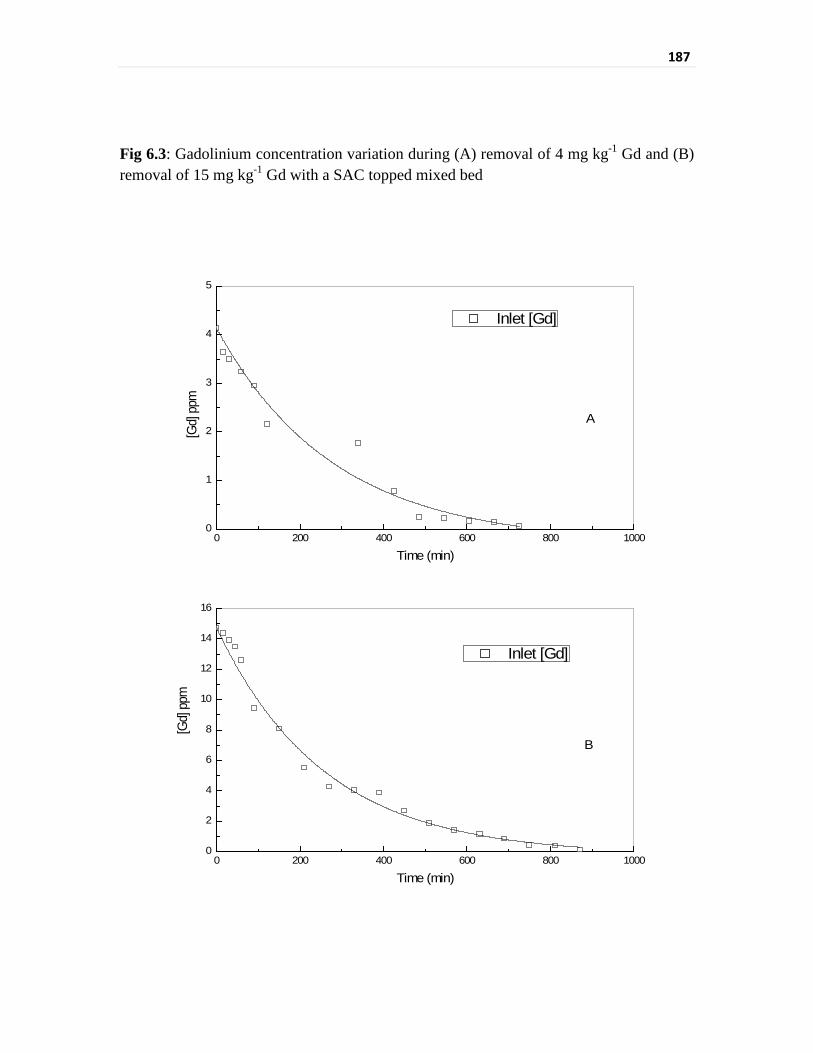
187
Fig 6.3: Gadolinium concentration variation during (A) removal of 4 mg kg-1 Gd and (B) removal of 15 mg kg-1 Gd with a SAC topped mixed bed
0 200 400 600 800 10000
1
2
3
4
5
0 200 400 600 800 10000
2
4
6
8
10
12
14
16
Inlet [Gd]
[Gd]
ppm
Time (min)
A
Inlet [Gd]
Time (min)
B
[Gd]
ppm
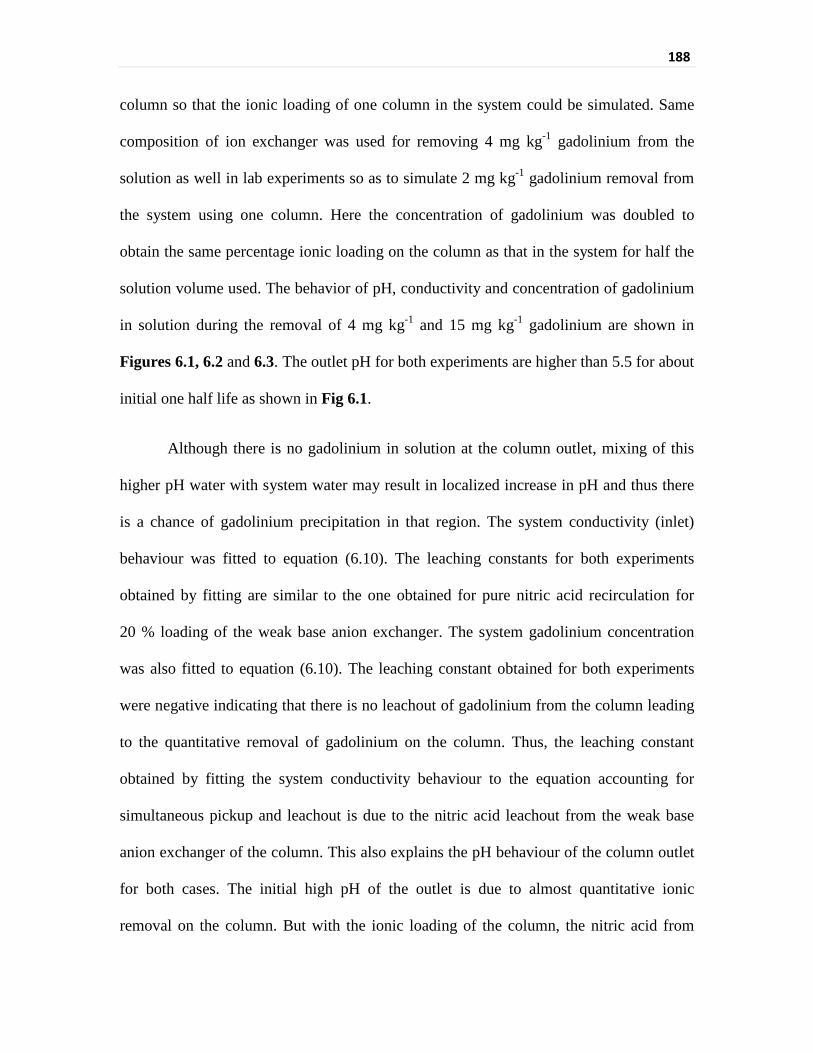
188
column so that the ionic loading of one column in the system could be simulated. Same
composition of ion exchanger was used for removing 4 mg kg-1 gadolinium from the
solution as well in lab experiments so as to simulate 2 mg kg-1 gadolinium removal from
the system using one column. Here the concentration of gadolinium was doubled to
obtain the same percentage ionic loading on the column as that in the system for half the
solution volume used. The behavior of pH, conductivity and concentration of gadolinium
in solution during the removal of 4 mg kg-1 and 15 mg kg-1 gadolinium are shown in
Figures 6.1, 6.2 and 6.3. The outlet pH for both experiments are higher than 5.5 for about
initial one half life as shown in Fig 6.1.
Although there is no gadolinium in solution at the column outlet, mixing of this
higher pH water with system water may result in localized increase in pH and thus there
is a chance of gadolinium precipitation in that region. The system conductivity (inlet)
behaviour was fitted to equation (6.10). The leaching constants for both experiments
obtained by fitting are similar to the one obtained for pure nitric acid recirculation for
20 % loading of the weak base anion exchanger. The system gadolinium concentration
was also fitted to equation (6.10). The leaching constant obtained for both experiments
were negative indicating that there is no leachout of gadolinium from the column leading
to the quantitative removal of gadolinium on the column. Thus, the leaching constant
obtained by fitting the system conductivity behaviour to the equation accounting for
simultaneous pickup and leachout is due to the nitric acid leachout from the weak base
anion exchanger of the column. This also explains the pH behaviour of the column outlet
for both cases. The initial high pH of the outlet is due to almost quantitative ionic
removal on the column. But with the ionic loading of the column, the nitric acid from
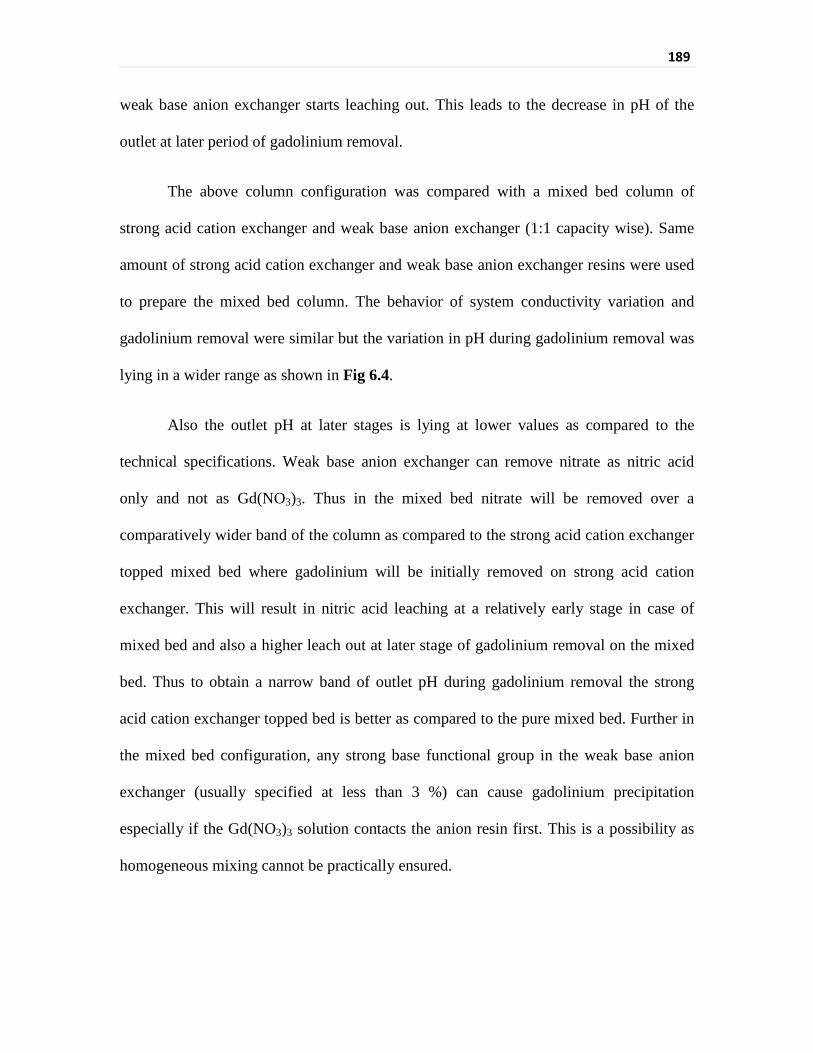
189
weak base anion exchanger starts leaching out. This leads to the decrease in pH of the
outlet at later period of gadolinium removal.
The above column configuration was compared with a mixed bed column of
strong acid cation exchanger and weak base anion exchanger (1:1 capacity wise). Same
amount of strong acid cation exchanger and weak base anion exchanger resins were used
to prepare the mixed bed column. The behavior of system conductivity variation and
gadolinium removal were similar but the variation in pH during gadolinium removal was
lying in a wider range as shown in Fig 6.4.
Also the outlet pH at later stages is lying at lower values as compared to the
technical specifications. Weak base anion exchanger can remove nitrate as nitric acid
only and not as Gd(NO3)3. Thus in the mixed bed nitrate will be removed over a
comparatively wider band of the column as compared to the strong acid cation exchanger
topped mixed bed where gadolinium will be initially removed on strong acid cation
exchanger. This will result in nitric acid leaching at a relatively early stage in case of
mixed bed and also a higher leach out at later stage of gadolinium removal on the mixed
bed. Thus to obtain a narrow band of outlet pH during gadolinium removal the strong
acid cation exchanger topped bed is better as compared to the pure mixed bed. Further in
the mixed bed configuration, any strong base functional group in the weak base anion
exchanger (usually specified at less than 3 %) can cause gadolinium precipitation
especially if the Gd(NO3)3 solution contacts the anion resin first. This is a possibility as
homogeneous mixing cannot be practically ensured.

190
Fig 6.4: Variation of pH during 15 mg kg-1 Gd removal using a mixed bed of SAC and WBA
0 200 400 600 800 1000
4.9
5.0
5.1
5.2
5.3
5.4
5.5
5.6
5.7
5.8
Inlet pH Outlet pH
pH
Time (min)
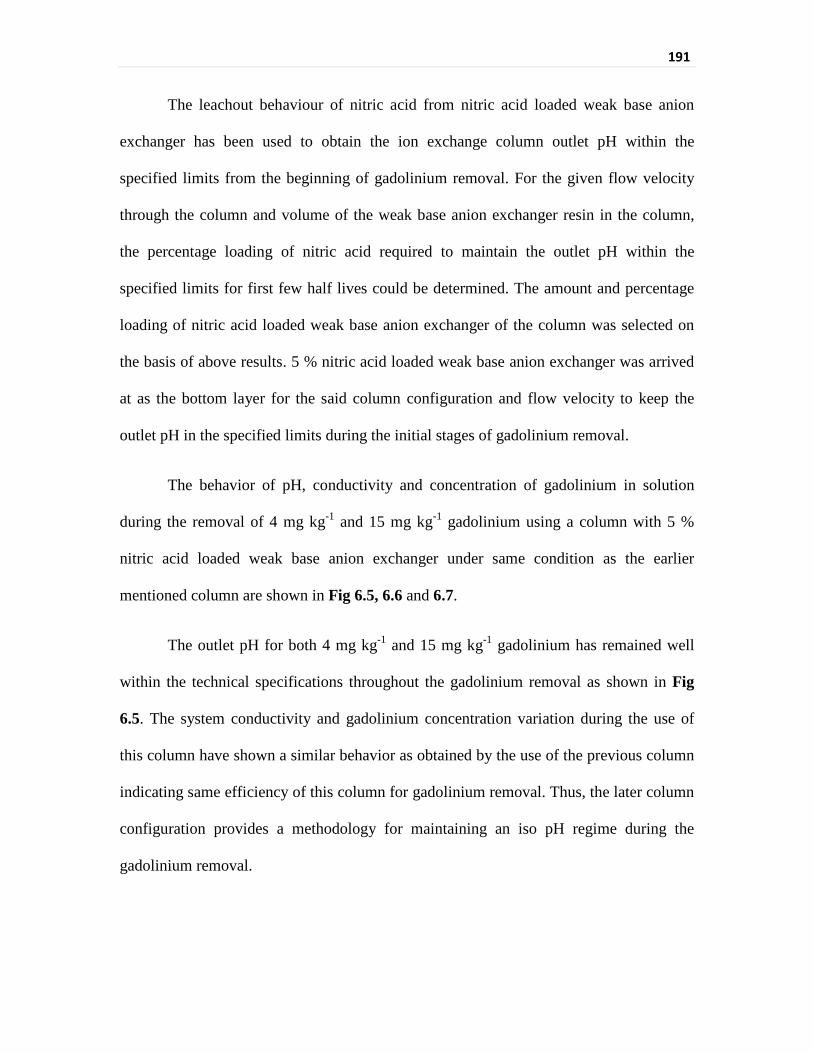
191
The leachout behaviour of nitric acid from nitric acid loaded weak base anion
exchanger has been used to obtain the ion exchange column outlet pH within the
specified limits from the beginning of gadolinium removal. For the given flow velocity
through the column and volume of the weak base anion exchanger resin in the column,
the percentage loading of nitric acid required to maintain the outlet pH within the
specified limits for first few half lives could be determined. The amount and percentage
loading of nitric acid loaded weak base anion exchanger of the column was selected on
the basis of above results. 5 % nitric acid loaded weak base anion exchanger was arrived
at as the bottom layer for the said column configuration and flow velocity to keep the
outlet pH in the specified limits during the initial stages of gadolinium removal.
The behavior of pH, conductivity and concentration of gadolinium in solution
during the removal of 4 mg kg-1 and 15 mg kg-1 gadolinium using a column with 5 %
nitric acid loaded weak base anion exchanger under same condition as the earlier
mentioned column are shown in Fig 6.5, 6.6 and 6.7.
The outlet pH for both 4 mg kg-1 and 15 mg kg-1 gadolinium has remained well
within the technical specifications throughout the gadolinium removal as shown in Fig
6.5. The system conductivity and gadolinium concentration variation during the use of
this column have shown a similar behavior as obtained by the use of the previous column
indicating same efficiency of this column for gadolinium removal. Thus, the later column
configuration provides a methodology for maintaining an iso pH regime during the
gadolinium removal.
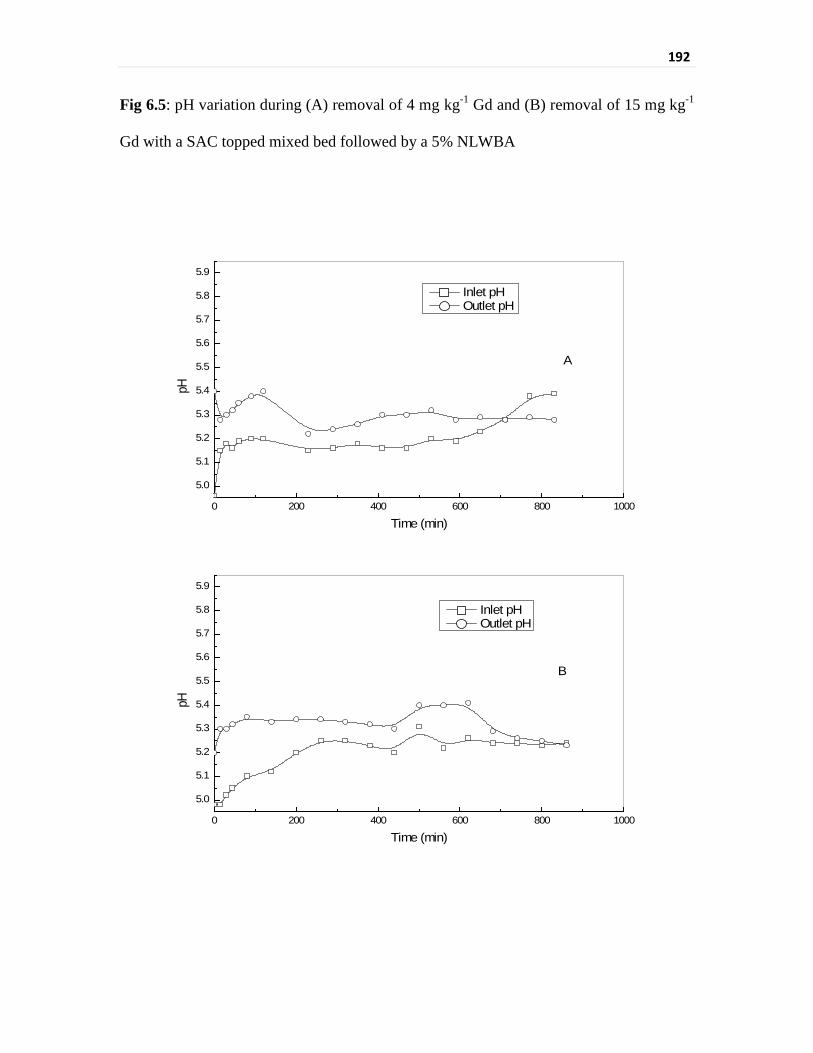
192
Fig 6.5: pH variation during (A) removal of 4 mg kg-1 Gd and (B) removal of 15 mg kg-1
Gd with a SAC topped mixed bed followed by a 5% NLWBA
0 200 400 600 800 1000
5.0
5.1
5.2
5.3
5.4
5.5
5.6
5.7
5.8
5.9
0 200 400 600 800 1000
5.0
5.1
5.2
5.3
5.4
5.5
5.6
5.7
5.8
5.9
Inlet pH Outlet pH
pH
Time (min)
A
pH
Time (min)
Inlet pH Outlet pH
B

193
Fig 6.6: Conductivity variation during (A) removal of 4 mg kg-1 Gd and (B) removal of
15 mg kg-1 Gd with a SAC topped mixed bed followed by a 5% NLWBA
0 200 400 600 800 10000
2
4
6
8
10
12
14
16
0 200 400 600 800 10000
5
10
15
20
25
30
35
40
Inlet conductivity Outlet conductivity
Cond
uctiv
ity (µ
S/cm
)
Time (min)
A
Inlet conductivity Outlet conductivity
Cond
uctiv
ity (µ
S/cm
)
Time (min)
B
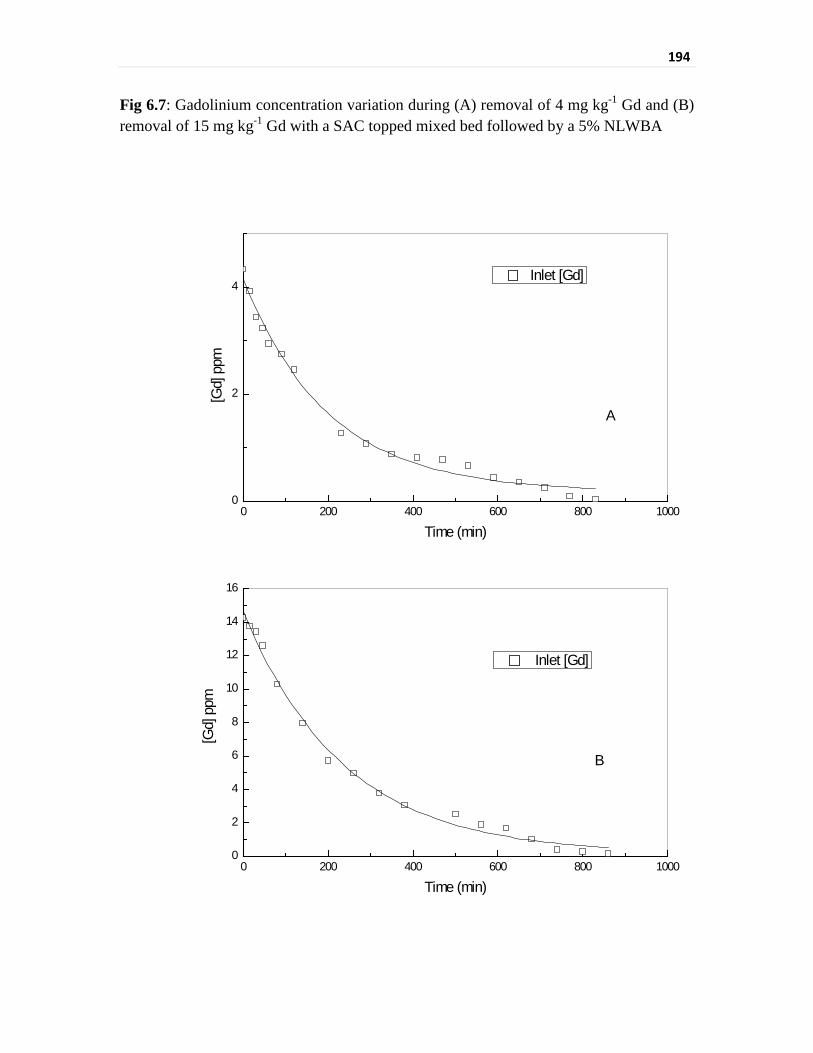
194
Fig 6.7: Gadolinium concentration variation during (A) removal of 4 mg kg-1 Gd and (B) removal of 15 mg kg-1 Gd with a SAC topped mixed bed followed by a 5% NLWBA
0 200 400 600 800 10000
2
4
0 200 400 600 800 10000
2
4
6
8
10
12
14
16
Inlet [Gd]
[Gd]
ppm
Time (min)
A
Inlet [Gd]
Time (min)
B
[Gd]
ppm
195
Summary
Elution of nano pure water through various nitric acid loaded weak base anion
exchangers (NLWBAs) has shown that there is a leachout of nitric acid from the nitric
acid loaded weak base anion exchanger. The fitting of the experimental data to the first
order decrease of the leaching rate has shown a good agreement upto 20% initial loading
of the weak base anion exchanger (WBA). At higher loadings the leaching follows
multiple mode behavior. Elution of different pH nitric acids through nitric acid loaded
weak base resins has shown that the leachout of nitric acid from weak base resin is a
combined effect of mass action and electrostatic repulsion. Recirculation of nitric acid
solution through weak base anion exchanger and nano pure water through nitric acid
loaded weak base anion exchangers has shown that the leaching of nitric acid is governed
by the equilibrium effect.
Gd(NO3)3 removal using a strong acid cation exchanger topped mixed bed of strong
acid cation (SAC) and weak base anion exchanger column led to high column outlet pHs
during initial stages of the run. Strong acid cation exchanger topped mixed bed of strong
acid cation exchanger and weak base anion exchanger has given better result for
gadolinium removal as compared to a similar composition mixed bed under identical
conditions in terms of the pH profile. Use of a 5 % nitric acid loaded weak base anion
exchanger under the given flow velocity and the given available resin capacity has led to
efficient removal of gadolinium while adhering to the technical specification of pH to
remain between 5.0-5.5.
196
6.4 References:
[1] T. Moeller and N. Fogel, J. Am. Chem. Soc., 73 (1951) 4481.
[2] D. Barber and D. H. Lister, Proceedings series of water chemistry and corrosion
problems in nuclear power plants, IAEA, Vienna, Switzerland. Nov. 22-26 (1982).
pp. 149-161.
[3] R. Gilbert, L. Lepine, M. Laurin, L. Ouellet and R. Gauthier, Can. J. Chem. Eng., 63
(1985) 978.
[4] P. Sasikumar, K. Shivakamy, A. L. Rufus, V. K. Mittal, S. Bera, S. Velmurugan, S.
V. Narasimhan, Power plant chemistry, 9 (2007) 34.
[5] G. T. Chandler and M.H. Anderson, WSRC-MS-91-502 (1991).
[6] M. G. Fontana, Corrosion engineering third edition, McGraw-Hill book company,
1987.
[7] E. Matijevic, United States Patent 5015452 (1991).
[8] S. C. Dash, R. S. Sharma, S. Dutta and G. Venkateswaran, BARC Newsletter, 272
(2006) 9.
[9] V. M. Bhandari, V. A. Juvekar and S. R. Patwardhan, Ind. Eng. Chem. Res., 31
(1992) 1060.
[10] M. O. Simonnot, and S. Ouvrard, Chem. Eng. Sci., 60 (2005) 1849.
[11] V. M. Bhandari, T. Yonemoto and V. A. Juvekar, Chem. Eng. Sci., 55 (2000) 6197.
197
CHAPTER-7
Conclusions
Synthesis of vanadium in low oxidation state for its application in
decontamination of nuclear power plants has been studied. The required compound could
be prepared in both aqueous solution as well as in the solid form. Aqueous vanadyl ions
were found to have higher solubility than that of vanadate ions in formic acid media. The
pronounced effect of deprotonation on the higher oxidation state of vanadium results in
this behavior. The conductivity evaluation could clearly indicate the maximum
instantaneous solubility limit for vanadate ions in formic acid medium. The instantaneous
solubility behavior of vanadyl in formic acid medium is complicated by its the tendency
of redissolution.
Studies on electrochemical evaluation of carbon based electrode and stainless steel
electrodes for selection of better cathode material for aqueous vanadium reduction have
shown that carbon based electrodes are more suited for the application. The evaluation of
Tafel plots indicated that a significant part of current is lost in hydrogen evolution by
formic acid reduction on stainless steel electrodes while the acid blocks the active sites on
carbon electrode resulting in reduction of current density. Thus, a higher current
efficiency is obtained for vanadium reduction on carbon based cathode.
Controlled current electrolysis of 350 mM aqueous vandyl formate has resulted in
precipitation of an ionic V(III) compound. The compound readily dissolves in pure water
but subsequently precipitates out as polymer depending upon concentration and ageing
duration. Controlled current electrolysis of vanadate and vanadyl formate solutions with
198
concentrations below 125 mM results in formation of aqueous solution of vanadous
formate.
Chemical reduction of 350 mM vanadyl formate using Zn amalgam has resulted
in precipitation of a vanadous compound. The product has been found to contain traces of
zinc as per the elemental analysis. The chemical formulae of the vanadium compounds
precipitated out by exceeding their solubility limits in the different oxidation states viz.
V(V), V(IV), V(III) and V(II) were determined by a combination of chemical analysis,
spectroscopic techniques, thermogravimetry and XRD. The formulae of the synthesized
compounds were found to be V2O5, VO(HCOO)2⋅H2O, V(OH)(HCOO)2 and
V(HCOO)2⋅2H2O respectively.
In-situ monitoring of the electrolytic synthesis of vanadous formate based on
continuous solution potential monitoring with a redox electrode impressed with a high
frequency alternating voltage to overcome polarization of the electrode has been
developed.
A simple, rapid and sensitive indirect spectrophotometric method has been
developed for redox speciation of aqueous vanadium formate solution. Addition of
known excess vanadate could convert all contiguous redox couples of vanadium formate
into V(V)/V(IV) mixture. V(V) in solution is evaluated by adding Fe(II) and estimating
the Fe(III) formed by the spectrophotometric determination of its sulfosalicylic acid
complex.
Direct spectrophotometric determination of aqueous V(III)/V(II) formate solution
could be achieved by adding thiocyanate as complexing agent. V(II) absorption peaks
199
undergo a blue shift in the thiocyanate media and thereby giving well resolved peaks for
the two aqueous vanadium redox species.
Chromate reduction on magnetite in the presence of γ irradiation follows a
Lagergren’s pseudo first order kinetic model with respect to the applied dose. The extent
of chromate reduction with increasing magnetite amount indicates that the process is a
surface phenomenon.
XPS data has shown a difference in the surface composition of magnetite
equilibrated with chromate due to the effect of irradiation as compared to that of
isothermal equilibration. Thus, the additional pathways of chromate sorption on
magnetite in the presence of gamma irradiation could be ascertained.
Elution of nano pure water through various nitric acid loaded weak base anion
exchangers (NLWBAs) has shown that there is a leach out of nitric acid from the
NLWBA. The fitting of the experimental data to the first order decrease of the leaching
rate has shown a good agreement upto 20% initial loading of the weak base anion
exchanger (WBA). At higher loadings the leaching follows multiple mode behavior.
Recirculation of nitric acid solution through WBA and nano pure water through
NLWBAs has shown that the leaching of nitric acid is governed by the equilibrium
effect.
Gadolinium nitrate removal using a strong acid cation (SAC) topped mixed bed of
SAC and WBA column led to high column outlet pHs during initial stages of the run.
SAC topped mixed bed of SAC and WBA has given better result for gadolinium
removal as compared to a similar composition mixed bed under identical conditions in
terms of the pH profile.

200
Use of a 5% NLWBA under the given flow velocity and the given available resin
capacity was found to accomplish efficient removal of Gd while adhering to the technical
specification of pH to remain between 5.0-5.5.
Future scope of work
The synthesis methodology for the V(II) formate requires further modifications to
improve the yield. At present there is a significant loss of the compound which remains
stuck on the surface of the zinc amalgam. Alternate routes of preparation like using the
V(III) compound synthesized in this study for the electrolytic preparation in a suitable
medium should also be studied. The redissolution methodology for this compound also
requires further investigation to avoid any oxidation during dissolution.
The effect of gamma irradiation on other similar chemical species like
permanganate which are applied in the primary heat transport system for specific purpose
should also be investigated.
The water chemistry control by using ion exchange resins with suitable selectivity
coefficient for the other chemicals used in the sytem should also be investigated. The
chemicals of interest are lithium hydroxide, zinc acetate, monoethanolamine among
others.