Embed Size (px)
Citation preview
Experimental and Numerical Studies of Fuel Spray
By
Daliang Jing
A thesis submitted to
The University of Birmingham
for the degree of
DOCTOR OF PHILOSOPHY
The University of Birmingham
School of Mechanical Engineering
March 2015

University of Birmingham Research Archive
e-theses repository This unpublished thesis/dissertation is copyright of the author and/or third parties. The intellectual property rights of the author or third parties in respect of this work are as defined by The Copyright Designs and Patents Act 1988 or as modified by any successor legislation. Any use made of information contained in this thesis/dissertation must be in accordance with that legislation and must be properly acknowledged. Further distribution or reproduction in any format is prohibited without the permission of the copyright holder.
i
ABSTRACT
In modern Internal Combustion (IC) engines, the fuel spray atomization process is known to
play a key role in affecting mixture formation, combustion efficiency and soot emissions.
Therefore, a thorough understanding of the fuel spray characteristics and atomization process
is of great importance. In this study, the fuel spray of modern Gasoline Direct Injection (GDI)
engines and diesel engines has been experimentally and numerically studied. At the same time,
optimized physical-numerical spray breakup models for the spray simulation have been
developed and validated.
In the gasoline spray study, the effects of injection pressure, injection duration and different
injector nozzle machining methods on the spray characteristics of the GDI engine have been
experimentally studied by using optical approaches such as high-speed photography and a
Phase Doppler Particle Analyzer (PDPA) system. The results show that higher injection
pressure can increase the penetration length and enhance the atomization process due to its
higher injection velocity, stronger turbulence and cavitation phenomenon and greater
aerodynamic force. In addition, the laser drilled injector nozzle can also promote the spray
atomization performance due to its sharp inlet edge and fine inner surface produced by the laser
machining technology. The enhanced turbulence induced by the nozzle’s sharp inlet edge plays
an important role in accelerating the spray breakup and atomization processes.
In terms of the spray study of the diesel engine, the effects of injection pressure, ambient
pressure and different fuels including gasoline, diesel, and their blends – dieseline, on the spray
characteristics, have been experimentally investigated. It is shown that for all the test fuels,
higher injection pressure and higher ambient pressure will enhance the spray atomization
ii
process due to significant cavitation phenomenon, stronger turbulence effects and greater
aerodynamic force. Compared to pure diesel, the recently developed dieseline fuel shows many
advantages in terms of enhancing the spray atomization process. Better atomization
performances can be achieved by increasing the proportion of gasoline in the dieseline fuel;
due to its stronger cavitation phenomenon, higher volatility, lower surface tension and lower
viscosity.
According to the different spray characteristics and breakup regimes induced by injector
parameters, injection pressures and ambient conditions between the GDI and diesel engines,
two different spray breakup models for the gasoline and diesel spray simulations have been
respectively proposed in the numerical studies. The breakup model for the gasoline spray
simulation is improved by considering the turbulence-induced breakup mechanism in the study.
While for the diesel spray simulation, the breakup model is enhanced by accounting for the
cavitation phenomenon as well as the turbulence effect into the modelling. Both of the models
are implemented in the Computational Fluid Dynamics (CFD) code and validated with the
high-speed imaging and PDPA experiments. The simulation results of the proposed models are
in good agreement with the experiment data and show significant improvements compared to
the results of the current existing spray atomization models.
iii
ACKNOWLEDGEMENTS
First and foremost, I would like to express my sincere gratitude to my supervisor, Professor
Hongming Xu, for his careful supervision, valuable suggestions and constant encouragement
throughout my PhD study. At the same time, I would also like to thank my associate supervisor,
Professor Miroslaw Lech Wyszynski, who gave me helpful suggestions.
I am also grateful to Professor Shijin Shuai, Professor Zhi Wang, Professor Jianxin Wang,
Professor Xin He, Senior Engineer Jianhua Xiao, Dr. Xiao Ma and Dr. Zhelin Dong from
Tsinghua University for their continual guidance and support in the CFD work during my two
years’ study at Tsinghua University.
I acknowledge the support of Jaguar Land Rover (JLR), Shell and Advantage West Midlands;
without their equipment and financial support, I could not have finished my PhD study. Special
thanks go to Dr. Cao Li and Dr. Paul Dunkley from JLR who gave me instructive advice and
useful suggestions on my research work.
I am also grateful to all of my colleagues at the Future Power Systems group for their support
and companionship. In particular, many thanks go to Dr. Yanfei Li and Dr. Xiao Ma, for their
guidance during the first year of my PhD study; and to Dr. Fan Zhang, Changzhao Jiang,
Powen-Tu and Haichun Ding for their great help in the experiments.
Finally, I would like to extend my gratitude to my beloved parents and family who have been
assisting, supporting and caring for me all of my life.

iv
I would like to dedicate this thesis to my parents, teachers and friends for their
great support through all these years.
v
CONTENTS
1
ABSTRACT .............................................................................................................................. i
ACKNOWLEDGEMENTS ................................................................................................... iii
CONTENTS .............................................................................................................................. v
LIST OF ABBREVIATIONS ............................................................................................... xi
LIST OF SYMBOLS ........................................................................................................... xiv
LIST OF FIGURES ............................................................................................................. xix
LIST OF TABLES ............................................................................................................. xxvi
LIST OF PUBLICATIONS .............................................................................................. xxvii
CHAPTER 1 INTRODUCTION ........................................................................................... 1
1.1 Background ................................................................................................................. 1
1.1.1 Energy Demand and Emission Regulations ......................................................... 1
1.1.2 Direct Injection Engines ....................................................................................... 7
1.1.3 Fuel Spray ............................................................................................................ 9
1.2 Research Objectives .................................................................................................. 10
1.3 Thesis Outline ............................................................................................................ 11
CHAPTER 2 LITERATURE REVIEW ............................................................................. 14
2.1 Fuel Spray Characteristics ......................................................................................... 14
2.1.1 Spray Structure ................................................................................................... 14
2.1.2 Spray Penetration and Spray Cone Angle .......................................................... 17
vi
2.1.3 Droplet Size and Velocity .................................................................................. 20
2.2 Breakup Regimes ...................................................................................................... 22
2.2.1 Breakup Classification ....................................................................................... 23
2.2.2 Atomization ........................................................................................................ 28
2.2.3 Secondary Breakup ............................................................................................ 32
2.3 CFD Approaches for Spray Simulation ..................................................................... 34
2.3.1 Continuous Droplet Model (CDM) .................................................................... 34
2.3.2 Discrete Droplet Model (DDM) ......................................................................... 35
2.4 Spray Breakup Models .............................................................................................. 36
2.4.1 Primary Breakup Models ................................................................................... 36
2.4.2 Secondary Breakup Models ............................................................................... 45
2.4.3 Combined Models .............................................................................................. 48
2.5 Summary ................................................................................................................... 49
CHAPTER 3 RESEARCH METHODOLOGY ................................................................. 50
3.1 Experimental Approaches ......................................................................................... 50
3.1.1 Fuel Injection System ......................................................................................... 51
3.1.2 Pressure Vessel................................................................................................... 54
3.1.3 Image Acquisition System ................................................................................. 60
3.1.4 PDPA System ..................................................................................................... 64
3.1.5 Ventilation System ............................................................................................. 69
3.2 Numerical Methods ................................................................................................... 70
vii
3.2.1 KIVA Calculation Code ..................................................................................... 70
3.2.2 EnSight Post-processing Program ...................................................................... 76
3.3 Summary ................................................................................................................... 77
CHAPTER 4 SPRAY CHARACTERISTICS OF GDI ENGINES .................................. 78
4.1 Introduction ............................................................................................................... 78
4.2 Experimental Conditions ........................................................................................... 80
4.3 Results and Discussion .............................................................................................. 82
4.3.1 Spray Morphology Evolution ............................................................................. 82
4.3.2 Effect of Injection Pressure on Spray Penetration and Spray Angle ................. 83
4.3.3 Effect of Injection Duration on Spray Penetration and Spray Angle ................. 86
4.3.4 Effect of Injection Pressure on Droplet Velocity and Droplet Size ................... 89
4.3.5 Effect of Injection Duration on Droplet Velocity and Droplet Size .................. 93
4.3.6 Droplet Velocity and Droplet Size Spatial Distributions ................................... 96
4.3.7 Validations of the Analyses ............................................................................... 98
4.4 Summary ................................................................................................................. 102
CHAPTER 5 SPRAY CHARACTERISTICS OF DIESEL ENGINES ......................... 104
5.1 Introduction ............................................................................................................. 104
5.2 Experimental Conditions ......................................................................................... 106
5.3 Results and Discussion ............................................................................................ 109
5.3.1 Macroscopic Comparison of Diesel and Dieseline Sprays .............................. 109
viii
5.3.2 Penetration Comparison of Diesel and Dieseline Sprays under Different
Gasoline/Diesel Blending Ratios ................................................................................... 110
5.3.3 Penetration Comparison of Diesel and Dieseline Sprays under Different Injection
Pressures and Ambient Pressures ................................................................................... 114
5.3.4 Droplet Size and Velocity Comparison of Diesel and Dieseline Sprays under
Different Gasoline/Diesel Blending Ratios .................................................................... 117
5.3.5 Droplet Size Comparison of Diesel and Dieseline Sprays under Different
Injection Pressures ......................................................................................................... 120
5.3.6 Fuel Droplet Size and Velocity Distribution .................................................... 122
5.4 Summary ................................................................................................................. 127
CHAPTER 6 GASOLINE SPRAY MODEL DEVELOPMENT AND
VALIDATION ......... ............................................................................................................ 129
6.1 Introduction ............................................................................................................. 129
6.2 Gasoline Spray Model Development ...................................................................... 131
6.2.1 TL-KHRT Breakup Model ............................................................................... 131
6.2.2 Model Computing Process ............................................................................... 135
6.3 Simulation Settings .................................................................................................. 136
6.4 Validation Experiment ............................................................................................ 137
6.5 Validations and Discussion ..................................................................................... 138
6.5.1 Spray Penetration ............................................................................................. 138
6.5.2 Droplet Velocity ............................................................................................... 141
6.5.3 Droplet Size ...................................................................................................... 144
ix
6.5.4 Breakup Statistical Analysis ............................................................................ 148
6.6 Summary ................................................................................................................. 150
CHAPTER 7 DIESEL SPRAY MODEL DEVELOPMENT AND VALIDATION ..... 152
7.1 Introduction ............................................................................................................. 152
7.2 Diesel Spray Model Development .......................................................................... 154
7.2.1 KH-ACT Breakup Model ................................................................................. 154
7.2.2 EACT Breakup Model ..................................................................................... 156
7.2.3 Model Computing Process ............................................................................... 159
7.3 Simulation Settings .................................................................................................. 160
7.4 Validation Experiments ........................................................................................... 161
7.5 Validations and Discussion ..................................................................................... 162
7.5.1 Spray Morphography Comparison ................................................................... 162
7.5.2 Spray Penetration ............................................................................................. 163
7.5.3 Droplet Velocity ............................................................................................... 165
7.5.4 Droplet Size ...................................................................................................... 167
7.5.5 Breakup Statistical Analysis ............................................................................ 169
7.6 Summary ................................................................................................................. 172
CHAPTER 8 CONCLUSIONS AND RECOMMENDATIONS .................................... 174
8.1 Conclusions ............................................................................................................. 174
8.1.1 Spray Characteristics of GDI Engines ............................................................. 174
8.1.2 Spray Characteristics of Diesel Engines .......................................................... 175
x
8.1.3 Gasoline Spray Model Development and Validation....................................... 176
8.1.4 Diesel Spray Model Development and Validation .......................................... 177
8.2 Recommendations ................................................................................................... 177
8.2.1 Detailed Modelling of Fuel Spray .................................................................... 177
8.2.2 Engineering Simplification of Fuel Spray Modelling ...................................... 178
8.2.3 Supercritical Spray Modelling ......................................................................... 179
APPENDIX A ....................................................................................................................... 180
APPENDIX B ....................................................................................................................... 181
REFERENCES ..................................................................................................................... 184
xi
LIST OF ABBREVIATIONS
AC Alternating Current
ALE Arbitrary Lagrangian Eulerian
AMD Average Mean Diameter
ASOI After the Start of Injection
CDM Continuous Droplet Model
CEI Computational Engineering International
CFD Computational Fluid Dynamics
CO Carbon Monoxide
CO2 Carbon Dioxide
CVV Constant Volume Vessel
DDM Discrete Droplet Model
DI Direct Injection
DISI Direct Injection Spark Ignition
DNS Direct Numerical Simulation
EACT Enhanced-Kelvin-Helmholtz-Aerodynamics-Cavitation-
Turbulence
ECU Electronic Control Unit
EIA Energy Information Administration
EN590 European standard diesel
ERC Engine Research Centre
EU European Union
FEM Finite Element Model
xii
G0 Pure diesel
G100 Pure gasoline
G20 20% gasoline blended dieseline
G50 50% gasoline blended dieseline
G70 70% gasoline blended dieseline
GDI Gasoline Direct Injection
HC Unburned Hydrocarbon
IC Internal Combustion
ICE Internal Combustion Engine
IMEP Indicated Mean Effective Pressure
ISFC Indicated Specific Fuel Consumption
JLR Jaguar Land Rover
KH-ACT Kelvin-Helmholtz-Aerodynamics-Cavitation-Turbulence
KHRT Kelvin-Helmholtz & Rayleigh-Taylor
LDV Laser Doppler Velocimetry
LIF Laser-induced Fluorescence
MD Mean Diameter
NI National Instruments
NOx Nitrogen Oxides
PDA Phase Doppler Anemometry
PDF Probability Distribution Function
PDPA Phase Doppler Particle Analyzer
PIV Particle Imaging Velocimetry
PM Particle Matters
PPCI Partially Premixed Compression Ignition
xiii
RT Rayleigh-Taylor
SI Spark Ignition
SMD Sauter Mean Diameter
TAB Taylor Analogy Breakup
TL-KHRT Turbulence-Ligament- Kelvin-Helmholtz & Rayleigh-Taylor
ULG95 The 95 octane gasoline
US United States of America
xiv
LIST OF SYMBOLS
a The droplet acceleration
Ap Surface area
B0 Size constant in KH model
B1 Time constant in KH model
C0 Size constant in RT model
C1 Time constant in RT model
Ca The area contraction coefficient
Ccri The transition switch parameter in EACT model
Cd The discharge coefficient
CT,CAV Model constant in EACT model
Cu Turbulence model constant
CV The orifice velocity contraction coefficient
D The nozzle diameter
D32 Sauter Mean Diameter (SMD)
Di The droplet size of parcel i
Dl The ligament diameter
dp Droplet size
ds Surface diameter
dv Volume diameter
fs The source term due to collision, coalescence, breakup etc
Fs The rate of momentum gain per unit volume due to the spray
xv
ĝ The specific body force vector
I The specific internal energy (exclusive of chemical energy)
Ĵ The heat flux vector including turbulent heat conduction and
enthalpy diffusion K(t) The turbulent kinetic energy
K0 The initial turbulent kinetic energy
Kc A constant taking into account losses in the contraction corner
kl Size constant in TL-KHRT model
Ks A constant for average turbulent energy dissipation
kt The breakup time constant in TL-KHRT model
kTL Model constant in TL-KHRT model
Ktw Model constant of the turbulence-induced breakup
L The nozzle length
Lbu The primary breakup length
LCAV The cavitation-induced breakup length scale
LKH The aerodynamics breakup length scale
Lt Turbulence length scale
Lt0 The initial turbulence length scale
LTL The characteristic breakup length scale in TL-KHRT model
Ltw The characteristic length scale of turbulence-induced breakup
Lw Wavelength of surface perturbations
ms Parameter in relation to gas density
Ni The droplet number in parcel i
ns Parameter in relation to pressure difference
Oh Ohnesorge number
xvi
p The fluid pressure
Pa Back pressure
Pinj Injection pressure
pv Fuel vapour pressure
Qc The source terms due to chemical heat release
Qs The source terms due to spray interaction
r Parent drop radius
RCAV The effective radius of an equivalent bubble from the nozzle
rKH Child droplet size in KHRT model
s The area contraction ratio of the nozzle hole
S1 Spray penetration length for stage 1
S2 Spray penetration length for stage 2
t Time
tb The time before breakup
Tp Droplet temperature
u The injection velocity
U The initial liquid velocity at the nozzle exit
û Fluid velocity vector
upi Droplet velocity
ur The droplet relative velocity
Vp Volume of the particle
Weg Gas Weber number
Wel The ligament Weber number
xi Droplet position
xvii
Δf The frequency of the intensity signal
Δs The distance between the fringe
Δt The flash pulse width
The vector operator
Greek Symbols
µl The dynamic viscosity of the liquid
ɛ The dissipation rate of turbulent kinetic energy
ʋ0‘ The average cross stream velocity fluctuation at jet exit
αs Parameter in relation to nozzle diameter
βs Parameter in relation to time
ε(t) The turbulent dissipation rate
ε0 The initial turbulent dissipation rate
θ Spray dispersion angle
κ Turbulent kinetic energy
ρ The total mass density
ρa Ambient gas density
ρl Fuel/Liquid density
ρm The mass density of species m
ρmc Source terms due to chemical reaction
ρms Source terms due to spray evaporation
σ Surface tension
τCAV The cavitation-induced breakup time scale
τKH The aerodynamics breakup time scale
xviii
τt Turbulence time scale
τt0 The initial turbulence time scale
τTL The characteristic breakup time scale in TL-KHRT model
τtw The characteristic time scale of turbulence-induced breakup
τw Wave growth time
Subscripts and Superscripts
a Stands for ambient
b Stands for breakup
c Stands for chemical reaction
CAV Stands for Cavitation
d Stands for discharge
g Stands for gas phase
inj Stands for injection
KH Stands for Kelvin-Helmholtz
l Stands for liquid phase
p Stands for parcel
s Stands for spray
T Stands for Turbulence
TL Stands for Turbulence-Ligament
tw Stands for turbulence wave
V Stands for volume
xix
LIST OF FIGURES
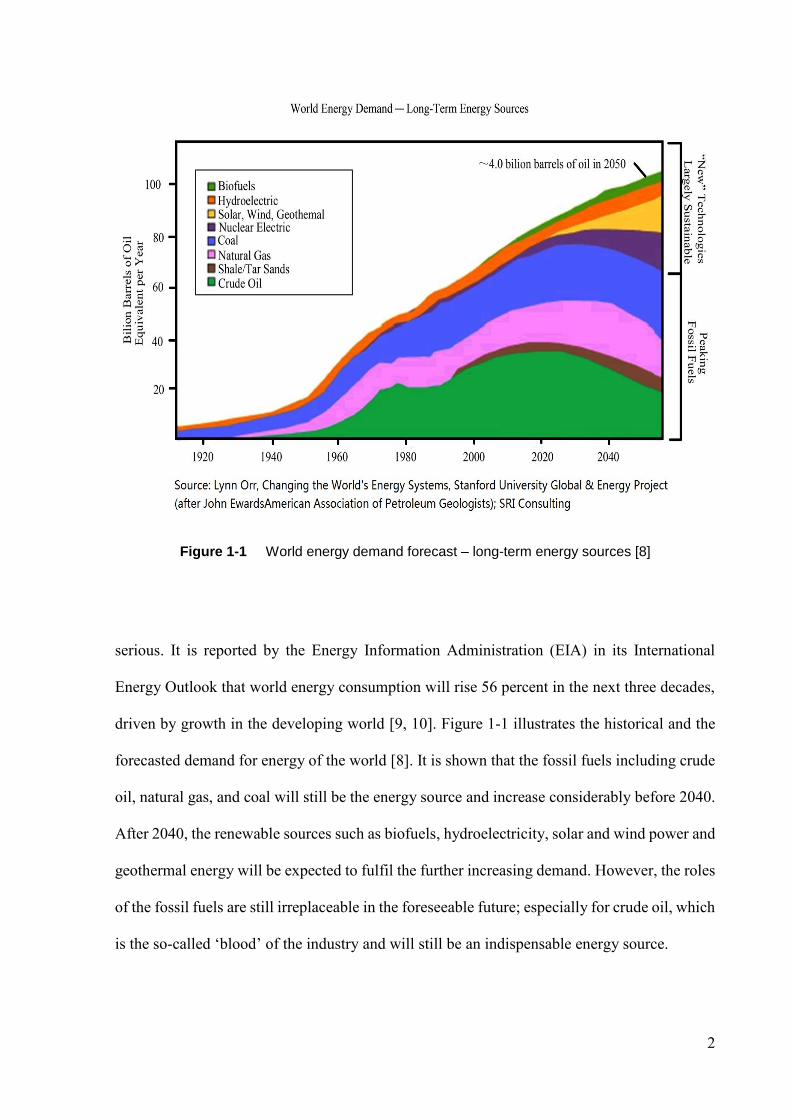
Figure 1-1 World energy demand forecast – long-term energy sources ............................... 2
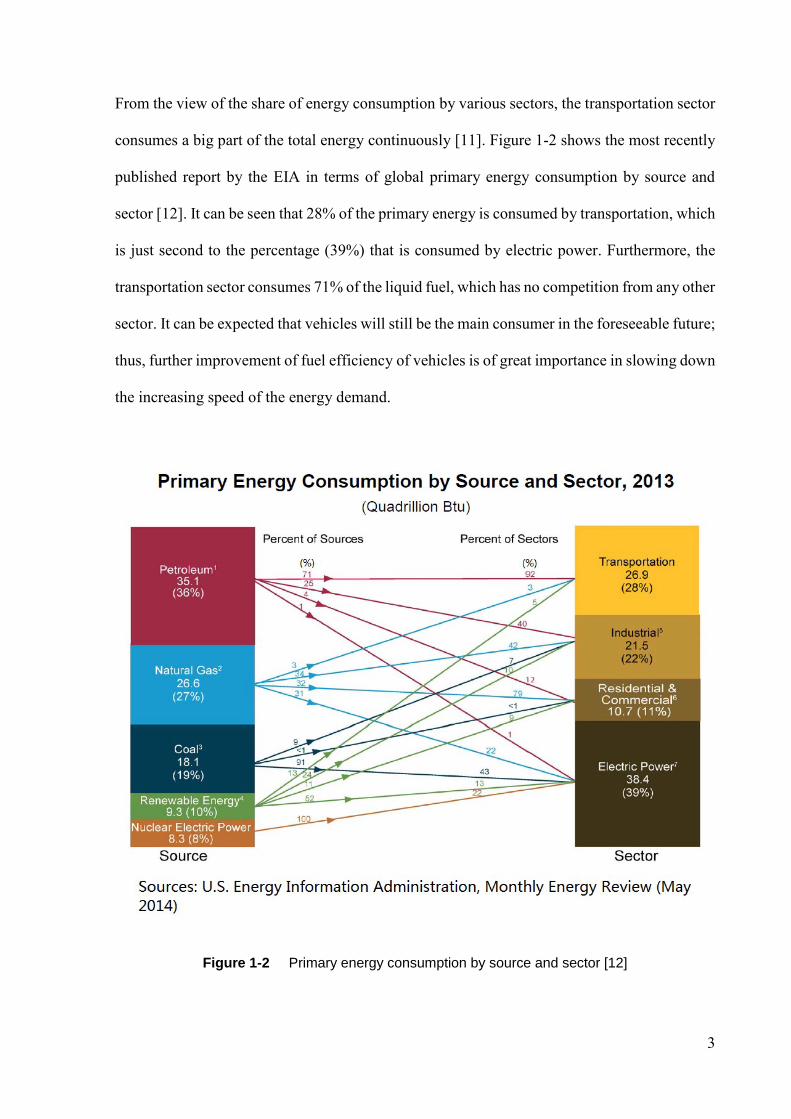
Figure 1-2 Primary energy consumption by source and sector ............................................. 3
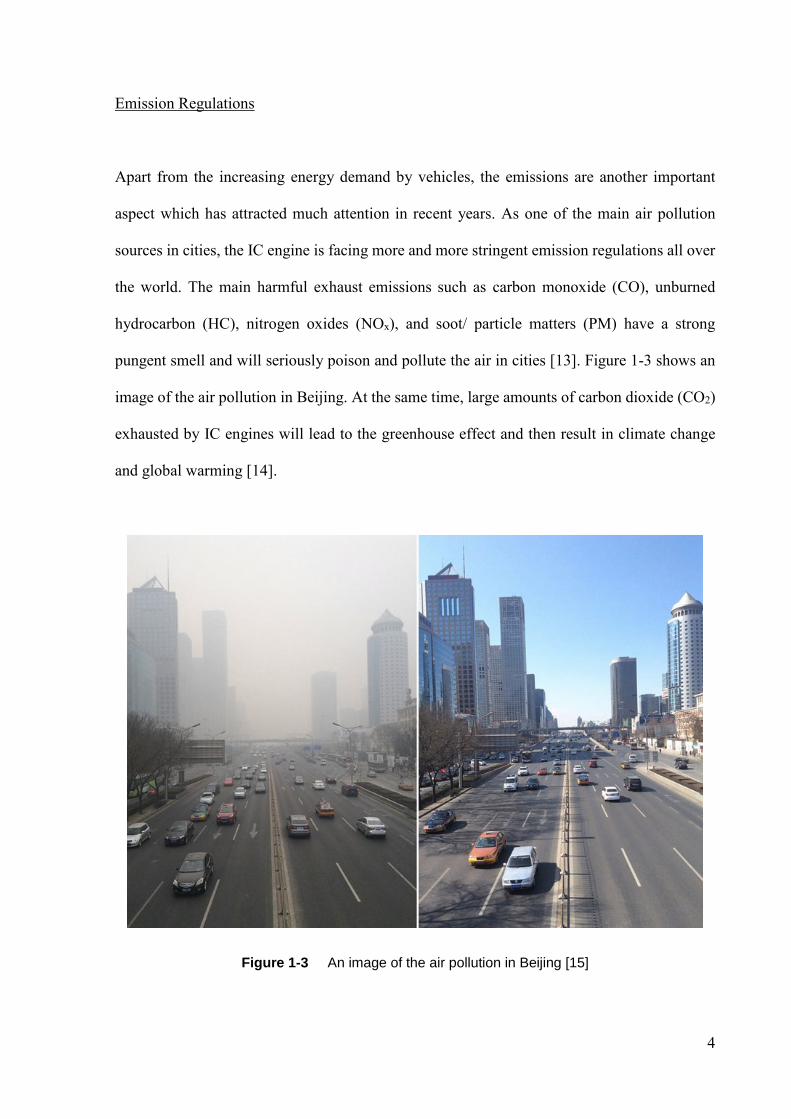
Figure 1-3 An image of the air pollution in Beijing .............................................................. 4
Figure 1-4 Global CO2 emission regulations for passenger cars .......................................... 6
Figure 1-5 Schematic of an DISI engine cylinder ................................................................. 7
Figure 1-6 Examples of direct injection spray images .......................................................... 9
Figure 2-1 Schematic of full-cone spray structure .............................................................. 15
Figure 2-2 Sample of droplet velocity (left) and droplet size (right) of PDPA test ............ 21
Figure 2-3 The classification of breakup regimes ............................................................... 23
Figure 2-4 Schematic of the four types of breakup: Rayleigh breakup, first wind-induced
breakup, second wind-induced breakup, and the atomization regime ..................................... 24
Figure 2-5 Ohnesorge diagram: jet break-up regimes ......................................................... 26
Figure 2-6 Schematic diagram of the 3D classification of the breakup regimes ............... 27
Figure 2-7 Schematic of the aerodynamically-induced breakup ......................................... 29
Figure 2-8 Schematic of the turbulence-induced breakup .................................................. 30
Figure 2-9 Schematic of the cavitation-induced breakup.................................................... 31
Figure 2-10 Relaxation of the velocity profile .................................................................... 32
Figure 2-11 The classification of different types of breakup according to Weber No. ....... 33
Figure 2-12 Schematic of the DDM model and an example of the simulated spray .......... 36
Figure 2-13 Schematic of the Blob Method ........................................................................ 37
Figure 2-14 Schematic of the wave model .......................................................................... 38
Figure 2-15 Schematic of the cavitation phenomenon ........................................................ 42
Figure 2-16 Schematic of the TAB model .......................................................................... 45
xx
Figure 2-17 Schematic of the RT breakup model ............................................................... 46
Figure 2-18 KH-RT breakup model .................................................................................... 48
Figure 3-1 Schematic of the experimental setup ................................................................. 50
Figure 3-2 Schematic diagram of the diesel common rail .................................................. 52
Figure 3-3 Fuel injection control units (left) and injector driver (right) ............................. 53
Figure 3-4 Schematic diagram of the gasoline fuel supply system ..................................... 54
Figure 3-5 Image of the high pressure CVV ....................................................................... 55
Figure 3-6 Schematic of the high pressure CVV ................................................................ 56
Figure 3-7 Three different mounting orientations of the injector ....................................... 57
Figure 3-8 Schematic of the high speed photography setup ............................................... 58
Figure 3-9 Image of the low pressure CVV ........................................................................ 59
Figure 3-10 Image of the high-speed cameras: Phantom V12 (left) and Shimadzu HPV-2
(right)........................................................................................................................................ 60
Figure 3-11 LabVIEW interface of the signal synchronization .......................................... 61
Figure 3-12 The sequence of signals for image acquisition synchronization ..................... 62
Figure 3-13 Flow chart of the image post-processing ......................................................... 63
Figure 3-14 Image and schematic of the PDPA instrument ................................................ 64
Figure 3-15 Schematic of the formation of the interference fringe pattern ........................ 65
Figure 3-16 Schematic of the principle of the LDV............................................................ 65
Figure 3-17 Schematic of the phenomena of light scattering ............................................. 67
Figure 3-18 The relationship between the phase difference and the droplet size ............... 68
Figure 3-19 The solution of the 2π ambiguity .................................................................... 68
Figure 3-20 Images of the interface of the KIVA-3V2 ERC calculation program ............. 71
Figure 3-21 Flow chart of the calculation process of KIVA-3V2 ERC .............................. 72
Figure 3-22 An example of the pre-processing program .................................................... 73
xxi
Figure 3-23 Image of the EnSight user interface ................................................................ 76
Figure 4-1 The second generation spray-guided and the first generation wall/air-guided
stratified-charge system ........................................................................................................... 79
Figure 4-2 Schematic of PDPA test points.......................................................................... 81
Figure 4-3 Spray evolution at injection pressure of 150 bar and 1 ms duration ................. 82
Figure 4-4 Schematic of the sharp inlet edge and sprays of the LD injector ...................... 83
Figure 4-5 Effect of injection pressure on spray penetration (atmospheric back pressure, 1
ms injection duration) .............................................................................................................. 84
Figure 4-6 Effect of injection pressure on spray angle (atmospheric back pressure, 1 ms
injection duration) .................................................................................................................... 86
Figure 4-7 Effect of injection duration on spray penetration (atmospheric back pressure, 150
bar injection pressure) .............................................................................................................. 88
Figure 4-8 Effect of injection duration on spray angle (atmospheric back pressure, 150 bar
injection pressure) .................................................................................................................... 88
Figure 4-9 Effect of injection pressure on droplet velocity (vertical component, 1 ms
injection duration, at a vertical position of 30 mm) ................................................................. 90
Figure 4-10 Effect of injection pressure on droplet velocity (horizontal component, 1 ms
injection duration, at a vertical position of 30 mm) ................................................................. 90
Figure 4-11 Effect of injection pressure on droplet size (1 ms injection duration, at a vertical
position of 30mm) .................................................................................................................... 92
Figure 4-12 Effect of injection duration on droplet velocity (vertical component, 100 bar
injection pressure, at a vertical position of 30 mm) ................................................................. 94
Figure 4-13 Effect of injection duration on droplet velocity (horizontal component, 100 bar
injection pressure, at a vertical position of 30 mm) ................................................................. 94
xxii
Figure 4-14 Effect of injection duration on droplet size (100 bar injection pressure, at a
vertical position of 30 mm) ...................................................................................................... 95
Figure 4-15 Droplet velocity evolution at different vertical positions (100 bar injection
pressure, 1 ms injection duration) ............................................................................................ 97
Figure 4-16 Droplet size evolution at different vertical positions (100 bar injection pressure,
1 ms injection duration) ........................................................................................................... 97
Figure 4-17 Schematic of the sharp inlet edge of the nozzle .............................................. 98
Figure 4-18 The comparison of the turbulence kinetic energy inside the nozzle ............... 99
Figure 4-19 The comparison of the turbulence kinetic energy at the nozzle exit ............... 99
Figure 4-20 The comparison of the velocity distribution inside the nozzle ...................... 100
Figure 4-21 The comparison of the velocity distribution at the nozzle exit ..................... 101
Figure 5-1 PDPA testing positions for dieseline ............................................................... 109
Figure 5-2 Spray images of diesel, G50 and G100, injection pressure 500 bar, back pressure
15 bar ...................................................................................................................................... 110
Figure 5-3 Effect of gasoline/diesel blending ratio on penetrations of diesel and dieseline
sprays (1000 bar injection pressure) ...................................................................................... 113
Figure 5-4 Effect of ambient pressure on penetrations of diesel, dieseline (G50), and gasoline
(G100) sprays under different injection pressures ................................................................. 115
Figure 5-5 Effect of injection pressure on penetrations of dieseline (G50) and gasoline (G100)
sprays (15 bar ambient pressure)............................................................................................ 116
Figure 5-6 Effect of gasoline/diesel blending ratio on droplet mean diameter (MD) under
different injection pressures (position of 40 mm, 1 bar ambient pressure) ............................ 117
Figure 5-7 Effect of gasoline/diesel blending ratio on droplet sauter mean diameter (SMD)
under different injection pressures (position of 40 mm, 1 bar ambient pressure).................. 118
xxiii
Figure 5-8 Effect of gasoline/diesel blending ratio on mean droplet velocity under different
injection pressures (position of 40 mm, 1 bar ambient pressure) .......................................... 119
Figure 5-9 Effect of injection pressure on droplet mean diameter (MD) under different
gasoline/diesel blending ratios (position of 40 mm, 1 bar ambient pressure) ........................ 121
Figure 5-10 Effect of injection pressure on droplet Sauter Mean Diameter (SMD) under
different gasoline/diesel blending ratios (position of 40 mm, 1 bar ambient pressure) ......... 121
Figure 5-11 Droplet mean diameter (MD) distribution along the spray axis (750 bar injection
pressure, 1 bar ambient pressure) ........................................................................................... 123
Figure 5-12 Droplet Sauter Mean Diameter (SMD) distribution along the spray axis (750
bar injection pressure, 1 bar ambient pressure) ...................................................................... 123
Figure 5-13 Droplet mean velocity of dieseline (G50) at different positions (750 bar injection
pressure, 1 bar ambient pressure) ........................................................................................... 124
Figure 5-14 Droplet size distribution of diesel, G50, and gasoline (750 bar injection pressure)
................................................................................................................................................ 126
Figure 6-1 A simplified ligament along the flow surface ................................................. 133
Figure 6-2 Flow chart of the proposed TL-KHRT model ................................................. 135
Figure 6-3 Numerical grid for the gasoline spray simulation ........................................... 136
Figure 6-4 Schematic of the PDPA test positions of gasoline spray validation experiment
................................................................................................................................................ 138
Figure 6-5 Comparison of the effect of different breakup models on gasoline spray
penetration (100 bar) .............................................................................................................. 139
Figure 6-6 Comparison of the effect of different breakup models on gasoline spray
penetration (200 bar) .............................................................................................................. 139
Figure 6-7 Comparison of the effect of different breakup models on the gasoline spray
morphography (100 bar and 200 bar)..................................................................................... 141
xxiv
Figure 6-8 Comparison of the effect of different gasoline spray breakup models on droplet
axial mean velocity (100 bar, 38 mm) ................................................................................... 142
Figure 6-9 Comparison of the effect of different gasoline spray breakup models on droplet
axial mean velocity (200 bar, 38 mm) ................................................................................... 142
Figure 6-10 Comparison of the effect of different gasoline spray breakup models on droplet
AMD evolution (100 bar, 38 mm) ......................................................................................... 145
Figure 6-11 Comparison of the effect of different gasoline spray breakup models on droplet
AMD evolution (200 bar, 38 mm) ......................................................................................... 145
Figure 6-12 Comparison of the effect of different gasoline spray breakup models on droplet
SMD evolution (100 bar, 38 mm) .......................................................................................... 147
Figure 6-13 Comparison of the effect of different gasoline spray breakup models on droplet
SMD evolution (200 bar, 38 mm) .......................................................................................... 147
Figure 6-14 Breakup statistical analysis of the TL-KHRT model (100 bar) .................... 149
Figure 6-15 Breakup statistical analysis of the TL-KHRT model (200 bar) .................... 149
Figure 7-1 Comparison of KH-RT, KH-ACT and EACT models .................................... 158
Figure 7-2 Flow chart of the EACT model ....................................................................... 159
Figure 7-3 Numerical grid of diesel spray simulation ...................................................... 160
Figure 7-4 Comparison between experiment and simulated spray shape evolution ......... 162
Figure 7-5 Comparison of the effect of different breakup models on spray penetration .. 164
Figure 7-6 Comparison of the effect of different Ccri values on spray penetration ........... 164
Figure 7-7 Comparison of the effect of different breakup models on droplet axial mean
velocity ................................................................................................................................... 166
Figure 7-8 Comparison of the effect of different Ccri values on droplet axial mean velocity
................................................................................................................................................ 167
Figure 7-9 Comparison of the effect of different breakup models on droplet SMD ......... 168

xxv
Figure 7-10 Comparison of the effect of different Ccri values on droplet SMD ............... 169
Figure 7-11 Breakup counting in each sub-mechanism of EACT model ......................... 171
Figure 8-1 An example of the DNS result of the liquid spray .......................................... 178
Figure 8-2 An example of supercritical spray ................................................................... 179
xxvi
LIST OF TABLES
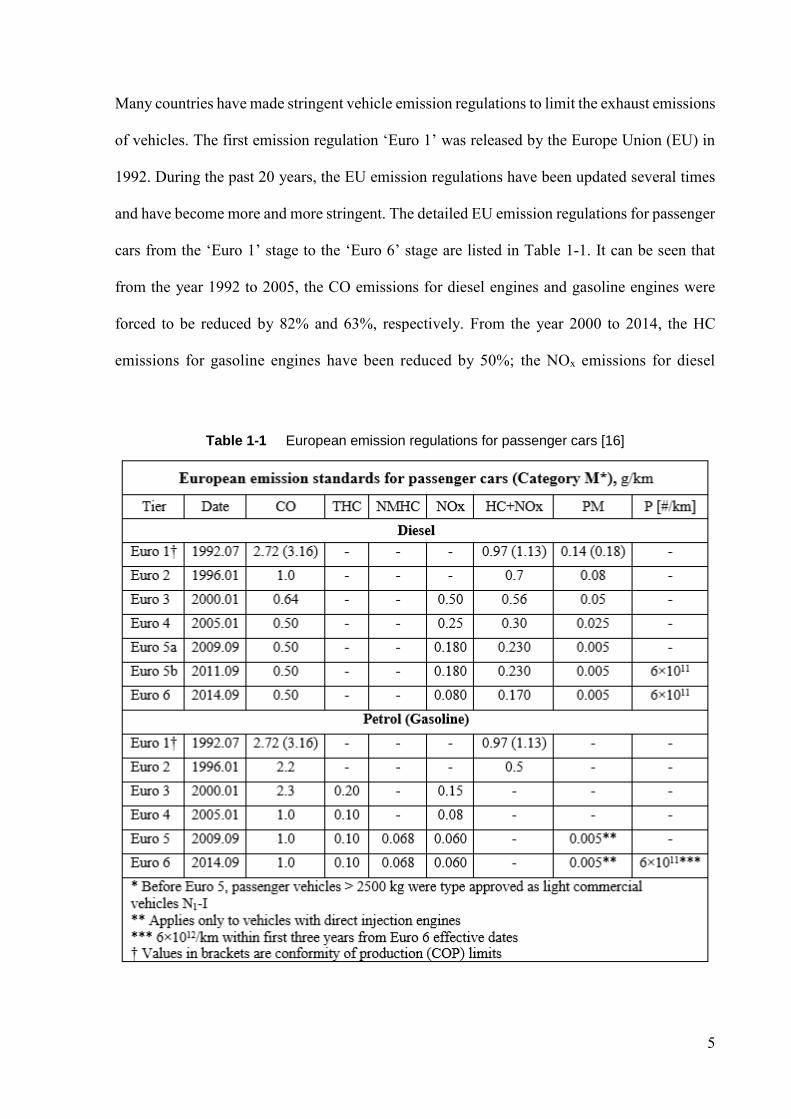
Table 1-1 European emission regulations for passenger cars ............................................... 5
Table 2-1 Exponents on variables in Equation 2-6 ............................................................. 20
Table 2-2 Combined breakup models ................................................................................. 49
Table 3-1 Specifications of the Phantom V12 and Shimadzu HPV-2 Cameras.................. 60
Table 3-2 Commonly used scattering angle ranges ............................................................. 66
Table 4-1 Injector specifications ......................................................................................... 81
Table 4-2 Specification of PDPA system ............................................................................ 81
Table 4-3 Test matrix for backlit photography and PDPA test ........................................... 82
Table 5-1 Fuel properties of dieseline fuels ...................................................................... 106
Table 5-2 Test conditions for dieseline spray ................................................................... 107
Table 5-3 Configurations of Phantom V710 camera ......................................................... 107
Table 5-4 PDPA specifications and operating parameters ................................................ 108
Table 6-1 Model constants settings for the gasoline spray simulation .............................. 137
Table 6-2 Test specifications of gasoline spray validation experiment ............................ 137
Table 7-1 Breakup models................................................................................................. 154
Table 7-2 Diesel spray experiment specifications ............................................................. 161
xxvii
LIST OF PUBLICATIONS
Jing, D., Xu, H., Shuai, S., Wang, Z. et al., "A Turbulence and Cavitation-induced Breakup
Model for Fuel Spray Modeling," SAE Technical Paper 2014-01-2737, 2014, doi:
10.4271/2014-01-2737.
Jing, D., Xu, H. et al., "Development of a Turbulence-induced Breakup Model for Diesel Spray
Simulation." Proceedings of the 17th of Liquid Atomization & Spray Systems - Asia (ILASS-
Asia 2014). 2014.
Jing, D., Shuai, S., Wang, Z., Xu, H. et al., "Development of a Turbulence-induced Breakup
Model for Gasoline Spray Simulation," SAE Technical Paper 2015-01-0939, 2015, doi:
10.4271/ 2015-01-0939.
Jing, D., Xu, H. et al., "Numerical Modeling of Diesel Spray using TL-KHRT Breakup
Model," Ready for Submission.
Jing, D. & Zhang, F., Xu, H., Li, Y., Shuai, S., "Experimental Investigation into the
Macroscopic and Microscopic Spray Characteristics of Dieseline," Ready for Submission.
1
1 CHAPTER 1 INTRODUCTION
1.1 Background
Internal Combustion (IC) Engines, as the greatest invention of the 19th century, are the most
popular thermal engines and widely used in industry, agriculture etcetera since the 1860s [1,
2]. Precisely because of its excellent performance, the IC engine has always been in a leading
position in the field of power production and plays an important role in the rapid developments
of the world economy, state-building, and people's livelihood [3]. With the increasing demand
for energy conservation and environmental protection, further improvements in fuel efficiency
and emission reduction in internal combustion engines are urgently required; due to the limited
energy reserves, the rising price of crude oil and climate change [4]. Although the electric
vehicle exhibits a promising future in recent years due to its environmentally friendly features
[5, 6], some inevitable issues such as the high costs, the limited battery range, and the lagging
behind of charging technology have greatly hindered its further development[7]. Thus it is
predictable that the IC engine will still be the most used power engine in the 21st century.
1.1.1 Energy Demand and Emission Regulations
Energy Demand
With rapid economic development and continuous growth of the population, the increasing
demand for energy and the problem of environmental pollution are becoming more and more
2
Figure 1-1 World energy demand forecast – long-term energy sources [8]
serious. It is reported by the Energy Information Administration (EIA) in its International
Energy Outlook that world energy consumption will rise 56 percent in the next three decades,
driven by growth in the developing world [9, 10]. Figure 1-1 illustrates the historical and the
forecasted demand for energy of the world [8]. It is shown that the fossil fuels including crude
oil, natural gas, and coal will still be the energy source and increase considerably before 2040.
After 2040, the renewable sources such as biofuels, hydroelectricity, solar and wind power and
geothermal energy will be expected to fulfil the further increasing demand. However, the roles
of the fossil fuels are still irreplaceable in the foreseeable future; especially for crude oil, which
is the so-called ‘blood’ of the industry and will still be an indispensable energy source.
3
From the view of the share of energy consumption by various sectors, the transportation sector
consumes a big part of the total energy continuously [11]. Figure 1-2 shows the most recently
published report by the EIA in terms of global primary energy consumption by source and
sector [12]. It can be seen that 28% of the primary energy is consumed by transportation, which
is just second to the percentage (39%) that is consumed by electric power. Furthermore, the
transportation sector consumes 71% of the liquid fuel, which has no competition from any other
sector. It can be expected that vehicles will still be the main consumer in the foreseeable future;
thus, further improvement of fuel efficiency of vehicles is of great importance in slowing down
the increasing speed of the energy demand.
Figure 1-2 Primary energy consumption by source and sector [12]
4
Emission Regulations
Apart from the increasing energy demand by vehicles, the emissions are another important
aspect which has attracted much attention in recent years. As one of the main air pollution
sources in cities, the IC engine is facing more and more stringent emission regulations all over
the world. The main harmful exhaust emissions such as carbon monoxide (CO), unburned
hydrocarbon (HC), nitrogen oxides (NOx), and soot/ particle matters (PM) have a strong
pungent smell and will seriously poison and pollute the air in cities [13]. Figure 1-3 shows an
image of the air pollution in Beijing. At the same time, large amounts of carbon dioxide (CO2)
exhausted by IC engines will lead to the greenhouse effect and then result in climate change
and global warming [14].
Figure 1-3 An image of the air pollution in Beijing [15]
5
Many countries have made stringent vehicle emission regulations to limit the exhaust emissions
of vehicles. The first emission regulation ‘Euro 1’ was released by the Europe Union (EU) in
1992. During the past 20 years, the EU emission regulations have been updated several times
and have become more and more stringent. The detailed EU emission regulations for passenger
cars from the ‘Euro 1’ stage to the ‘Euro 6’ stage are listed in Table 1-1. It can be seen that
from the year 1992 to 2005, the CO emissions for diesel engines and gasoline engines were
forced to be reduced by 82% and 63%, respectively. From the year 2000 to 2014, the HC
emissions for gasoline engines have been reduced by 50%; the NOx emissions for diesel
Table 1-1 European emission regulations for passenger cars [16]
6
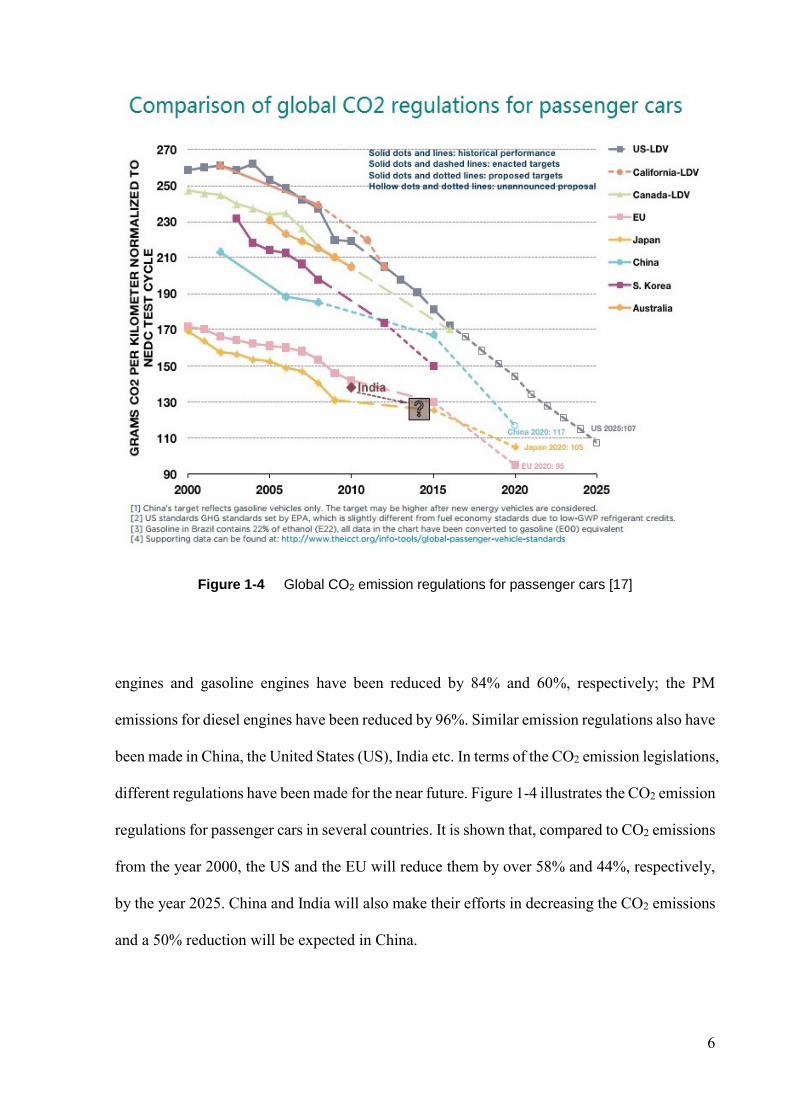
Figure 1-4 Global CO2 emission regulations for passenger cars [17]
engines and gasoline engines have been reduced by 84% and 60%, respectively; the PM
emissions for diesel engines have been reduced by 96%. Similar emission regulations also have
been made in China, the United States (US), India etc. In terms of the CO2 emission legislations,
different regulations have been made for the near future. Figure 1-4 illustrates the CO2 emission
regulations for passenger cars in several countries. It is shown that, compared to CO2 emissions
from the year 2000, the US and the EU will reduce them by over 58% and 44%, respectively,
by the year 2025. China and India will also make their efforts in decreasing the CO2 emissions
and a 50% reduction will be expected in China.
7
Obviously, both the energy demand and the emission regulations are the main factors in
promoting further improvements in fuel efficiency and a further reduction of the exhaust
emissions of the IC engine.
1.1.2 Direct Injection Engines
The design and optimization of the IC engine will greatly rely on the fuel injection system since
an advanced fuel injection system can greatly improve the fuel efficiency and combustion
quality of vehicles and help to meet the demand for energy saving and the stringent emission
regulations [2, 4]. Therefore the optimization of fuel injection technology has attracted more
and more attention in recent years. Direct injection technology, which delivers the fuel into the
cylinder chamber directly, is proved to be the most effective means in improving fuel efficiency
and reducing the emissions for both compression ignition (CI) engines and modern direct
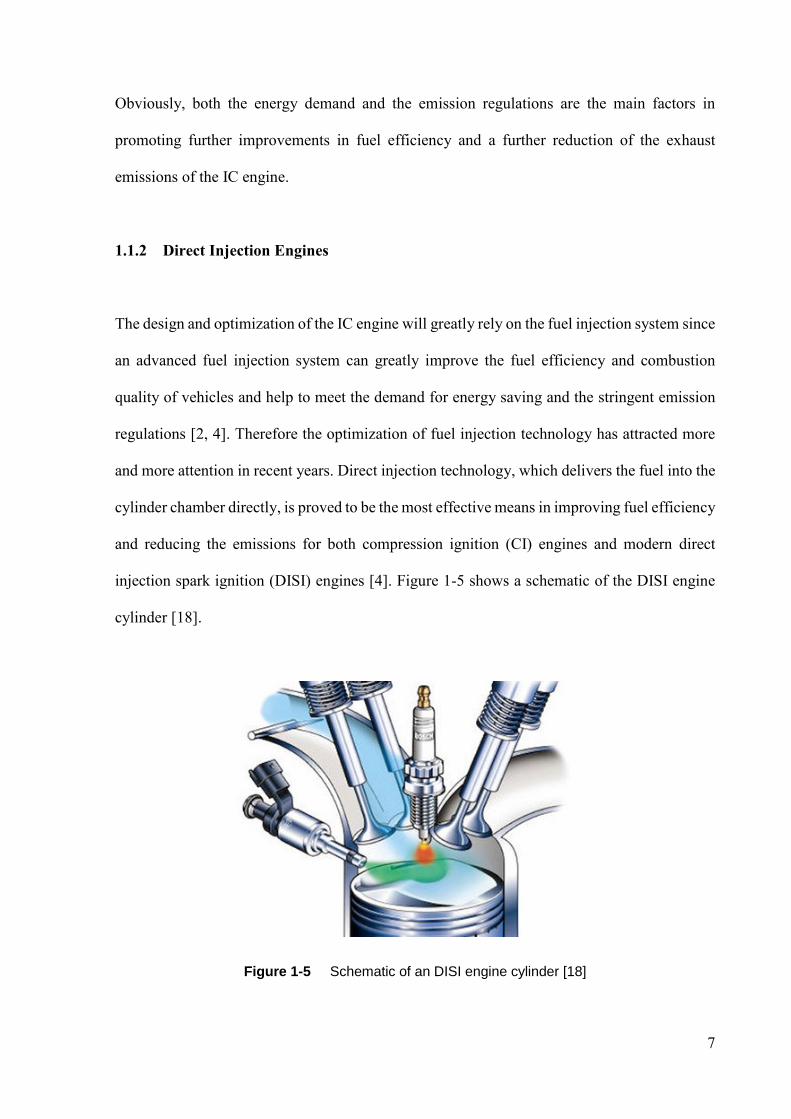
injection spark ignition (DISI) engines [4]. Figure 1-5 shows a schematic of the DISI engine
cylinder [18].
Figure 1-5 Schematic of an DISI engine cylinder [18]
8
There are several advantages of direct injection technology, especially for the modern DISI
engines [19-22]:
Improving the fuel efficiency: one of the most important objectives during the
development of the modern IC engine is to decrease the fuel consumption to meet the
requirement of energy saving. Direct injection technology can greatly improve the
efficiency of the fuel-air mixing and enhance the atomization quality; and in turn it
improves the fuel efficiency.
Improving the accuracy of the fuel injection: a main feature of the direct injection
system is the accurate injection control by the Electronic Control Unit (ECU). It can
adjust the injection timing, injection duration and the injection pressure according to
the working conditions of the engine; thus it can optimize the accuracy of the fuel
injection for different conditions.
Enhancing engine power: the better air-fuel mixing performance of direct injection
technology will lead to a more complete combustion of the fuel; thus it results in a
higher efficiency of the power conversion of the fuel, which will directly enhance the
power output of the engine.
Reducing the exhaust emissions: again, the better fuel-air mixing of direct injection
technology will result in a more complete combustion of the fuel, so that the CO and
HC emissions can be significantly reduced.
However, some problems and drawbacks of the direct injection engine such as the PM
emissions at medium or low load, NOx emissions due to the higher compression ratio and
higher heat release rate and other emissions during the cold-start still exist and need further
studies [19, 20].
9
1.1.3 Fuel Spray
The fuel spray atomization process is known to play a key role in affecting mixture formation,
combustion efficiency, power output, fuel economy and exhausted emissions in direct injection
engines [21]. The spray process is an extremely complicated physical course consisting of fuel
spray atomization, droplet breakup, evaporation, collision, coalescence and energy exchange
processes. Among them, spray atomization and droplet breakup are the most important physical
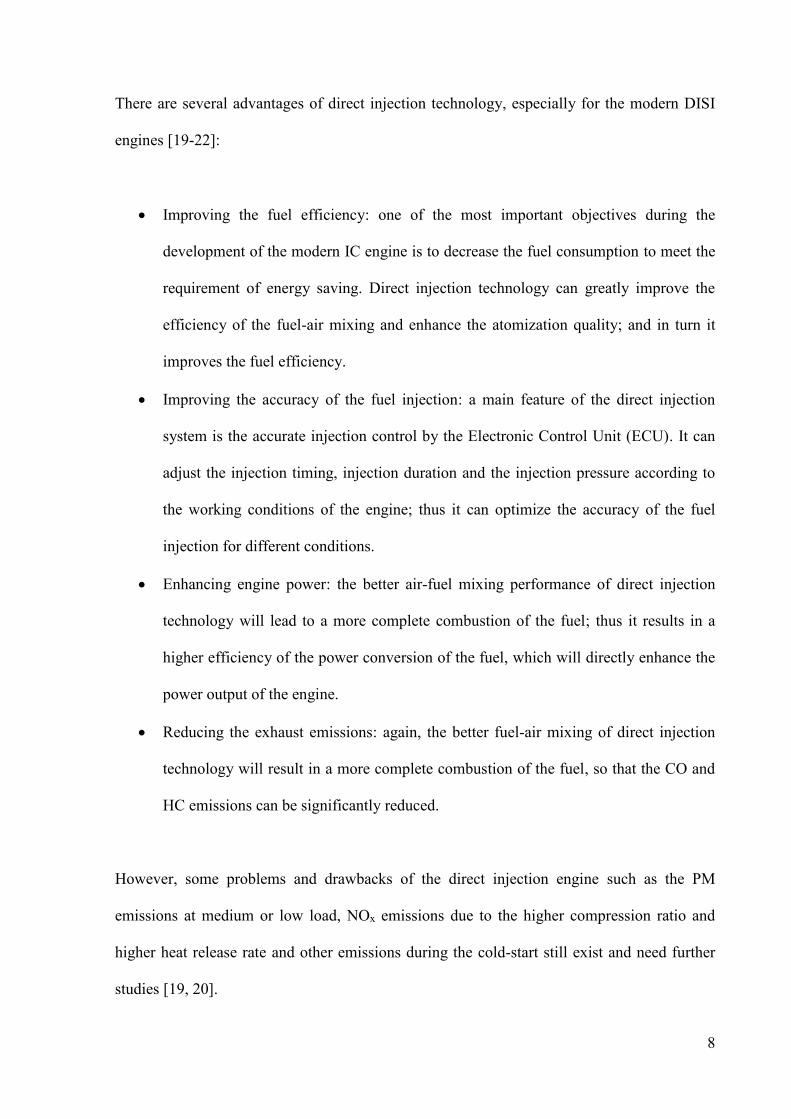
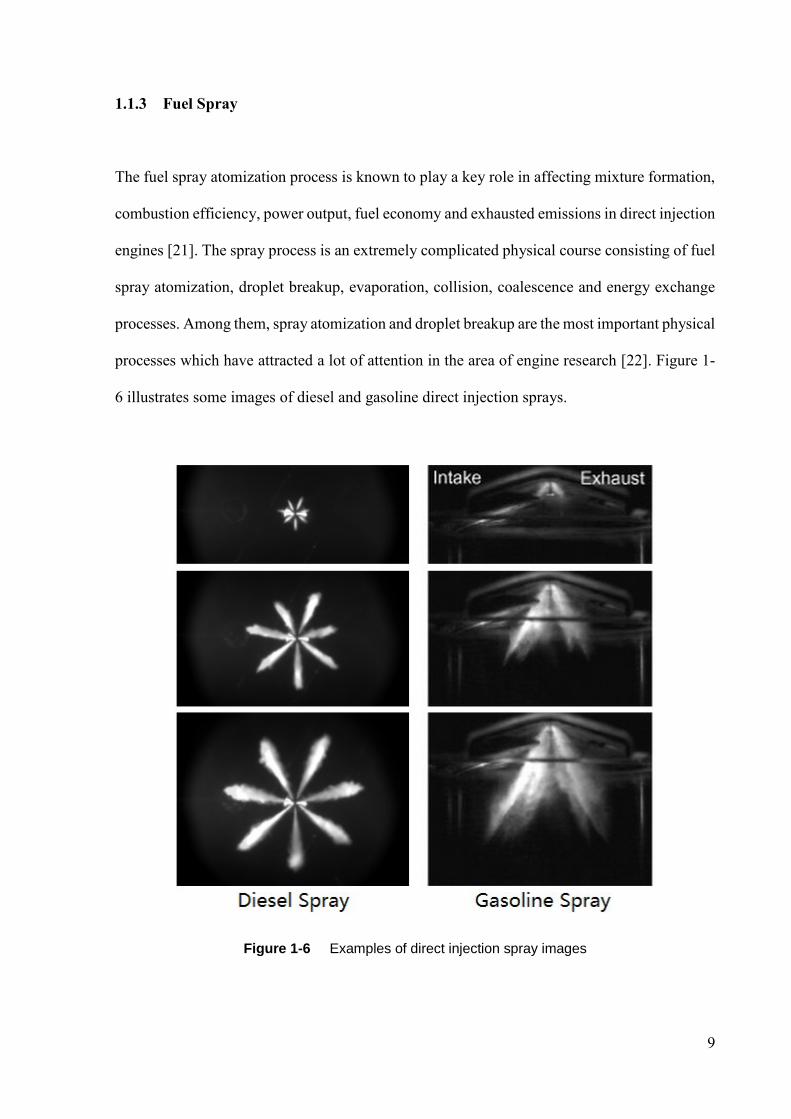
processes which have attracted a lot of attention in the area of engine research [22]. Figure 1-
6 illustrates some images of diesel and gasoline direct injection sprays.
Figure 1-6 Examples of direct injection spray images
10
The fuel pressured by the fuel supply system and ejected from the injector nozzle will
experience primary atomization and secondary breakup processes. The primary atomization
process will disintegrate the continuous fuel liquid into numerous droplets with various
diameters and velocities. The secondary breakup process will further reduce the droplet size
and produce a great number of smaller droplets. In this way, the fuel can be mixed with the air
inside the cylinder directly. A better atomization of the fuel spray will increase the fuel-air
contact area and then enhance the mixture formation of the engine, which in turn increases the
fuel efficiency and reduces the fuel consumption. Furthermore, better atomization quality will
result in smaller droplet size, which can effectively reduce soot, as well as other emissions [23].
Thus, a detailed study of the fuel atomization process is of great importance for optimizing the
performance of the IC engine. The methodology of combining the experimental investigation
and the numerical study can help to achieve a better understanding of the fuel spray, not only
in theory, but also in a practical approach.
1.2 Research Objectives
This study aims to achieve a detailed understanding of fuel spray characteristics by using
experimental investigation and numerical simulation approaches. The spray characteristics of
both the Gasoline Direct Injection (GDI) engine and the diesel engine will be studied; at the
same time, optimized physical-numerical spray models for the gasoline and diesel spray
simulations will be developed and validated. The main objectives of this study can be described
as follows:
11
To experimentally study the fuel spray characteristics of the GDI engine and investigate
the influence of injection parameters; such as the injection pressure, injection duration
and different injector machining methods on the spray characteristics, by using optical
approaches including high-speed imaging and PDPA technology.
To experimentally study the spray characteristics of the diesel engine and compare the
differences between the spray characteristics of gasoline, diesel and their blends –
dieseline fuel, under various injection and ambient conditions; and then figure out the
effects of all the factors on the spray characteristics.
To numerically study the fuel spray of the GDI engine using CFD modeling technology
and deeply analyze the different breakup mechanisms induced by the various injection
parameters; and then propose and validate an optimized spray atomization model based
on the analysis.
To numerically study the fuel spray of the diesel engine and improve the current
existing spray atomization models by considering the effects of the cavitation
phenomenon and turbulence on the spray breakup process; and then validate the
proposed model by using the experiment data.
1.3 Thesis Outline
This thesis comprises eight chapters, which are described as follows:
Chapter 1 gives a brief introduction of this study, including the background, the research
objectives and the outline of the thesis.
12
Chapter 2 reviews the fundamentals of fuel spray, including spray characteristics, breakup
regimes, spray CFD modelling approaches and spray breakup sub-models used in the spray
simulation.
Chapter 3 introduces the research methodologies employed in the fuel spray study, including
the experimental and the numerical approaches used in this study. Experimental setups, such
as the fuel injection system, the constant volume vessel, the image acquisition system, the
Phase Doppler Particle Analyzer (PDPA) system and numerical software, including the
calculation code and post-processing program, are introduced in detail.
Chapter 4 studies the spray characteristics of the GDI engine. The effects of injection pressure,
injection duration and different injector nozzle machining methods on the spray characteristics
have been investigated. It is shown that higher injection pressure can increase the penetration
length and enhance the atomization process; due to its higher injection velocity, stronger
turbulence and cavitation phenomenon and greater aerodynamic force. The laser drilling nozzle
machining method can be an effective means to enhance the spray atomization performance;
since this machining technology can provide a sharper inlet edge and finer inner surface to the
injector nozzle.
Chapter 5 investigates the spray characteristics of a diesel engine. The effects of the injection
parameters such as injection pressure, ambient pressure, different fuels including gasoline,
diesel and their blends - dieseline and the gasoline/diesel blending ratio on the spray
characteristics have been experimentally investigated. The results show that higher injection
pressure and higher ambient pressure will enhance the spray atomization process due to their
significant cavitation phenomenon, stronger turbulence effects and greater aerodynamic force.
13
Compared to pure diesel, the recently developed dieseline fuel shows many advantages in terms
of affecting the spray atomization process due to its physical properties; such as stronger
cavitation phenomenon, higher volatility, lower surface tension and lower viscosity.
Chapter 6 considers the numerical modelling of gasoline spray. An improved hybrid spray
breakup model, named the ‘Turbulence-Ligament-KH-RT’ (TL-KHRT) model, is developed
by considering the turbulence effect and the ligament evolution in the fluid. The improved
model is validated with high-speed imaging and PDPA experiments and the simulation result
shows a better agreement with the experiment data.
Chapter 7 focuses on the numerical simulation of diesel spray. An enhanced Aerodynamic-
Cavitation-Turbulence induced primary breakup model is developed in this study. The
improved model is validated with the experiment data of the full-cone diesel spray in a constant
volume vessel under non-evaporating and various injection conditions. Simulation results of
the improved model exhibit a better agreement with respect to spray penetration, droplet
average mean diameter, droplet velocity under all the test conditions and show significant
improvements for fuel spray modelling.
Chapter 8 summarizes the studies and gives some recommendations for future work.
14
2 CHAPTER 2 LITERATURE REVIEW
This chapter reviews the fundamentals of fuel spray; including spray characteristics, breakup
regimes, spray CFD modelling approaches and spray breakup sub-models. The macroscopic
characteristics such as spray structure, tip penetration, spray angle and the microscopic
characteristics including droplet size and droplet velocity are introduced at first. Then the
breakup regimes and their influence factors are analyzed. Finally, the CFD modelling
technologies and relevant physical-numerical models are presented.
2.1 Fuel Spray Characteristics
When the liquid fuel is injected into the chamber, a multi-component flow a containing liquid
core, liquid droplets, fuel vapour, and air will be formed; this is the so-called spray field. In
modern Direct Injection (DI) engines, a multi-hole injector is the most commonly used injector
and it provides a desirable atomization performance in the mixture formation process. A widely
used means to study the fuel spray characteristics is to focus on one jet of the multi-hole spray
or the single hole spray [23].
2.1.1 Spray Structure
In the past, it was supposed that the atomization process would be completed and numerous
droplets would be formed once the liquid fuel left the nozzle. However, with the rapid
development of optical diagnostic technology, lots of experimental observations indicate that
15
the atomization process will last for a certain distance and a liquid core exists near the injector
nozzle, which is the so-called intact liquid core. For the convenience of study, the spray can be
divided into several zones. According to the coupling conditions of the gas phase and liquid
phase, Bracco and O’Rourke [24] classify the spray field into four zones by the distance from
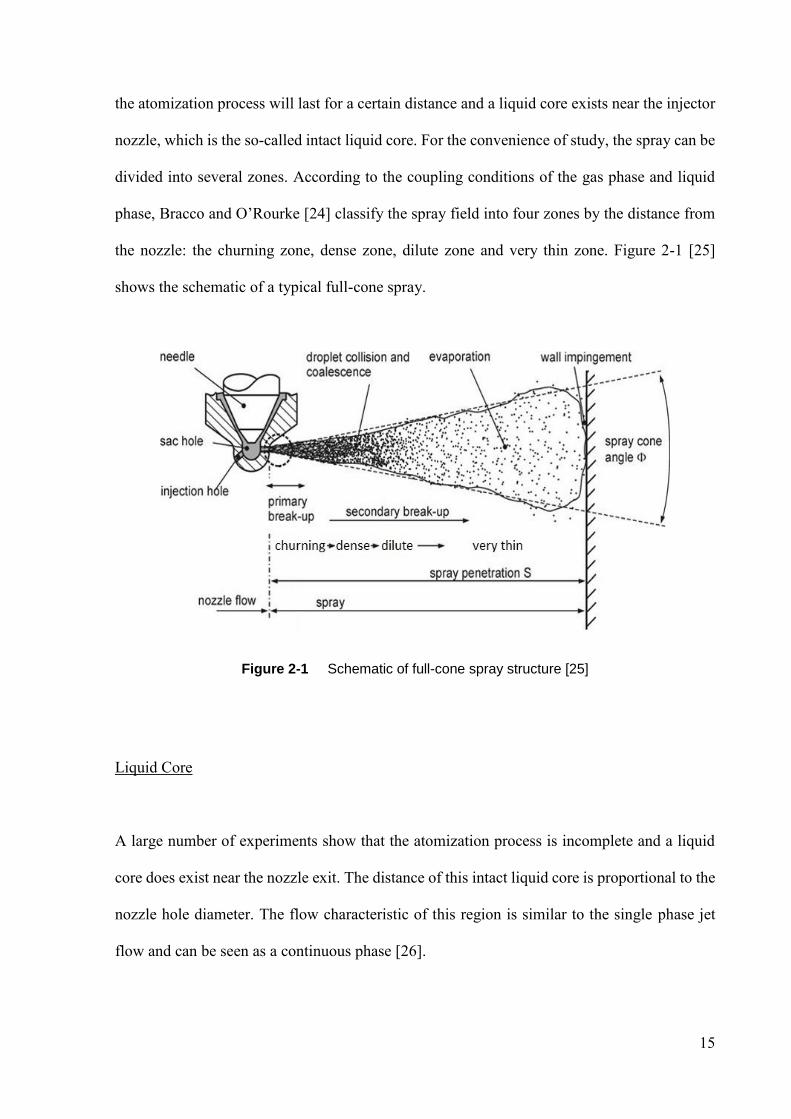
the nozzle: the churning zone, dense zone, dilute zone and very thin zone. Figure 2-1 [25]
shows the schematic of a typical full-cone spray.
Figure 2-1 Schematic of full-cone spray structure [25]
Liquid Core
A large number of experiments show that the atomization process is incomplete and a liquid
core does exist near the nozzle exit. The distance of this intact liquid core is proportional to the
nozzle hole diameter. The flow characteristic of this region is similar to the single phase jet
flow and can be seen as a continuous phase [26].
16
Churning Zone
This zone refers to the spray region very close to/around the liquid core, where the continuous
liquid starts to breakup into dense droplets or ligaments. However, due to the volume fraction
of the liquid phase being equivalent to or even higher than the gas phase, the fuel in this zone
is not in the form of discrete droplets. The churning flow is the product of the first step of
atomization and it is also the intermediate status between the liquid core and the droplets. The
studies of the churning flow are of great importance in revealing the primary breakup
mechanisms of the spray.
Dense Zone
The volume fraction of the liquid phase in this zone is still high but relatively lower than the
churning flow. The liquid phase is in the form of discrete droplets which disperse in the
continuous gas phase. The aerodynamic force induced by the high relative velocity between
the droplet and its surrounding air will act on the droplet surface and lead to further breakup,
which is known as the secondary breakup. The interaction between droplets cannot be ignored
since the space between them is small. Collisions of droplets can lead to droplet deformation,
coalescence and breakup; this then can affect the droplet size distribution. O’Rourke [27]
carried out a detailed numerical study of the dense spray zone by employing a statistical method
which considered collision dynamics, collision probability, collision efficiency etc. A
transition function was used to determine the result of coalescence or breakup. On the other
hand, the droplet can also affect the dynamic properties of its surrounding air and the air motion
will disturb other droplets at the same time; therefore this zone is quite complex and difficult
to measure and model.
17
Dilute Zone
In this zone, the liquid volume fraction is smaller than that of the dense zone. The space
between droplets is much bigger than the droplet size, so the interaction between droplets can
be ignored. However, the indirect influence of ‘droplet-air-droplet’ always exists, which means
the droplet-induced aerodynamic force will still affect other droplets.
Very Thin Zone
This is the outermost part of the spray field. The liquid volume fraction in this zone is rather
low since most of the small droplets have been evaporated during the transportation and the
minority of the remaining droplets is distributed in a relatively wide space. The interaction
between droplets such as deformation, breakup, collision, coalescence and oscillation becomes
weak and can be neglected. The velocity of these droplets is quite low and the transportation is
dominated by the turbulent diffusion.
2.1.2 Spray Penetration and Spray Cone Angle
Spray penetration and cone angle are the macroscopic characteristics which have been
investigated by many studies over the years. Spray penetration [28] is defined as the distance
between the leading edge of the spray and the nozzle exit; while the cone angle [29, 30] is
always defined as the angle between the two tangent lines of the side edge of the spray, as is
shown in Figure 2-1 in the previous section.
18
Many empirical equations have been developed in terms of the study of spray penetration [28-
31]. Hiroyasu and Arai [28] experimentally studied the temporal evolution of the tip
penetration and they found that the spray can be divided into two stages. At the first stage, the
penetration length S is proportional to time t and it won’t be affected by the ambient density ρa.
However, the second stage shows a different situation in which the penetration length S is
proportional to the square root of time t. By considering the liquid surface properties such as
wave fluctuation and breakup; and ambient gas dynamics such as the relative velocity, ambient
pressure and density, a more accurate empirical equation can be found; the expression is as
below [28]:
0.5
28.65
( ( ))
lb
a inj a
Dt
P P
(2-1)
0.5
1
2( )0.39
inj a
l
P PS t
(0 )bt t (2-2)
0.25
0.5
2 2.95inj a
a
P PS Dt
( )bt t (2-3)
where S1 and S2 are spray penetration length for stage 1 and stage 2, respectively; t is the time
after the start of injection (ASOI); tb is the time before breakup; Pinj is the injection pressure;
Pa is back pressure; ρl is fuel density; ρa is ambient gas density; and D is the nozzle diameter.
Siebers and Naber [31] investigated the effects of gas density and vaporization on the
penetration and dispersion of diesel spray using the Mie-scattering technique over a range of
injection conditions. They found that the penetration length decreases with the increase of
19
ambient pressure or density. The correlations for the tip penetration length are expressed as
follows [31]:
0.5
1
2( )inj a
v
l
P PS C t
(0 )bt t (2-4)
0.5
0.250.5
0.5
2
0.66 tan2
inj av a
a
P PC CS Dt
( )bt t (2-5)
where CV is the orifice velocity contraction coefficient; Ca is the area contraction coefficient;
and θ is the spray dispersion angle.
A recent study based on these empirical equations and correlations was carried out by Klein-
Douwel et al.[29, 30]. The authors concluded on a general form of the penetration as well as
the cone angle for non-vaporizing fuel spray:
0.5
( ) tan2
s s s sm n
g inj aS P P D t
(2-6)
tan ( )2
m n
g inj aP P D t (2-7)
where θ is the spray angle; and the exponents ms, ns, αs, and βs are in relation to gas density,
pressure difference, nozzle diameter and time, respectively; they are varied in different
conditions, as is shown in Table 2-1.
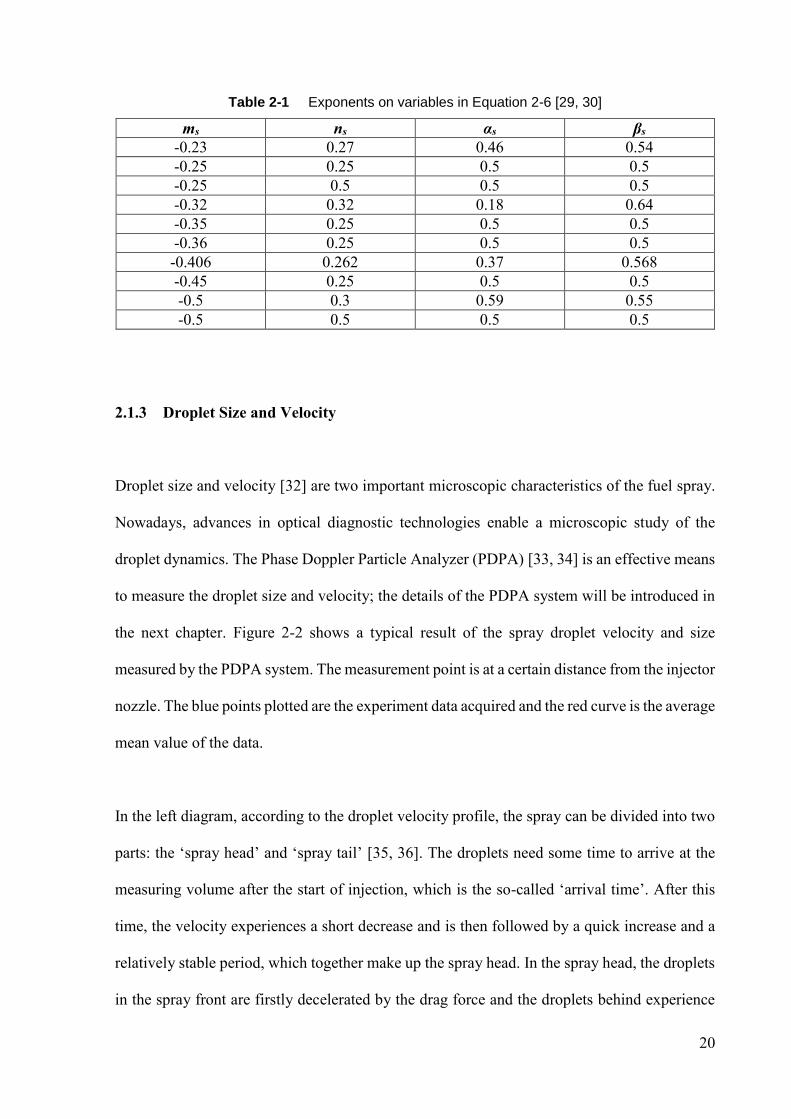
20
Table 2-1 Exponents on variables in Equation 2-6 [29, 30]
ms ns αs βs
-0.23 0.27 0.46 0.54
-0.25 0.25 0.5 0.5
-0.25 0.5 0.5 0.5
-0.32 0.32 0.18 0.64
-0.35 0.25 0.5 0.5
-0.36 0.25 0.5 0.5
-0.406 0.262 0.37 0.568
-0.45 0.25 0.5 0.5
-0.5 0.3 0.59 0.55
-0.5 0.5 0.5 0.5
2.1.3 Droplet Size and Velocity
Droplet size and velocity [32] are two important microscopic characteristics of the fuel spray.
Nowadays, advances in optical diagnostic technologies enable a microscopic study of the
droplet dynamics. The Phase Doppler Particle Analyzer (PDPA) [33, 34] is an effective means
to measure the droplet size and velocity; the details of the PDPA system will be introduced in
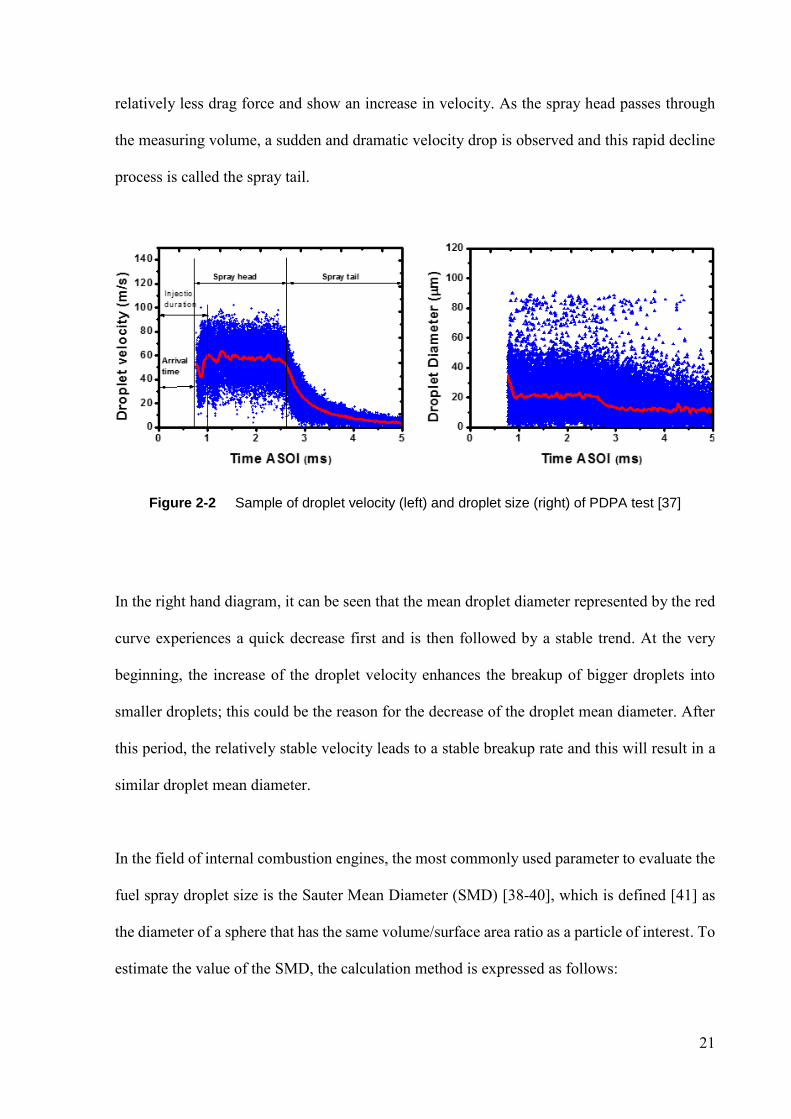
the next chapter. Figure 2-2 shows a typical result of the spray droplet velocity and size
measured by the PDPA system. The measurement point is at a certain distance from the injector
nozzle. The blue points plotted are the experiment data acquired and the red curve is the average
mean value of the data.
In the left diagram, according to the droplet velocity profile, the spray can be divided into two
parts: the ‘spray head’ and ‘spray tail’ [35, 36]. The droplets need some time to arrive at the
measuring volume after the start of injection, which is the so-called ‘arrival time’. After this
time, the velocity experiences a short decrease and is then followed by a quick increase and a
relatively stable period, which together make up the spray head. In the spray head, the droplets
in the spray front are firstly decelerated by the drag force and the droplets behind experience
21
relatively less drag force and show an increase in velocity. As the spray head passes through
the measuring volume, a sudden and dramatic velocity drop is observed and this rapid decline
process is called the spray tail.
Figure 2-2 Sample of droplet velocity (left) and droplet size (right) of PDPA test [37]
In the right hand diagram, it can be seen that the mean droplet diameter represented by the red
curve experiences a quick decrease first and is then followed by a stable trend. At the very
beginning, the increase of the droplet velocity enhances the breakup of bigger droplets into
smaller droplets; this could be the reason for the decrease of the droplet mean diameter. After
this period, the relatively stable velocity leads to a stable breakup rate and this will result in a
similar droplet mean diameter.
In the field of internal combustion engines, the most commonly used parameter to evaluate the
fuel spray droplet size is the Sauter Mean Diameter (SMD) [38-40], which is defined [41] as
the diameter of a sphere that has the same volume/surface area ratio as a particle of interest. To
estimate the value of the SMD, the calculation method is expressed as follows:
22
3
32 2
i i
i i
N DD
N D
(2-8)
where D32 is the SMD; Di is the droplet size of parcel i and Ni is the droplet number in parcel
i. It indicates that the SMD can also be understood as the ratio of the sum of volume to the sum
of surface area.
2.2 Breakup Regimes
The fuel spray atomization and breakup processes are the key links which affect the mixture
formation of the internal combustion engine and then influence the combustion efficiency and
emissions. For a long time, many researchers [28, 38, 42-55] carried out a large number of
studies on the spray field and macroscopic characteristics; however, due to the lack of detailed
fluid theories and the limits of the advanced testing technologies, most of these studies
emphasized their works on the geometrical characteristics such as spray penetration, cone angle,
droplet size, and droplet spatial distributions and very few of them worked on the atomization
and breakup regimes.
From the 1970s, with the development of advanced experimental instruments, some researchers
[56-64] started to change their focus on the breakup regimes. Since the atomization process is
closely related to the linear and non-linear stability theories [65, 66] of fluid dynamics, so the
analysis of breakup regimes does not only have important implications in directing internal
combustion engine development, but also has great relevance in the field of fluid dynamics.
With the further development of the research on breakup regimes, many physical models have
been developed during the past few decades.
23
2.2.1 Breakup Classification
When the liquid is injected into another media, the aerodynamic force, inertia force, viscosity
and surface tension will act on the continuous liquid core and force it into separate liquid blocks,
ligaments, or droplets. Different injection flows can lead to various breakup regimes due to
different injection velocities. In general, the breakup of the round liquid core can be divided
into four different regimes according to the velocity gradient: the Rayleigh breakup regime, the
first wind-induced breakup regime, the second wind-induced breakup regime, and the
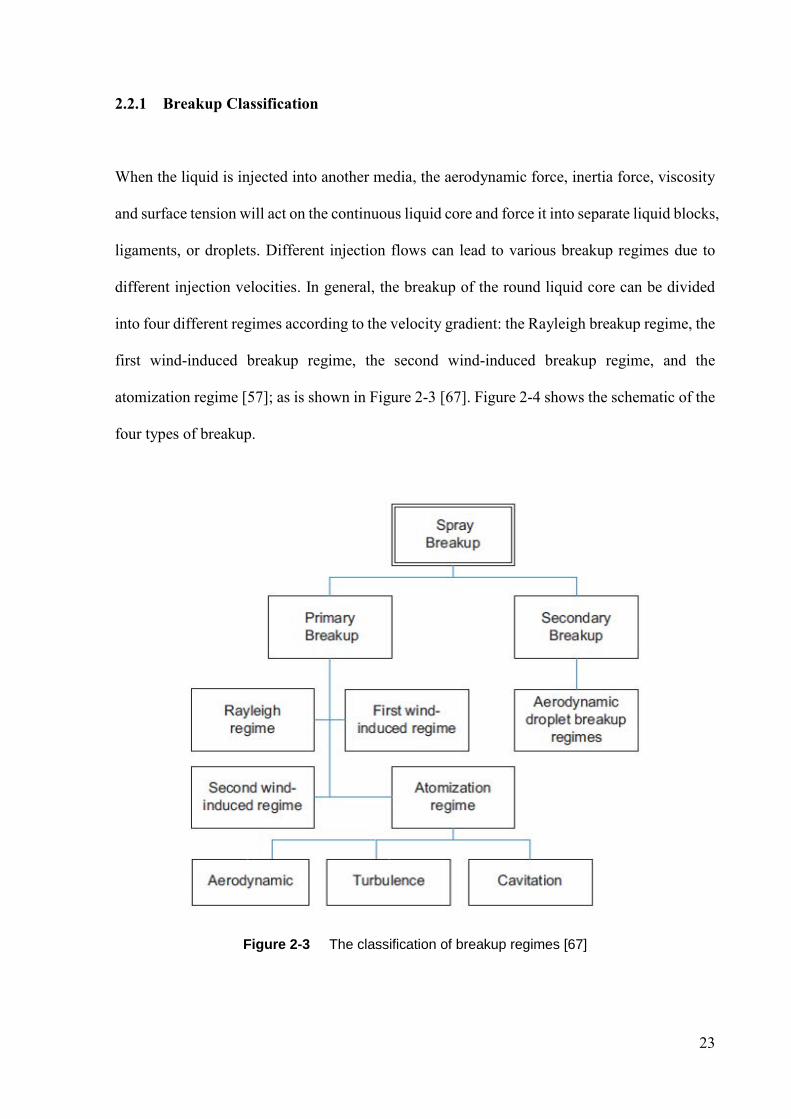
atomization regime [57]; as is shown in Figure 2-3 [67]. Figure 2-4 shows the schematic of the
four types of breakup.
Figure 2-3 The classification of breakup regimes [67]

24
Figure 2-4 Schematic of the four types of breakup: Rayleigh breakup regime, first wind-induced breakup regime, second wind-induced breakup regime and the atomization regime [57]
Rayleigh Breakup Regime
Figure 2-4(a) describes the Rayleigh breakup regime. The liquid core breakups at low jet
velocity due to axisymmetric oscillations initiated by liquid inertia and surface tension forces.
The size of the produced droplets is greater than the nozzle diameter and the breakup always
occurs at a distance far away from the nozzle.
First Wind-induced Breakup Regime
With the increase of the injection velocity, the aerodynamic force induced by the relative
velocity becomes significant. Liquid inertia and surface tension forces are amplified by
aerodynamic forces and then these forces will lead to the changes of surface curvature and the
25
uneven static pressure distribution. All of these factors enhance the breakup of the liquid core.
The breakup occurs at a distance (shorter than that of the Rayleigh regime) downstream of the
nozzle and the produced droplets’ size is equivalent to the nozzle diameter.
Second Wind-induced Breakup Regime
The flow inside the nozzle becomes turbulent with a further increase of the injection velocity.
The unstable growth of the short wavelength surface waves initiated by the turbulence is
amplified by aerodynamic forces. The combined result of the turbulence and aerodynamic
forces is the main cause of the breakup. The breakup happens at a short distance away from the
nozzle and the produced droplets’ size is much smaller than the nozzle diameter.
Atomization Regime
The liquid starts to breakup once it leaves the nozzle. A large number of fine-sized liquid
droplets are formed and the droplet size is much smaller than the nozzle size. An intact liquid
core exists though the breakup occurs at the nozzle exit. This regime is the main primary
breakup mechanism for the sprays of direct injection engines and it has become a focus for
engine research; a detailed discussion of this regime will be given later in this chapter.
All of the above classification descriptions are qualitative analyses of fuel spray. Some
researchers [28, 56, 68-70] tried to classify these regimes and describe them by quantitative
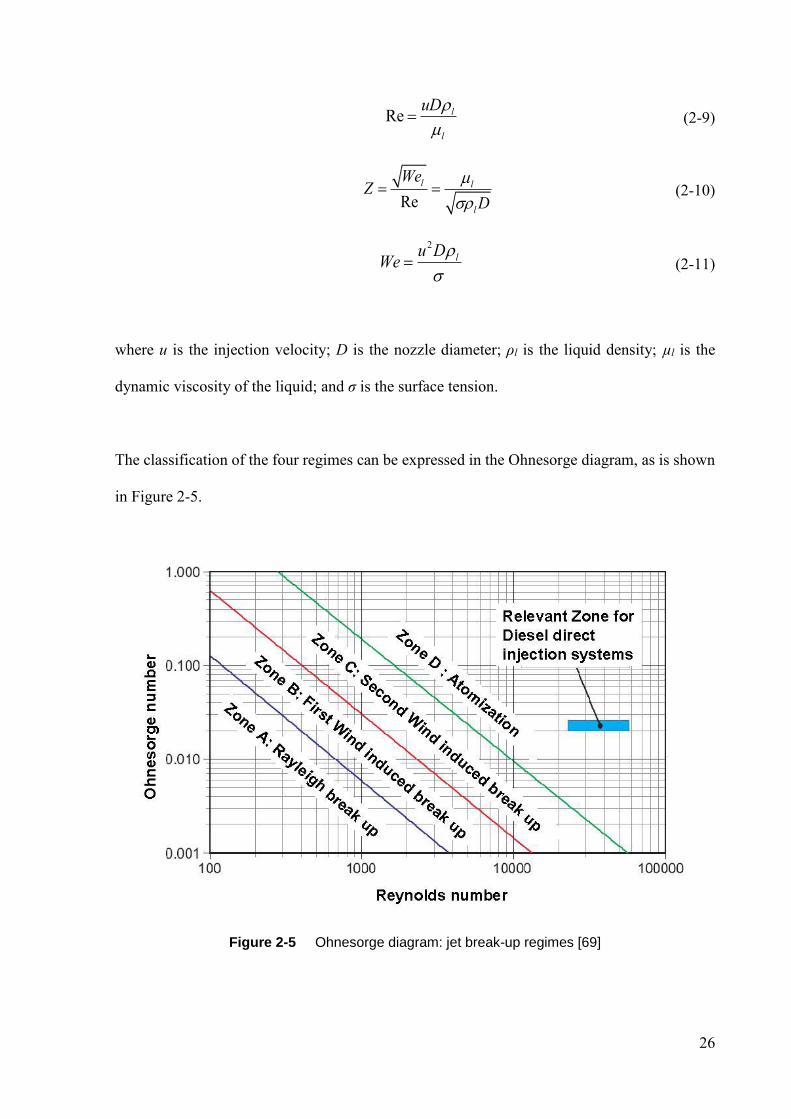
analyses. Ohnesorge [69] suggested a classification method based on the Reynolds number Re
and the Ohnesorge number Z of the liquid:
26
Re l
l
uD
(2-9)
Re
l l
l
WeZ
D
(2-10)
2
lu DWe
(2-11)
where u is the injection velocity; D is the nozzle diameter; ρl is the liquid density; µl is the
dynamic viscosity of the liquid; and σ is the surface tension.
The classification of the four regimes can be expressed in the Ohnesorge diagram, as is shown
in Figure 2-5.
Figure 2-5 Ohnesorge diagram: jet break-up regimes [69]
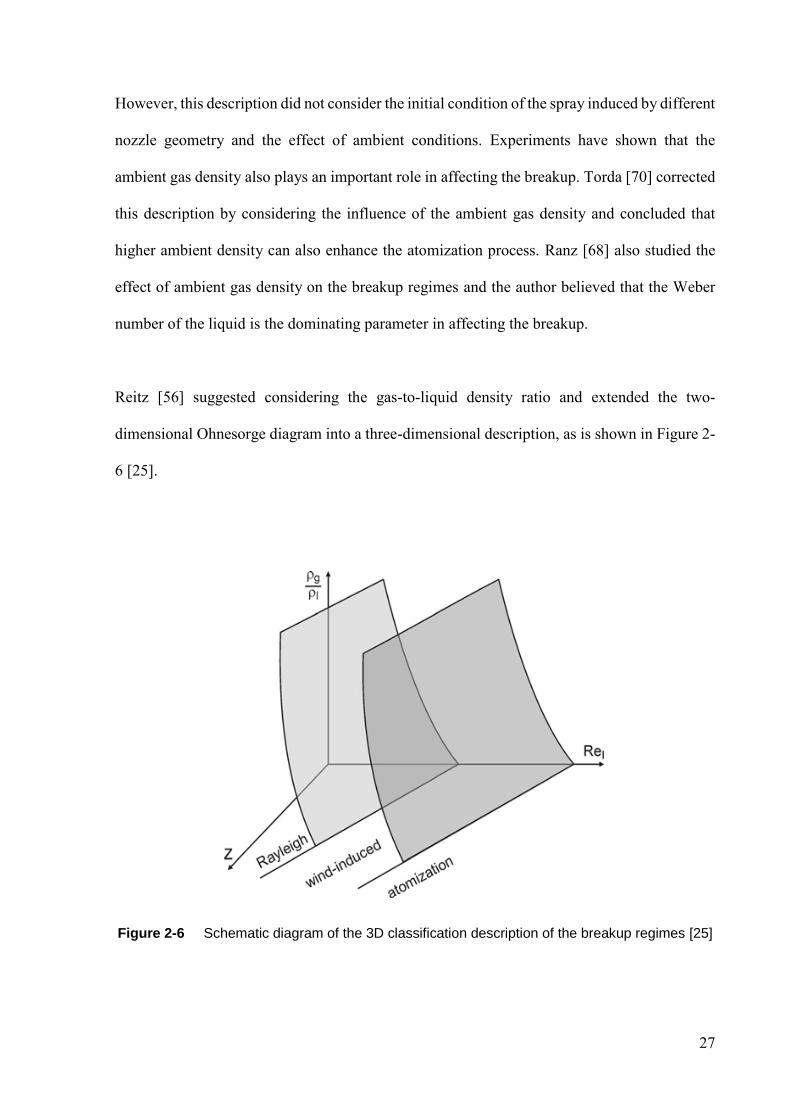
27
However, this description did not consider the initial condition of the spray induced by different
nozzle geometry and the effect of ambient conditions. Experiments have shown that the
ambient gas density also plays an important role in affecting the breakup. Torda [70] corrected
this description by considering the influence of the ambient gas density and concluded that
higher ambient density can also enhance the atomization process. Ranz [68] also studied the
effect of ambient gas density on the breakup regimes and the author believed that the Weber
number of the liquid is the dominating parameter in affecting the breakup.
Reitz [56] suggested considering the gas-to-liquid density ratio and extended the two-
dimensional Ohnesorge diagram into a three-dimensional description, as is shown in Figure 2-
6 [25].
Figure 2-6 Schematic diagram of the 3D classification description of the breakup regimes [25]
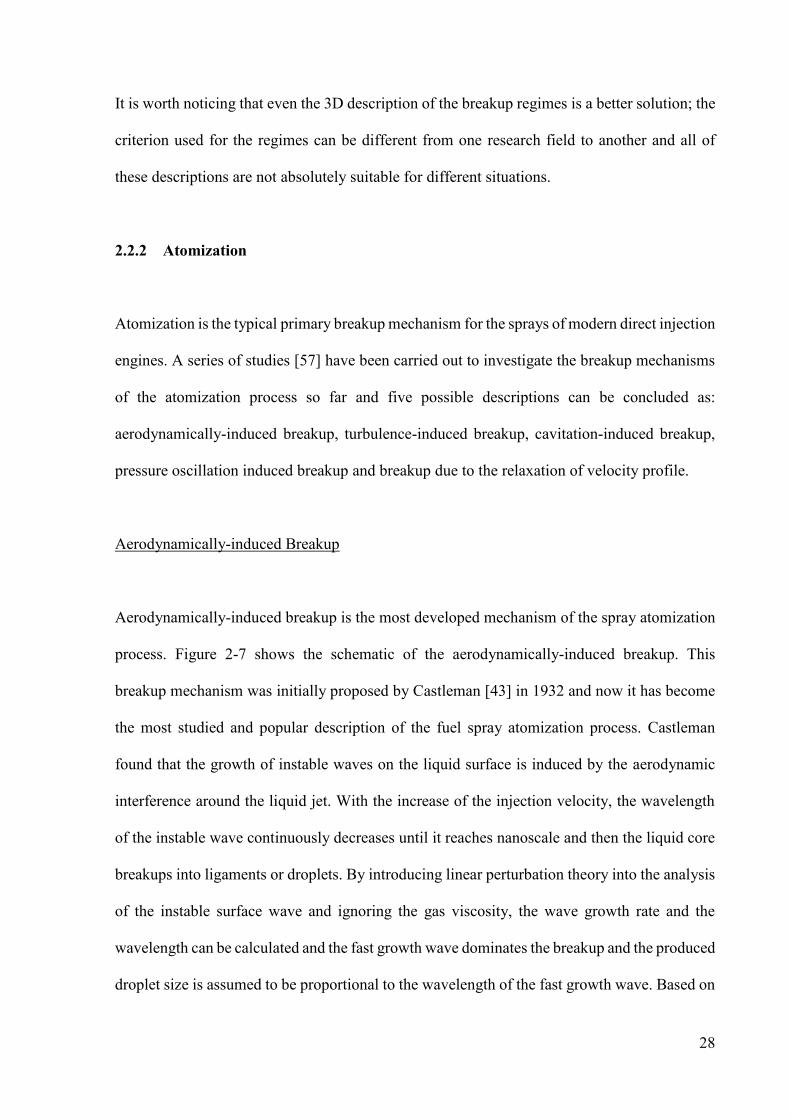
28
It is worth noticing that even the 3D description of the breakup regimes is a better solution; the
criterion used for the regimes can be different from one research field to another and all of
these descriptions are not absolutely suitable for different situations.
2.2.2 Atomization
Atomization is the typical primary breakup mechanism for the sprays of modern direct injection
engines. A series of studies [57] have been carried out to investigate the breakup mechanisms
of the atomization process so far and five possible descriptions can be concluded as:
aerodynamically-induced breakup, turbulence-induced breakup, cavitation-induced breakup,
pressure oscillation induced breakup and breakup due to the relaxation of velocity profile.
Aerodynamically-induced Breakup
Aerodynamically-induced breakup is the most developed mechanism of the spray atomization
process. Figure 2-7 shows the schematic of the aerodynamically-induced breakup. This
breakup mechanism was initially proposed by Castleman [43] in 1932 and now it has become
the most studied and popular description of the fuel spray atomization process. Castleman
found that the growth of instable waves on the liquid surface is induced by the aerodynamic
interference around the liquid jet. With the increase of the injection velocity, the wavelength
of the instable wave continuously decreases until it reaches nanoscale and then the liquid core
breakups into ligaments or droplets. By introducing linear perturbation theory into the analysis
of the instable surface wave and ignoring the gas viscosity, the wave growth rate and the
wavelength can be calculated and the fast growth wave dominates the breakup and the produced
droplet size is assumed to be proportional to the wavelength of the fast growth wave. Based on
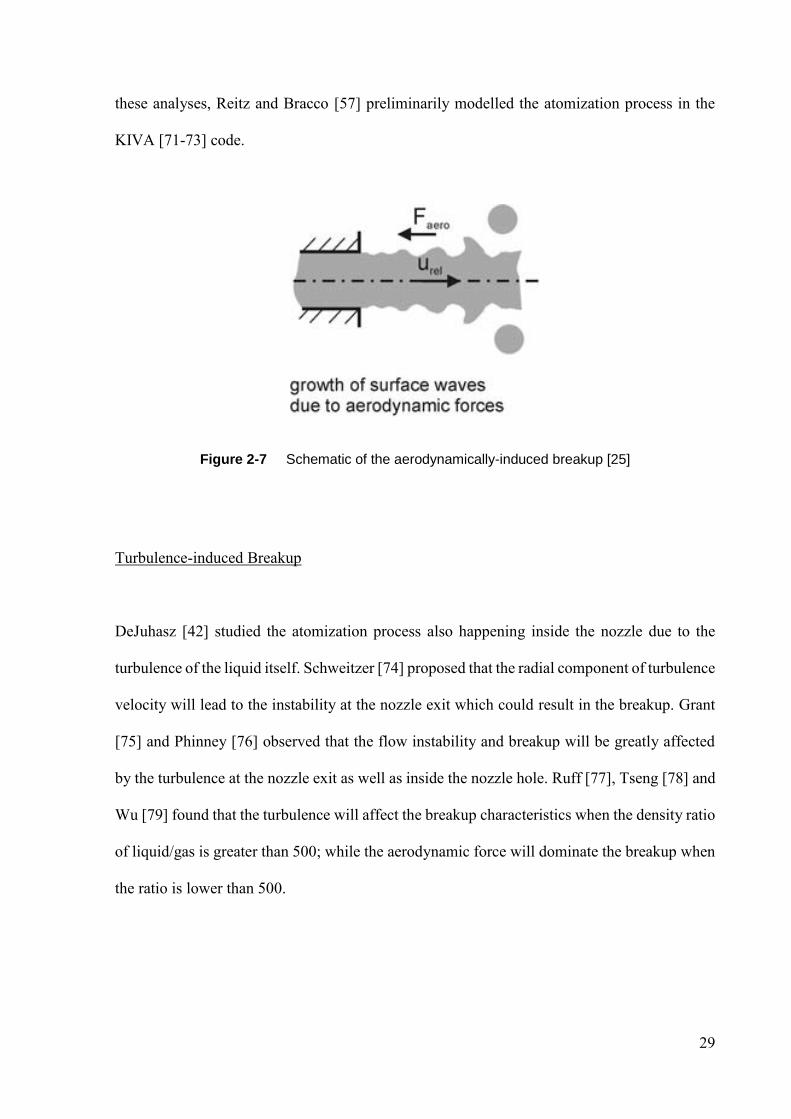
29
these analyses, Reitz and Bracco [57] preliminarily modelled the atomization process in the
KIVA [71-73] code.
Figure 2-7 Schematic of the aerodynamically-induced breakup [25]
Turbulence-induced Breakup
DeJuhasz [42] studied the atomization process also happening inside the nozzle due to the
turbulence of the liquid itself. Schweitzer [74] proposed that the radial component of turbulence
velocity will lead to the instability at the nozzle exit which could result in the breakup. Grant
[75] and Phinney [76] observed that the flow instability and breakup will be greatly affected
by the turbulence at the nozzle exit as well as inside the nozzle hole. Ruff [77], Tseng [78] and
Wu [79] found that the turbulence will affect the breakup characteristics when the density ratio
of liquid/gas is greater than 500; while the aerodynamic force will dominate the breakup when
the ratio is lower than 500.
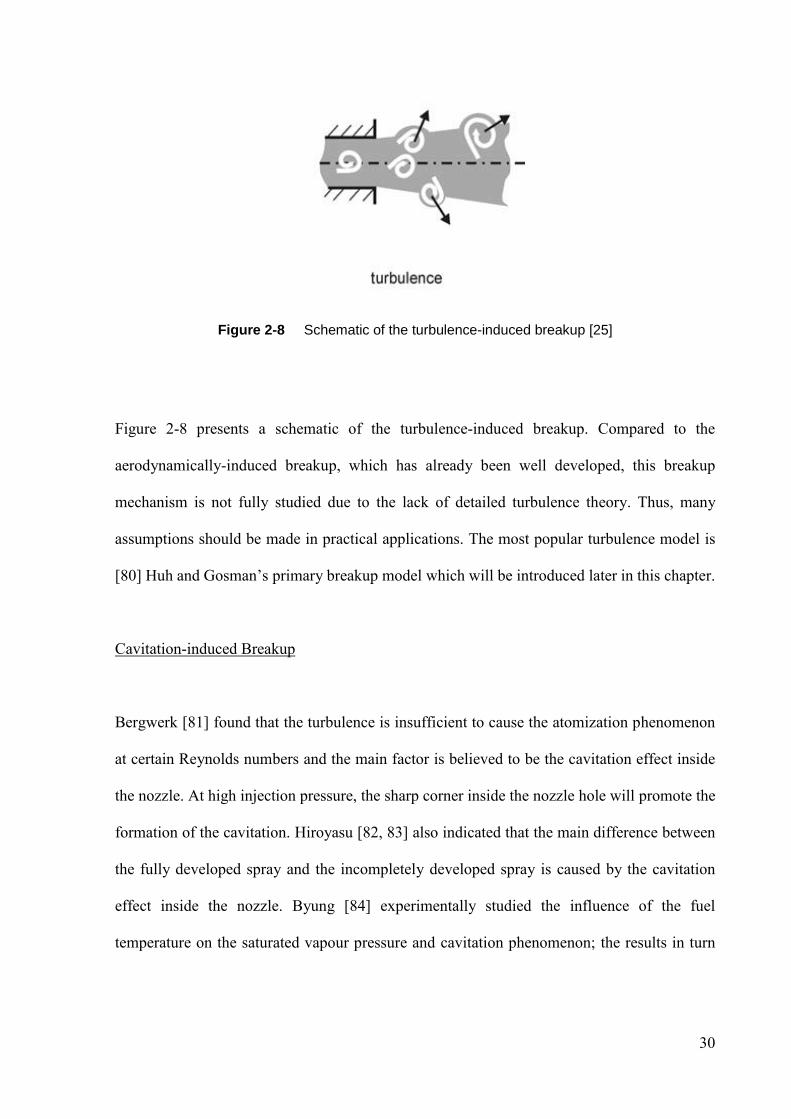
30
Figure 2-8 Schematic of the turbulence-induced breakup [25]
Figure 2-8 presents a schematic of the turbulence-induced breakup. Compared to the
aerodynamically-induced breakup, which has already been well developed, this breakup
mechanism is not fully studied due to the lack of detailed turbulence theory. Thus, many
assumptions should be made in practical applications. The most popular turbulence model is
[80] Huh and Gosman’s primary breakup model which will be introduced later in this chapter.
Cavitation-induced Breakup
Bergwerk [81] found that the turbulence is insufficient to cause the atomization phenomenon
at certain Reynolds numbers and the main factor is believed to be the cavitation effect inside
the nozzle. At high injection pressure, the sharp corner inside the nozzle hole will promote the
formation of the cavitation. Hiroyasu [82, 83] also indicated that the main difference between
the fully developed spray and the incompletely developed spray is caused by the cavitation
effect inside the nozzle. Byung [84] experimentally studied the influence of the fuel
temperature on the saturated vapour pressure and cavitation phenomenon; the results in turn
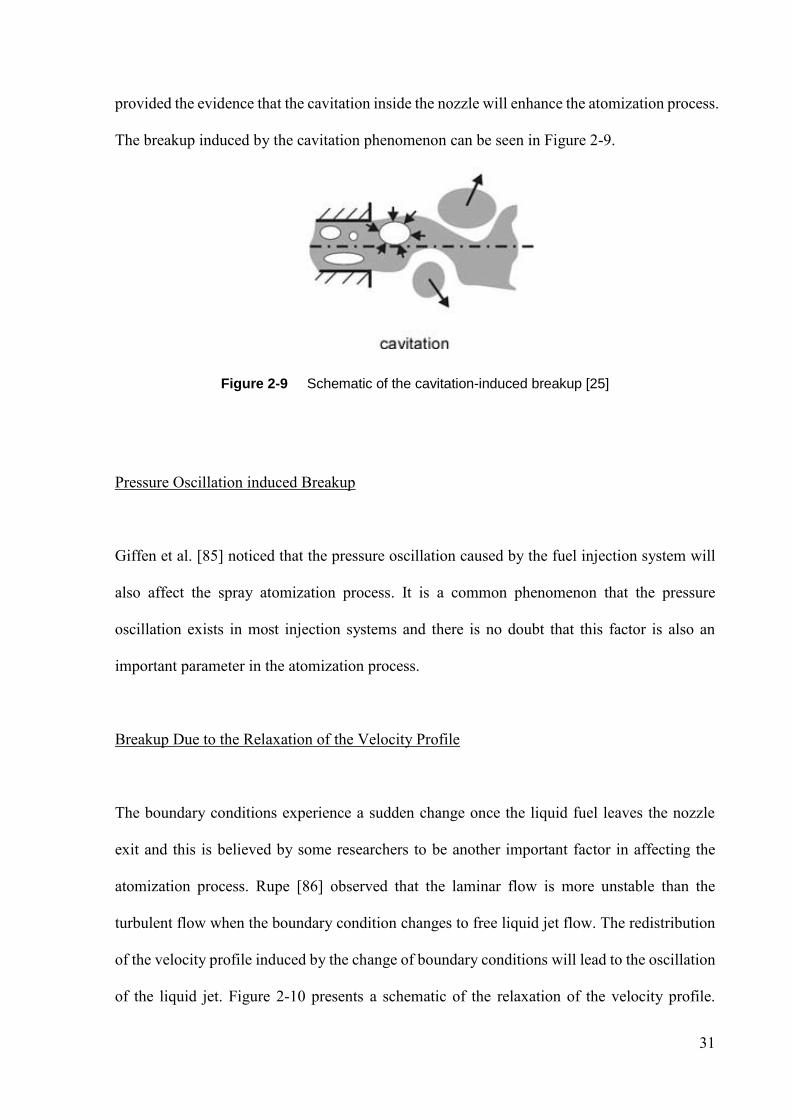
31
provided the evidence that the cavitation inside the nozzle will enhance the atomization process.
The breakup induced by the cavitation phenomenon can be seen in Figure 2-9.
Figure 2-9 Schematic of the cavitation-induced breakup [25]
Pressure Oscillation induced Breakup
Giffen et al. [85] noticed that the pressure oscillation caused by the fuel injection system will
also affect the spray atomization process. It is a common phenomenon that the pressure
oscillation exists in most injection systems and there is no doubt that this factor is also an
important parameter in the atomization process.
Breakup Due to the Relaxation of the Velocity Profile
The boundary conditions experience a sudden change once the liquid fuel leaves the nozzle
exit and this is believed by some researchers to be another important factor in affecting the
atomization process. Rupe [86] observed that the laminar flow is more unstable than the
turbulent flow when the boundary condition changes to free liquid jet flow. The redistribution
of the velocity profile induced by the change of boundary conditions will lead to the oscillation
of the liquid jet. Figure 2-10 presents a schematic of the relaxation of the velocity profile.
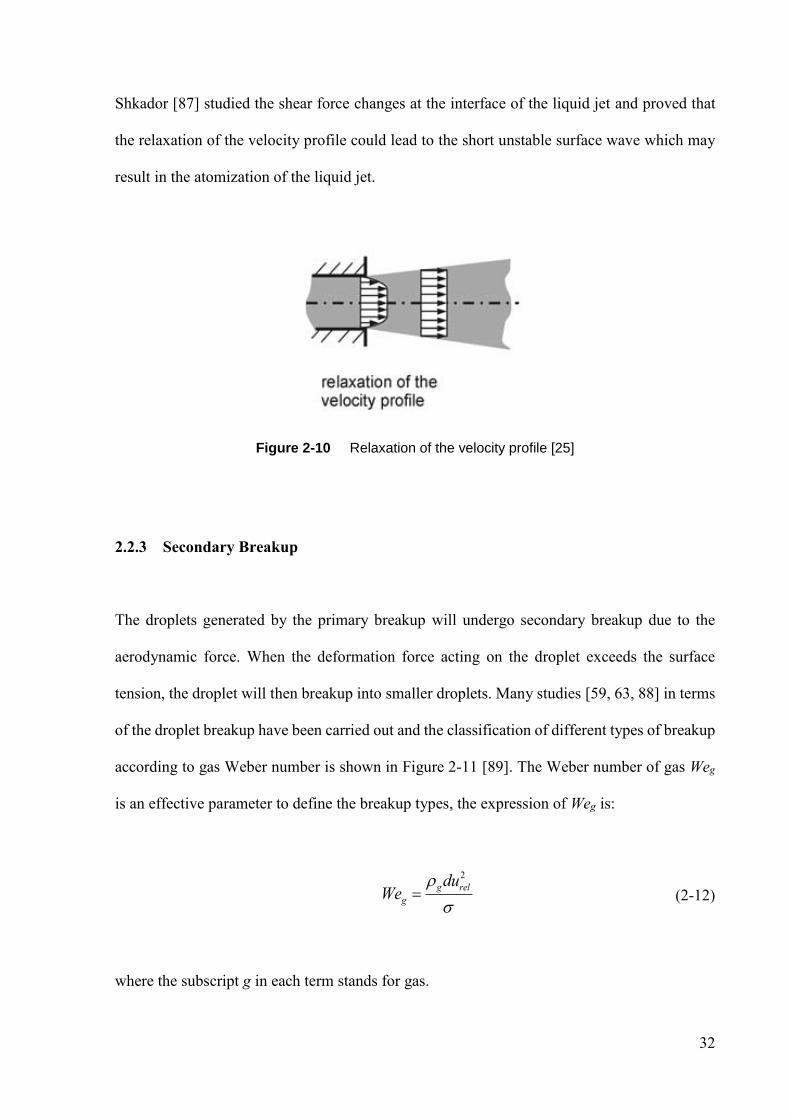
32
Shkador [87] studied the shear force changes at the interface of the liquid jet and proved that
the relaxation of the velocity profile could lead to the short unstable surface wave which may
result in the atomization of the liquid jet.
Figure 2-10 Relaxation of the velocity profile [25]
2.2.3 Secondary Breakup
The droplets generated by the primary breakup will undergo secondary breakup due to the
aerodynamic force. When the deformation force acting on the droplet exceeds the surface
tension, the droplet will then breakup into smaller droplets. Many studies [59, 63, 88] in terms
of the droplet breakup have been carried out and the classification of different types of breakup
according to gas Weber number is shown in Figure 2-11 [89]. The Weber number of gas Weg
is an effective parameter to define the breakup types, the expression of Weg is:
2
g rel
g
duWe
(2-12)
where the subscript g in each term stands for gas.
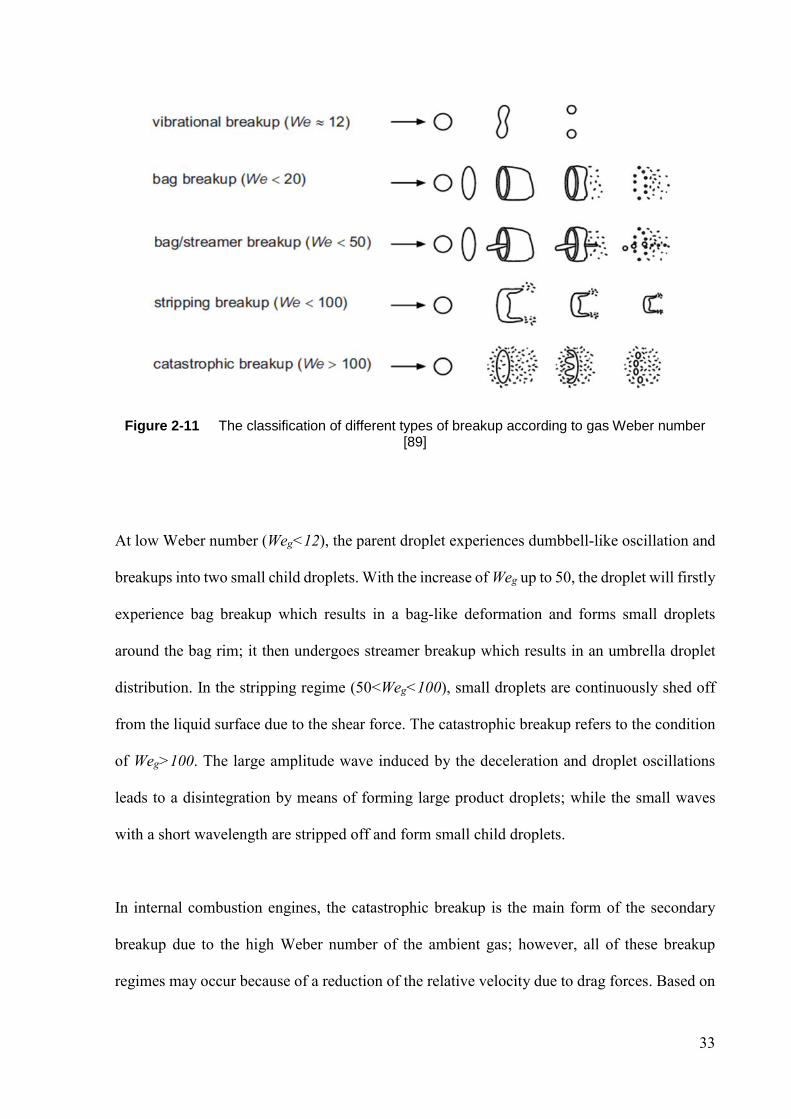
33
Figure 2-11 The classification of different types of breakup according to gas Weber number [89]
At low Weber number (Weg<12), the parent droplet experiences dumbbell-like oscillation and
breakups into two small child droplets. With the increase of Weg up to 50, the droplet will firstly
experience bag breakup which results in a bag-like deformation and forms small droplets
around the bag rim; it then undergoes streamer breakup which results in an umbrella droplet
distribution. In the stripping regime (50<Weg<100), small droplets are continuously shed off
from the liquid surface due to the shear force. The catastrophic breakup refers to the condition
of Weg>100. The large amplitude wave induced by the deceleration and droplet oscillations
leads to a disintegration by means of forming large product droplets; while the small waves
with a short wavelength are stripped off and form small child droplets.
In internal combustion engines, the catastrophic breakup is the main form of the secondary
breakup due to the high Weber number of the ambient gas; however, all of these breakup
regimes may occur because of a reduction of the relative velocity due to drag forces. Based on
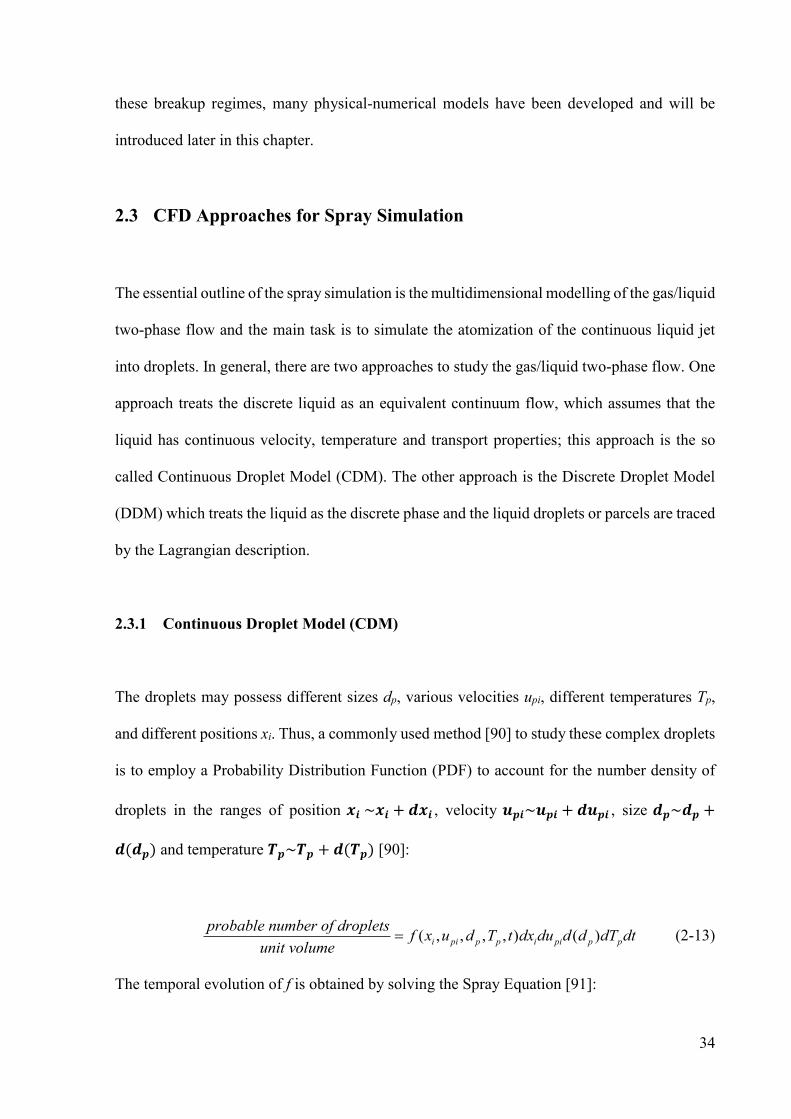
34
these breakup regimes, many physical-numerical models have been developed and will be
introduced later in this chapter.
2.3 CFD Approaches for Spray Simulation
The essential outline of the spray simulation is the multidimensional modelling of the gas/liquid
two-phase flow and the main task is to simulate the atomization of the continuous liquid jet
into droplets. In general, there are two approaches to study the gas/liquid two-phase flow. One
approach treats the discrete liquid as an equivalent continuum flow, which assumes that the
liquid has continuous velocity, temperature and transport properties; this approach is the so
called Continuous Droplet Model (CDM). The other approach is the Discrete Droplet Model
(DDM) which treats the liquid as the discrete phase and the liquid droplets or parcels are traced
by the Lagrangian description.
2.3.1 Continuous Droplet Model (CDM)
The droplets may possess different sizes dp, various velocities upi, different temperatures Tp,
and different positions xi. Thus, a commonly used method [90] to study these complex droplets
is to employ a Probability Distribution Function (PDF) to account for the number density of
droplets in the ranges of position 𝒙𝒊 ~𝒙𝒊 + 𝒅𝒙𝒊 , velocity 𝒖𝒑𝒊~𝒖𝒑𝒊 + 𝒅𝒖𝒑𝒊 , size 𝒅𝒑~𝒅𝒑 +
𝒅(𝒅𝒑) and temperature 𝑻𝒑~𝑻𝒑 + 𝒅(𝑻𝒑) [90]:
( , , , , ) ( )i pi p p i pi p p
probable number of dropletsf x u d T t dx du d d dT dt
unit volume (2-13)
The temporal evolution of f is obtained by solving the Spray Equation [91]:
35
( ) ( ) ( ) ( )pi pi p p s
i pi p p
ffu fu fd fT f
t x u d T
(2-14)
where fs is the source term due to collision, coalescence, breakup, evaporation etc. Equation 2-
14 is also known as the Spray Equation [91].
The CDM approach can describe the flow in a more accurate way; however, the calculation is
at a very high level. It can be noticed that the Spray Equation contains 11 independent
dimensions, thus it becomes extremely complex to solve.
2.3.2 Discrete Droplet Model (DDM)
Based on the Monte-Carlo method, droplets with the same properties can be simulated as a
parcel and then all the droplets in the flow can be represented by a number of parcels. The
DDM approach [92] then deals with these representative parcels and traces these parcels in a
Lagrangian manner. The following assumptions are made in the DDM approach:
Ignore the real atomization process and assume that the continuous liquid jet will
breakup into droplets/parcels once it leaves the injector nozzle.
All the droplets in the flow can be represented by a number of parcels and droplets in
each parcel have the same properties.
Ignore the influence between droplets and the behavior of gas/liquid phases is coupled
by momentum (droplet velocity is reduced, gas velocity is increased), energy (heat
exchange) and mass (evaporated mass passes over to the gas phase) exchanges.
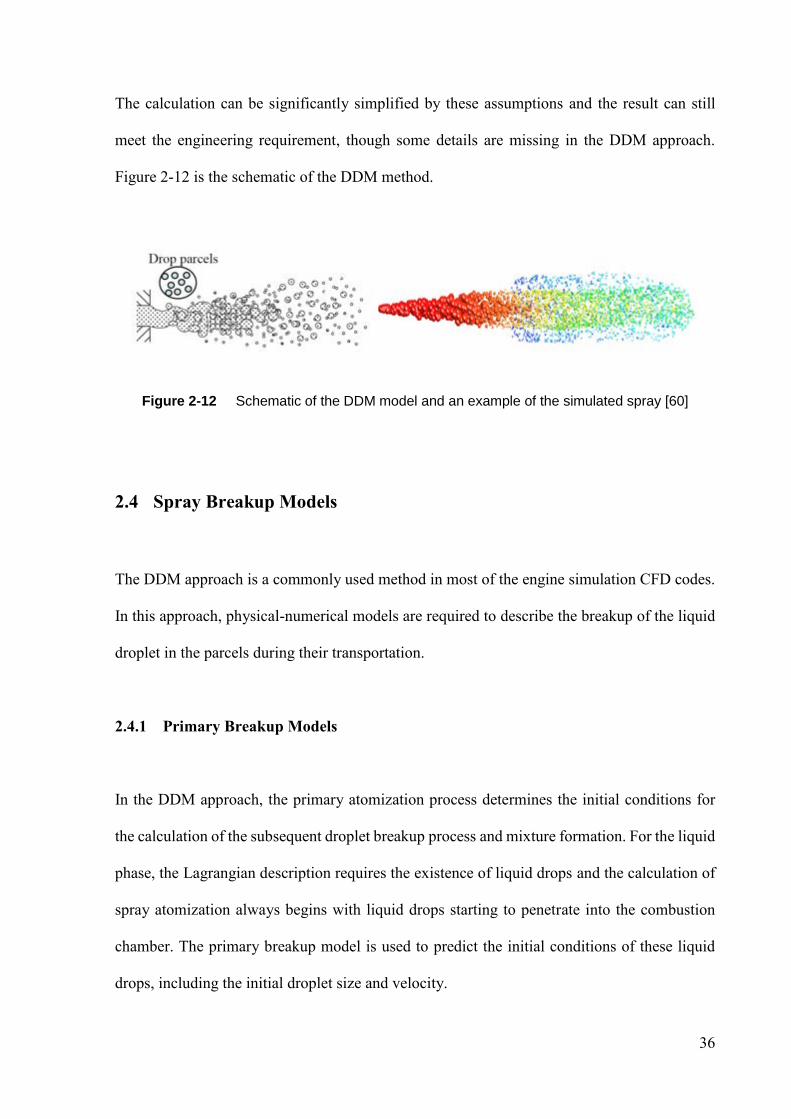
36
The calculation can be significantly simplified by these assumptions and the result can still
meet the engineering requirement, though some details are missing in the DDM approach.
Figure 2-12 is the schematic of the DDM method.
Figure 2-12 Schematic of the DDM model and an example of the simulated spray [60]
2.4 Spray Breakup Models
The DDM approach is a commonly used method in most of the engine simulation CFD codes.
In this approach, physical-numerical models are required to describe the breakup of the liquid
droplet in the parcels during their transportation.
2.4.1 Primary Breakup Models
In the DDM approach, the primary atomization process determines the initial conditions for
the calculation of the subsequent droplet breakup process and mixture formation. For the liquid
phase, the Lagrangian description requires the existence of liquid drops and the calculation of
spray atomization always begins with liquid drops starting to penetrate into the combustion
chamber. The primary breakup model is used to predict the initial conditions of these liquid
drops, including the initial droplet size and velocity.
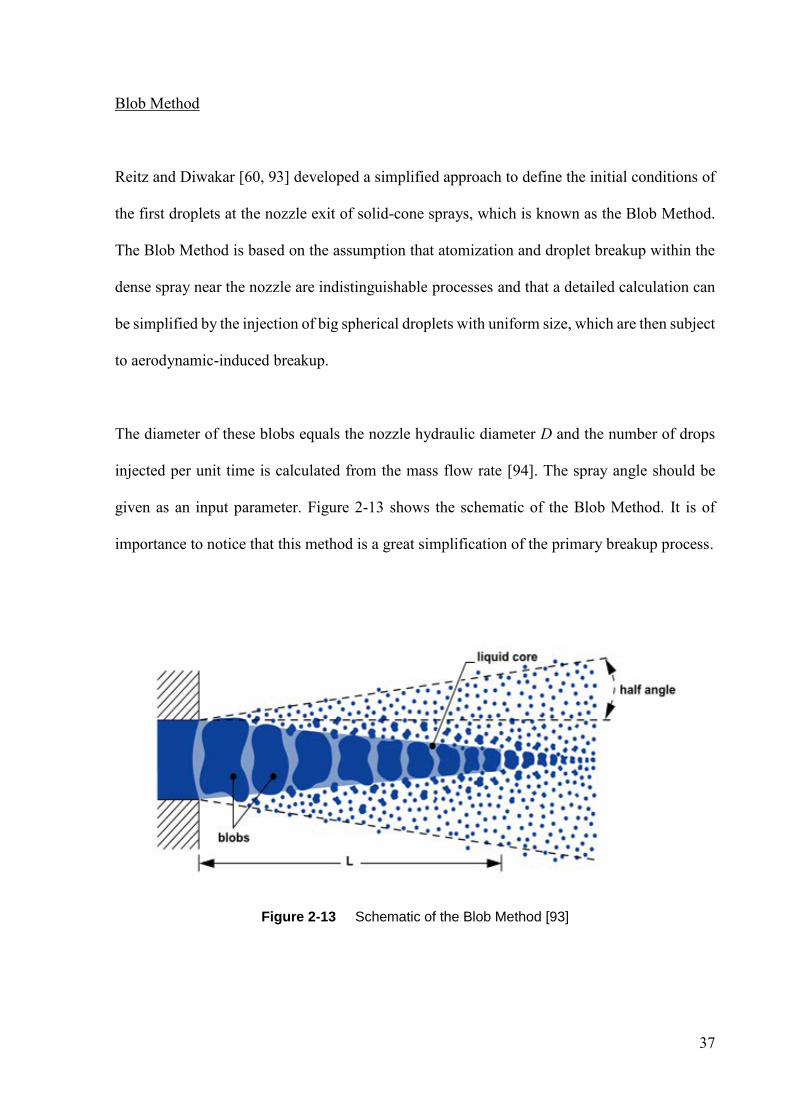
37
Blob Method
Reitz and Diwakar [60, 93] developed a simplified approach to define the initial conditions of
the first droplets at the nozzle exit of solid-cone sprays, which is known as the Blob Method.
The Blob Method is based on the assumption that atomization and droplet breakup within the
dense spray near the nozzle are indistinguishable processes and that a detailed calculation can
be simplified by the injection of big spherical droplets with uniform size, which are then subject
to aerodynamic-induced breakup.
The diameter of these blobs equals the nozzle hydraulic diameter D and the number of drops
injected per unit time is calculated from the mass flow rate [94]. The spray angle should be
given as an input parameter. Figure 2-13 shows the schematic of the Blob Method. It is of
importance to notice that this method is a great simplification of the primary breakup process.
Figure 2-13 Schematic of the Blob Method [93]
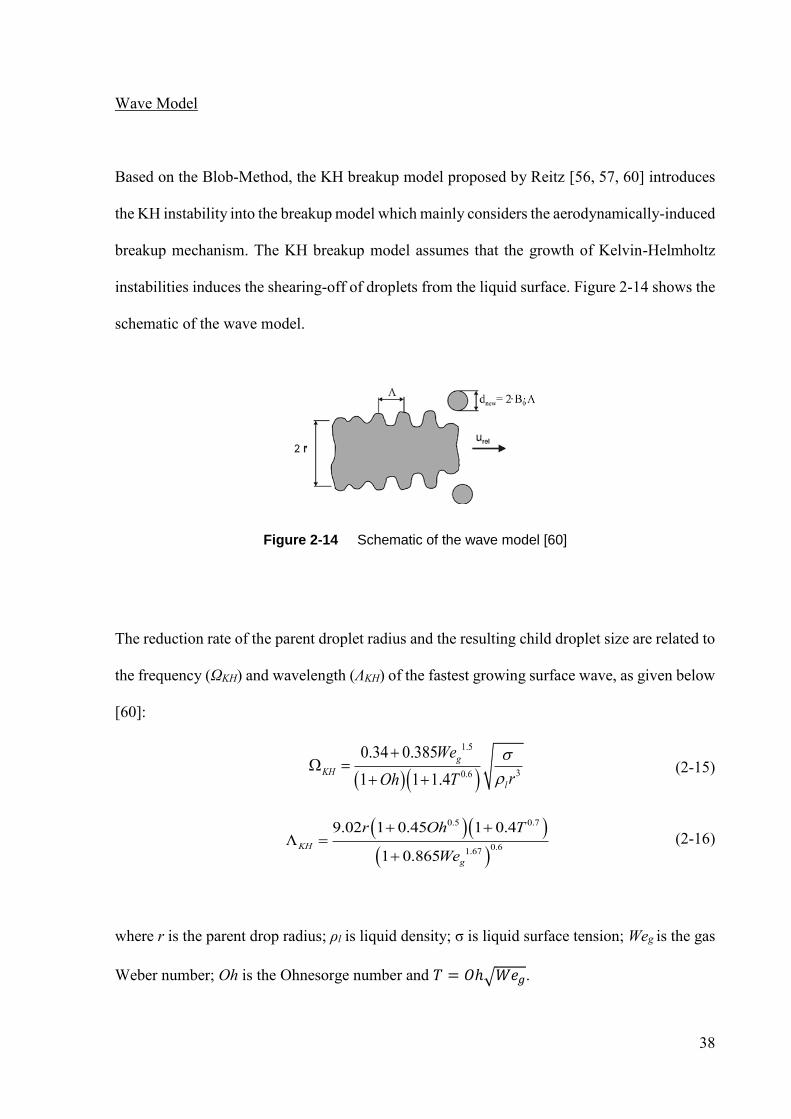
38
Wave Model
Based on the Blob-Method, the KH breakup model proposed by Reitz [56, 57, 60] introduces
the KH instability into the breakup model which mainly considers the aerodynamically-induced
breakup mechanism. The KH breakup model assumes that the growth of Kelvin-Helmholtz
instabilities induces the shearing-off of droplets from the liquid surface. Figure 2-14 shows the
schematic of the wave model.
Figure 2-14 Schematic of the wave model [60]
The reduction rate of the parent droplet radius and the resulting child droplet size are related to
the frequency (ΩKH) and wavelength (ΛKH) of the fastest growing surface wave, as given below
[60]:
1.5
30.6
0.34 0.385
1 1 1.4
g
KH
l
We
rOh T
(2-15)
0.5 0.7
0.61.67
9.02 1 0.45 1 0.4
1 0.865KH
g
r Oh T
We
(2-16)
where r is the parent drop radius; ρl is liquid density; σ is liquid surface tension; Weg is the gas
Weber number; Oh is the Ohnesorge number and 𝑇 = 𝑂ℎ√𝑊𝑒𝑔.
39
The radius of the parent droplet decreases continuously according to Equation (2-17) until it
reaches the criterion of the KH breakup [60]:
KH
KH
r rdr
dt
, KHr r (2-17)
The child drop size rKH and breakup time τKH are [60]:
0KH KHr B (2-18)
13.788KH
KH KH
B r
(2-19)
where B0 and B1 are the model constants.
The KH breakup occurs and a new droplet parcel with drop radius rKH will be created once the
shed mass exceeds 5% of the initial parcel mass.
Huh and Gosman Turbulence-induced Breakup Model
Huh et al [80] developed a turbulence induced breakup model for the primary atomization
process. In this model, the effects of both aerodynamic-induced instabilities on the jet surface
and flow turbulence in the jet are considered. Adopting the Blob Method, the liquid jet is
simulated as a train of blob parcels issued from the nozzle and the turbulent fluctuations in the
jet flow are an important parameter to produce the initial perturbations on the liquid surface;
which grow exponentially due to the KH instability, until they detach as atomized droplets.
40
Then, the droplets formed after the primary disintegration may undergo further secondary
breakups. This model solves the potential problem of the wave model, where the exponential
wave growth rate becomes zero at zero perturbation amplitude.
The characteristic length scale Ltw and the time scale τtw of atomization are [80]:
1 2tw t wL C L C L (2-20)
3 4tw t wC C (2-21)
where Lt, the turbulence length scale, is the dominant length scale and Lw is the wavelength of
surface perturbations; and τt and τw are the turbulence time scale and the wave growth time
scale, respectively. The empirical constants C1 to C4 are set to 2.0, 0.5, 1.2 and 0.5 respectively,
according to [80].
The time-dependent turbulence length and time scales are given as a function of the time and
the initial turbulence conditions as [80]:
0.457
0
0
0.0828( ) 1t t
t
tL t L
(2-22)
0( ) 0.0828t tt t (2-23)
The initial turbulence length Lt0 and time scale τt
0 are calculated using average quantities for
the turbulent kinetic energy and energy dissipation rate [80]:
41
1.5
0 avg
t
avg
kL C
(2-24)
0
t
avg
avg
kC
(2-25)
where Cµ = 0.09 and the average quantities are estimated [95] as:
22
2
1(1 )
8( / )avg c
d
Uk K s
L D c
(2-26)
22
2
1(1 )
2avg c
d
UK K s
L c
(2-27)
where L and D are the hole length and diameter; U is the initial liquid velocity at the nozzle
exit; Cd is the discharge coefficient; Kc is a constant, taking into account losses in the
contraction corner; Ks is a constant for average turbulent energy dissipation; and s is the area
contraction ratio of the nozzle hole. The ranges of these empirical constants are suggested in
[80].
Ignoring the surface tension and viscous effects and maintaining only the aerodynamic
destabilizing term, the wave growth timescale is calculated as [80]:
w lw
g
L
U
(2-28)
The parent drop radius decreases continuously according to the ratio of the atomization length
over the time scale [80]:
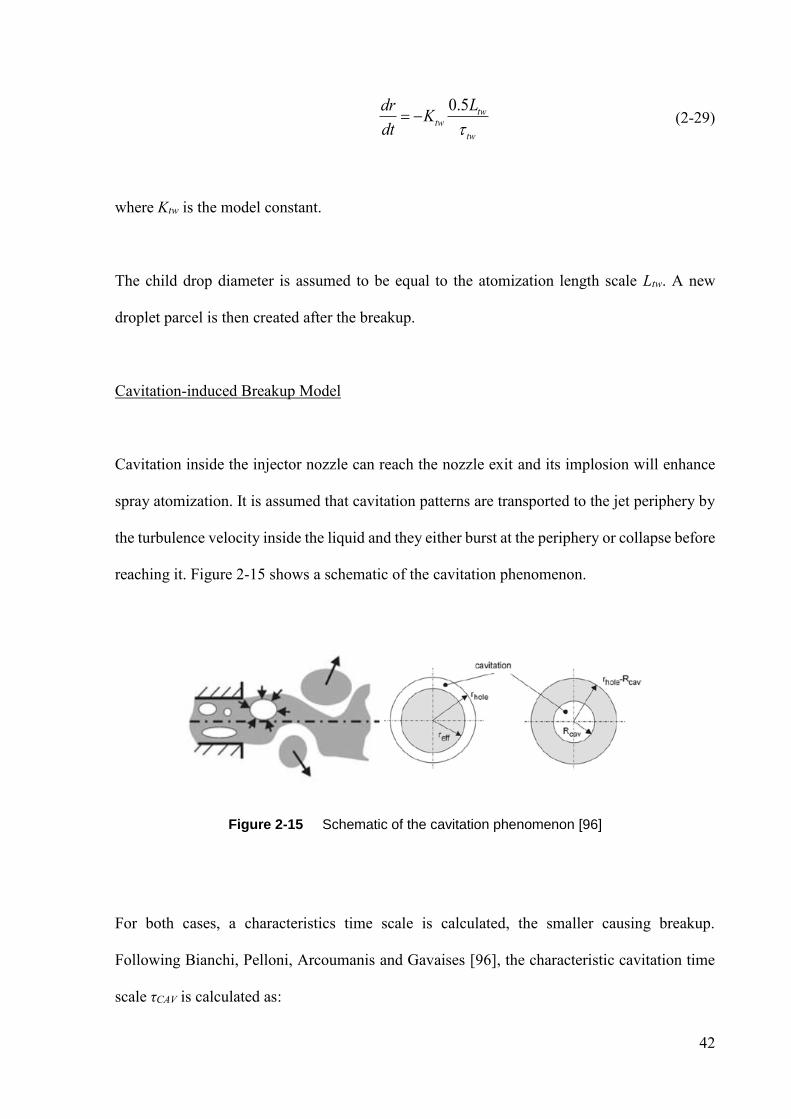
42
0.5 twtw
tw
LdrK
dt (2-29)
where Ktw is the model constant.
The child drop diameter is assumed to be equal to the atomization length scale Ltw. A new
droplet parcel is then created after the breakup.
Cavitation-induced Breakup Model
Cavitation inside the injector nozzle can reach the nozzle exit and its implosion will enhance
spray atomization. It is assumed that cavitation patterns are transported to the jet periphery by
the turbulence velocity inside the liquid and they either burst at the periphery or collapse before
reaching it. Figure 2-15 shows a schematic of the cavitation phenomenon.
Figure 2-15 Schematic of the cavitation phenomenon [96]
For both cases, a characteristics time scale is calculated, the smaller causing breakup.
Following Bianchi, Pelloni, Arcoumanis and Gavaises [96], the characteristic cavitation time
scale τCAV is calculated as:
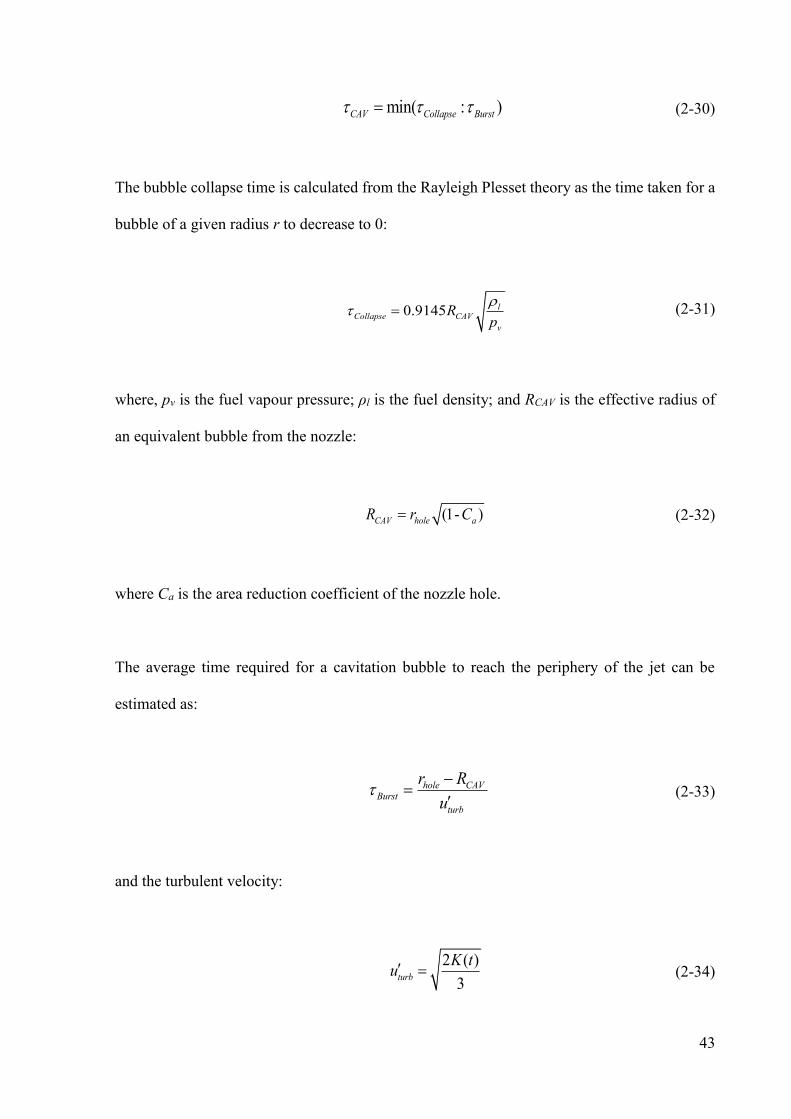
43
min( : )CAV Collapse Burst (2-30)
The bubble collapse time is calculated from the Rayleigh Plesset theory as the time taken for a
bubble of a given radius r to decrease to 0:
0.9145 lCollapse CAV
v
Rp
(2-31)
where, pv is the fuel vapour pressure; ρl is the fuel density; and RCAV is the effective radius of
an equivalent bubble from the nozzle:
(1- )CAV hole aR r C (2-32)
where Ca is the area reduction coefficient of the nozzle hole.
The average time required for a cavitation bubble to reach the periphery of the jet can be
estimated as:
hole CAVBurst
turb
r R
u
(2-33)
and the turbulent velocity:
2 ( )
3turb
K tu (2-34)
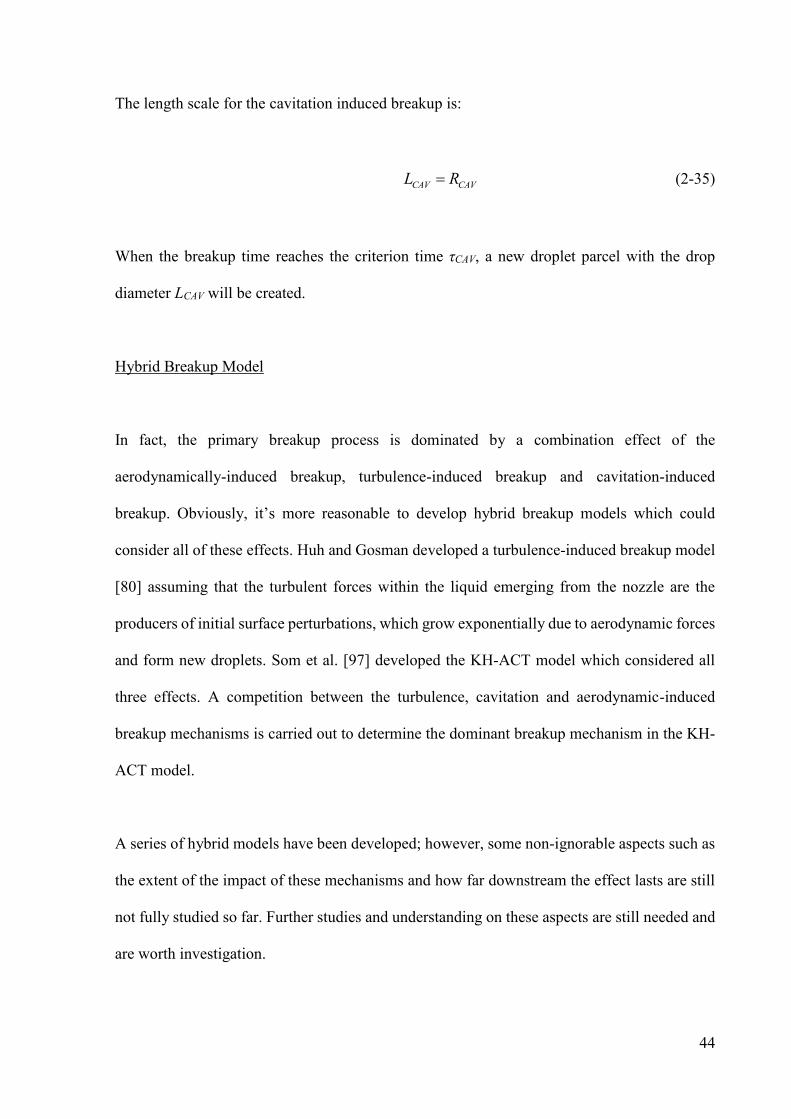
44
The length scale for the cavitation induced breakup is:
CAV CAVL R (2-35)
When the breakup time reaches the criterion time τCAV, a new droplet parcel with the drop
diameter LCAV will be created.
Hybrid Breakup Model
In fact, the primary breakup process is dominated by a combination effect of the
aerodynamically-induced breakup, turbulence-induced breakup and cavitation-induced
breakup. Obviously, it’s more reasonable to develop hybrid breakup models which could
consider all of these effects. Huh and Gosman developed a turbulence-induced breakup model
[80] assuming that the turbulent forces within the liquid emerging from the nozzle are the
producers of initial surface perturbations, which grow exponentially due to aerodynamic forces
and form new droplets. Som et al. [97] developed the KH-ACT model which considered all
three effects. A competition between the turbulence, cavitation and aerodynamic-induced
breakup mechanisms is carried out to determine the dominant breakup mechanism in the KH-
ACT model.
A series of hybrid models have been developed; however, some non-ignorable aspects such as
the extent of the impact of these mechanisms and how far downstream the effect lasts are still
not fully studied so far. Further studies and understanding on these aspects are still needed and
are worth investigation.
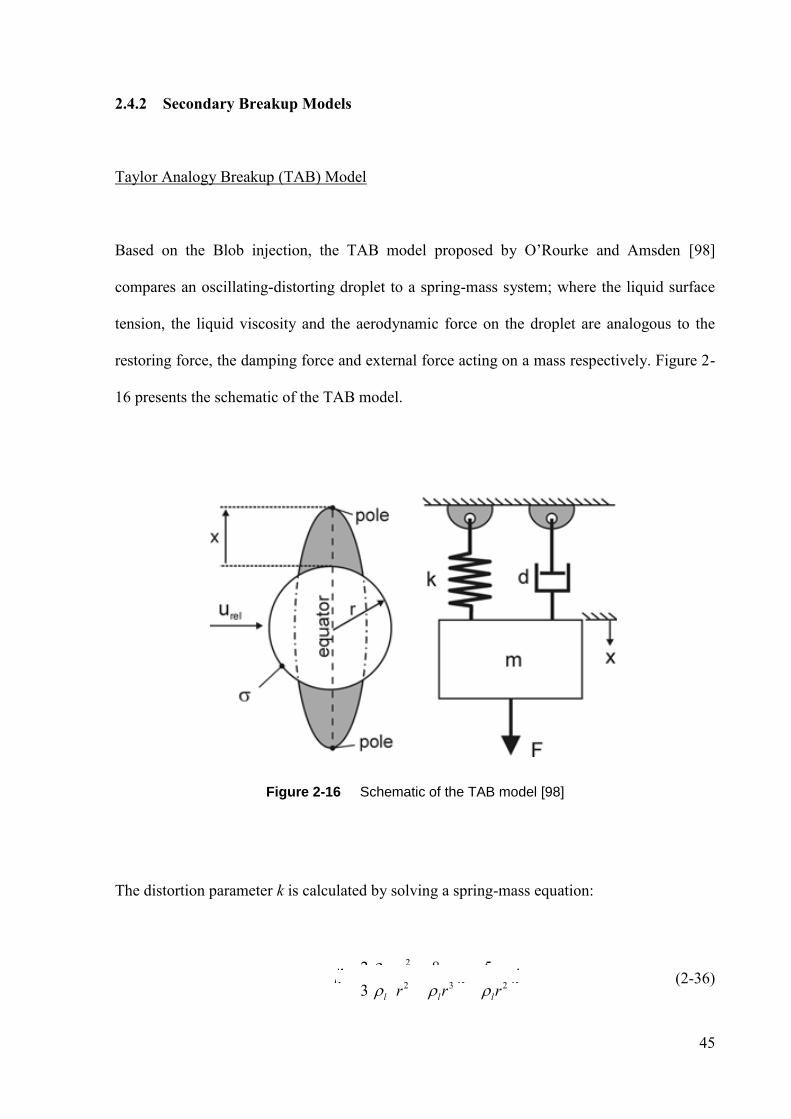
45
2.4.2 Secondary Breakup Models
Taylor Analogy Breakup (TAB) Model
Based on the Blob injection, the TAB model proposed by O’Rourke and Amsden [98]
compares an oscillating-distorting droplet to a spring-mass system; where the liquid surface
tension, the liquid viscosity and the aerodynamic force on the droplet are analogous to the
restoring force, the damping force and external force acting on a mass respectively. Figure 2-
16 presents the schematic of the TAB model.
Figure 2-16 Schematic of the TAB model [98]
The distortion parameter k is calculated by solving a spring-mass equation:
2
2 3 2
52 8
3
g l
l l l
wk k k
r r r
(2-36)
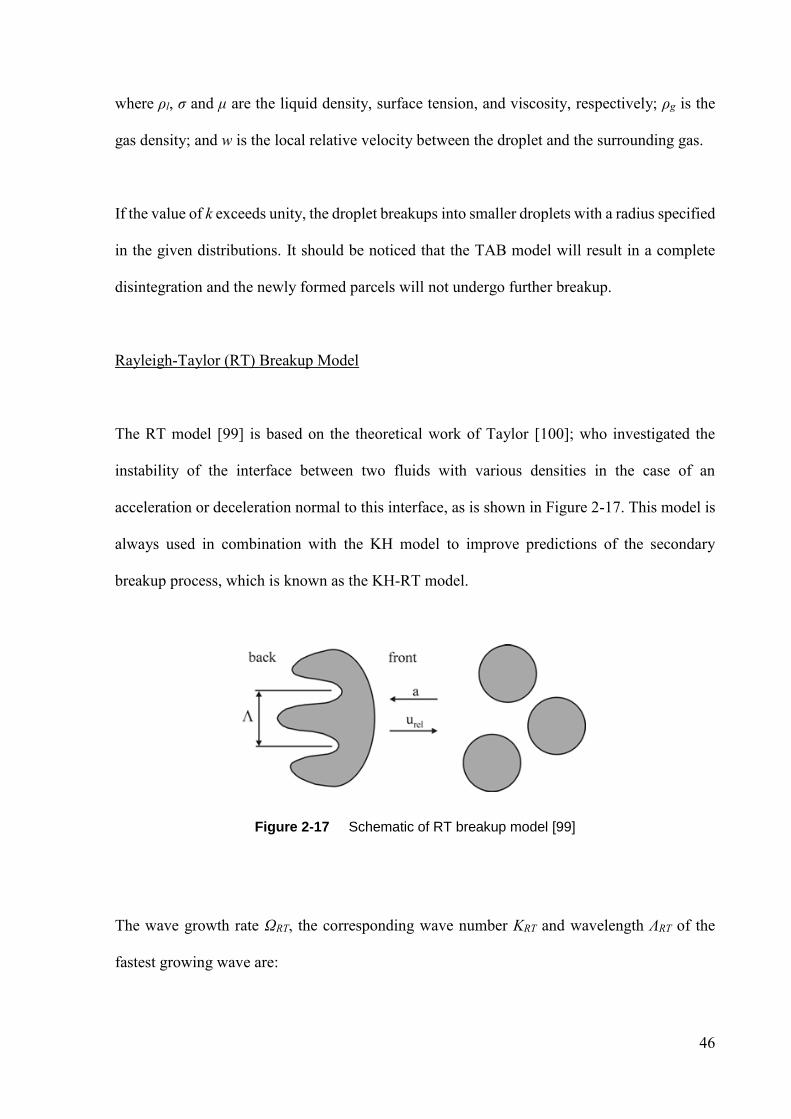
46
where ρl, σ and μ are the liquid density, surface tension, and viscosity, respectively; ρg is the
gas density; and w is the local relative velocity between the droplet and the surrounding gas.
If the value of k exceeds unity, the droplet breakups into smaller droplets with a radius specified
in the given distributions. It should be noticed that the TAB model will result in a complete
disintegration and the newly formed parcels will not undergo further breakup.
Rayleigh-Taylor (RT) Breakup Model
The RT model [99] is based on the theoretical work of Taylor [100]; who investigated the
instability of the interface between two fluids with various densities in the case of an
acceleration or deceleration normal to this interface, as is shown in Figure 2-17. This model is
always used in combination with the KH model to improve predictions of the secondary
breakup process, which is known as the KH-RT model.
Figure 2-17 Schematic of RT breakup model [99]
The wave growth rate ΩRT, the corresponding wave number KRT and wavelength ΛRT of the
fastest growing wave are:
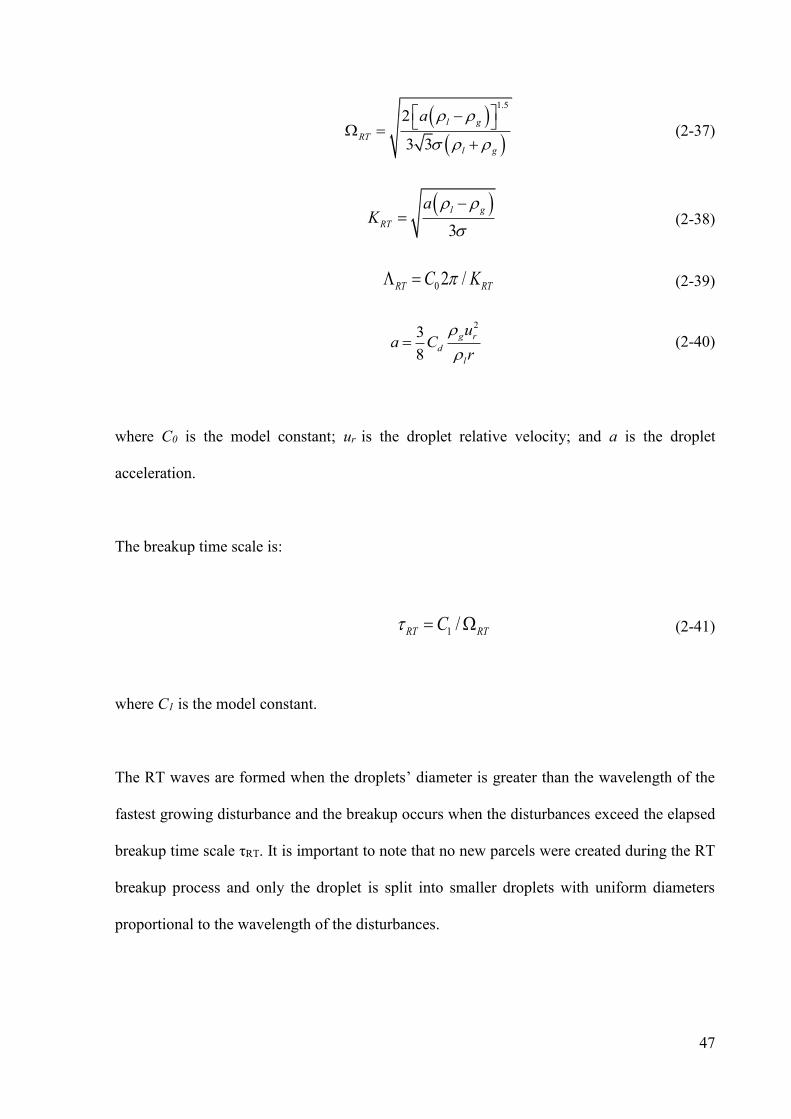
47
1.5
2
3 3
l g
RT
l g
a
(2-37)
3
l g
RT
aK
(2-38)
0 2 /RT RTC K (2-39)
23
8
g r
d
l
ua C
r
(2-40)
where C0 is the model constant; ur is the droplet relative velocity; and a is the droplet
acceleration.
The breakup time scale is:
1 /RT RTC (2-41)
where C1 is the model constant.
The RT waves are formed when the droplets’ diameter is greater than the wavelength of the
fastest growing disturbance and the breakup occurs when the disturbances exceed the elapsed
breakup time scale τRT. It is important to note that no new parcels were created during the RT
breakup process and only the droplet is split into smaller droplets with uniform diameters
proportional to the wavelength of the disturbances.
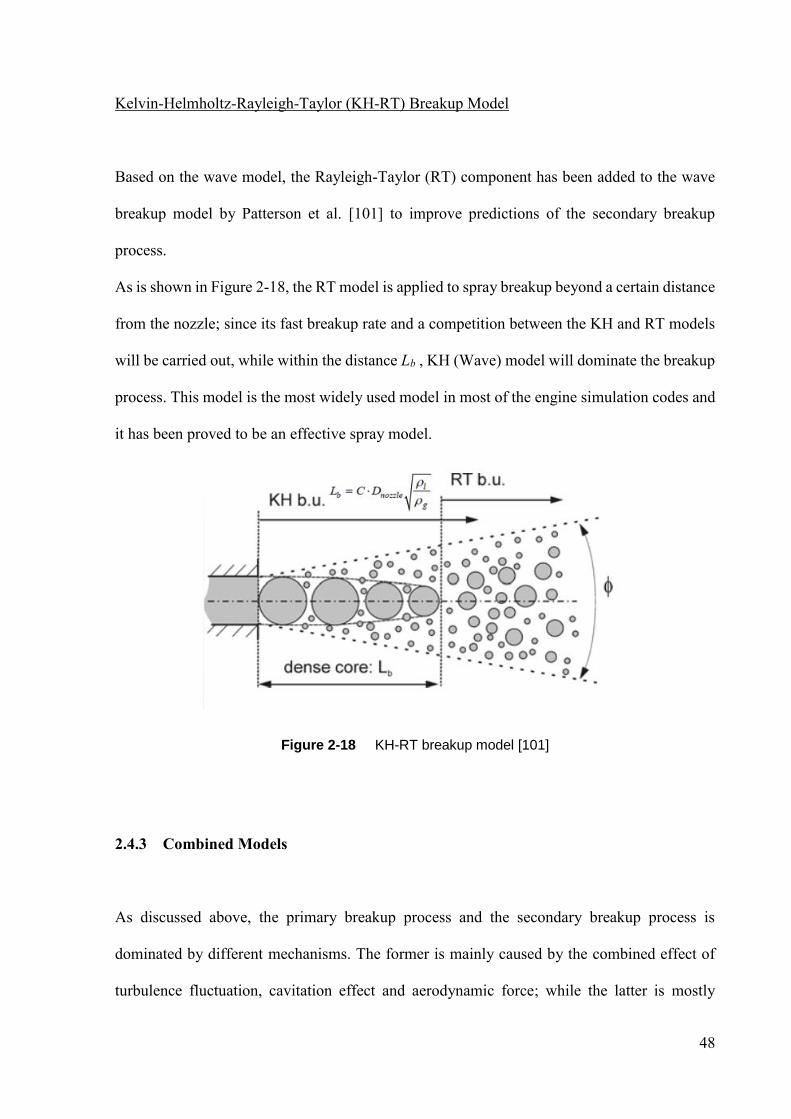
48
Kelvin-Helmholtz-Rayleigh-Taylor (KH-RT) Breakup Model
Based on the wave model, the Rayleigh-Taylor (RT) component has been added to the wave
breakup model by Patterson et al. [101] to improve predictions of the secondary breakup
process.
As is shown in Figure 2-18, the RT model is applied to spray breakup beyond a certain distance
from the nozzle; since its fast breakup rate and a competition between the KH and RT models
will be carried out, while within the distance Lb , KH (Wave) model will dominate the breakup
process. This model is the most widely used model in most of the engine simulation codes and
it has been proved to be an effective spray model.
Figure 2-18 KH-RT breakup model [101]
2.4.3 Combined Models
As discussed above, the primary breakup process and the secondary breakup process is
dominated by different mechanisms. The former is mainly caused by the combined effect of
turbulence fluctuation, cavitation effect and aerodynamic force; while the latter is mostly
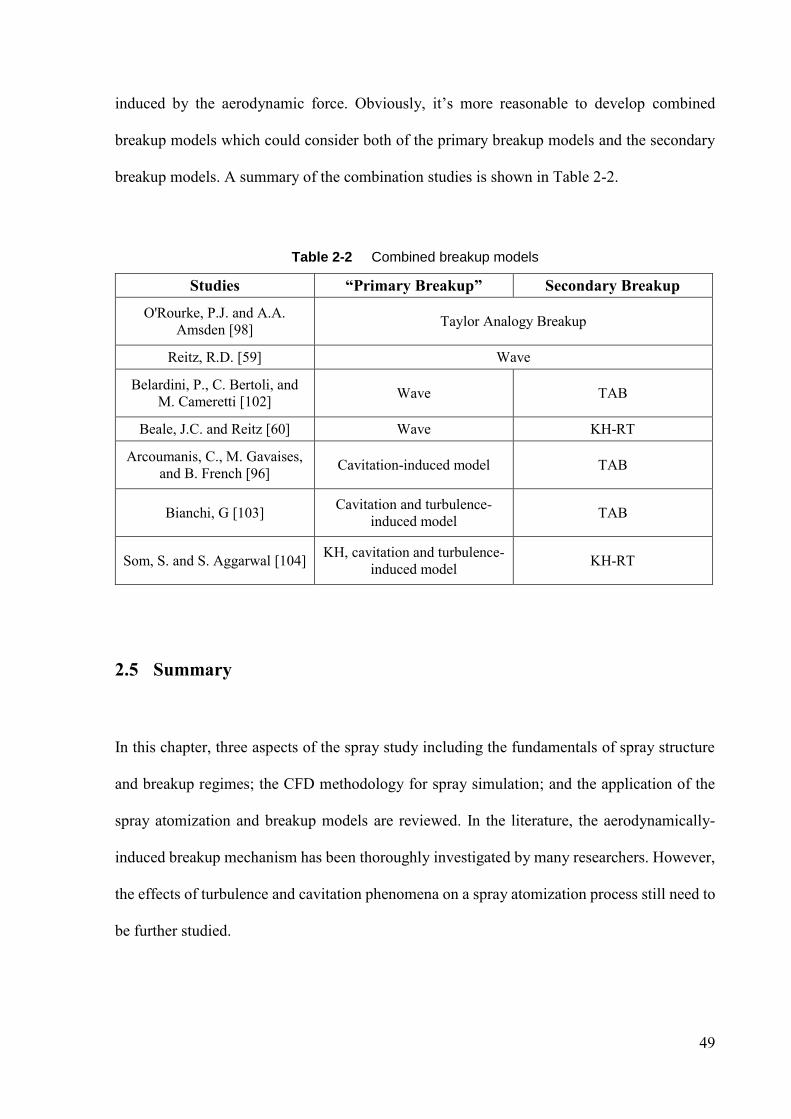
49
induced by the aerodynamic force. Obviously, it’s more reasonable to develop combined
breakup models which could consider both of the primary breakup models and the secondary
breakup models. A summary of the combination studies is shown in Table 2-2.
Table 2-2 Combined breakup models
Studies “Primary Breakup” Secondary Breakup
O'Rourke, P.J. and A.A.
Amsden [98] Taylor Analogy Breakup
Reitz, R.D. [59] Wave
Belardini, P., C. Bertoli, and
M. Cameretti [102] Wave TAB
Beale, J.C. and Reitz [60] Wave KH-RT
Arcoumanis, C., M. Gavaises,
and B. French [96] Cavitation-induced model TAB
Bianchi, G [103] Cavitation and turbulence-
induced model TAB
Som, S. and S. Aggarwal [104] KH, cavitation and turbulence-
induced model KH-RT
2.5 Summary
In this chapter, three aspects of the spray study including the fundamentals of spray structure
and breakup regimes; the CFD methodology for spray simulation; and the application of the
spray atomization and breakup models are reviewed. In the literature, the aerodynamically-
induced breakup mechanism has been thoroughly investigated by many researchers. However,
the effects of turbulence and cavitation phenomena on a spray atomization process still need to
be further studied.
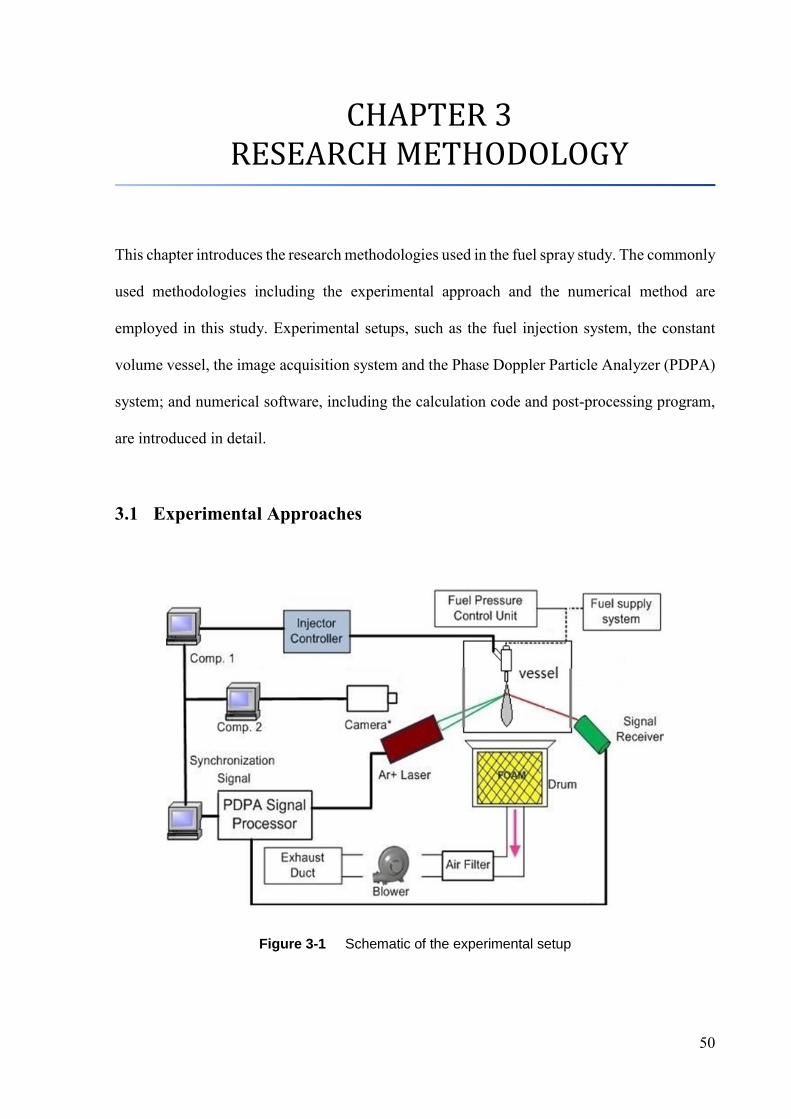
50
3 CHAPTER 3 RESEARCH METHODOLOGY
This chapter introduces the research methodologies used in the fuel spray study. The commonly
used methodologies including the experimental approach and the numerical method are
employed in this study. Experimental setups, such as the fuel injection system, the constant
volume vessel, the image acquisition system and the Phase Doppler Particle Analyzer (PDPA)
system; and numerical software, including the calculation code and post-processing program,
are introduced in detail.
3.1 Experimental Approaches
Figure 3-1 Schematic of the experimental setup
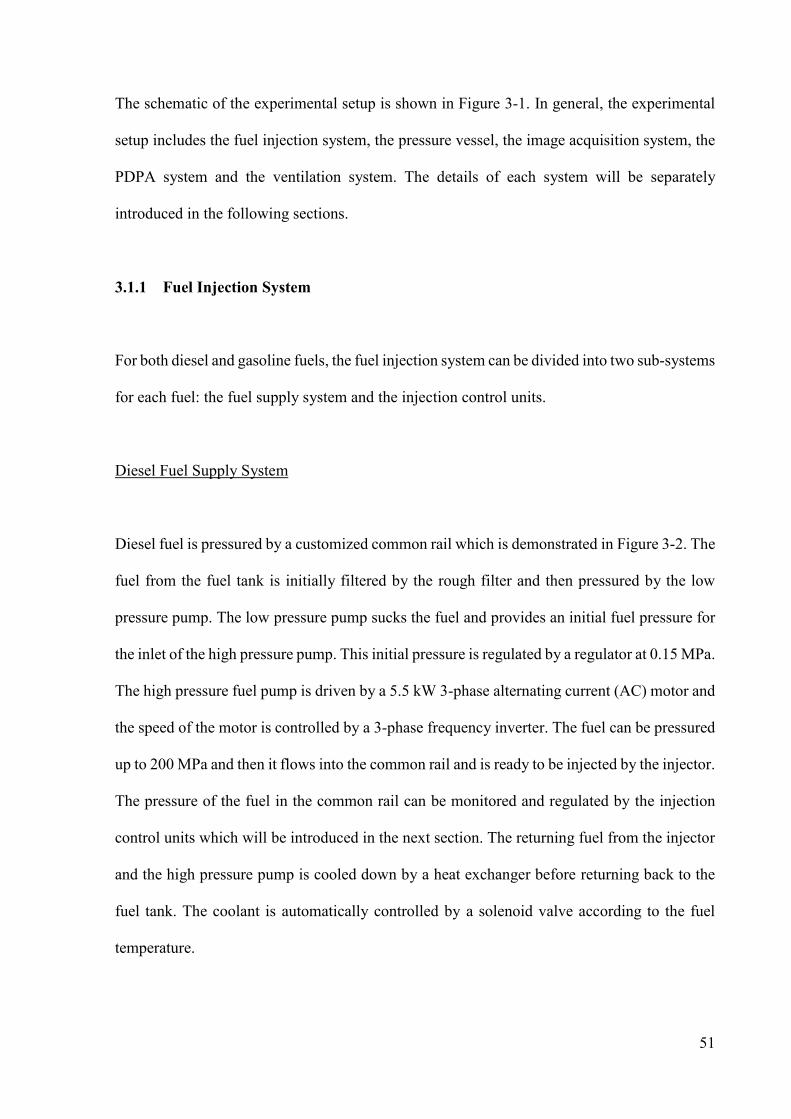
51
The schematic of the experimental setup is shown in Figure 3-1. In general, the experimental
setup includes the fuel injection system, the pressure vessel, the image acquisition system, the
PDPA system and the ventilation system. The details of each system will be separately
introduced in the following sections.
3.1.1 Fuel Injection System
For both diesel and gasoline fuels, the fuel injection system can be divided into two sub-systems
for each fuel: the fuel supply system and the injection control units.
Diesel Fuel Supply System
Diesel fuel is pressured by a customized common rail which is demonstrated in Figure 3-2. The
fuel from the fuel tank is initially filtered by the rough filter and then pressured by the low
pressure pump. The low pressure pump sucks the fuel and provides an initial fuel pressure for
the inlet of the high pressure pump. This initial pressure is regulated by a regulator at 0.15 MPa.
The high pressure fuel pump is driven by a 5.5 kW 3-phase alternating current (AC) motor and
the speed of the motor is controlled by a 3-phase frequency inverter. The fuel can be pressured
up to 200 MPa and then it flows into the common rail and is ready to be injected by the injector.
The pressure of the fuel in the common rail can be monitored and regulated by the injection
control units which will be introduced in the next section. The returning fuel from the injector
and the high pressure pump is cooled down by a heat exchanger before returning back to the
fuel tank. The coolant is automatically controlled by a solenoid valve according to the fuel
temperature.
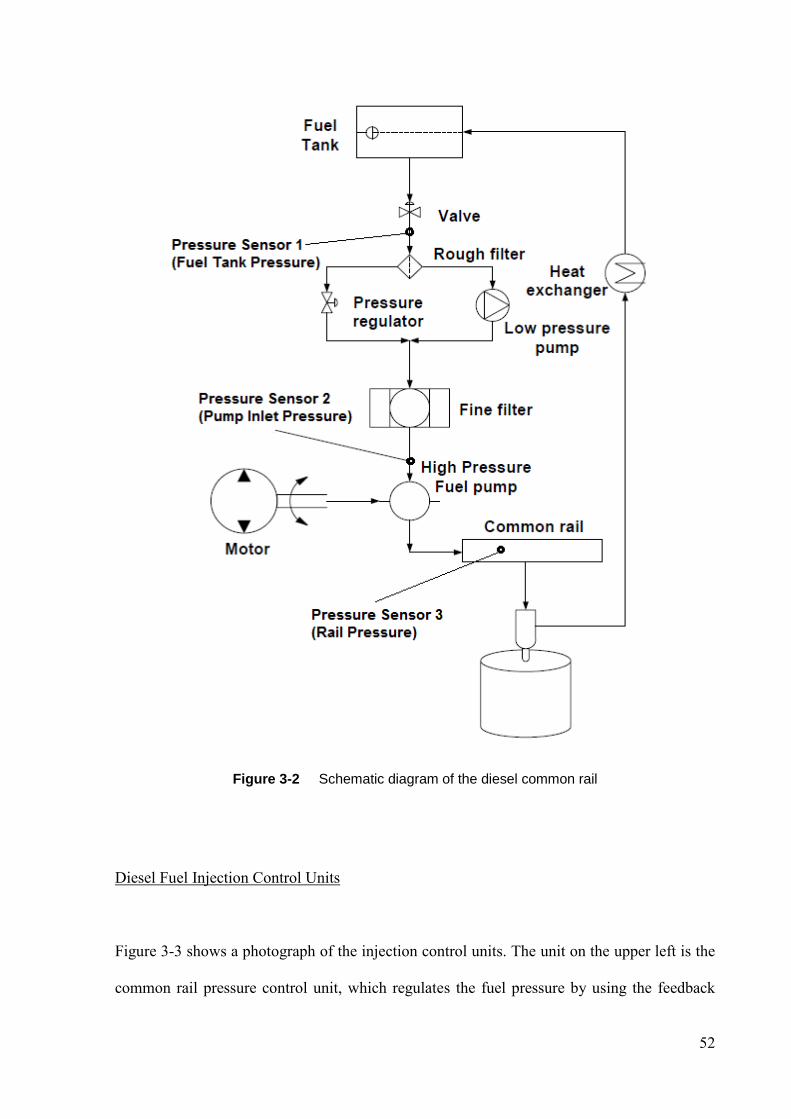
52
Figure 3-2 Schematic diagram of the diesel common rail
Diesel Fuel Injection Control Units
Figure 3-3 shows a photograph of the injection control units. The unit on the upper left is the
common rail pressure control unit, which regulates the fuel pressure by using the feedback
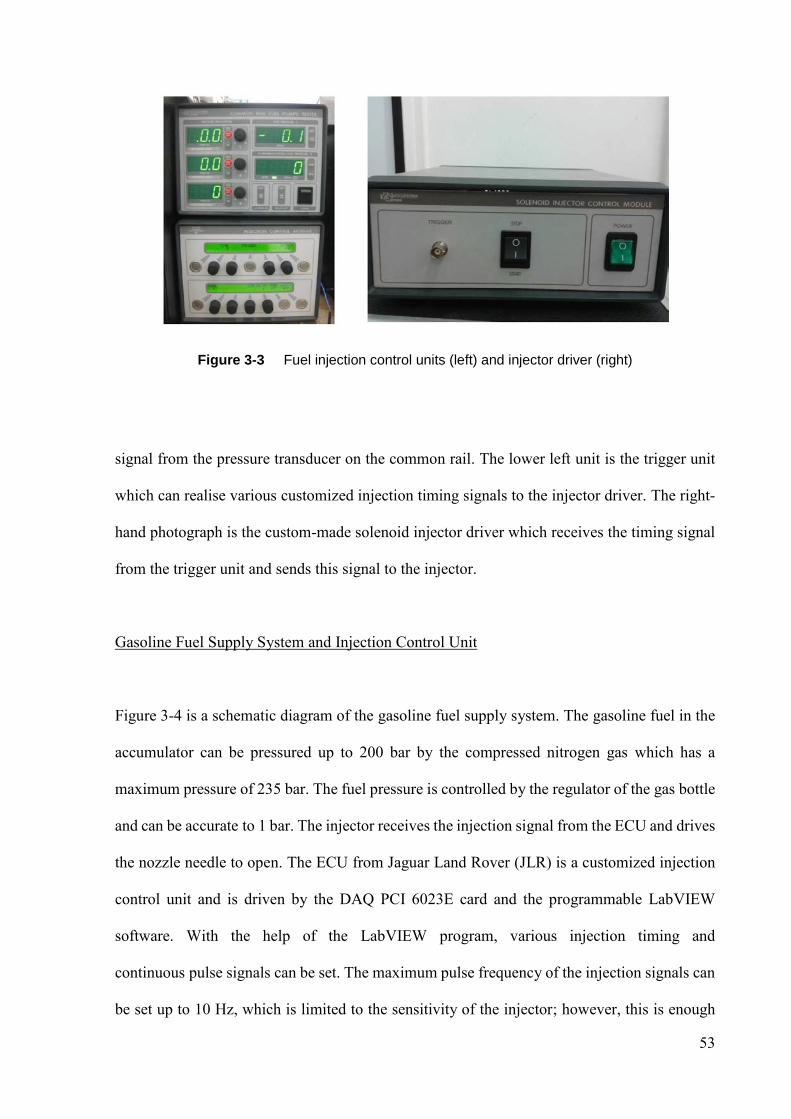
53
Figure 3-3 Fuel injection control units (left) and injector driver (right)
signal from the pressure transducer on the common rail. The lower left unit is the trigger unit
which can realise various customized injection timing signals to the injector driver. The right-
hand photograph is the custom-made solenoid injector driver which receives the timing signal
from the trigger unit and sends this signal to the injector.
Gasoline Fuel Supply System and Injection Control Unit
Figure 3-4 is a schematic diagram of the gasoline fuel supply system. The gasoline fuel in the
accumulator can be pressured up to 200 bar by the compressed nitrogen gas which has a
maximum pressure of 235 bar. The fuel pressure is controlled by the regulator of the gas bottle
and can be accurate to 1 bar. The injector receives the injection signal from the ECU and drives
the nozzle needle to open. The ECU from Jaguar Land Rover (JLR) is a customized injection
control unit and is driven by the DAQ PCI 6023E card and the programmable LabVIEW
software. With the help of the LabVIEW program, various injection timing and
continuous pulse signals can be set. The maximum pulse frequency of the injection signals can
be set up to 10 Hz, which is limited to the sensitivity of the injector; however, this is enough
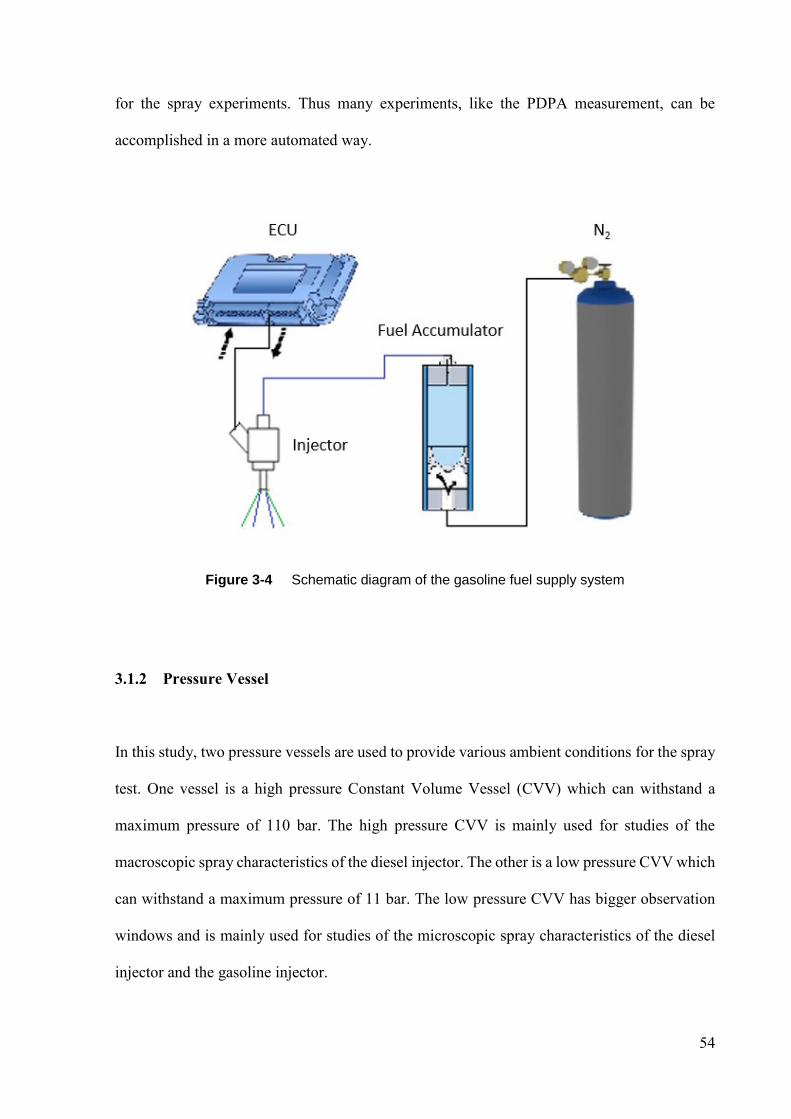
54
for the spray experiments. Thus many experiments, like the PDPA measurement, can be
accomplished in a more automated way.
Figure 3-4 Schematic diagram of the gasoline fuel supply system
3.1.2 Pressure Vessel
In this study, two pressure vessels are used to provide various ambient conditions for the spray
test. One vessel is a high pressure Constant Volume Vessel (CVV) which can withstand a
maximum pressure of 110 bar. The high pressure CVV is mainly used for studies of the
macroscopic spray characteristics of the diesel injector. The other is a low pressure CVV which
can withstand a maximum pressure of 11 bar. The low pressure CVV has bigger observation
windows and is mainly used for studies of the microscopic spray characteristics of the diesel
injector and the gasoline injector.
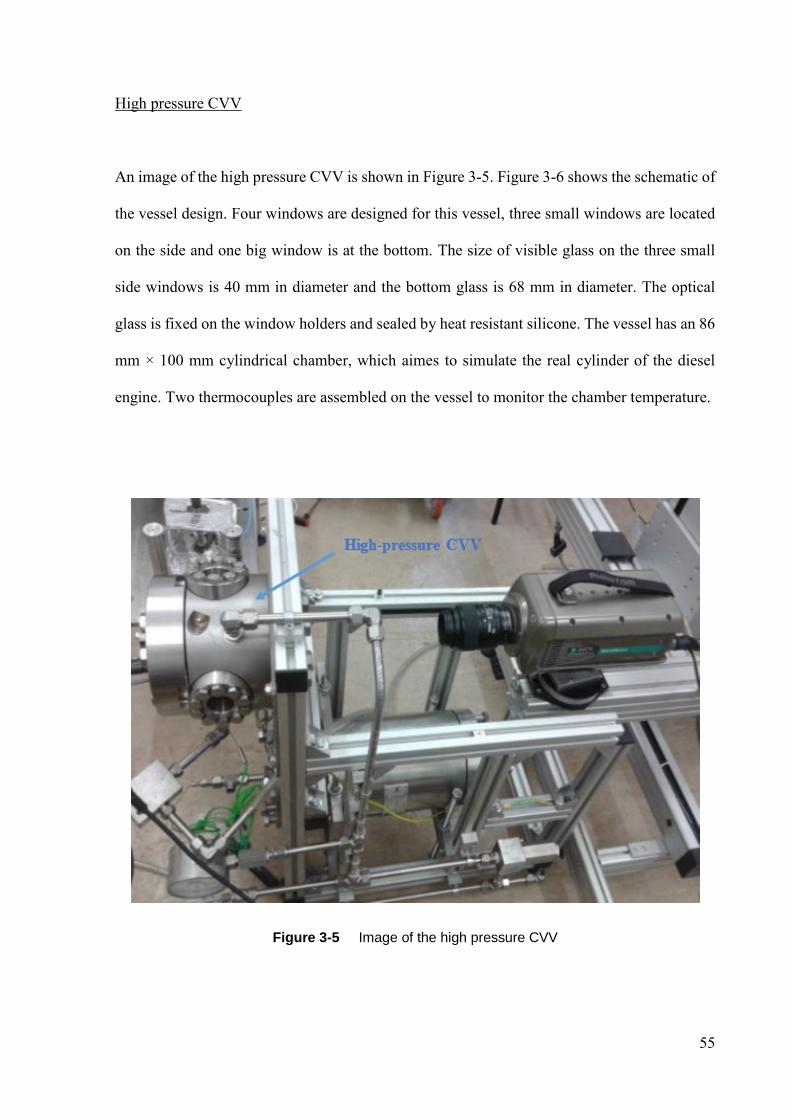
55
High pressure CVV
An image of the high pressure CVV is shown in Figure 3-5. Figure 3-6 shows the schematic of
the vessel design. Four windows are designed for this vessel, three small windows are located
on the side and one big window is at the bottom. The size of visible glass on the three small
side windows is 40 mm in diameter and the bottom glass is 68 mm in diameter. The optical
glass is fixed on the window holders and sealed by heat resistant silicone. The vessel has an 86
mm × 100 mm cylindrical chamber, which aimes to simulate the real cylinder of the diesel
engine. Two thermocouples are assembled on the vessel to monitor the chamber temperature.
Figure 3-5 Image of the high pressure CVV
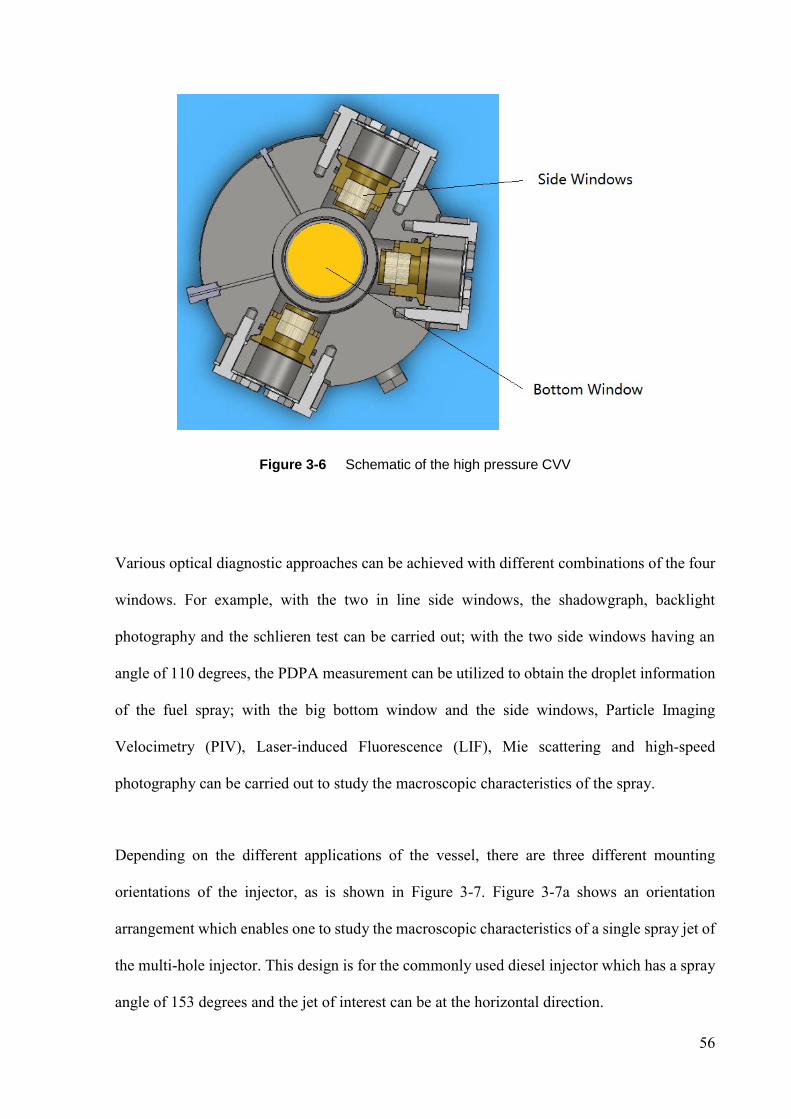
56
Figure 3-6 Schematic of the high pressure CVV
Various optical diagnostic approaches can be achieved with different combinations of the four
windows. For example, with the two in line side windows, the shadowgraph, backlight
photography and the schlieren test can be carried out; with the two side windows having an
angle of 110 degrees, the PDPA measurement can be utilized to obtain the droplet information
of the fuel spray; with the big bottom window and the side windows, Particle Imaging
Velocimetry (PIV), Laser-induced Fluorescence (LIF), Mie scattering and high-speed
photography can be carried out to study the macroscopic characteristics of the spray.
Depending on the different applications of the vessel, there are three different mounting
orientations of the injector, as is shown in Figure 3-7. Figure 3-7a shows an orientation
arrangement which enables one to study the macroscopic characteristics of a single spray jet of
the multi-hole injector. This design is for the commonly used diesel injector which has a spray
angle of 153 degrees and the jet of interest can be at the horizontal direction.

57
Figure 3-7 Three different mounting orientations of the injector
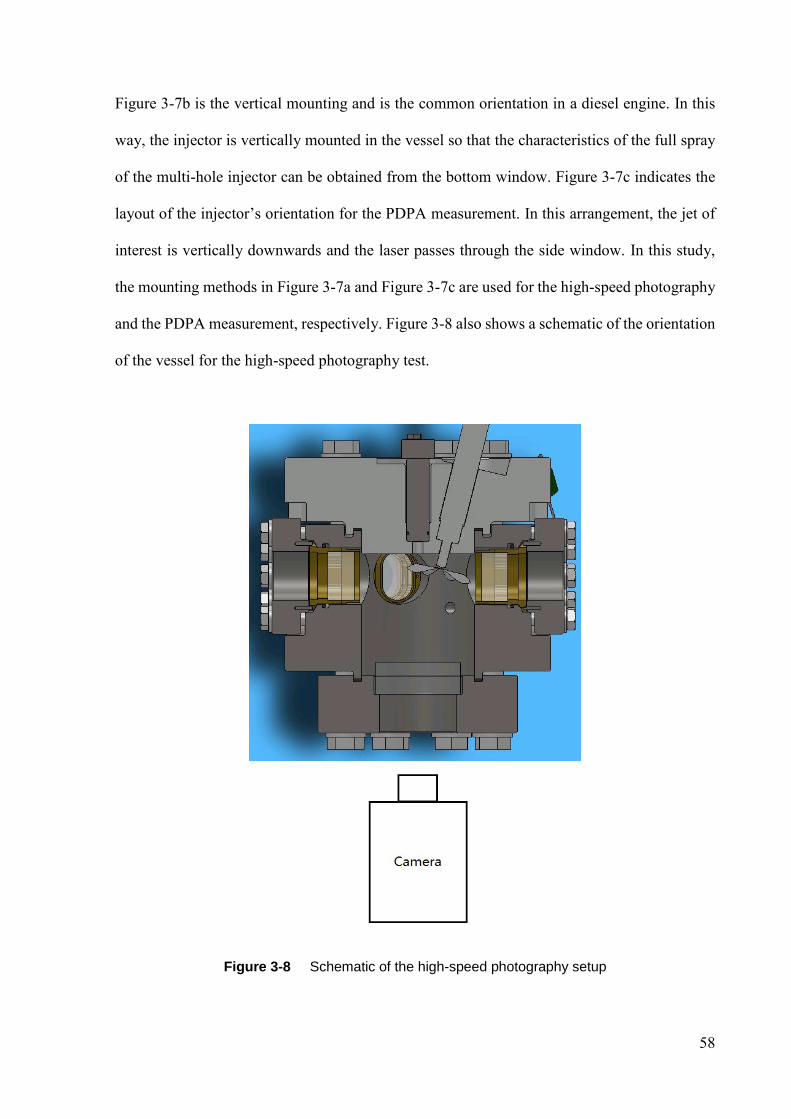
58
Figure 3-7b is the vertical mounting and is the common orientation in a diesel engine. In this
way, the injector is vertically mounted in the vessel so that the characteristics of the full spray
of the multi-hole injector can be obtained from the bottom window. Figure 3-7c indicates the
layout of the injector’s orientation for the PDPA measurement. In this arrangement, the jet of
interest is vertically downwards and the laser passes through the side window. In this study,
the mounting methods in Figure 3-7a and Figure 3-7c are used for the high-speed photography
and the PDPA measurement, respectively. Figure 3-8 also shows a schematic of the orientation
of the vessel for the high-speed photography test.
Figure 3-8 Schematic of the high-speed photography setup
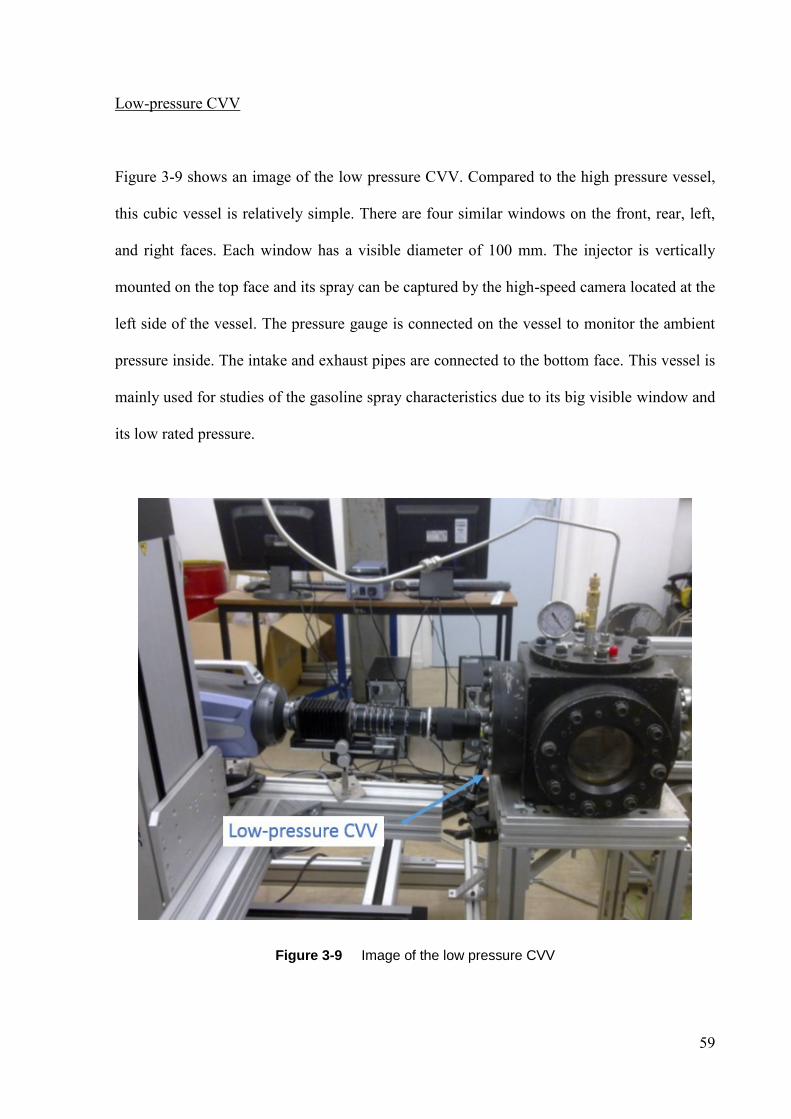
59
Low-pressure CVV
Figure 3-9 shows an image of the low pressure CVV. Compared to the high pressure vessel,
this cubic vessel is relatively simple. There are four similar windows on the front, rear, left,
and right faces. Each window has a visible diameter of 100 mm. The injector is vertically
mounted on the top face and its spray can be captured by the high-speed camera located at the
left side of the vessel. The pressure gauge is connected on the vessel to monitor the ambient
pressure inside. The intake and exhaust pipes are connected to the bottom face. This vessel is
mainly used for studies of the gasoline spray characteristics due to its big visible window and
its low rated pressure.
Figure 3-9 Image of the low pressure CVV
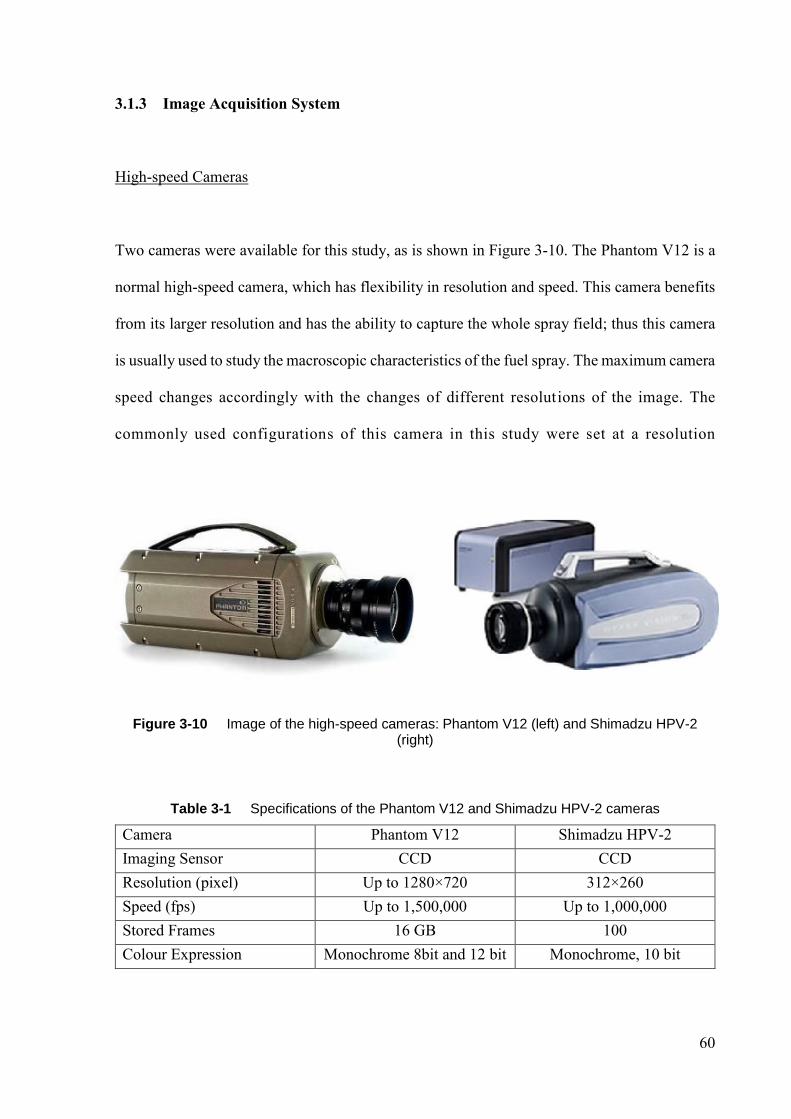
60
3.1.3 Image Acquisition System
High-speed Cameras
Two cameras were available for this study, as is shown in Figure 3-10. The Phantom V12 is a
normal high-speed camera, which has flexibility in resolution and speed. This camera benefits
from its larger resolution and has the ability to capture the whole spray field; thus this camera
is usually used to study the macroscopic characteristics of the fuel spray. The maximum camera
speed changes accordingly with the changes of different resolutions of the image. The
commonly used configurations of this camera in this study were set at a resolution
Figure 3-10 Image of the high-speed cameras: Phantom V12 (left) and Shimadzu HPV-2 (right)
Table 3-1 Specifications of the Phantom V12 and Shimadzu HPV-2 cameras
Camera Phantom V12 Shimadzu HPV-2
Imaging Sensor CCD CCD
Resolution (pixel) Up to 1280×720 312×260
Speed (fps) Up to 1,500,000 Up to 1,000,000
Stored Frames 16 GB 100
Colour Expression Monochrome 8bit and 12 bit Monochrome, 10 bit
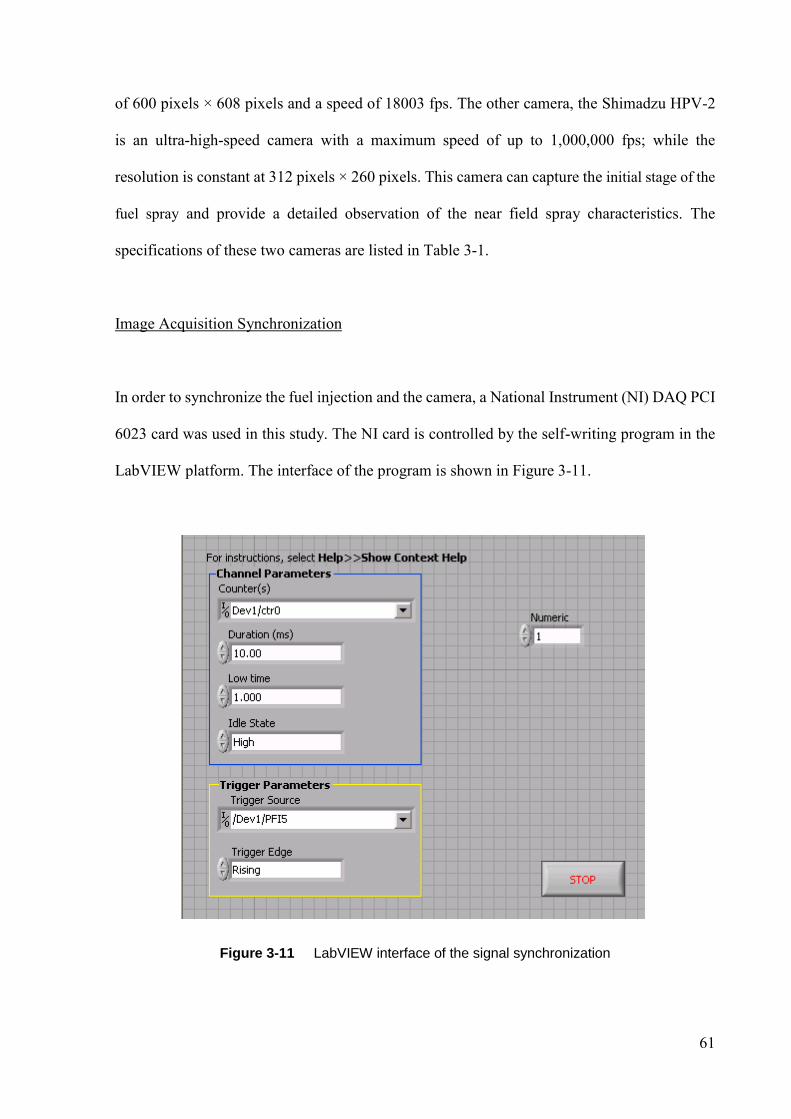
61
of 600 pixels × 608 pixels and a speed of 18003 fps. The other camera, the Shimadzu HPV-2
is an ultra-high-speed camera with a maximum speed of up to 1,000,000 fps; while the
resolution is constant at 312 pixels × 260 pixels. This camera can capture the initial stage of the
fuel spray and provide a detailed observation of the near field spray characteristics. The
specifications of these two cameras are listed in Table 3-1.
Image Acquisition Synchronization
In order to synchronize the fuel injection and the camera, a National Instrument (NI) DAQ PCI
6023 card was used in this study. The NI card is controlled by the self-writing program in the
LabVIEW platform. The interface of the program is shown in Figure 3-11.
Figure 3-11 LabVIEW interface of the signal synchronization
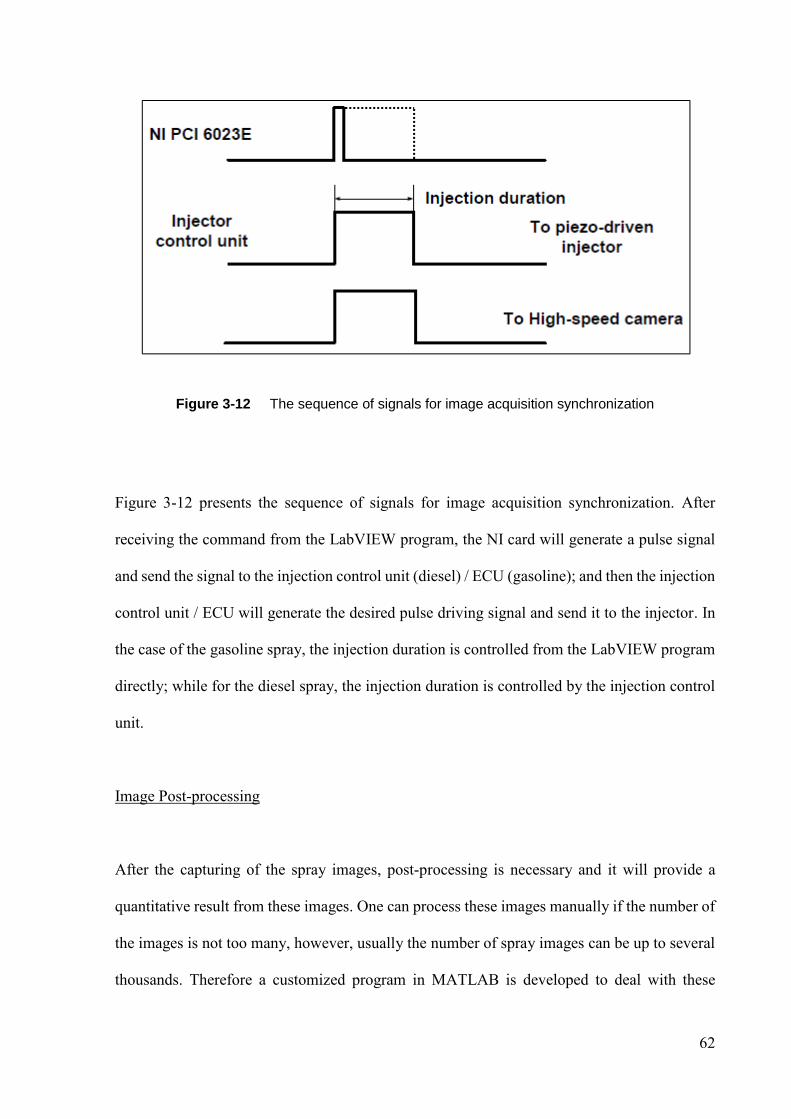
62
Figure 3-12 The sequence of signals for image acquisition synchronization
Figure 3-12 presents the sequence of signals for image acquisition synchronization. After
receiving the command from the LabVIEW program, the NI card will generate a pulse signal
and send the signal to the injection control unit (diesel) / ECU (gasoline); and then the injection
control unit / ECU will generate the desired pulse driving signal and send it to the injector. In
the case of the gasoline spray, the injection duration is controlled from the LabVIEW program
directly; while for the diesel spray, the injection duration is controlled by the injection control
unit.
Image Post-processing
After the capturing of the spray images, post-processing is necessary and it will provide a
quantitative result from these images. One can process these images manually if the number of
the images is not too many, however, usually the number of spray images can be up to several
thousands. Therefore a customized program in MATLAB is developed to deal with these
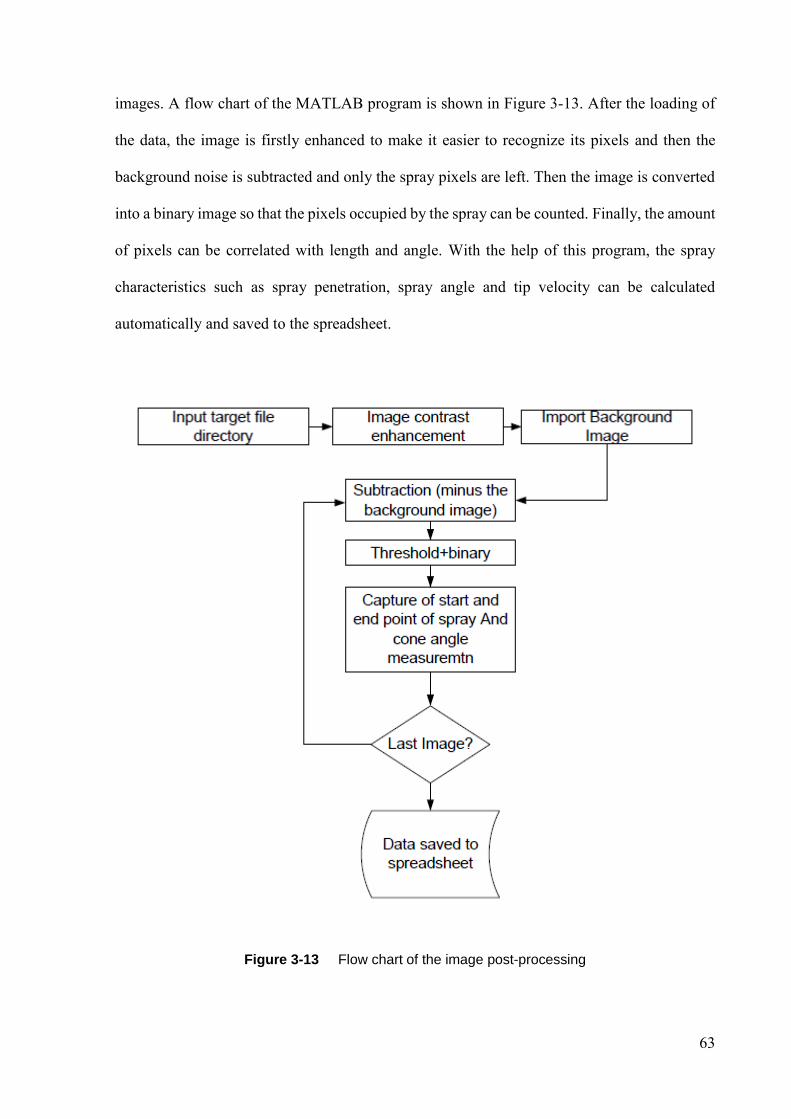
63
images. A flow chart of the MATLAB program is shown in Figure 3-13. After the loading of
the data, the image is firstly enhanced to make it easier to recognize its pixels and then the
background noise is subtracted and only the spray pixels are left. Then the image is converted
into a binary image so that the pixels occupied by the spray can be counted. Finally, the amount
of pixels can be correlated with length and angle. With the help of this program, the spray
characteristics such as spray penetration, spray angle and tip velocity can be calculated
automatically and saved to the spreadsheet.
Figure 3-13 Flow chart of the image post-processing
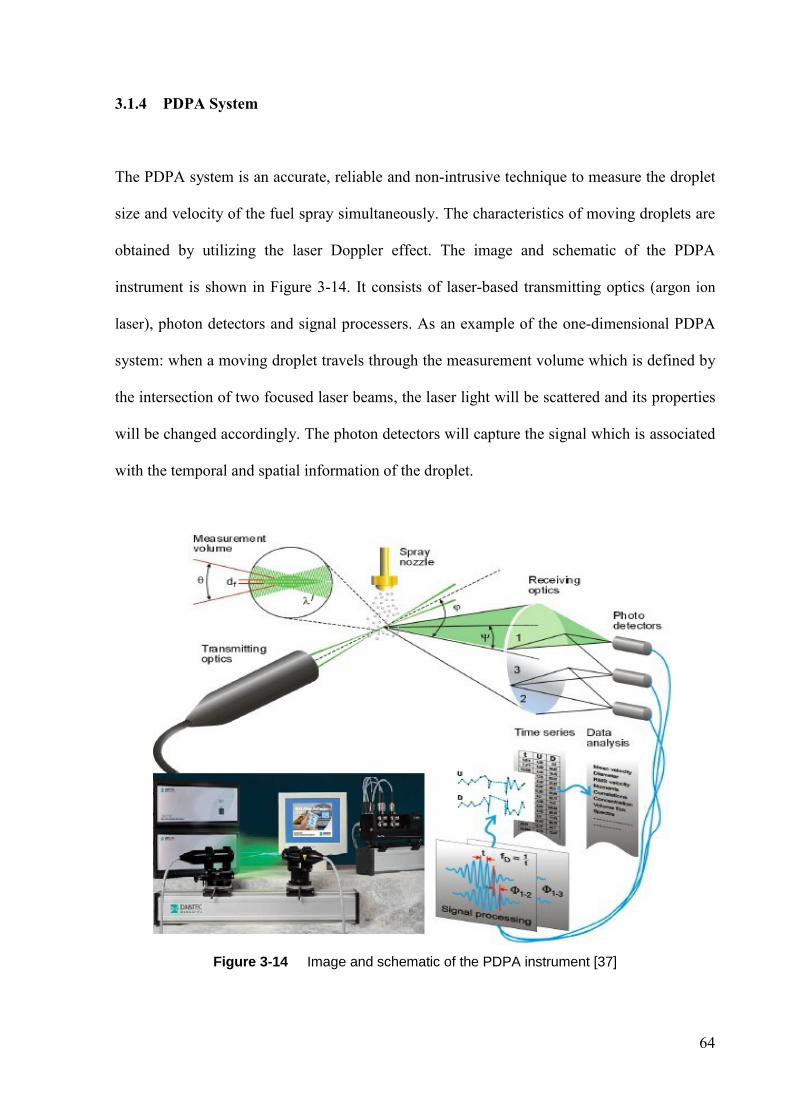
64
3.1.4 PDPA System
The PDPA system is an accurate, reliable and non-intrusive technique to measure the droplet
size and velocity of the fuel spray simultaneously. The characteristics of moving droplets are
obtained by utilizing the laser Doppler effect. The image and schematic of the PDPA
instrument is shown in Figure 3-14. It consists of laser-based transmitting optics (argon ion
laser), photon detectors and signal processers. As an example of the one-dimensional PDPA
system: when a moving droplet travels through the measurement volume which is defined by
the intersection of two focused laser beams, the laser light will be scattered and its properties
will be changed accordingly. The photon detectors will capture the signal which is associated
with the temporal and spatial information of the droplet.
Figure 3-14 Image and schematic of the PDPA instrument [37]
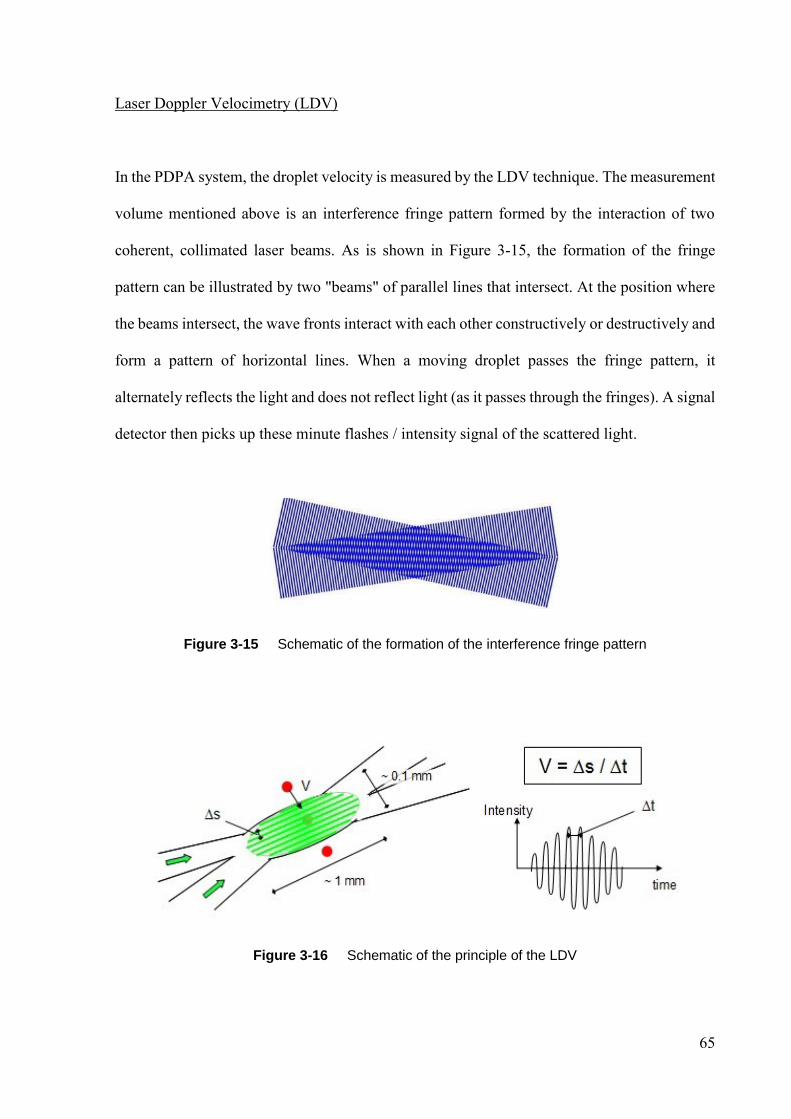
65
Laser Doppler Velocimetry (LDV)
In the PDPA system, the droplet velocity is measured by the LDV technique. The measurement
volume mentioned above is an interference fringe pattern formed by the interaction of two
coherent, collimated laser beams. As is shown in Figure 3-15, the formation of the fringe
pattern can be illustrated by two "beams" of parallel lines that intersect. At the position where
the beams intersect, the wave fronts interact with each other constructively or destructively and
form a pattern of horizontal lines. When a moving droplet passes the fringe pattern, it
alternately reflects the light and does not reflect light (as it passes through the fringes). A signal
detector then picks up these minute flashes / intensity signal of the scattered light.
Figure 3-15 Schematic of the formation of the interference fringe pattern
Figure 3-16 Schematic of the principle of the LDV
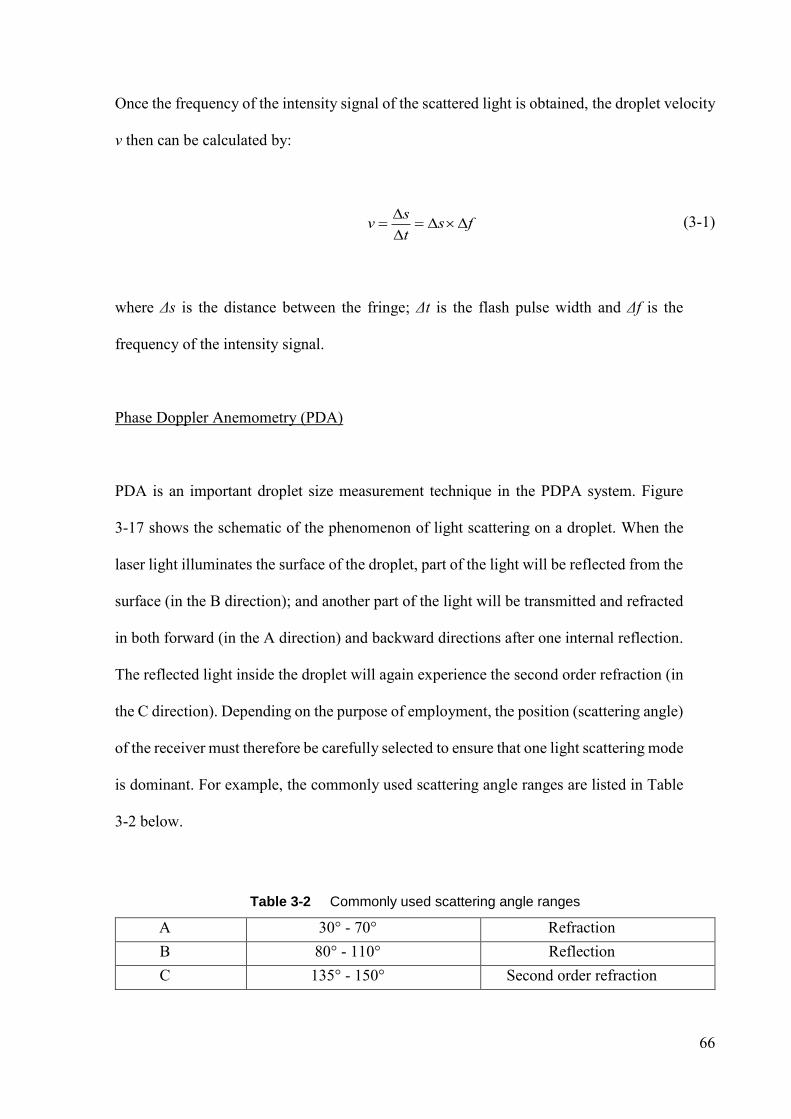
66
Once the frequency of the intensity signal of the scattered light is obtained, the droplet velocity
v then can be calculated by:
sv s f
t
(3-1)
where Δs is the distance between the fringe; Δt is the flash pulse width and Δf is the
frequency of the intensity signal.
Phase Doppler Anemometry (PDA)
PDA is an important droplet size measurement technique in the PDPA system. Figure
3-17 shows the schematic of the phenomenon of light scattering on a droplet. When the
laser light illuminates the surface of the droplet, part of the light will be reflected from the
surface (in the B direction); and another part of the light will be transmitted and refracted
in both forward (in the A direction) and backward directions after one internal reflection.
The reflected light inside the droplet will again experience the second order refraction (in
the C direction). Depending on the purpose of employment, the position (scattering angle)
of the receiver must therefore be carefully selected to ensure that one light scattering mode
is dominant. For example, the commonly used scattering angle ranges are listed in Table
3-2 below.
Table 3-2 Commonly used scattering angle ranges
A 30° - 70° Refraction
B 80° - 110° Reflection
C 135° - 150° Second order refraction
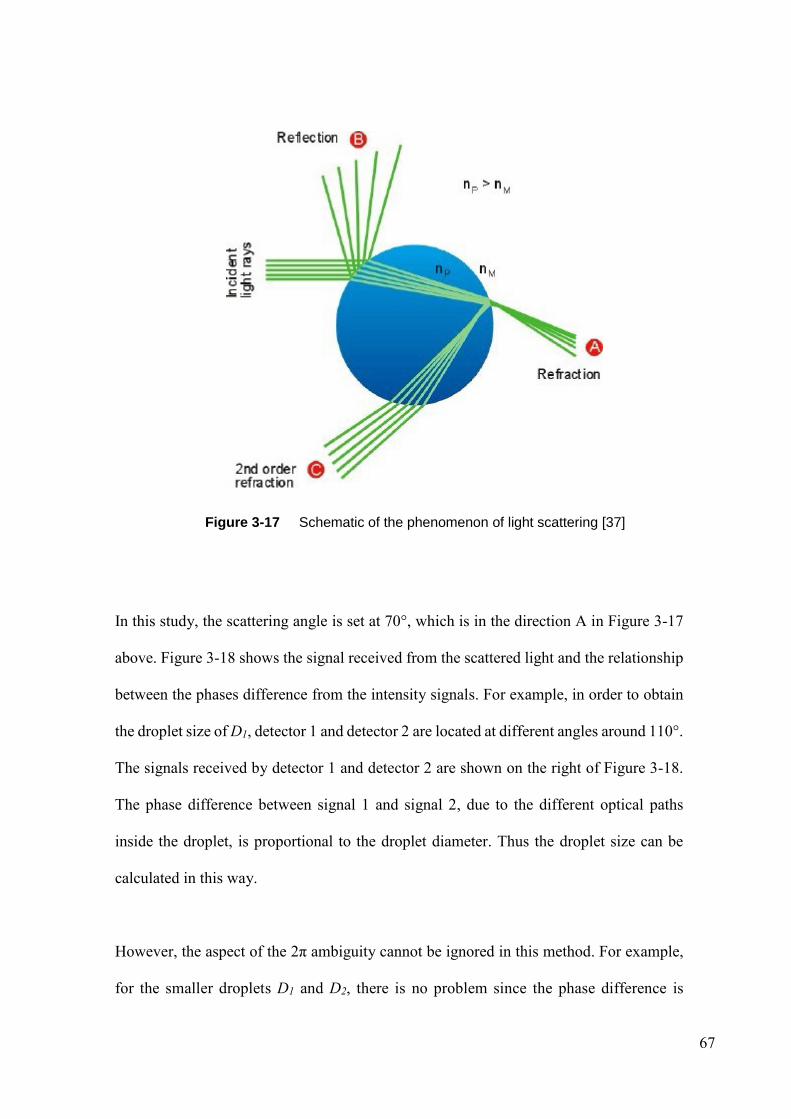
67
Figure 3-17 Schematic of the phenomenon of light scattering [37]
In this study, the scattering angle is set at 70°, which is in the direction A in Figure 3-17
above. Figure 3-18 shows the signal received from the scattered light and the relationship
between the phases difference from the intensity signals. For example, in order to obtain
the droplet size of D1, detector 1 and detector 2 are located at different angles around 110°.
The signals received by detector 1 and detector 2 are shown on the right of Figure 3-18.
The phase difference between signal 1 and signal 2, due to the different optical paths
inside the droplet, is proportional to the droplet diameter. Thus the droplet size can be
calculated in this way.
However, the aspect of the 2π ambiguity cannot be ignored in this method. For example,
for the smaller droplets D1 and D2, there is no problem since the phase difference is
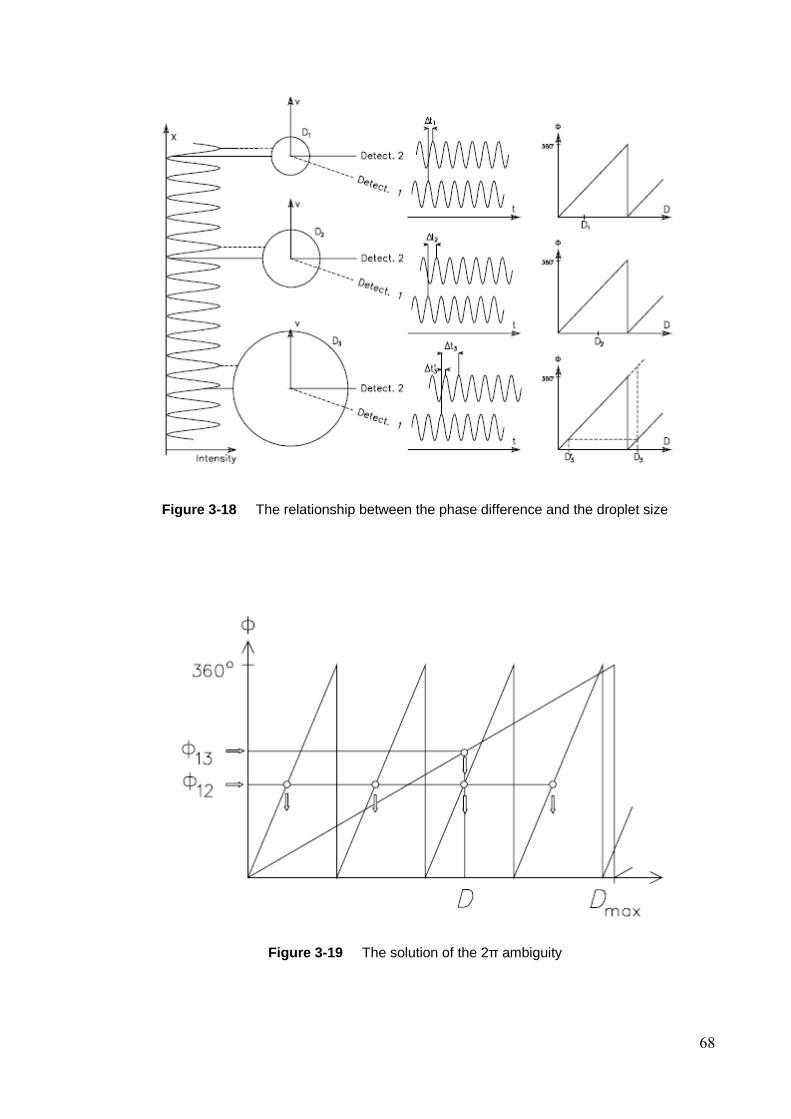
68
Figure 3-18 The relationship between the phase difference and the droplet size
Figure 3-19 The solution of the 2π ambiguity

69
within the range of 2π. However the situation begins to change when the droplet is bigger. For
the droplet D3, as is shown in Figure 3-18, the phase difference is beyond 2π; it is difficult to
tell which one is the true value between D3 and D3’. To solve the problem caused by the 2π
ambiguity, a third detector is added to the system. Figure 3-19 depicts the principle of the
solution. With the help of the third detector, an additional phase difference Ф13 is used to
recognize the true value; Ф13 indicates a larger droplet size range, but with a lower resolution;
and it can be used to determine in which cycle is the signal phase difference. While Ф12 has a
higher resolution, but with a lower size range, it can tell the true value of the droplet size. Thus,
with the help of the third detector, the test range can be extended while the resolution is still at
a higher level.
LDV and PDA work simultaneously in the PDPA system and the simultaneous measurement
of both size and velocity allows correlations to be made between these two quantities.
3.1.5 Ventilation System
The ventilation system, as shown previously in the lower right corner in Figure 3-1, is the last
system of the whole experimental setup. It consists of an anti-fire foam drum, an air filter, a
blower and an exhaust duct which is designed and assembled to absorb the fuel vapour and
droplets. The anti-fire foam is not only used for the precaution of fire, but also used for the
stabilization of the inhaled airflow; thus the influence of the ventilation flow on the spray can
be ignored. The air filter is employed to filter the fuel in the exhaust gas. With the help of the
ventilation system, the spray experiment can be conducted continuously in the lab.
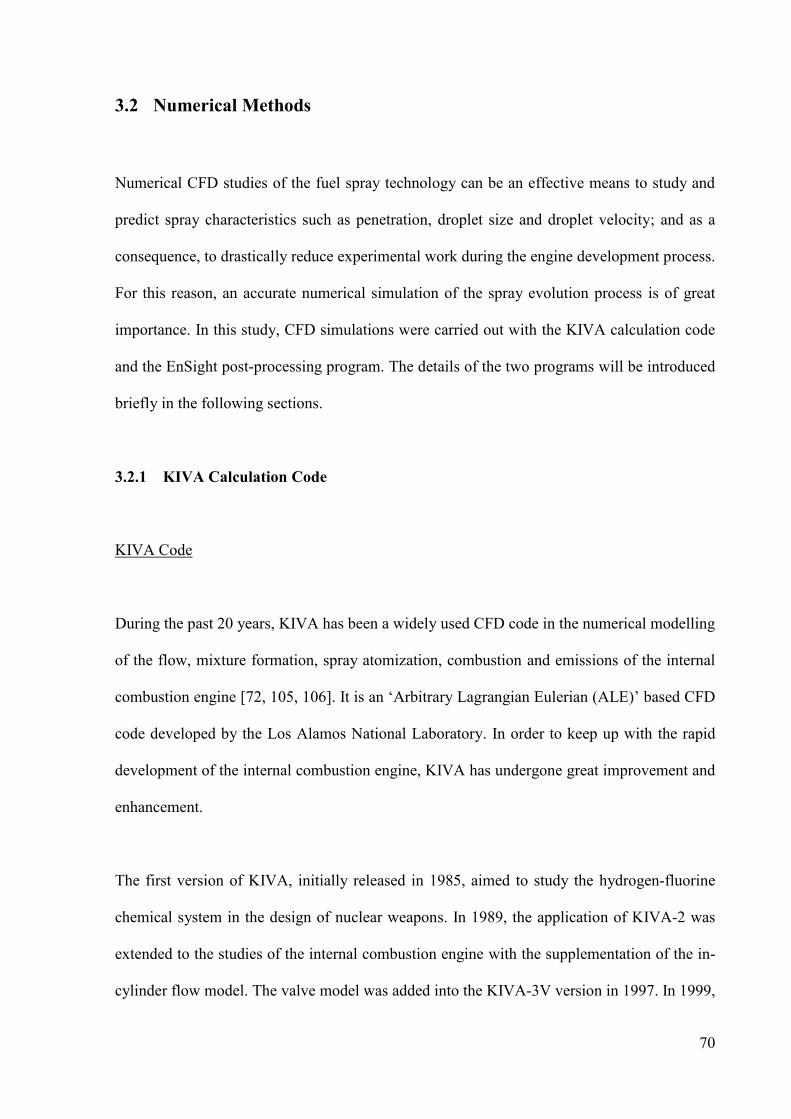
70
3.2 Numerical Methods
Numerical CFD studies of the fuel spray technology can be an effective means to study and
predict spray characteristics such as penetration, droplet size and droplet velocity; and as a
consequence, to drastically reduce experimental work during the engine development process.
For this reason, an accurate numerical simulation of the spray evolution process is of great
importance. In this study, CFD simulations were carried out with the KIVA calculation code
and the EnSight post-processing program. The details of the two programs will be introduced
briefly in the following sections.
3.2.1 KIVA Calculation Code
KIVA Code
During the past 20 years, KIVA has been a widely used CFD code in the numerical modelling
of the flow, mixture formation, spray atomization, combustion and emissions of the internal
combustion engine [72, 105, 106]. It is an ‘Arbitrary Lagrangian Eulerian (ALE)’ based CFD
code developed by the Los Alamos National Laboratory. In order to keep up with the rapid
development of the internal combustion engine, KIVA has undergone great improvement and
enhancement.
The first version of KIVA, initially released in 1985, aimed to study the hydrogen-fluorine
chemical system in the design of nuclear weapons. In 1989, the application of KIVA-2 was
extended to the studies of the internal combustion engine with the supplementation of the in-
cylinder flow model. The valve model was added into the KIVA-3V version in 1997. In 1999,
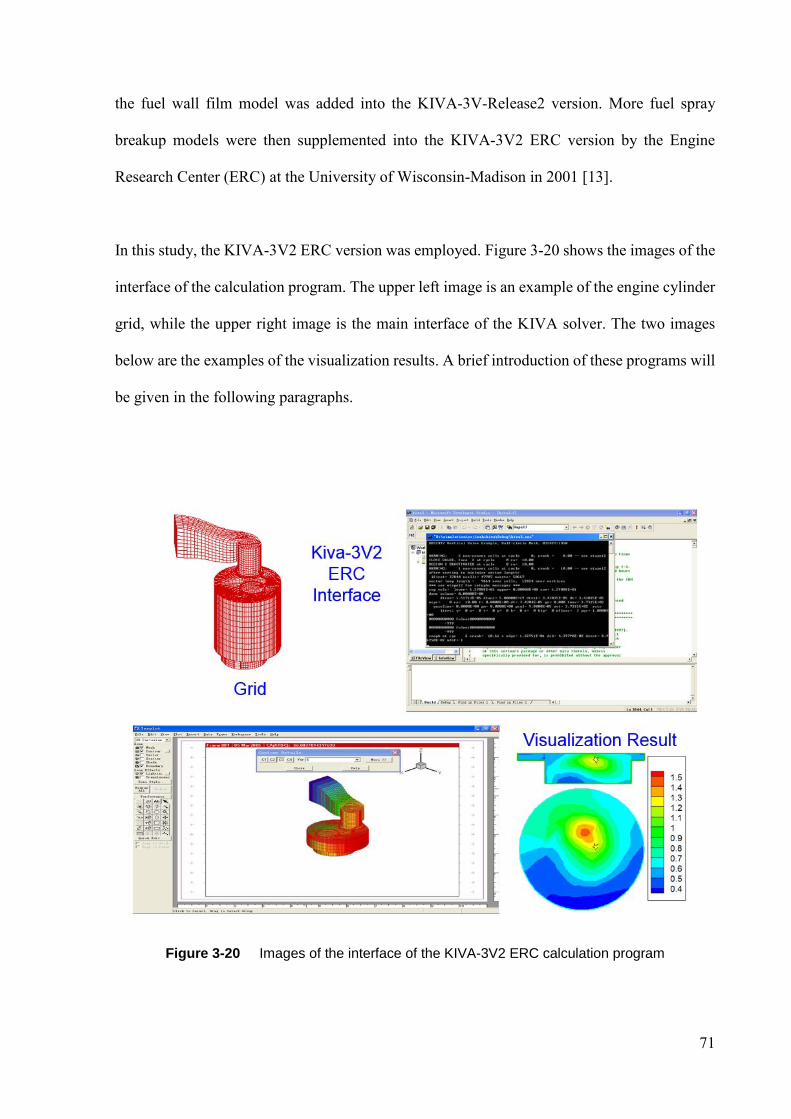
71
the fuel wall film model was added into the KIVA-3V-Release2 version. More fuel spray
breakup models were then supplemented into the KIVA-3V2 ERC version by the Engine
Research Center (ERC) at the University of Wisconsin-Madison in 2001 [13].
In this study, the KIVA-3V2 ERC version was employed. Figure 3-20 shows the images of the
interface of the calculation program. The upper left image is an example of the engine cylinder
grid, while the upper right image is the main interface of the KIVA solver. The two images
below are the examples of the visualization results. A brief introduction of these programs will
be given in the following paragraphs.
Figure 3-20 Images of the interface of the KIVA-3V2 ERC calculation program
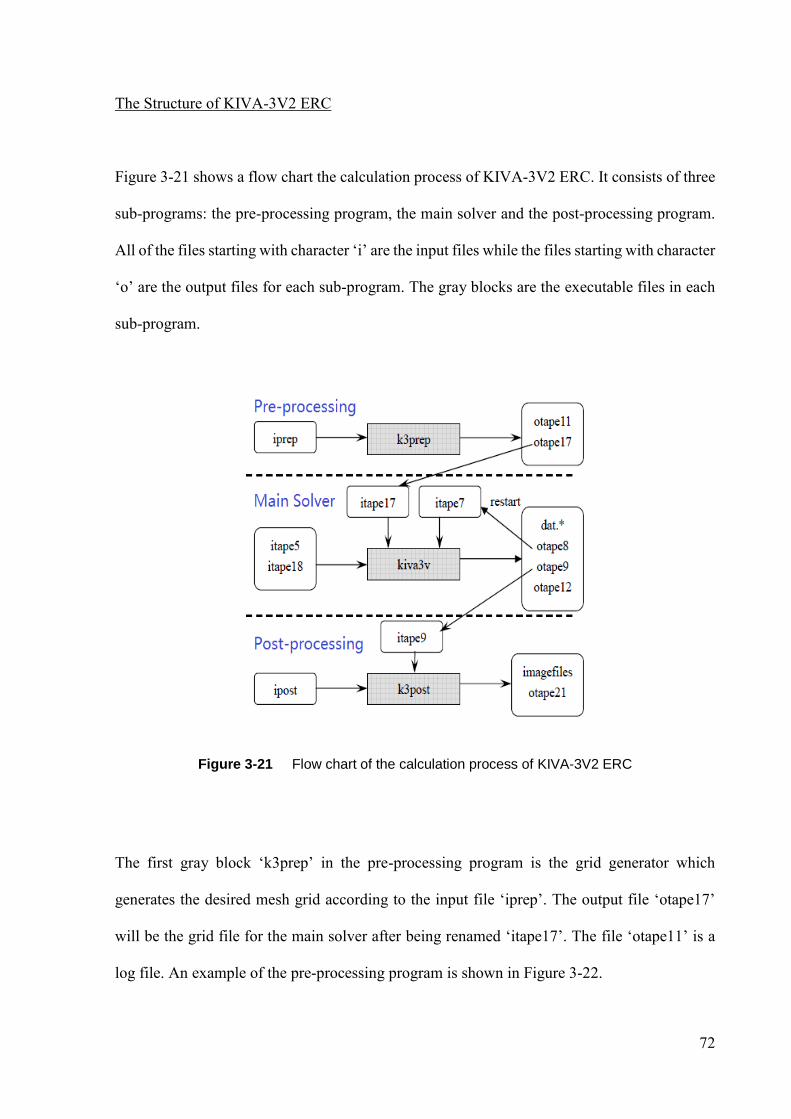
72
The Structure of KIVA-3V2 ERC
Figure 3-21 shows a flow chart the calculation process of KIVA-3V2 ERC. It consists of three
sub-programs: the pre-processing program, the main solver and the post-processing program.
All of the files starting with character ‘i’ are the input files while the files starting with character
‘o’ are the output files for each sub-program. The gray blocks are the executable files in each
sub-program.
Figure 3-21 Flow chart of the calculation process of KIVA-3V2 ERC
The first gray block ‘k3prep’ in the pre-processing program is the grid generator which
generates the desired mesh grid according to the input file ‘iprep’. The output file ‘otape17’
will be the grid file for the main solver after being renamed ‘itape17’. The file ‘otape11’ is a
log file. An example of the pre-processing program is shown in Figure 3-22.
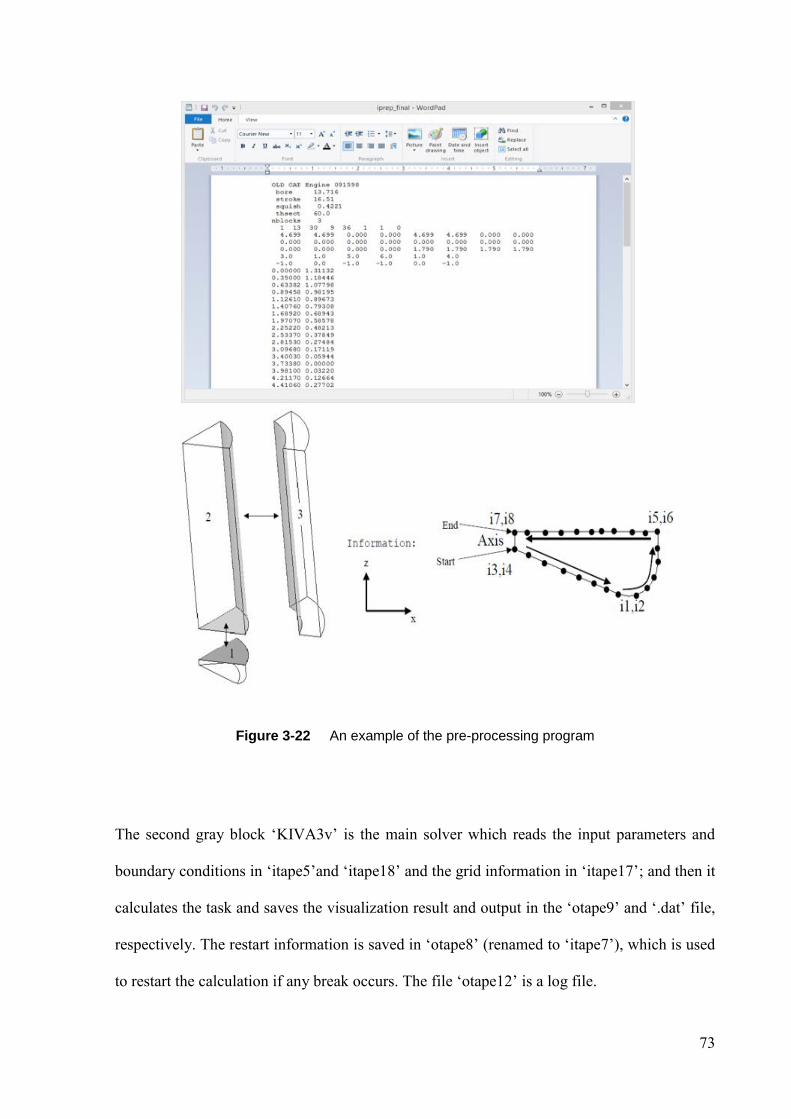
73
Figure 3-22 An example of the pre-processing program
The second gray block ‘KIVA3v’ is the main solver which reads the input parameters and
boundary conditions in ‘itape5’and ‘itape18’ and the grid information in ‘itape17’; and then it
calculates the task and saves the visualization result and output in the ‘otape9’ and ‘.dat’ file,
respectively. The restart information is saved in ‘otape8’ (renamed to ‘itape7’), which is used
to restart the calculation if any break occurs. The file ‘otape12’ is a log file.
74
According to the requests in the ‘ipost’ file, the third gray block ‘k3post’, the post-processing
sub-program, can transfer the visualization result file ‘itape9’ (renamed from ‘otape9’) into
readable documents in a third party post-processing program like EnSight [107] which will be
introduced in section 3.2.2.
Governing Equations of KIVA-3V2 ERC
The simulation of the internal combustion engine is multi-dimensional gas-liquid two-phase
flow modelling; including gas flow, spray liquid flow and chemical reactions. Taking all
physical and chemical effects in internal combustion engines into account, a set of conservation
equations for the gas phase describing spray and combustion processes in KIVA can be
summarized as follows.
For each chemical species m in a multi-component gas mixture fluid, mass conservation can
be expressed by its mass density ρm as:
1ˆ c sm m
m m mu Dt
(3-2)
where ρm is the mass density of species m; ρ is the total mass density; t is the time; û is the fluid
velocity vector; D is the turbulent diffusion coefficient; c
m and 1
s
m are source terms due to
chemical reaction and spray evaporation, respectively; is the vector operator given by:
ˆˆ ˆi j kx y z
(3-3)

75
In Equation 3-2, the first term on the right hand side is due to mass diffusion, the second and
third terms are the source terms due to combustion and spray effects respectively.
In the presence of a liquid spray there can be momentum transfer between the two phases; such
that the three gas phase momentum conservation or Navier-Stokes equations become:
ˆ 2
ˆ ˆ ˆ3
suuu p F g
t
(3-4)
where p is the fluid pressure; is the turbulent kinetic energy; is the (turbulent) viscous
stress tensor in Newtonian form; sF is the rate of momentum gain per unit volume due to the
spray;and g is the specific body force vector.
The energy conservation equation is:
ˆˆ ˆ c sIuI p u J Q Q
t
(3-5)
where I is the specific internal energy (exclusive of chemical energy); Ĵ is the heat flux vector
including turbulent heat conduction and enthalpy diffusion; ɛ is the dissipation rate of turbulent
kinetic energy; cQ and
sQ are the source terms due to chemical heat release and spray
interaction, respectively.
In terms of the liquid phase, KIVA-3V2 ERC employs the Discrete Droplet Model (DDM) to
describe the liquid, which was introduced in Chapter 2. Based on the Monte-Carlo method,
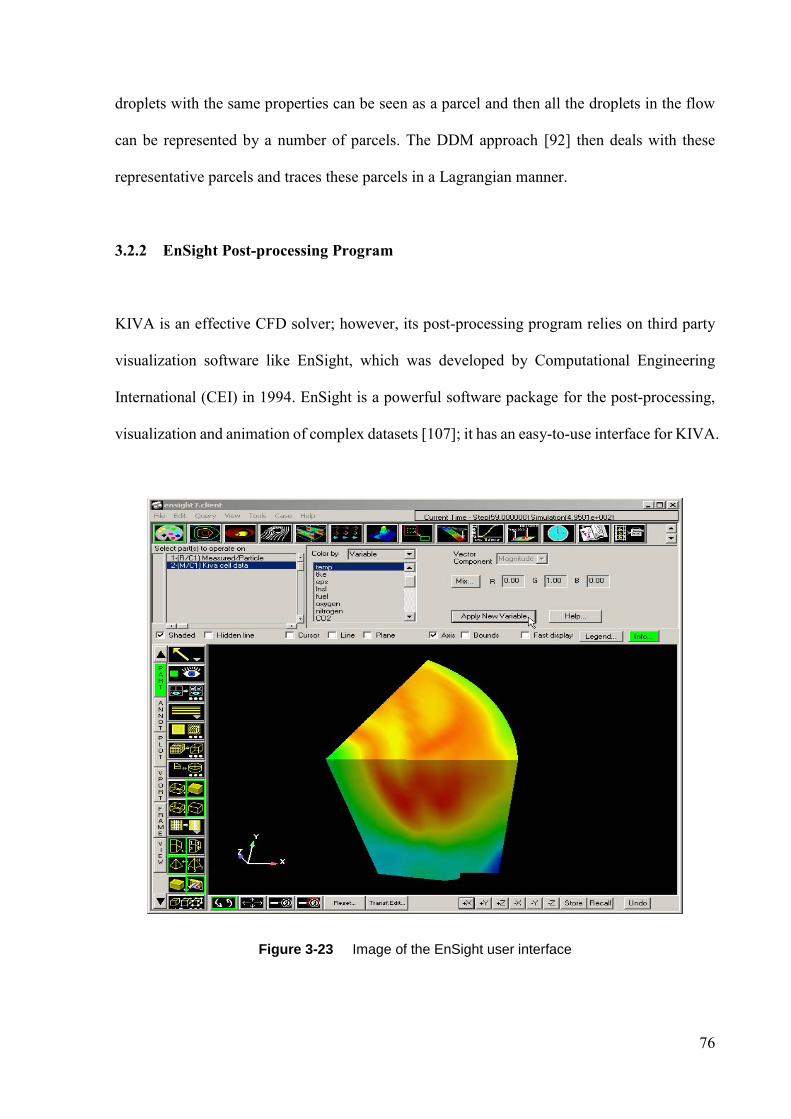
76
droplets with the same properties can be seen as a parcel and then all the droplets in the flow
can be represented by a number of parcels. The DDM approach [92] then deals with these
representative parcels and traces these parcels in a Lagrangian manner.
3.2.2 EnSight Post-processing Program
KIVA is an effective CFD solver; however, its post-processing program relies on third party
visualization software like EnSight, which was developed by Computational Engineering
International (CEI) in 1994. EnSight is a powerful software package for the post-processing,
visualization and animation of complex datasets [107]; it has an easy-to-use interface for KIVA.
Figure 3-23 Image of the EnSight user interface
77
Figure 3-23 shows an example image of the EnSight user interface. It allows one to obtain
detailed observations of the CFD result of the spray. For example, for the liquid phase the fuel
droplet can be zoomed in and out and highlighted and its concentration distribution can be
described by various colours; for the gas phase, depending on its concentration distribution, the
fuel vapour can also be represented by different colours. The details of the functions of this
software can be found in [107]. With the help of the EnSight post-processing program, the
morphography and the macroscopic characteristics of the spray can be studied and validated
with the experiment data.
3.3 Summary
In this chapter, the research methodologies used in the fuel spray study have been introduced
in detail. Two commonly used methodologies which are known as the experimental approach
and the numerical method are employed in this study. Experimental approaches such as the
experimental setup, including the fuel injection system, the constant volume vessel, the image
acquisition system and the Phase Doppler Particle Analyzer (PDPA) system have been
introduced and studied. At the same time, numerical methods including the KIVA calculation
code and the EnSight post-processing program are briefly reviewed. This chapter is of great
importance and provides fundamental knowledge for the following studies.
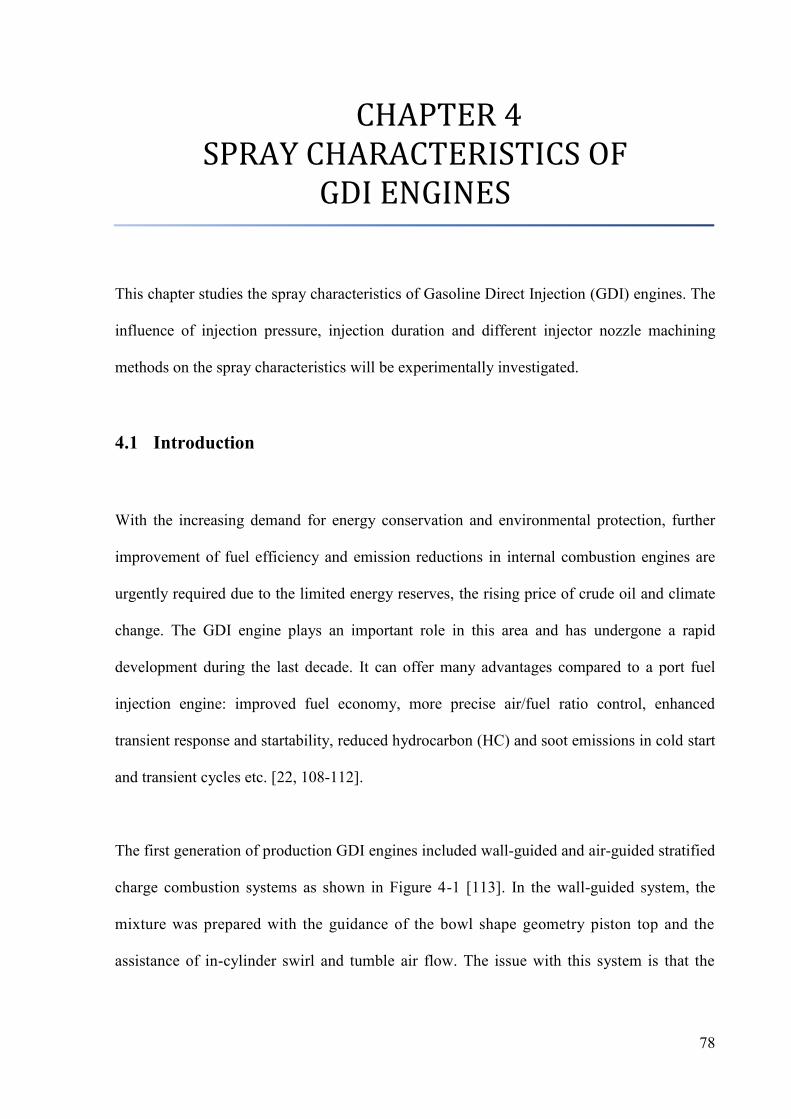
78
4 CHAPTER 4 SPRAY CHARACTERISTICS OF
GDI ENGINES
This chapter studies the spray characteristics of Gasoline Direct Injection (GDI) engines. The
influence of injection pressure, injection duration and different injector nozzle machining
methods on the spray characteristics will be experimentally investigated.
4.1 Introduction
With the increasing demand for energy conservation and environmental protection, further
improvement of fuel efficiency and emission reductions in internal combustion engines are
urgently required due to the limited energy reserves, the rising price of crude oil and climate
change. The GDI engine plays an important role in this area and has undergone a rapid
development during the last decade. It can offer many advantages compared to a port fuel
injection engine: improved fuel economy, more precise air/fuel ratio control, enhanced
transient response and startability, reduced hydrocarbon (HC) and soot emissions in cold start
and transient cycles etc. [22, 108-112].
The first generation of production GDI engines included wall-guided and air-guided stratified
charge combustion systems as shown in Figure 4-1 [113]. In the wall-guided system, the
mixture was prepared with the guidance of the bowl shape geometry piston top and the
assistance of in-cylinder swirl and tumble air flow. The issue with this system is that the
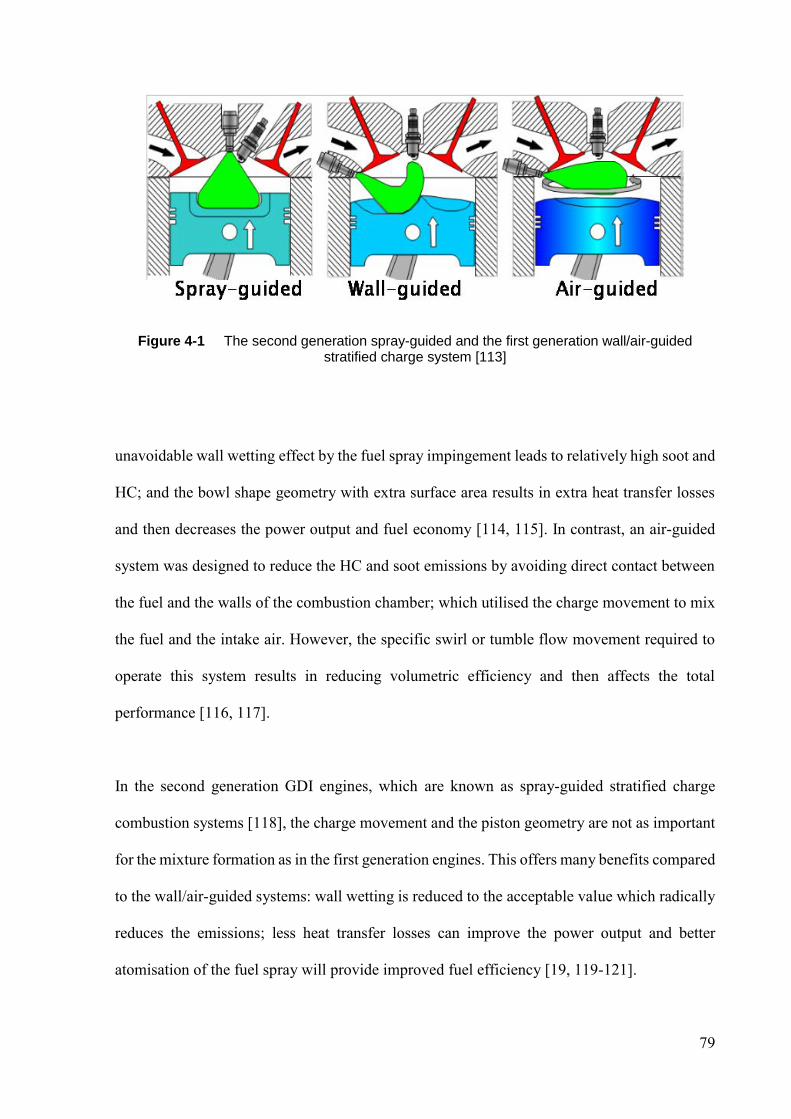
79
Figure 4-1 The second generation spray-guided and the first generation wall/air-guided stratified charge system [113]
unavoidable wall wetting effect by the fuel spray impingement leads to relatively high soot and
HC; and the bowl shape geometry with extra surface area results in extra heat transfer losses
and then decreases the power output and fuel economy [114, 115]. In contrast, an air-guided
system was designed to reduce the HC and soot emissions by avoiding direct contact between
the fuel and the walls of the combustion chamber; which utilised the charge movement to mix
the fuel and the intake air. However, the specific swirl or tumble flow movement required to
operate this system results in reducing volumetric efficiency and then affects the total
performance [116, 117].
In the second generation GDI engines, which are known as spray-guided stratified charge
combustion systems [118], the charge movement and the piston geometry are not as important
for the mixture formation as in the first generation engines. This offers many benefits compared
to the wall/air-guided systems: wall wetting is reduced to the acceptable value which radically
reduces the emissions; less heat transfer losses can improve the power output and better
atomisation of the fuel spray will provide improved fuel efficiency [19, 119-121].

80
The design and optimisation of a modern spray-guided GDI engine requires a thorough
understanding of the fuel spray characteristics and atomisation process. Spray penetration,
spray angle, droplet size and velocity become more crucial since they play extremely important
roles in the mixture formation and combustion processes of GDI engines [115]. In this study,
the effects of injection pressure, injection duration and different injector nozzle machining
methods on the spray characteristics will be investigated. Two types of injectors with the same
geometrics but a different manufacturing process will be tested. Both of the two 6-hole injectors
are in AJ126 model. The one called LD injector has laser drilled nozzles, while the other titled
EDM injector has electric discharge machining holes.
4.2 Experimental Conditions
The experiment was carried out with the experimental system presented in Chapter 3. The low
pressure constant volume vessel was used in this study. The specifications of the LD injector
and the EDM injector studied are listed in Table 4-1. The injection pressure was controlled by
the regulator of the gas bottle and the injection duration was controlled by the LabVIEW
program, which sends the injection signal to the ECU. Both of the backlit and PDPA tests were
conducted under atmospheric conditions with various injection pressures and durations. The
spray image was captured by an ultra high-speed camera with the speed of 18003 frames per
second and pixels of 608*600. The main technique specification of the PDPA system is listed
in Table 4-2. The test matrix and the schematic test positions for this study are shown in Table
4-3 and Figure 4-2.
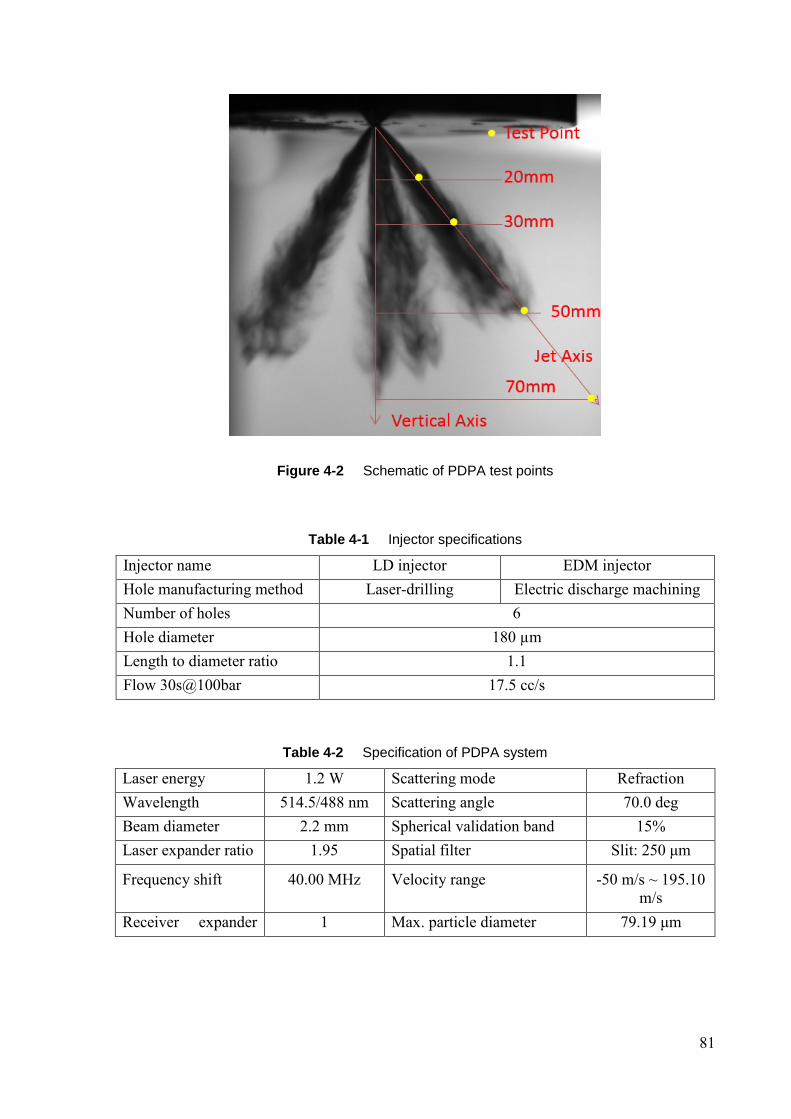
81
Figure 4-2 Schematic of PDPA test points
Table 4-1 Injector specifications
Injector name LD injector EDM injector
Hole manufacturing method Laser-drilling Electric discharge machining
Number of holes 6
Hole diameter 180 µm
Length to diameter ratio 1.1
Flow 30s@100bar 17.5 cc/s
Table 4-2 Specification of PDPA system
Laser energy 1.2 W Scattering mode Refraction
Wavelength 514.5/488 nm Scattering angle 70.0 deg
Beam diameter 2.2 mm Spherical validation band 15%
Laser expander ratio 1.95 Spatial filter Slit: 250 μm
Frequency shift 40.00 MHz Velocity range -50 m/s ~ 195.10
m/s
Receiver expander
ratio
1 Max. particle diameter 79.19 μm
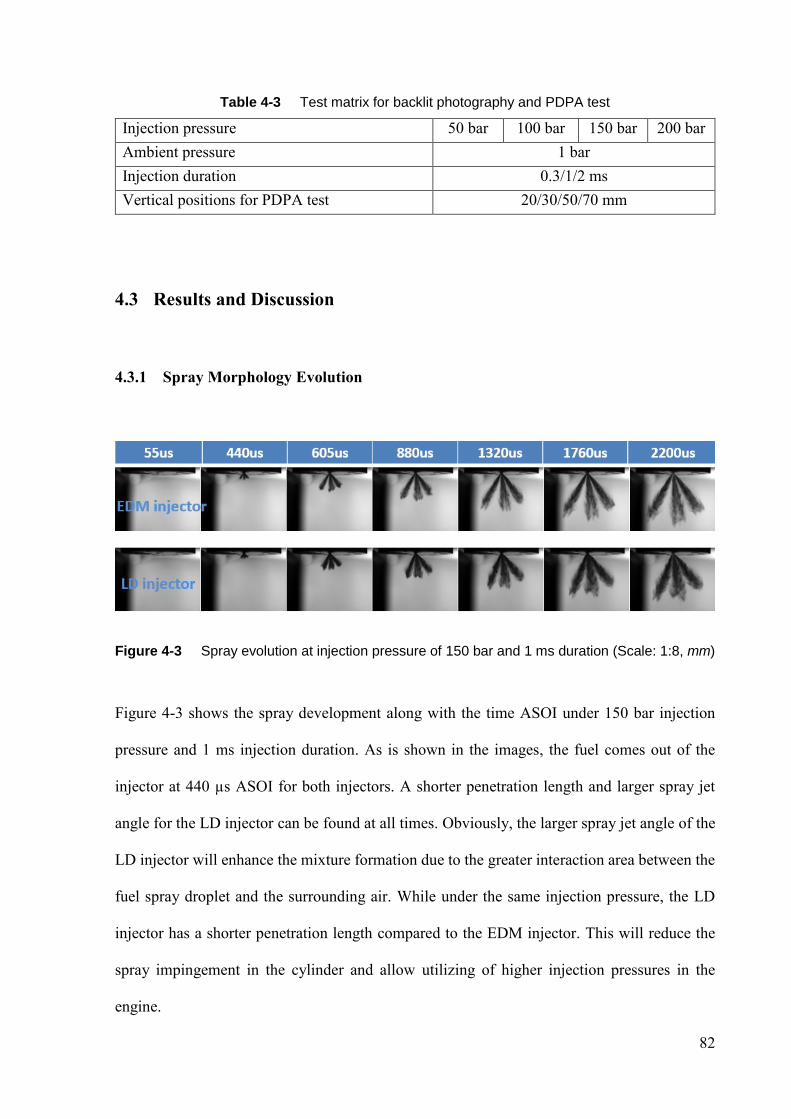
82
Table 4-3 Test matrix for backlit photography and PDPA test
Injection pressure 50 bar 100 bar 150 bar 200 bar
Ambient pressure 1 bar
Injection duration 0.3/1/2 ms
Vertical positions for PDPA test 20/30/50/70 mm
4.3 Results and Discussion
4.3.1 Spray Morphology Evolution
Figure 4-3 Spray evolution at injection pressure of 150 bar and 1 ms duration (Scale: 1:8, mm)
Figure 4-3 shows the spray development along with the time ASOI under 150 bar injection
pressure and 1 ms injection duration. As is shown in the images, the fuel comes out of the
injector at 440 µs ASOI for both injectors. A shorter penetration length and larger spray jet
angle for the LD injector can be found at all times. Obviously, the larger spray jet angle of the
LD injector will enhance the mixture formation due to the greater interaction area between the
fuel spray droplet and the surrounding air. While under the same injection pressure, the LD
injector has a shorter penetration length compared to the EDM injector. This will reduce the
spray impingement in the cylinder and allow utilizing of higher injection pressures in the
engine.

83
Figure 4-4 Schematic of the sharp inlet edge and sprays of the LD injector
Figure 4-4 shows a schematic of the sharp inlet edge and sprays of the LD injector. Similar
findings were also stated in Whitaker’s study: the latest laser drilled injector nozzle holes could
provide a spray with reduced penetration and improved atomization at the same fuel pressure
[122]. These differences may be due to the enhanced turbulence and better spray breakup
induced by the sharp inlet edge [123] of the LD injector nozzle. Further analysis will be
discussed in detail in the following sections.
4.3.2 Effect of Injection Pressure on Spray Penetration and Spray Angle
Figure 4-5 shows the spray penetration development under injection pressure of 50 bar, 100
bar, 150 bar and 200 bar along with the time ASOI; which are typical injection pressures in
homogeneous charge spark ignition engines. In order to study the effect of the injection
pressure, the injection durations were fixed at 1 ms for all the injectors and injection pressures.
All the other parameters were kept the same so that the only variations were the injection
pressure and the different injectors.

84
300 600 900 1200 1500 1800 2100 2400 2700 3000
0
20
40
60
80
100
Sp
ray
tip
pe
ne
tra
tio
n (
mm
)
Time ASOI (s)
50 bar EDM
100 bar EDM
150 bar EDM
200 bar EDM
50 bar LD
100 bar LD
150 bar LD
200 bar LD
Figure 4-5 Effect of injection pressure on spray penetration (atmospheric back pressure, 1 ms injection duration)
From Figure 4-5, it can be seen that for both of the LD and EDM injectors, the spray penetration
length increased gradually with the raising of the injection pressure from 50 bar to 200 bar.
This was to be expected since higher injection pressure will result in greater outlet velocity and
higher momentum of the spray jet at the nozzle exit. Under the same injection pressure, longer
penetration length indicates that the fuel can reach a far distance and have more contact
opportunities with fresh air; however, an unavoidable problem along with the longer
penetration is the wall impingement, which will significantly increase the soot emissions in the
GDI engine. Therefore this is of great importance and should be considered when determining
the injection pressure during the engine development [108].
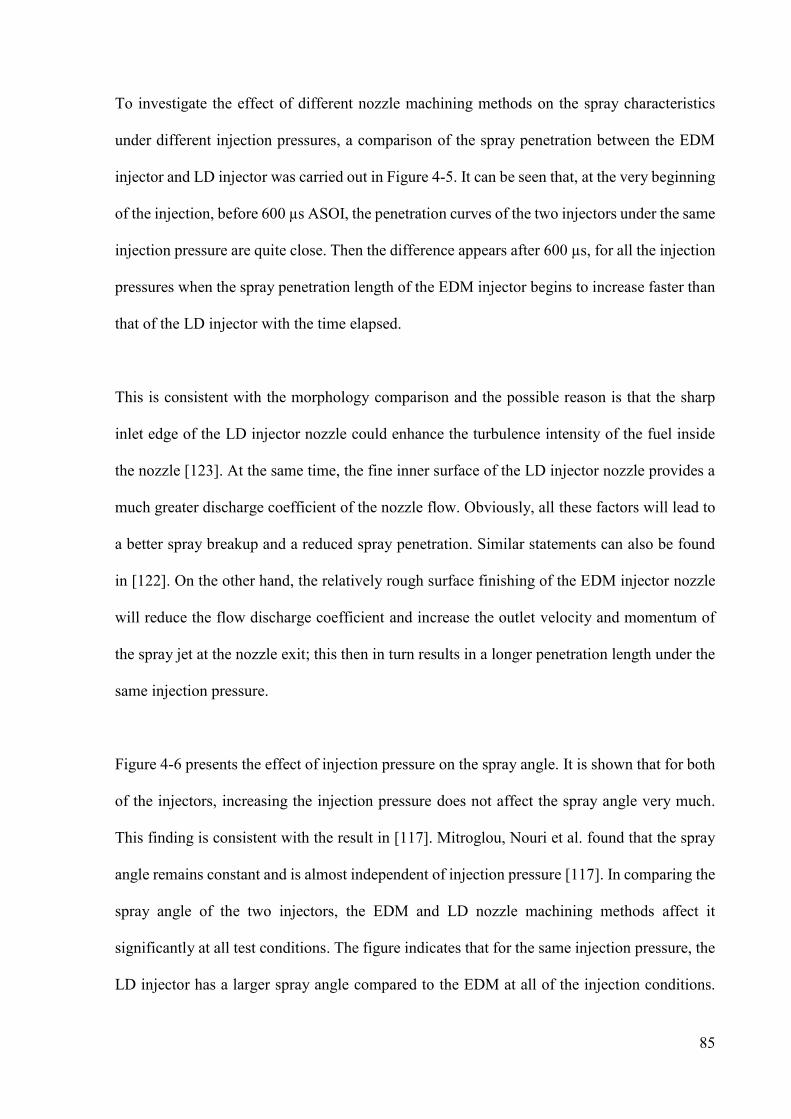
85
To investigate the effect of different nozzle machining methods on the spray characteristics
under different injection pressures, a comparison of the spray penetration between the EDM
injector and LD injector was carried out in Figure 4-5. It can be seen that, at the very beginning
of the injection, before 600 µs ASOI, the penetration curves of the two injectors under the same
injection pressure are quite close. Then the difference appears after 600 µs, for all the injection
pressures when the spray penetration length of the EDM injector begins to increase faster than
that of the LD injector with the time elapsed.
This is consistent with the morphology comparison and the possible reason is that the sharp
inlet edge of the LD injector nozzle could enhance the turbulence intensity of the fuel inside
the nozzle [123]. At the same time, the fine inner surface of the LD injector nozzle provides a
much greater discharge coefficient of the nozzle flow. Obviously, all these factors will lead to
a better spray breakup and a reduced spray penetration. Similar statements can also be found
in [122]. On the other hand, the relatively rough surface finishing of the EDM injector nozzle
will reduce the flow discharge coefficient and increase the outlet velocity and momentum of
the spray jet at the nozzle exit; this then in turn results in a longer penetration length under the
same injection pressure.
Figure 4-6 presents the effect of injection pressure on the spray angle. It is shown that for both
of the injectors, increasing the injection pressure does not affect the spray angle very much.
This finding is consistent with the result in [117]. Mitroglou, Nouri et al. found that the spray
angle remains constant and is almost independent of injection pressure [117]. In comparing the
spray angle of the two injectors, the EDM and LD nozzle machining methods affect it
significantly at all test conditions. The figure indicates that for the same injection pressure, the
LD injector has a larger spray angle compared to the EDM at all of the injection conditions.
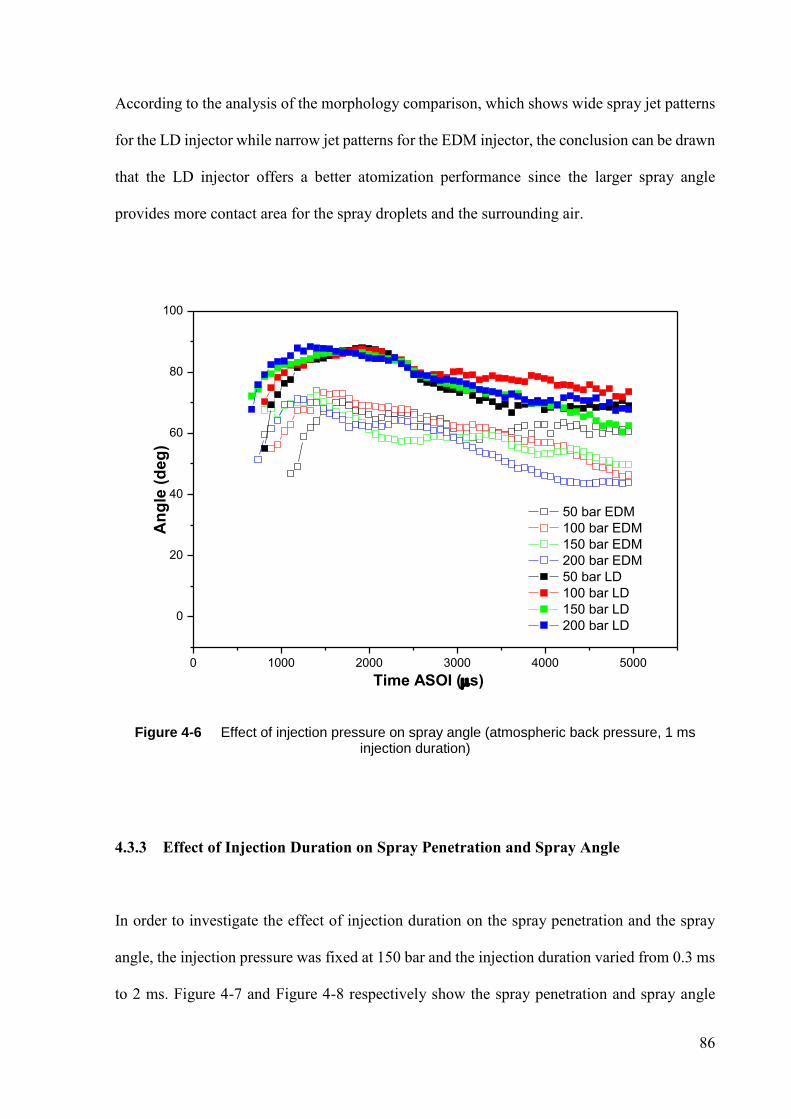
86
According to the analysis of the morphology comparison, which shows wide spray jet patterns
for the LD injector while narrow jet patterns for the EDM injector, the conclusion can be drawn
that the LD injector offers a better atomization performance since the larger spray angle
provides more contact area for the spray droplets and the surrounding air.
0 1000 2000 3000 4000 5000
0
20
40
60
80
100
50 bar EDM
100 bar EDM
150 bar EDM
200 bar EDM
50 bar LD
100 bar LD
150 bar LD
200 bar LD
An
gle
(d
eg
)
Time ASOI (s)
Figure 4-6 Effect of injection pressure on spray angle (atmospheric back pressure, 1 ms injection duration)
4.3.3 Effect of Injection Duration on Spray Penetration and Spray Angle
In order to investigate the effect of injection duration on the spray penetration and the spray
angle, the injection pressure was fixed at 150 bar and the injection duration varied from 0.3 ms
to 2 ms. Figure 4-7 and Figure 4-8 respectively show the spray penetration and spray angle
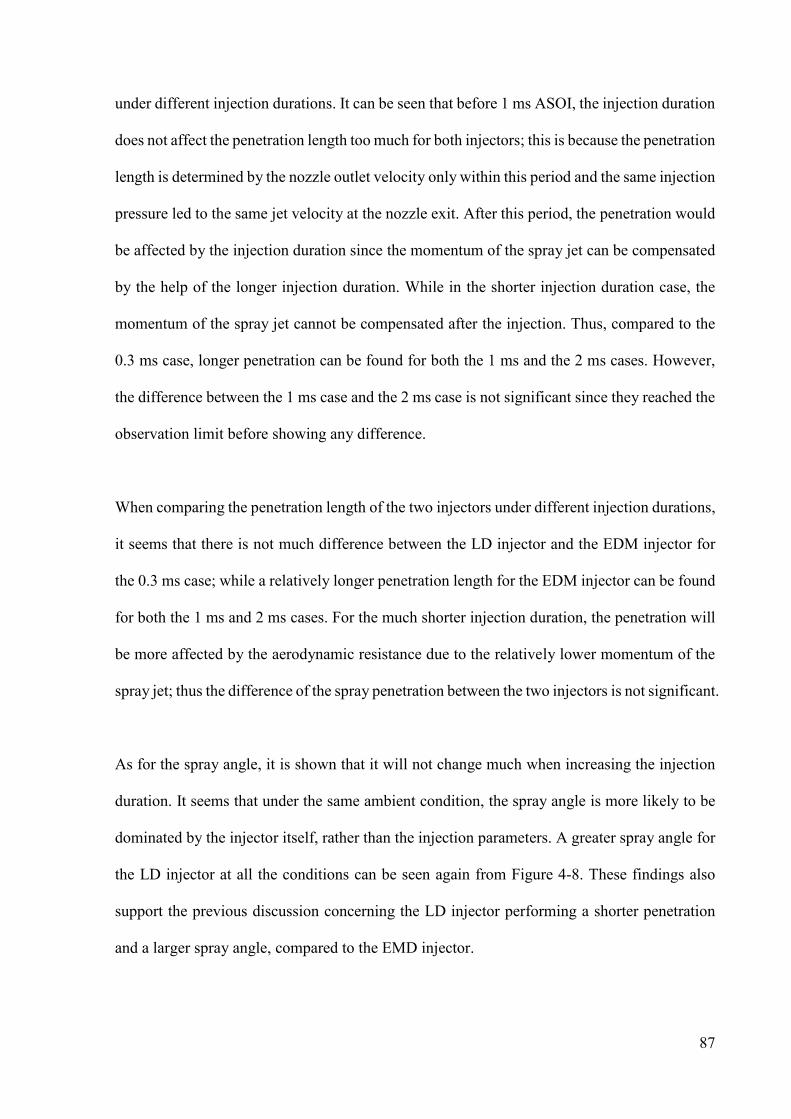
87
under different injection durations. It can be seen that before 1 ms ASOI, the injection duration
does not affect the penetration length too much for both injectors; this is because the penetration
length is determined by the nozzle outlet velocity only within this period and the same injection
pressure led to the same jet velocity at the nozzle exit. After this period, the penetration would
be affected by the injection duration since the momentum of the spray jet can be compensated
by the help of the longer injection duration. While in the shorter injection duration case, the
momentum of the spray jet cannot be compensated after the injection. Thus, compared to the
0.3 ms case, longer penetration can be found for both the 1 ms and the 2 ms cases. However,
the difference between the 1 ms case and the 2 ms case is not significant since they reached the
observation limit before showing any difference.
When comparing the penetration length of the two injectors under different injection durations,
it seems that there is not much difference between the LD injector and the EDM injector for
the 0.3 ms case; while a relatively longer penetration length for the EDM injector can be found
for both the 1 ms and 2 ms cases. For the much shorter injection duration, the penetration will
be more affected by the aerodynamic resistance due to the relatively lower momentum of the
spray jet; thus the difference of the spray penetration between the two injectors is not significant.
As for the spray angle, it is shown that it will not change much when increasing the injection
duration. It seems that under the same ambient condition, the spray angle is more likely to be
dominated by the injector itself, rather than the injection parameters. A greater spray angle for
the LD injector at all the conditions can be seen again from Figure 4-8. These findings also
support the previous discussion concerning the LD injector performing a shorter penetration
and a larger spray angle, compared to the EMD injector.
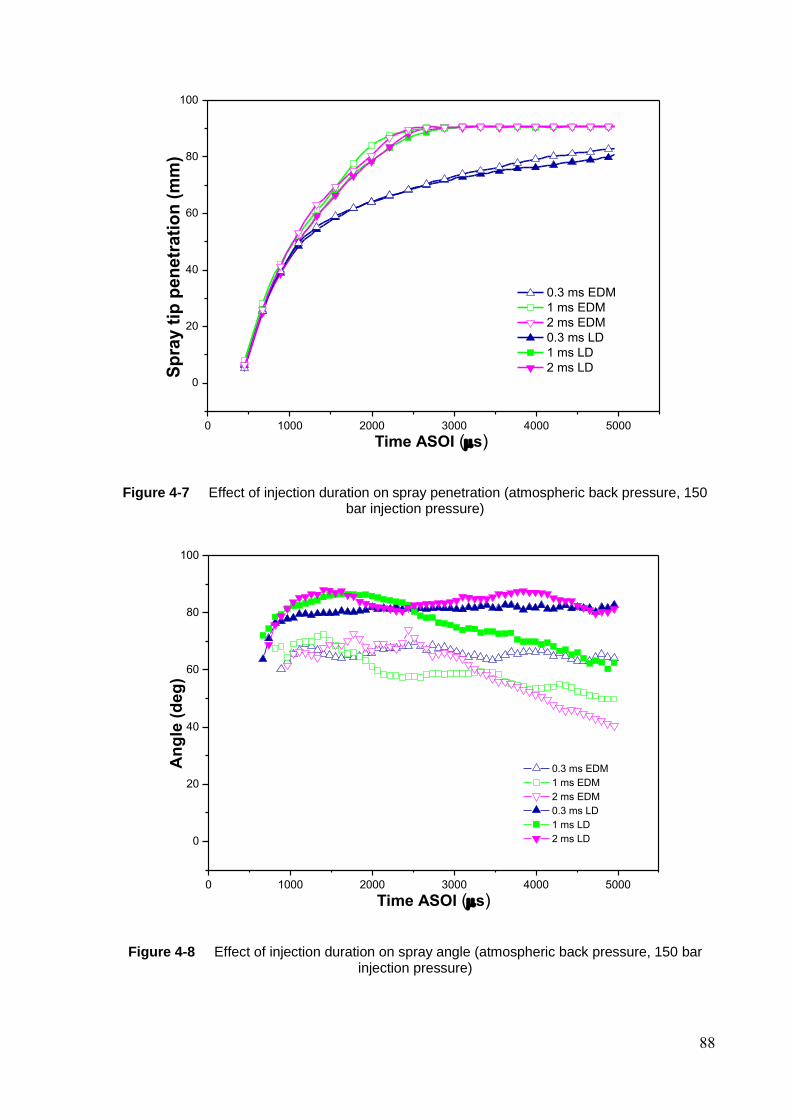
88
0 1000 2000 3000 4000 5000
0
20
40
60
80
100
Sp
ray t
ip p
en
etr
ati
on
(m
m)
Time ASOI (s)
0.3 ms EDM
1 ms EDM
2 ms EDM
0.3 ms LD
1 ms LD
2 ms LD
Figure 4-7 Effect of injection duration on spray penetration (atmospheric back pressure, 150 bar injection pressure)
0 1000 2000 3000 4000 5000
0
20
40
60
80
100
An
gle
(d
eg
)
Time ASOI (s)
0.3 ms EDM
1 ms EDM
2 ms EDM
0.3 ms LD
1 ms LD
2 ms LD
Figure 4-8 Effect of injection duration on spray angle (atmospheric back pressure, 150 bar injection pressure)
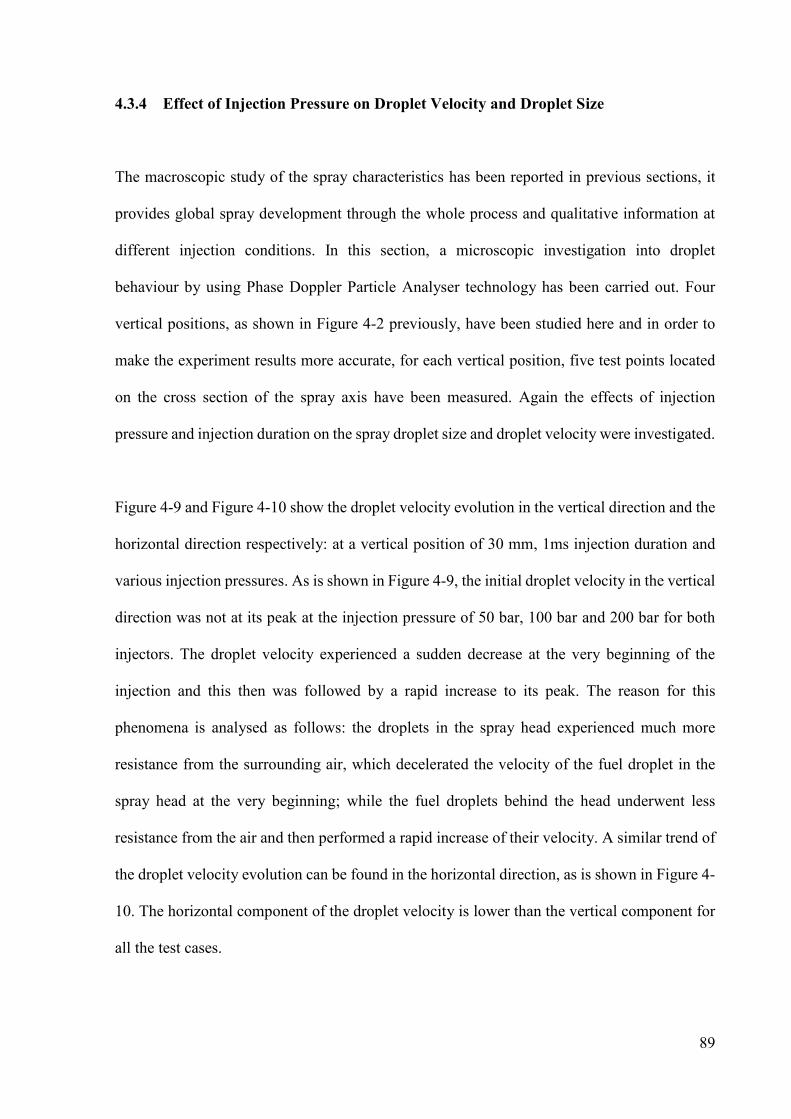
89
4.3.4 Effect of Injection Pressure on Droplet Velocity and Droplet Size
The macroscopic study of the spray characteristics has been reported in previous sections, it
provides global spray development through the whole process and qualitative information at
different injection conditions. In this section, a microscopic investigation into droplet
behaviour by using Phase Doppler Particle Analyser technology has been carried out. Four
vertical positions, as shown in Figure 4-2 previously, have been studied here and in order to
make the experiment results more accurate, for each vertical position, five test points located
on the cross section of the spray axis have been measured. Again the effects of injection
pressure and injection duration on the spray droplet size and droplet velocity were investigated.
Figure 4-9 and Figure 4-10 show the droplet velocity evolution in the vertical direction and the
horizontal direction respectively: at a vertical position of 30 mm, 1ms injection duration and
various injection pressures. As is shown in Figure 4-9, the initial droplet velocity in the vertical
direction was not at its peak at the injection pressure of 50 bar, 100 bar and 200 bar for both
injectors. The droplet velocity experienced a sudden decrease at the very beginning of the
injection and this then was followed by a rapid increase to its peak. The reason for this
phenomena is analysed as follows: the droplets in the spray head experienced much more
resistance from the surrounding air, which decelerated the velocity of the fuel droplet in the
spray head at the very beginning; while the fuel droplets behind the head underwent less
resistance from the air and then performed a rapid increase of their velocity. A similar trend of
the droplet velocity evolution can be found in the horizontal direction, as is shown in Figure 4-
10. The horizontal component of the droplet velocity is lower than the vertical component for
all the test cases.
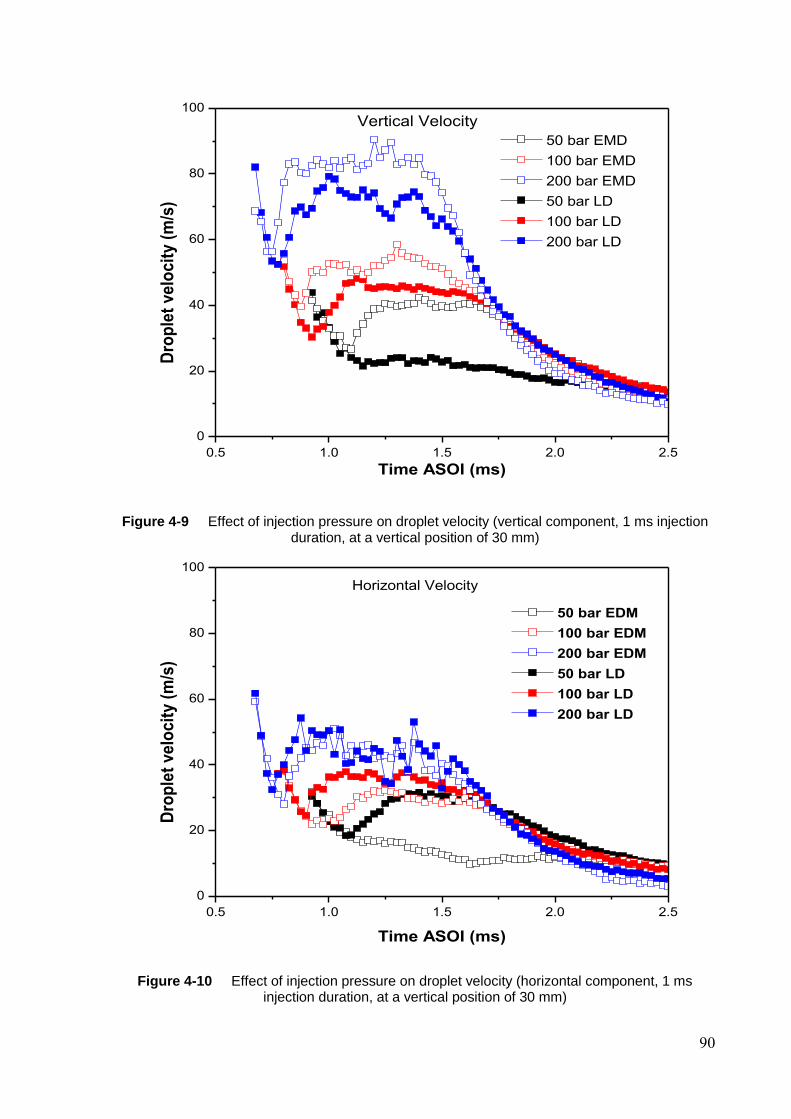
90
0.5 1.0 1.5 2.0 2.5
0
20
40
60
80
100
Dro
ple
t velo
cit
y (
m/s
)
Time ASOI (ms)
50 bar EMD
100 bar EMD
200 bar EMD
50 bar LD
100 bar LD
200 bar LD
Vertical Velocity
Figure 4-9 Effect of injection pressure on droplet velocity (vertical component, 1 ms injection duration, at a vertical position of 30 mm)
0.5 1.0 1.5 2.0 2.5
0
20
40
60
80
100
Dro
ple
t velo
cit
y (
m/s
)
Time ASOI (ms)
50 bar EDM
100 bar EDM
200 bar EDM
50 bar LD
100 bar LD
200 bar LD
Horizontal Velocity
Figure 4-10 Effect of injection pressure on droplet velocity (horizontal component, 1 ms injection duration, at a vertical position of 30 mm)
91
An obvious trend can be seen in Figure 4-9 where the droplet velocity increases with the
increasing of the injection pressure for both injectors; this was expected according to [124]. In
addition, it can be seen that a significant lower droplet velocity can be observed for the LD
injector at all the different injection pressures. In contrast to the weak acceleration process in
the LD injector, especially in the case of 50 bar injection pressure, the EDM injector shows
much stronger droplet acceleration. Therefore this also strongly supports the previous
penetration comparison where the higher spray velocity of the EDM injector led to a longer
penetration length.
Injection pressure is also one of the most important parameters in determining droplet size.
Figure 4-11 shows the Sauter Mean Diameter (SMD) at different injection pressures at the
vertical distance of 30 mm from the nozzle. The parameter SMD is one of the most important
features in the study of the spray atomization process. Although the Average Mean Diameter
(AMD) can represent the average droplet size, SMD can avoid the influence of some individual
smaller or bigger droplets and provide a more accurate result. In general, the calculation of
SMD for a given particle is defined as:
𝑆𝐷 = 𝐷[3,2] = 𝑑32 =𝑑𝑣
3
𝑑𝑠2 (4-1)
where dv and ds are the volume diameter and surface diameter respectively:
𝑑𝑣 = (6𝑉𝑝
𝜋)
1
3 ; 𝑑𝑠 = √
𝐴𝑝
𝜋 (4-2)
where Ap and Vp are the surface area and volume of the particle, respectively.
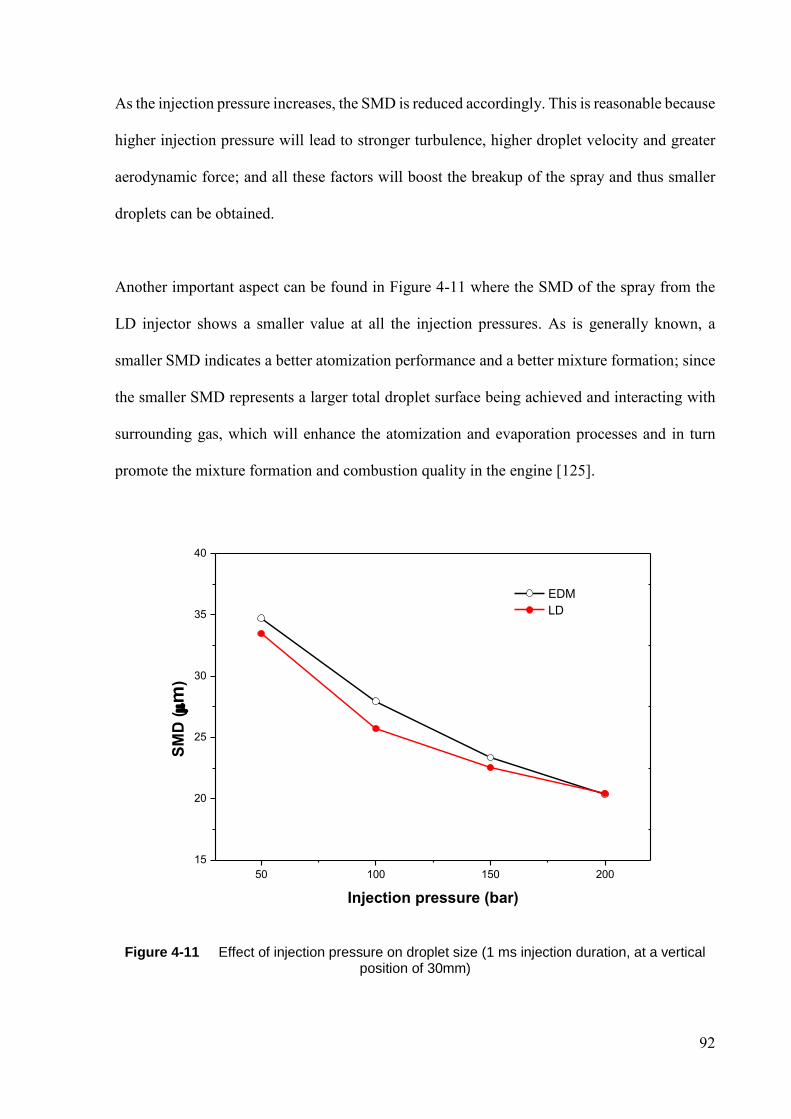
92
As the injection pressure increases, the SMD is reduced accordingly. This is reasonable because
higher injection pressure will lead to stronger turbulence, higher droplet velocity and greater
aerodynamic force; and all these factors will boost the breakup of the spray and thus smaller
droplets can be obtained.
Another important aspect can be found in Figure 4-11 where the SMD of the spray from the
LD injector shows a smaller value at all the injection pressures. As is generally known, a
smaller SMD indicates a better atomization performance and a better mixture formation; since
the smaller SMD represents a larger total droplet surface being achieved and interacting with
surrounding gas, which will enhance the atomization and evaporation processes and in turn
promote the mixture formation and combustion quality in the engine [125].
50 100 150 200
15
20
25
30
35
40
SM
D (m
)
Injection pressure (bar)
EDM
LD
Figure 4-11 Effect of injection pressure on droplet size (1 ms injection duration, at a vertical position of 30mm)
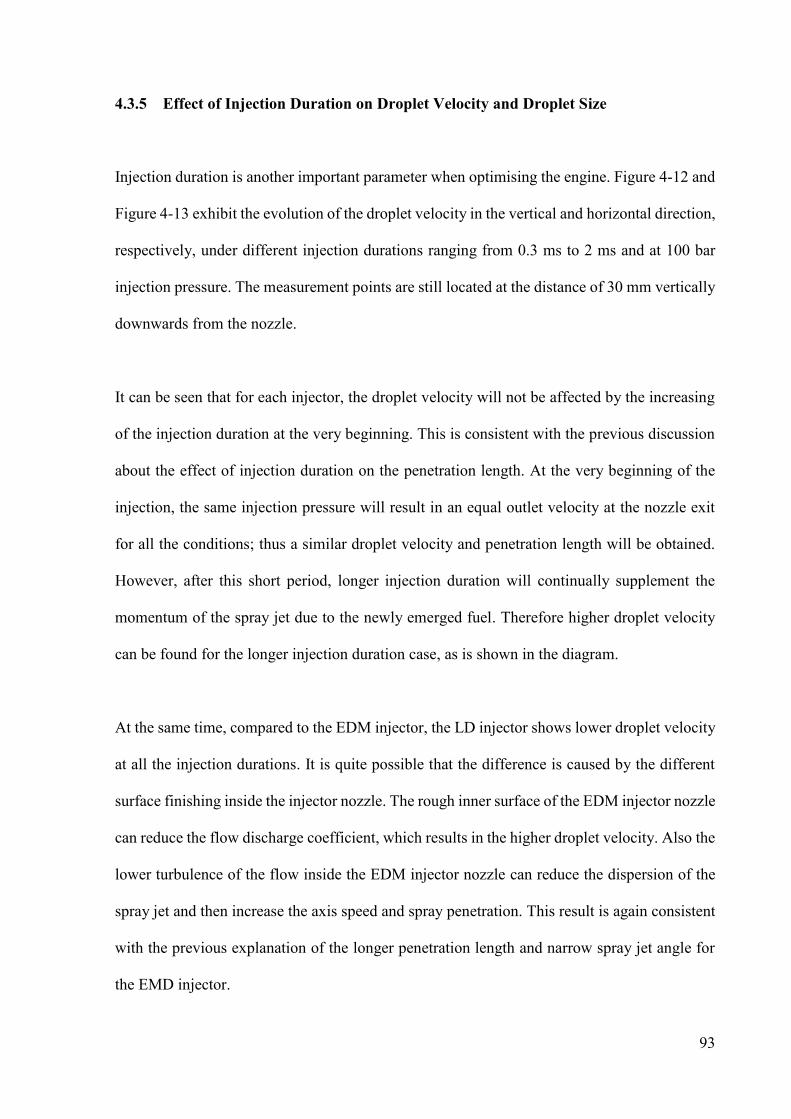
93
4.3.5 Effect of Injection Duration on Droplet Velocity and Droplet Size
Injection duration is another important parameter when optimising the engine. Figure 4-12 and
Figure 4-13 exhibit the evolution of the droplet velocity in the vertical and horizontal direction,
respectively, under different injection durations ranging from 0.3 ms to 2 ms and at 100 bar
injection pressure. The measurement points are still located at the distance of 30 mm vertically
downwards from the nozzle.
It can be seen that for each injector, the droplet velocity will not be affected by the increasing
of the injection duration at the very beginning. This is consistent with the previous discussion
about the effect of injection duration on the penetration length. At the very beginning of the
injection, the same injection pressure will result in an equal outlet velocity at the nozzle exit
for all the conditions; thus a similar droplet velocity and penetration length will be obtained.
However, after this short period, longer injection duration will continually supplement the
momentum of the spray jet due to the newly emerged fuel. Therefore higher droplet velocity
can be found for the longer injection duration case, as is shown in the diagram.
At the same time, compared to the EDM injector, the LD injector shows lower droplet velocity
at all the injection durations. It is quite possible that the difference is caused by the different
surface finishing inside the injector nozzle. The rough inner surface of the EDM injector nozzle
can reduce the flow discharge coefficient, which results in the higher droplet velocity. Also the
lower turbulence of the flow inside the EDM injector nozzle can reduce the dispersion of the
spray jet and then increase the axis speed and spray penetration. This result is again consistent
with the previous explanation of the longer penetration length and narrow spray jet angle for
the EMD injector.
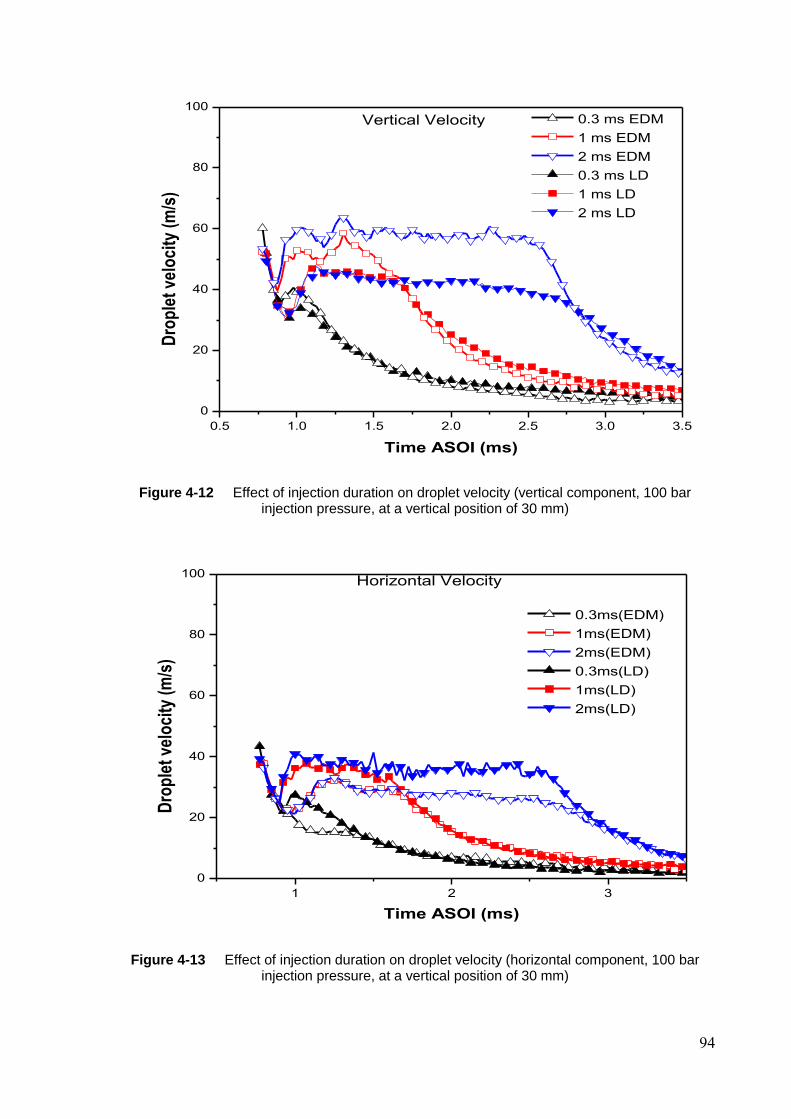
94
0.5 1.0 1.5 2.0 2.5 3.0 3.5
0
20
40
60
80
100
Dro
ple
t ve
loci
ty (
m/s
)
Time ASOI (ms)
0.3 ms EDM
1 ms EDM
2 ms EDM
0.3 ms LD
1 ms LD
2 ms LD
Vertical Velocity
Figure 4-12 Effect of injection duration on droplet velocity (vertical component, 100 bar injection pressure, at a vertical position of 30 mm)
1 2 3
0
20
40
60
80
100
Dro
ple
t ve
loci
ty (
m/s
)
Time ASOI (ms)
0.3ms(EDM)
1ms(EDM)
2ms(EDM)
0.3ms(LD)
1ms(LD)
2ms(LD)
Horizontal Velocity
Figure 4-13 Effect of injection duration on droplet velocity (horizontal component, 100 bar injection pressure, at a vertical position of 30 mm)
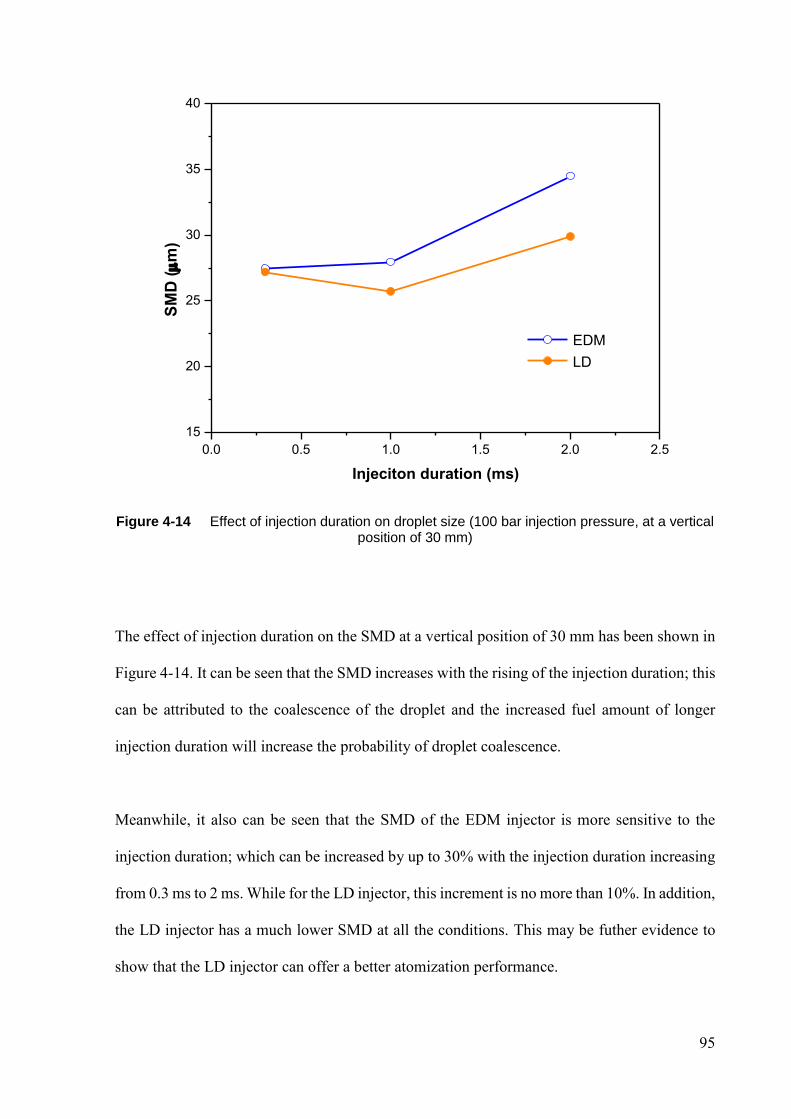
95
0.0 0.5 1.0 1.5 2.0 2.5
15
20
25
30
35
40
SM
D (m
)
Injeciton duration (ms)
EDM
LD
Figure 4-14 Effect of injection duration on droplet size (100 bar injection pressure, at a vertical position of 30 mm)
The effect of injection duration on the SMD at a vertical position of 30 mm has been shown in
Figure 4-14. It can be seen that the SMD increases with the rising of the injection duration; this
can be attributed to the coalescence of the droplet and the increased fuel amount of longer
injection duration will increase the probability of droplet coalescence.
Meanwhile, it also can be seen that the SMD of the EDM injector is more sensitive to the
injection duration; which can be increased by up to 30% with the injection duration increasing
from 0.3 ms to 2 ms. While for the LD injector, this increment is no more than 10%. In addition,
the LD injector has a much lower SMD at all the conditions. This may be futher evidence to
show that the LD injector can offer a better atomization performance.
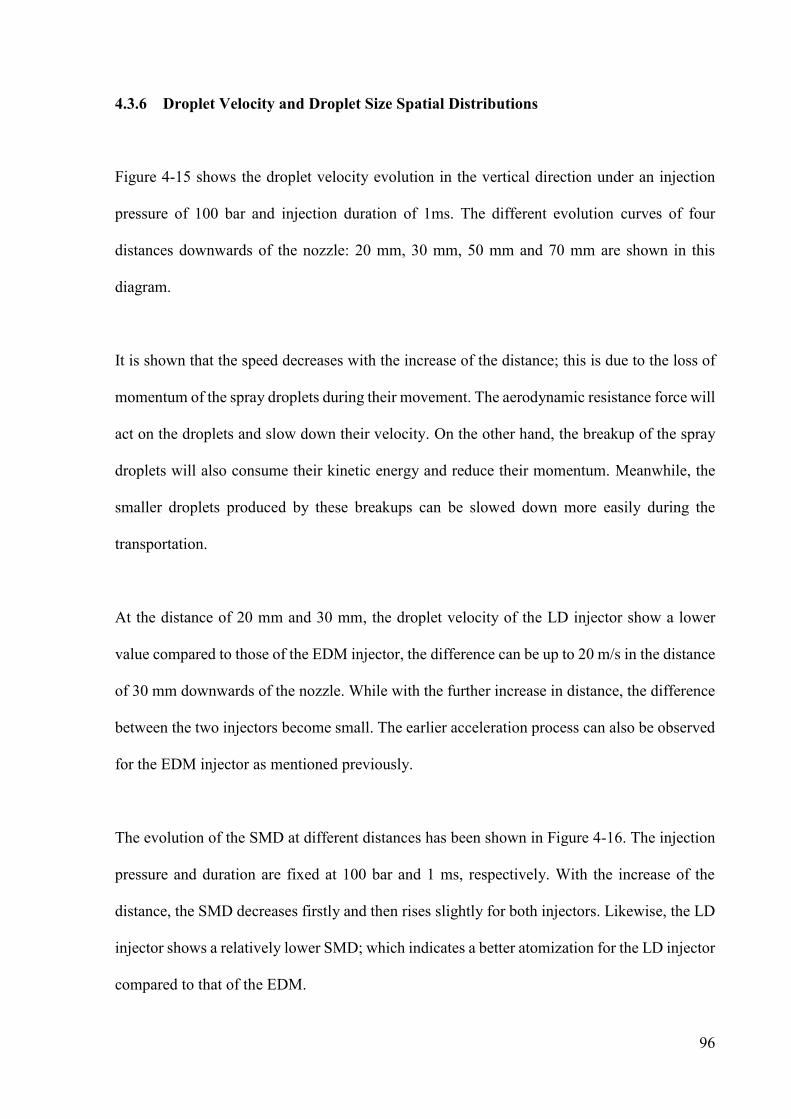
96
4.3.6 Droplet Velocity and Droplet Size Spatial Distributions
Figure 4-15 shows the droplet velocity evolution in the vertical direction under an injection
pressure of 100 bar and injection duration of 1ms. The different evolution curves of four
distances downwards of the nozzle: 20 mm, 30 mm, 50 mm and 70 mm are shown in this
diagram.
It is shown that the speed decreases with the increase of the distance; this is due to the loss of
momentum of the spray droplets during their movement. The aerodynamic resistance force will
act on the droplets and slow down their velocity. On the other hand, the breakup of the spray
droplets will also consume their kinetic energy and reduce their momentum. Meanwhile, the
smaller droplets produced by these breakups can be slowed down more easily during the
transportation.
At the distance of 20 mm and 30 mm, the droplet velocity of the LD injector show a lower
value compared to those of the EDM injector, the difference can be up to 20 m/s in the distance
of 30 mm downwards of the nozzle. While with the further increase in distance, the difference
between the two injectors become small. The earlier acceleration process can also be observed
for the EDM injector as mentioned previously.
The evolution of the SMD at different distances has been shown in Figure 4-16. The injection
pressure and duration are fixed at 100 bar and 1 ms, respectively. With the increase of the
distance, the SMD decreases firstly and then rises slightly for both injectors. Likewise, the LD
injector shows a relatively lower SMD; which indicates a better atomization for the LD injector
compared to that of the EDM.
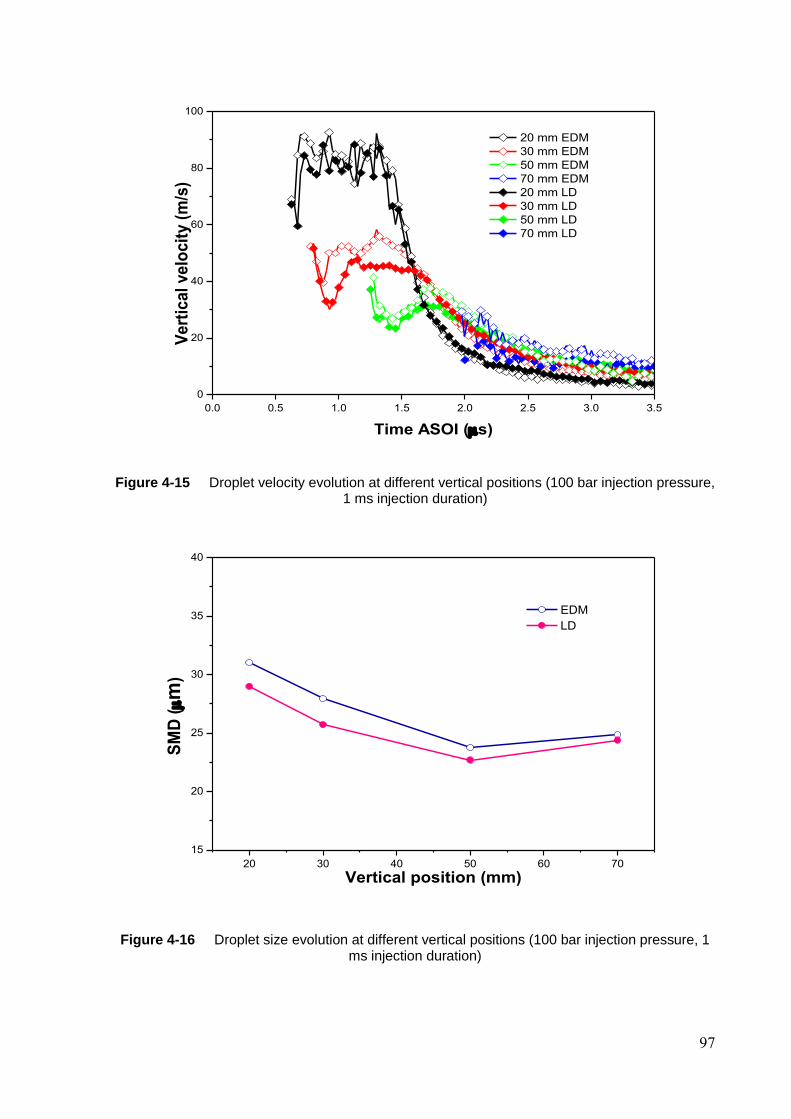
97
0.0 0.5 1.0 1.5 2.0 2.5 3.0 3.5
0
20
40
60
80
100
Vert
ical
velo
cit
y (
m/s
)
Time ASOI (s)
20 mm EDM
30 mm EDM
50 mm EDM
70 mm EDM
20 mm LD
30 mm LD
50 mm LD
70 mm LD
Figure 4-15 Droplet velocity evolution at different vertical positions (100 bar injection pressure, 1 ms injection duration)
20 30 40 50 60 70
15
20
25
30
35
40
SM
D (m
)
Vertical position (mm)
EDM
LD
Figure 4-16 Droplet size evolution at different vertical positions (100 bar injection pressure, 1 ms injection duration)
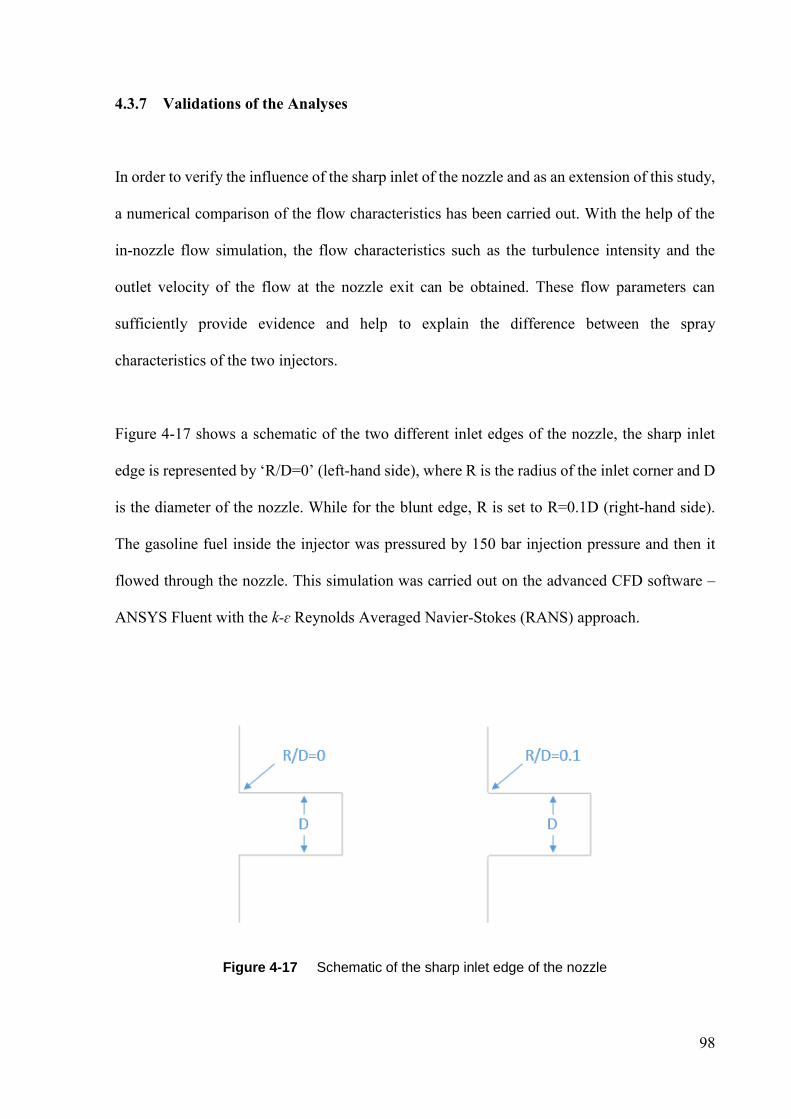
98
4.3.7 Validations of the Analyses
In order to verify the influence of the sharp inlet of the nozzle and as an extension of this study,
a numerical comparison of the flow characteristics has been carried out. With the help of the
in-nozzle flow simulation, the flow characteristics such as the turbulence intensity and the
outlet velocity of the flow at the nozzle exit can be obtained. These flow parameters can
sufficiently provide evidence and help to explain the difference between the spray
characteristics of the two injectors.
Figure 4-17 shows a schematic of the two different inlet edges of the nozzle, the sharp inlet
edge is represented by ‘R/D=0’ (left-hand side), where R is the radius of the inlet corner and D
is the diameter of the nozzle. While for the blunt edge, R is set to R=0.1D (right-hand side).
The gasoline fuel inside the injector was pressured by 150 bar injection pressure and then it
flowed through the nozzle. This simulation was carried out on the advanced CFD software –
ANSYS Fluent with the k-ɛ Reynolds Averaged Navier-Stokes (RANS) approach.
Figure 4-17 Schematic of the sharp inlet edge of the nozzle
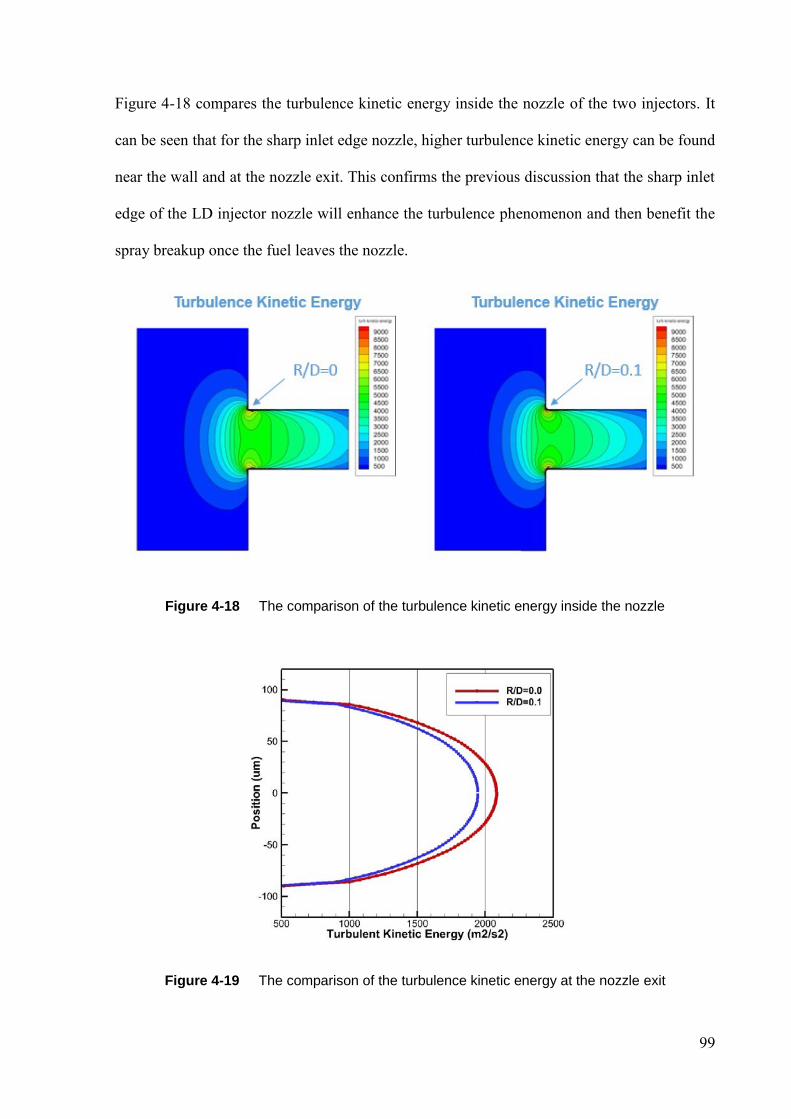
99
Figure 4-18 compares the turbulence kinetic energy inside the nozzle of the two injectors. It
can be seen that for the sharp inlet edge nozzle, higher turbulence kinetic energy can be found
near the wall and at the nozzle exit. This confirms the previous discussion that the sharp inlet
edge of the LD injector nozzle will enhance the turbulence phenomenon and then benefit the
spray breakup once the fuel leaves the nozzle.
Figure 4-18 The comparison of the turbulence kinetic energy inside the nozzle
Figure 4-19 The comparison of the turbulence kinetic energy at the nozzle exit
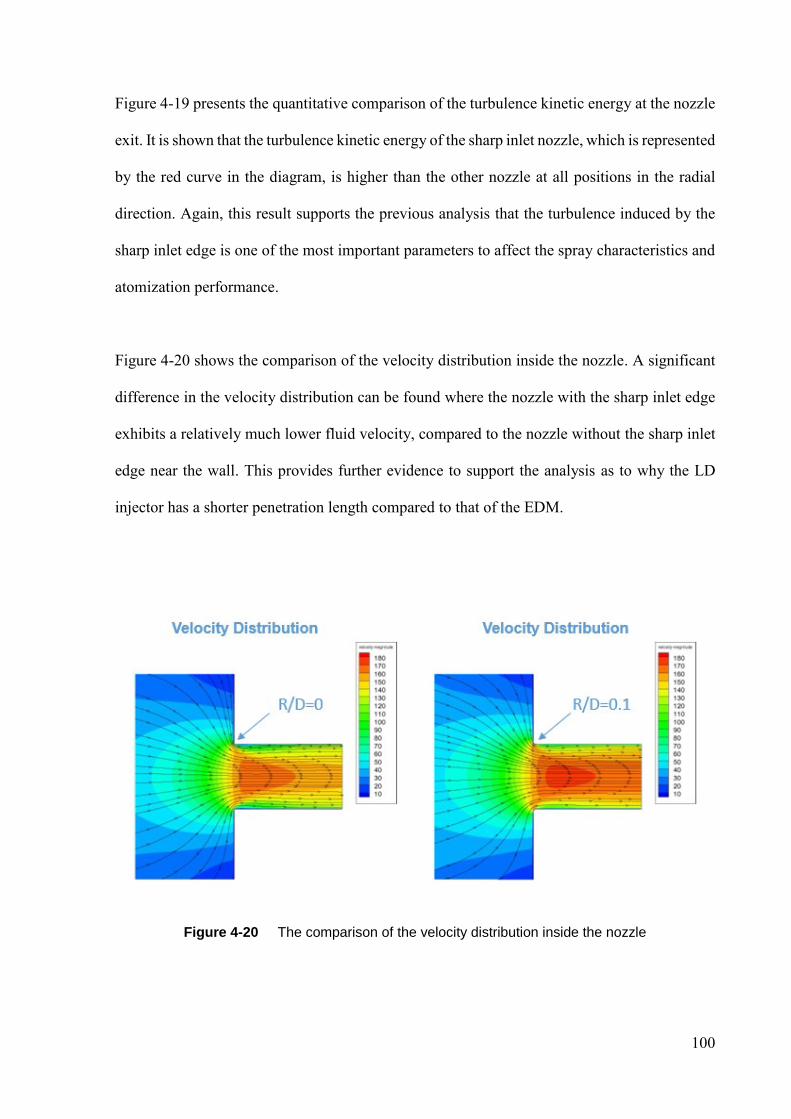
100
Figure 4-19 presents the quantitative comparison of the turbulence kinetic energy at the nozzle
exit. It is shown that the turbulence kinetic energy of the sharp inlet nozzle, which is represented
by the red curve in the diagram, is higher than the other nozzle at all positions in the radial
direction. Again, this result supports the previous analysis that the turbulence induced by the
sharp inlet edge is one of the most important parameters to affect the spray characteristics and
atomization performance.
Figure 4-20 shows the comparison of the velocity distribution inside the nozzle. A significant
difference in the velocity distribution can be found where the nozzle with the sharp inlet edge
exhibits a relatively much lower fluid velocity, compared to the nozzle without the sharp inlet
edge near the wall. This provides further evidence to support the analysis as to why the LD
injector has a shorter penetration length compared to that of the EDM.
Figure 4-20 The comparison of the velocity distribution inside the nozzle
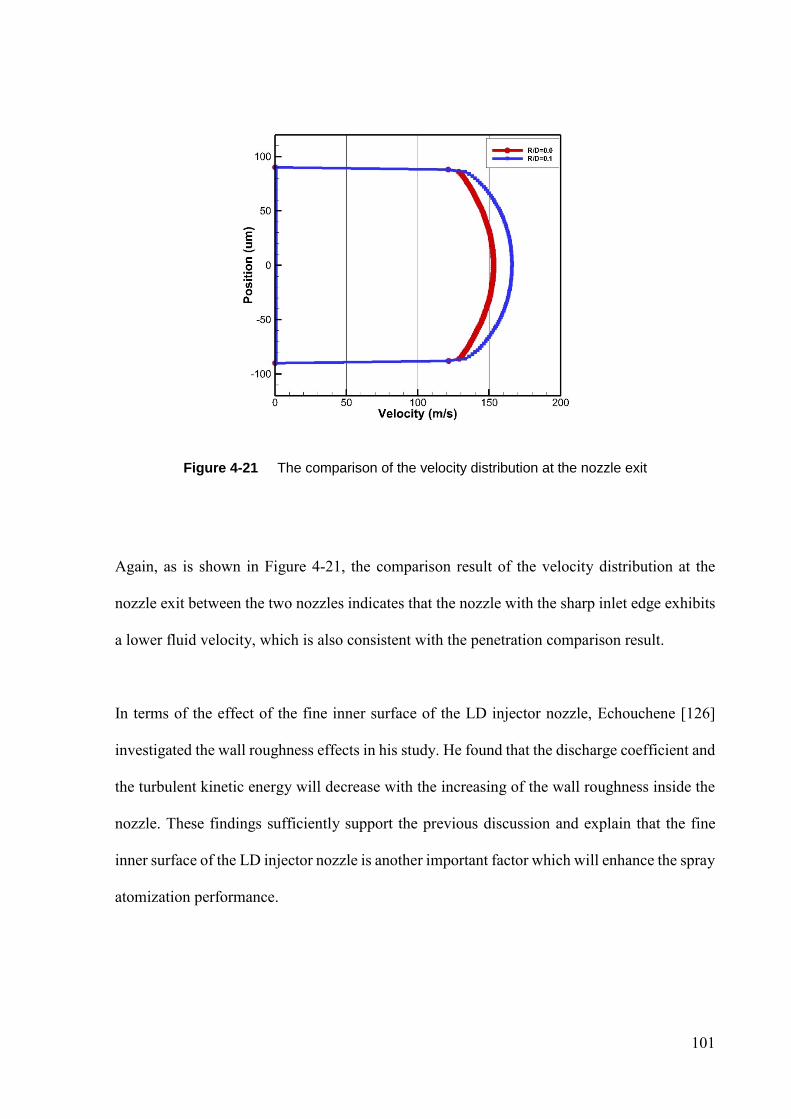
101
Figure 4-21 The comparison of the velocity distribution at the nozzle exit
Again, as is shown in Figure 4-21, the comparison result of the velocity distribution at the
nozzle exit between the two nozzles indicates that the nozzle with the sharp inlet edge exhibits
a lower fluid velocity, which is also consistent with the penetration comparison result.
In terms of the effect of the fine inner surface of the LD injector nozzle, Echouchene [126]
investigated the wall roughness effects in his study. He found that the discharge coefficient and
the turbulent kinetic energy will decrease with the increasing of the wall roughness inside the
nozzle. These findings sufficiently support the previous discussion and explain that the fine
inner surface of the LD injector nozzle is another important factor which will enhance the spray
atomization performance.
102
4.4 Summary
The influence of injection pressure, injection duration and different injector machining
methods on the gasoline spray characteristics have been investigated in this study. The
experimental comparison of the spray characteristics of the same injectors made from different
manufacturing processes has been studied in terms of spray penetration, spray angle, droplet
velocity and droplet size. Differences in the spray characteristics have been found due to the
sharp inlet edge and fine inner surface of the LD injector nozzle. The main conclusions are as
follows:
1. The injection pressure plays an important role in affecting the spray penetration. Higher
injection pressure will increase the penetration length and enhance the spray atomization
process. However, the spray angle is almost independent of the injection pressure.
2. The injection pressure also significantly affects the droplet size and droplet velocity. With
the increase of the injection pressure, the droplet velocity increases while the droplet size
decreases accordingly.
3. The injection duration does not affect the spray penetration at the initial stage of the injection;
however, after this period, longer penetration length can be found with the increase of the
injection duration. The spray angle is almost independent of the injection duration.
4. The injection duration is another factor which affects the droplet velocity and droplet size.
With the increase of the injection duration from 0.3 ms to 2 ms, a similar droplet velocity can
103
be found at the initial stage of the injection; however, after this period, longer injection duration
will lead to higher droplet velocity and greater droplet size.
5. With the increase of the distance downwards of the nozzle, the droplet velocity decreases
gradually; while the droplet size decreases first and then increases slightly at a far distance.
6. Compared to the EDM injector, the LD injector shows a reduced penetration, larger spray
angle and smaller spray droplet size at all test conditions. Obviously, the adoption of the LD
injector will improve the atomization quality due to the sharp inlet edge and fine inner surface
of the LD injector nozzle. It is believed that the sharp inlet edge can enhance the turbulence of
the flow and in turn promote the spray breakup and atomization performance.
104
5 CHAPTER 5 SPRAY CHARACTERISTICS OF
DIESEL ENGINES
This chapter investigates the spray characteristics of diesel, gasoline and dieseline fuel in the
diesel engine. The main objectives of this study are to investigate the effects of injection
pressure, ambient pressure and different fuels including gasoline, diesel, and their blends –
dieseline, on the spray characteristics; and furthermore to try to understand the different
behaviours of the spray atomization process of pure diesel and the recently developed dieseline
fuel. The comparisons in terms of spray macroscopic and microscopic characteristics of
different dieseline blends will be experimentally carried out in this study.
5.1 Introduction
Compression Ignition (CI) diesel engines have high thermal efficiency but produce a lot of
nitrogen oxides (NOx) and soot emissions. In recent decades, there is an increasing concern
regarding the environmental impact of emissions from internal combustion engines (ICE).
Furthermore, the emission standard is becoming increasingly stringent in recent years. To meet
the emission legislation, diesel engines have to be equipped with a high pressure common rail
injection system and costly after treatment equipments. On the other hand, although the harmful
exhaust emissions from Spark-ignition (SI) gasoline engines can be reduced by the
implementation of a costly effective three-way catalyst, however, the thermal efficiency of
gasoline engines is lower than diesel engines.
105
Much research has shown that the smoke emissions of diesel engines can be significantly
reduced by fuelling the engines with gasoline or gasoline/diesel blends; while the reduction of
NOx can also be facilitated by increasing the exhaust gas recirculation ratio [127-132].
Kalghatgi et al. [127] successfully tested a gasoline fuelled partially premixed compression
ignition (PPCI) engine and showed that even at high loads of 15.95 bar indicated mean effective
pressure (IMEP), almost zero smoke emissions and a low indicated specific fuel consumption
(ISFC) of 179 g/kWh was obtained. Similar findings were also demonstrated by Ciatti et al.
[128] and Manente et al [129].
At the University of Birmingham, researchers investigated the idea of altering fuel
characteristics through blending gasoline with diesel and the resulting fuel was named
‘Dieseline’ [130-133]. According to the experimental results, dieseline has great advantages
over diesel for smoke reduction when being used in both PPCI and conventional diesel engines.
Weall and Collings [134] found that the PPCI operating range can be extended by using the
dieseline fuel. It was demonstrated by Han et al. [135] that the usage of dieseline fuel reduced
the dependence of smoke reduction on high injection pressure.
Both the chemical and physical properties of fuel can affect the combustion performance and
emissions of diesel engines. Compared to pure diesel, the lower cetane number of gasoline and
dieseline, which increases the ignition delay and mixing time, has definitely contributed to their
low smoke emissions [136]. The investigations of diesel-like fuels show that the spray
characteristics also play an important role in the emission formations of diesel engines [137,
138]. For example, over-penetration can cause piston bowl/cylinder wall wetting and thus
increase particle, UHC and CO emissions; particle emissions can be effectively reduced with
better spray atomization. Payri et al. [139] found that there was little difference between diesel
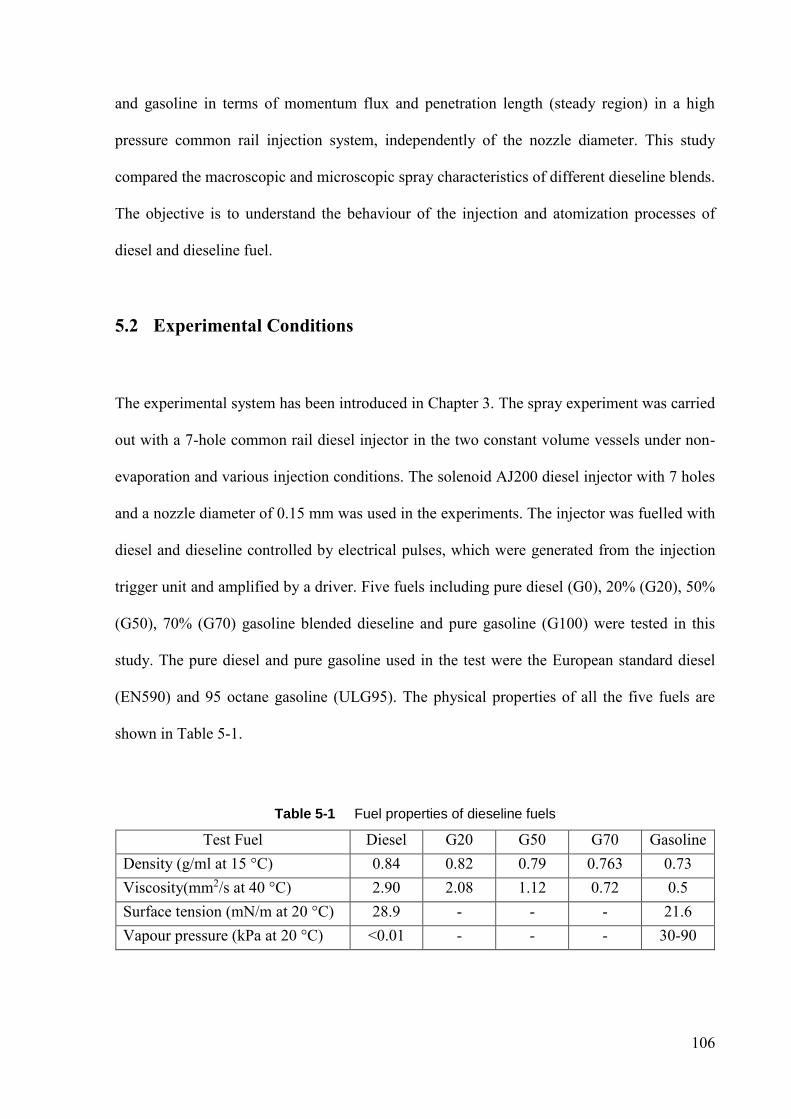
106
and gasoline in terms of momentum flux and penetration length (steady region) in a high
pressure common rail injection system, independently of the nozzle diameter. This study
compared the macroscopic and microscopic spray characteristics of different dieseline blends.
The objective is to understand the behaviour of the injection and atomization processes of
diesel and dieseline fuel.
5.2 Experimental Conditions
The experimental system has been introduced in Chapter 3. The spray experiment was carried
out with a 7-hole common rail diesel injector in the two constant volume vessels under non-
evaporation and various injection conditions. The solenoid AJ200 diesel injector with 7 holes
and a nozzle diameter of 0.15 mm was used in the experiments. The injector was fuelled with
diesel and dieseline controlled by electrical pulses, which were generated from the injection
trigger unit and amplified by a driver. Five fuels including pure diesel (G0), 20% (G20), 50%
(G50), 70% (G70) gasoline blended dieseline and pure gasoline (G100) were tested in this
study. The pure diesel and pure gasoline used in the test were the European standard diesel
(EN590) and 95 octane gasoline (ULG95). The physical properties of all the five fuels are
shown in Table 5-1.
Table 5-1 Fuel properties of dieseline fuels
Test Fuel Diesel G20 G50 G70 Gasoline
Density (g/ml at 15 °C) 0.84 0.82 0.79 0.763 0.73
Viscosity(mm2/s at 40 °C) 2.90 2.08 1.12 0.72 0.5
Surface tension (mN/m at 20 °C) 28.9 - - - 21.6
Vapour pressure (kPa at 20 °C) <0.01 - - - 30-90
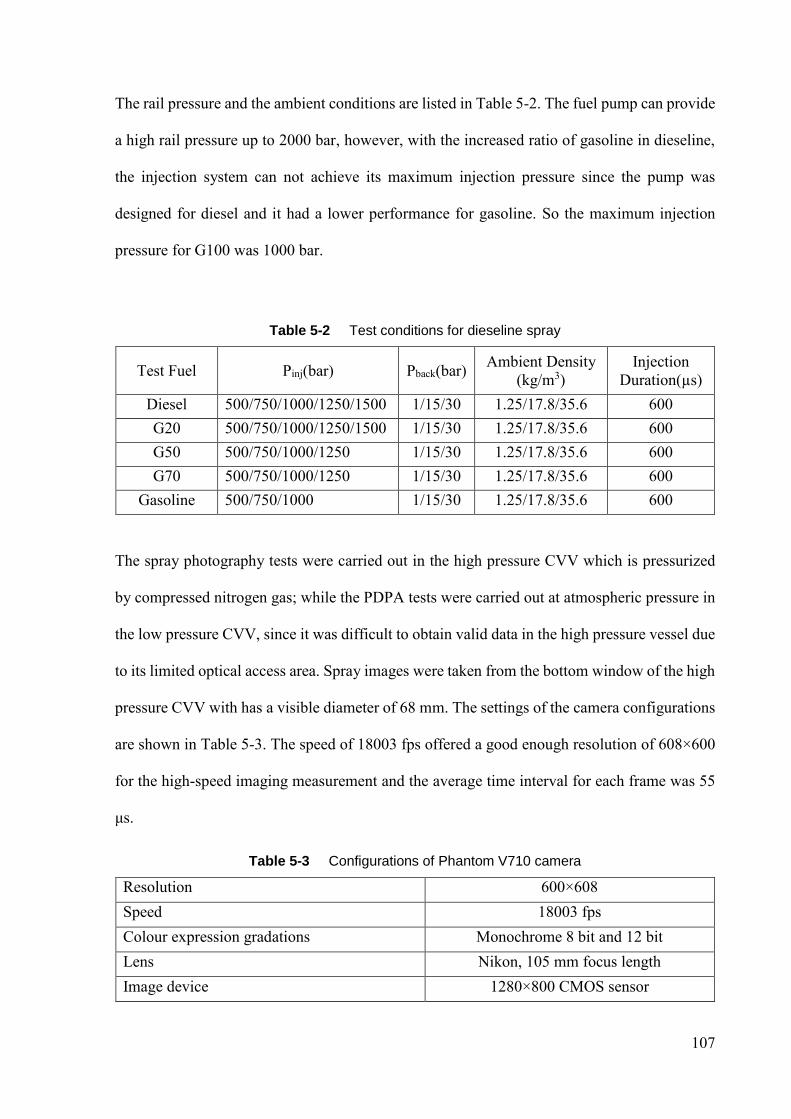
107
The rail pressure and the ambient conditions are listed in Table 5-2. The fuel pump can provide
a high rail pressure up to 2000 bar, however, with the increased ratio of gasoline in dieseline,
the injection system can not achieve its maximum injection pressure since the pump was
designed for diesel and it had a lower performance for gasoline. So the maximum injection
pressure for G100 was 1000 bar.
Table 5-2 Test conditions for dieseline spray
Test Fuel Pinj(bar) Pback(bar) Ambient Density
(kg/m3)
Injection
Duration(µs)
Diesel 500/750/1000/1250/1500 1/15/30 1.25/17.8/35.6 600
G20 500/750/1000/1250/1500 1/15/30 1.25/17.8/35.6 600
G50 500/750/1000/1250 1/15/30 1.25/17.8/35.6 600
G70 500/750/1000/1250 1/15/30 1.25/17.8/35.6 600
Gasoline 500/750/1000 1/15/30 1.25/17.8/35.6 600
The spray photography tests were carried out in the high pressure CVV which is pressurized
by compressed nitrogen gas; while the PDPA tests were carried out at atmospheric pressure in
the low pressure CVV, since it was difficult to obtain valid data in the high pressure vessel due
to its limited optical access area. Spray images were taken from the bottom window of the high
pressure CVV with has a visible diameter of 68 mm. The settings of the camera configurations
are shown in Table 5-3. The speed of 18003 fps offered a good enough resolution of 608×600
for the high-speed imaging measurement and the average time interval for each frame was 55
μs.
Table 5-3 Configurations of Phantom V710 camera
Resolution 600×608
Speed 18003 fps
Colour expression gradations Monochrome 8 bit and 12 bit
Lens Nikon, 105 mm focus length
Image device 1280×800 CMOS sensor
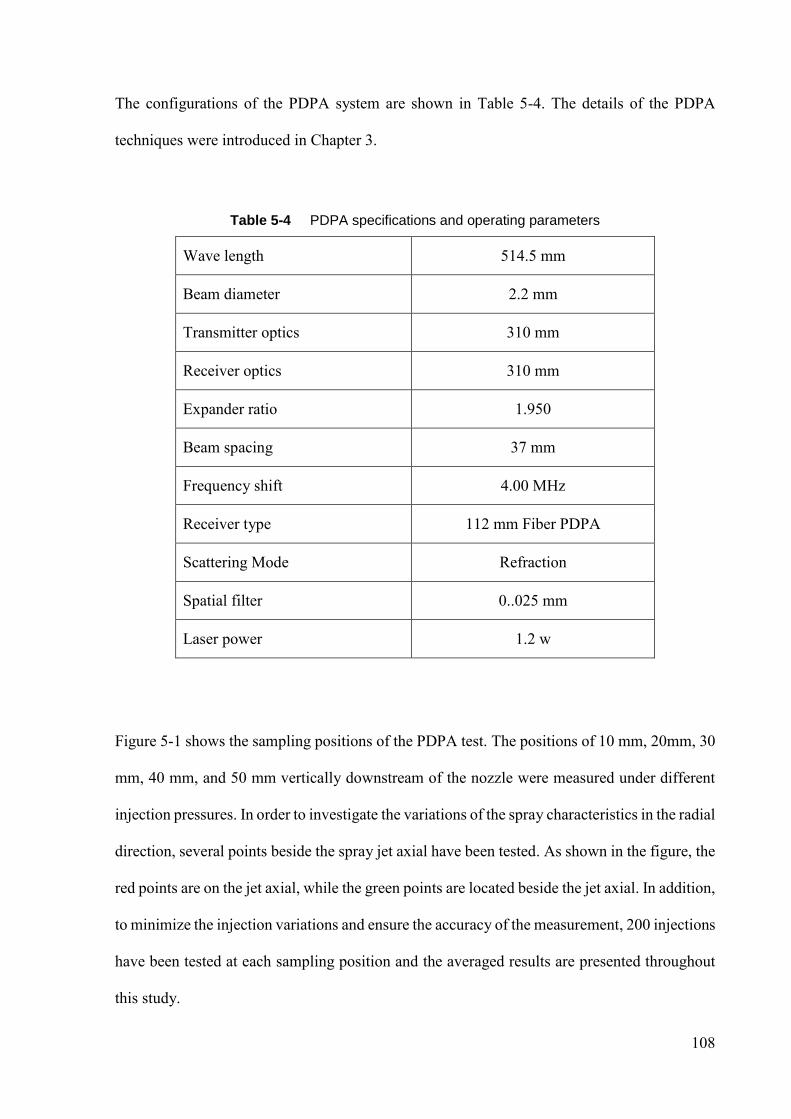
108
The configurations of the PDPA system are shown in Table 5-4. The details of the PDPA
techniques were introduced in Chapter 3.
Table 5-4 PDPA specifications and operating parameters
Wave length 514.5 mm
Beam diameter 2.2 mm
Transmitter optics 310 mm
Receiver optics 310 mm
Expander ratio 1.950
Beam spacing 37 mm
Frequency shift 4.00 MHz
Receiver type 112 mm Fiber PDPA
Scattering Mode Refraction
Spatial filter 0..025 mm
Laser power 1.2 w
Figure 5-1 shows the sampling positions of the PDPA test. The positions of 10 mm, 20mm, 30
mm, 40 mm, and 50 mm vertically downstream of the nozzle were measured under different
injection pressures. In order to investigate the variations of the spray characteristics in the radial
direction, several points beside the spray jet axial have been tested. As shown in the figure, the
red points are on the jet axial, while the green points are located beside the jet axial. In addition,
to minimize the injection variations and ensure the accuracy of the measurement, 200 injections
have been tested at each sampling position and the averaged results are presented throughout
this study.
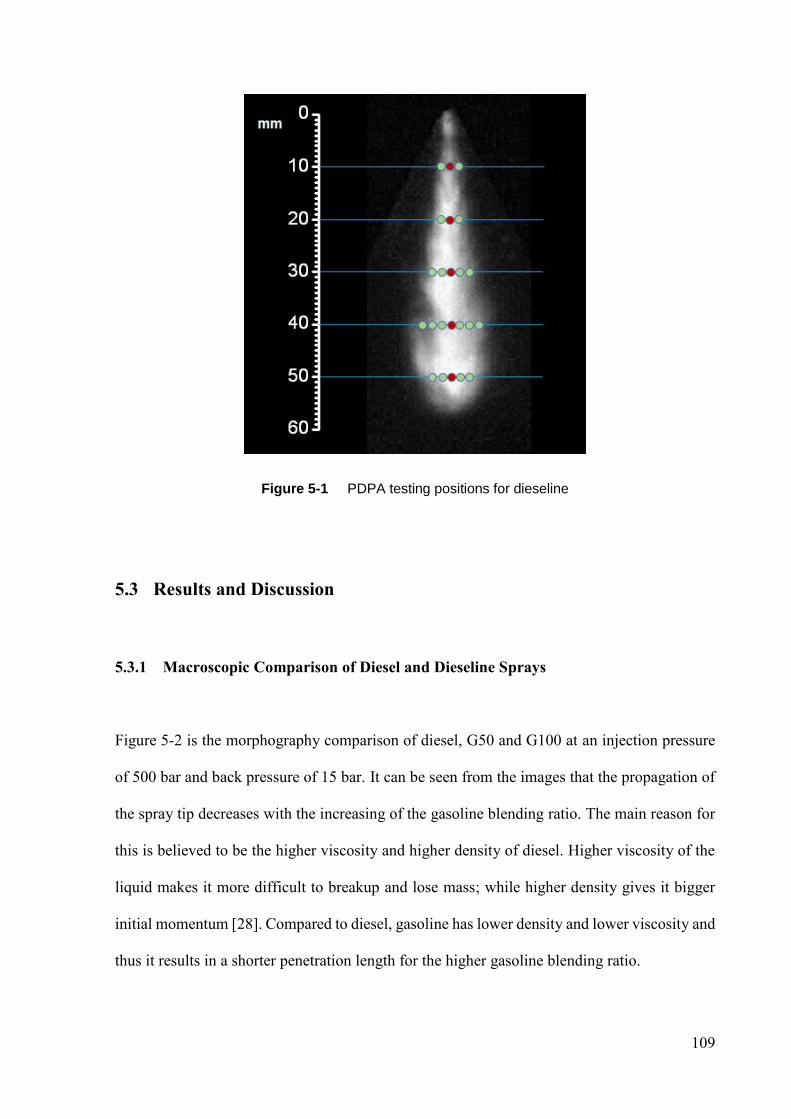
109
Figure 5-1 PDPA testing positions for dieseline
5.3 Results and Discussion
5.3.1 Macroscopic Comparison of Diesel and Dieseline Sprays
Figure 5-2 is the morphography comparison of diesel, G50 and G100 at an injection pressure
of 500 bar and back pressure of 15 bar. It can be seen from the images that the propagation of
the spray tip decreases with the increasing of the gasoline blending ratio. The main reason for
this is believed to be the higher viscosity and higher density of diesel. Higher viscosity of the
liquid makes it more difficult to breakup and lose mass; while higher density gives it bigger
initial momentum [28]. Compared to diesel, gasoline has lower density and lower viscosity and
thus it results in a shorter penetration length for the higher gasoline blending ratio.
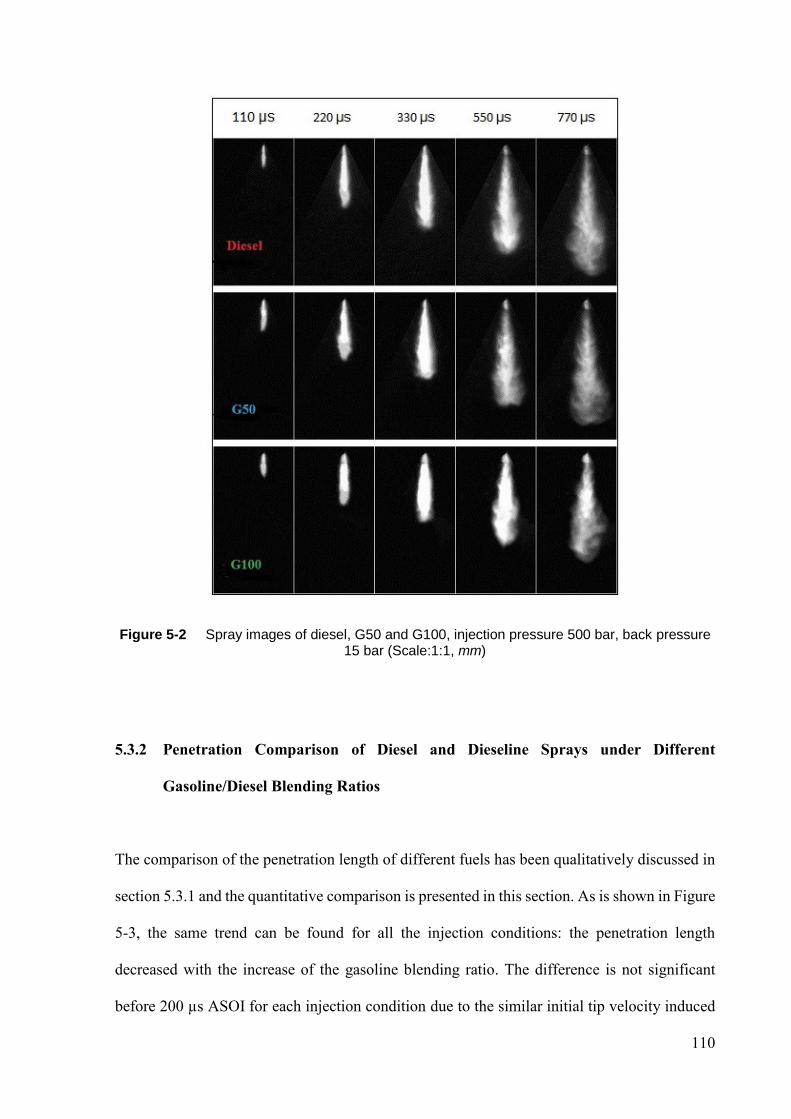
110
Figure 5-2 Spray images of diesel, G50 and G100, injection pressure 500 bar, back pressure 15 bar (Scale:1:1, mm)
5.3.2 Penetration Comparison of Diesel and Dieseline Sprays under Different
Gasoline/Diesel Blending Ratios
The comparison of the penetration length of different fuels has been qualitatively discussed in
section 5.3.1 and the quantitative comparison is presented in this section. As is shown in Figure
5-3, the same trend can be found for all the injection conditions: the penetration length
decreased with the increase of the gasoline blending ratio. The difference is not significant
before 200 µs ASOI for each injection condition due to the similar initial tip velocity induced
111
by the same injection pressure for all fuels. However, after this time point, the situation
becomes different and the atomization and breakup reduced the kinetic energy of the fluid and
at the same time, the aerodynamic resistance slowed down the droplet velocity. Thus it can be
seen in Figure 5-3, beyond the initial stage, the penetrations of different fuels differ much as
time goes on. For example, at 15 bar ambient pressure and 500 bar injection pressure, with the
increasing of the gasoline/diesel blending ratio, the penetration reduced gradually. The
maximum difference of the spray penetration between G0 (pure diesel) and G100 (pure
gasoline) is about 6 mm.
As discussed previously, it is believed that the physical properties of gasoline enhances the
atomization and breakup processes of the spray and results in the shorter tip penetration due to
the kinetic energy loss during the breakup. In addition, the cavitation effect becomes more and
more significant with the increase of the gasoline blending ratio; due to the much higher vapour
pressure of gasoline. There is no doubt that the cavitation effect plays an important role in
accelerating the atomization process [140] and this could be an important factor affecting the
penetration length.
To compare the penetration length between the conditions of 15 bar and 30 bar ambient
pressure, it can be seen that the penetration difference is more significant at lower ambient
pressure; while at higher ambient pressure, this difference becomes weak. Another
phenomenon is that the penetration of pure gasoline (G100) is less sensitive to the increase of
ambient pressure compared to that of pure diesel. A similar trend can be found in terms of
increasing the injection pressure. The possible reasons and details of these differences will be
discussed in the following sections.
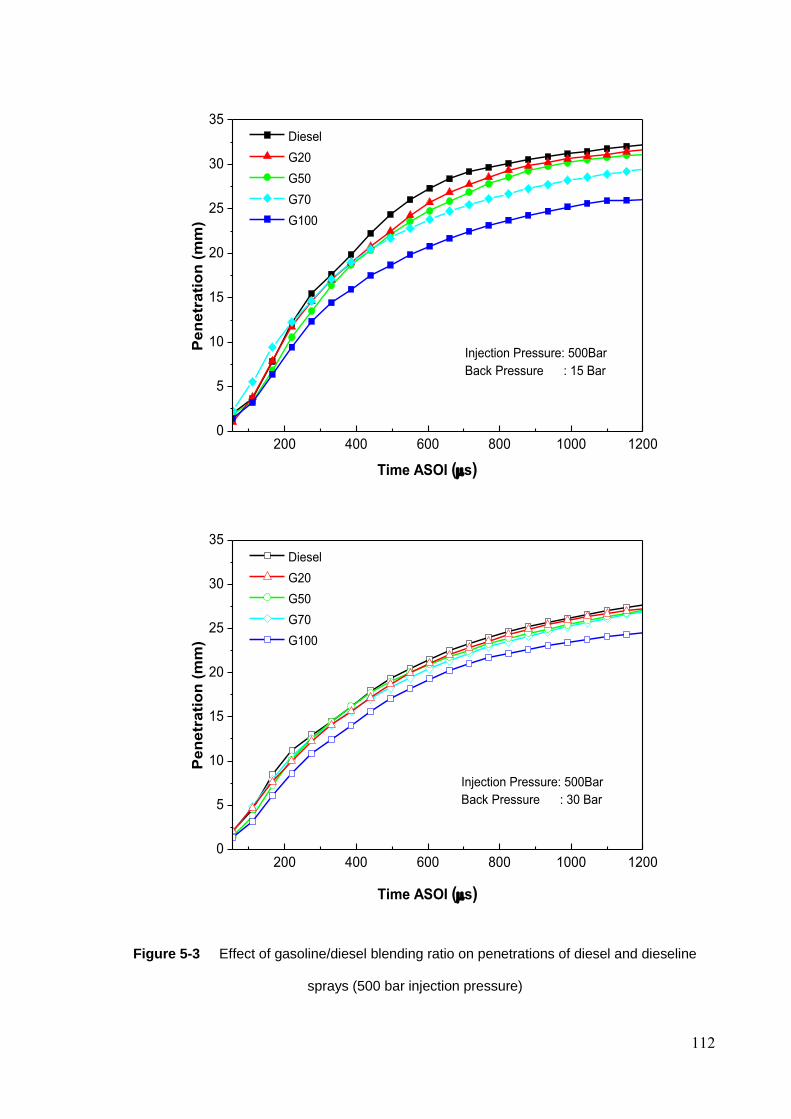
112
200 400 600 800 1000 12000
5
10
15
20
25
30
35 Diesel
G20
G50
G70
G100
Pe
ne
tra
tio
n (
mm
)
Time ASOI (s)
Injection Pressure: 500Bar
Back Pressure : 15 Bar
200 400 600 800 1000 12000
5
10
15
20
25
30
35
Diesel
G20
G50
G70
G100
Pe
ne
tra
tio
n (
mm
)
Time ASOI (s)
Injection Pressure: 500Bar
Back Pressure : 30 Bar
Figure 5-3 Effect of gasoline/diesel blending ratio on penetrations of diesel and dieseline
sprays (500 bar injection pressure)
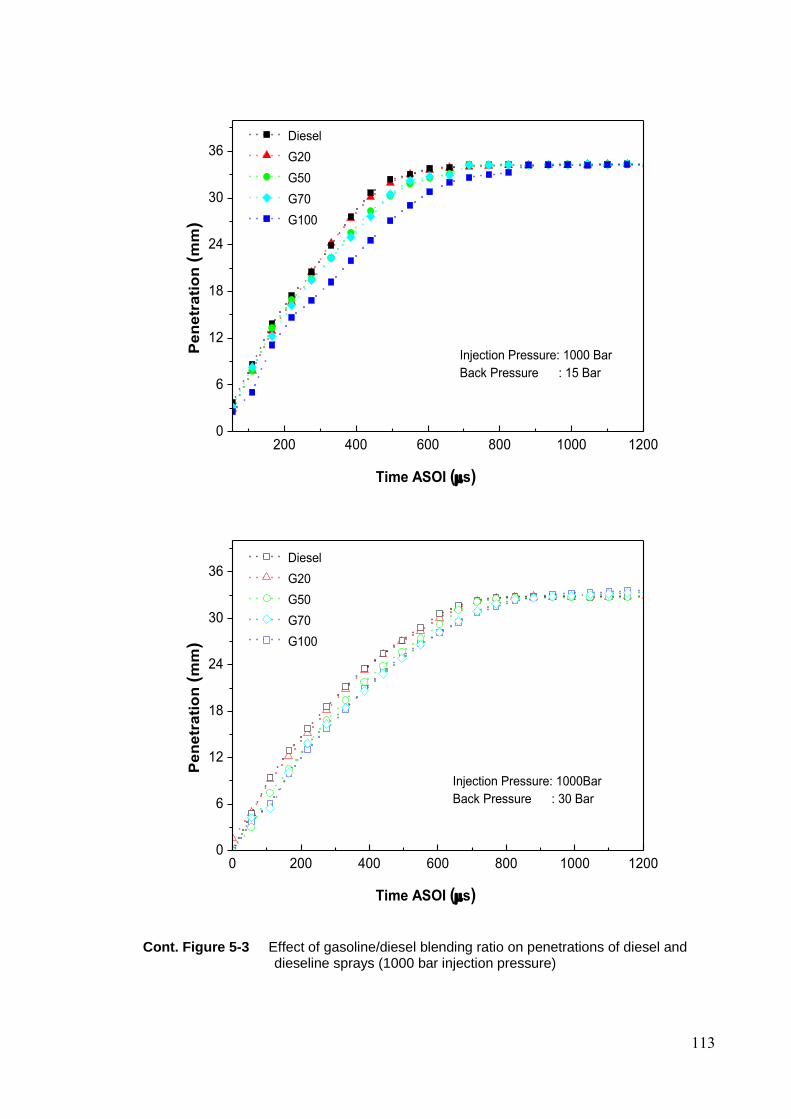
113
200 400 600 800 1000 12000
6
12
18
24
30
36 Diesel
G20
G50
G70
G100
Pe
ne
tra
tio
n (
mm
)
Time ASOI (s)
Injection Pressure: 1000 Bar
Back Pressure : 15 Bar
0 200 400 600 800 1000 12000
6
12
18
24
30
36 Diesel
G20
G50
G70
G100
Pe
ne
tra
tio
n (
mm
)
Time ASOI (s)
Injection Pressure: 1000Bar
Back Pressure : 30 Bar
Cont. Figure 5-3 Effect of gasoline/diesel blending ratio on penetrations of diesel and dieseline sprays (1000 bar injection pressure)

114
5.3.3 Penetration Comparison of Diesel and Dieseline Sprays under Different Injection
Pressures and Ambient Pressures
Figure 5-4 presents the effect of ambient pressure on penetrations of diesel, dieseline (G50),
and gasoline (G100) sprays. As discussed above, the increase of ambient pressure has little
effect on penetration length at the initial stage where the spray is dense; this may be due to the
much higher injection pressure, compared to the ambient pressure, dominating the fluid
behaviour at the dense spray region. Therefore the effect of the ambient pressure can be
neglected at this region. So the initial penetration is determined by the initial liquid velocity,
instead of the ambient conditions. After this time, the spray becomes thin and the effect of
aerodynamic force gradually increases, which means the fluid properties will be affected by
the ambient conditions increasingly beyond this time.
This can be explained by the droplet velocity being slowed down by the drag force, since there
is a higher contact probability for droplets and the surrounding gas in the diluted spray region.
There is no doubt that higher ambient pressure will result in higher ambient density and which
will in turn lead to greater drag force. So the result presented in Figure 5-4 is expected: higher
ambient pressure decreases the penetration length significantly after the initial stage. However,
compared to diesel and G50, pure gasoline (G100) experiences less influence when increasing
the ambient pressure. The most likely reason is as follows: the gasoline spray is easier to be
atomized and the atomization and breakup processes mainly occur at the dense spray region,
so the droplet of the gasoline spray will experience fewer breakups in the later stage. While the
diesel and dieseline sprays will not only experience the drag force, but also will lose kinetic
energy due to further breakups.
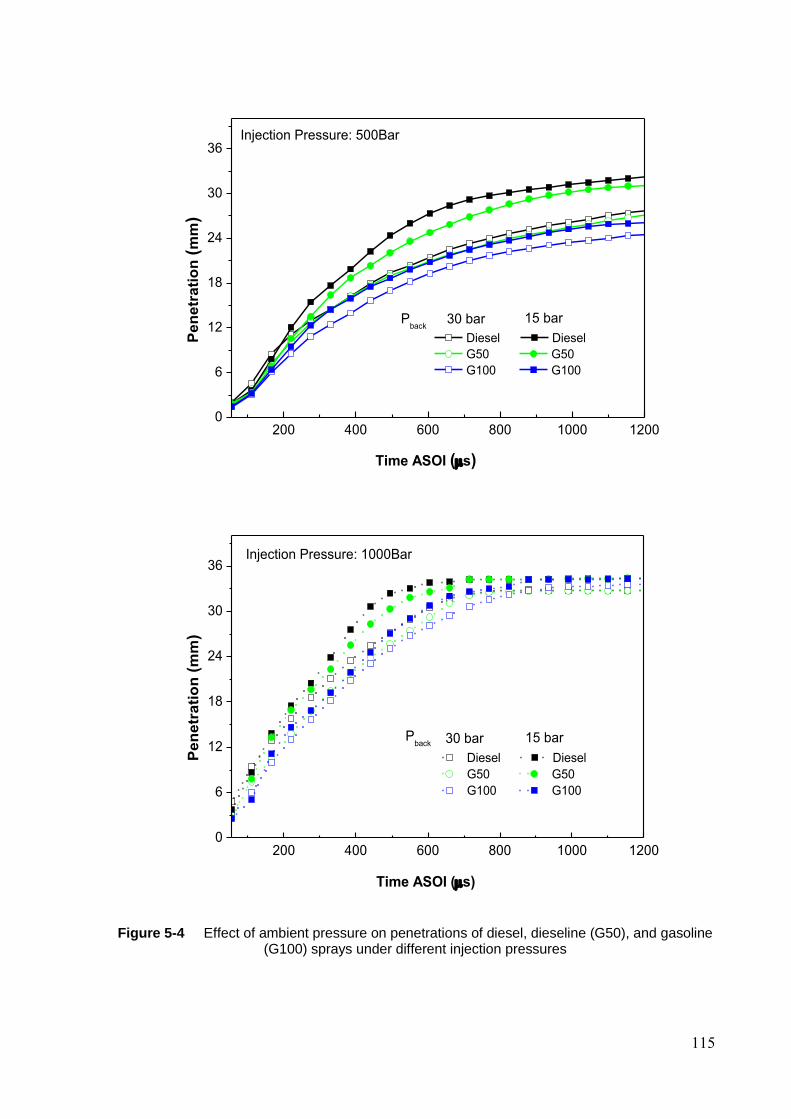
115
200 400 600 800 1000 12000
6
12
18
24
30
36
Diesel Diesel
G50 G50
G100 G100
Pe
ne
tra
tio
n (
mm
)
Time ASOI (s)
Injection Pressure: 500Bar
Pback
30 bar 15 bar
200 400 600 800 1000 12000
6
12
18
24
30
36
Pe
ne
tra
tio
n (
mm
)
Time ASOI (s)
Injection Pressure: 1000Bar
Diesel Diesel
G50 G50
G100 G100
Pback 30 bar 15 bar
Figure 5-4 Effect of ambient pressure on penetrations of diesel, dieseline (G50), and gasoline (G100) sprays under different injection pressures
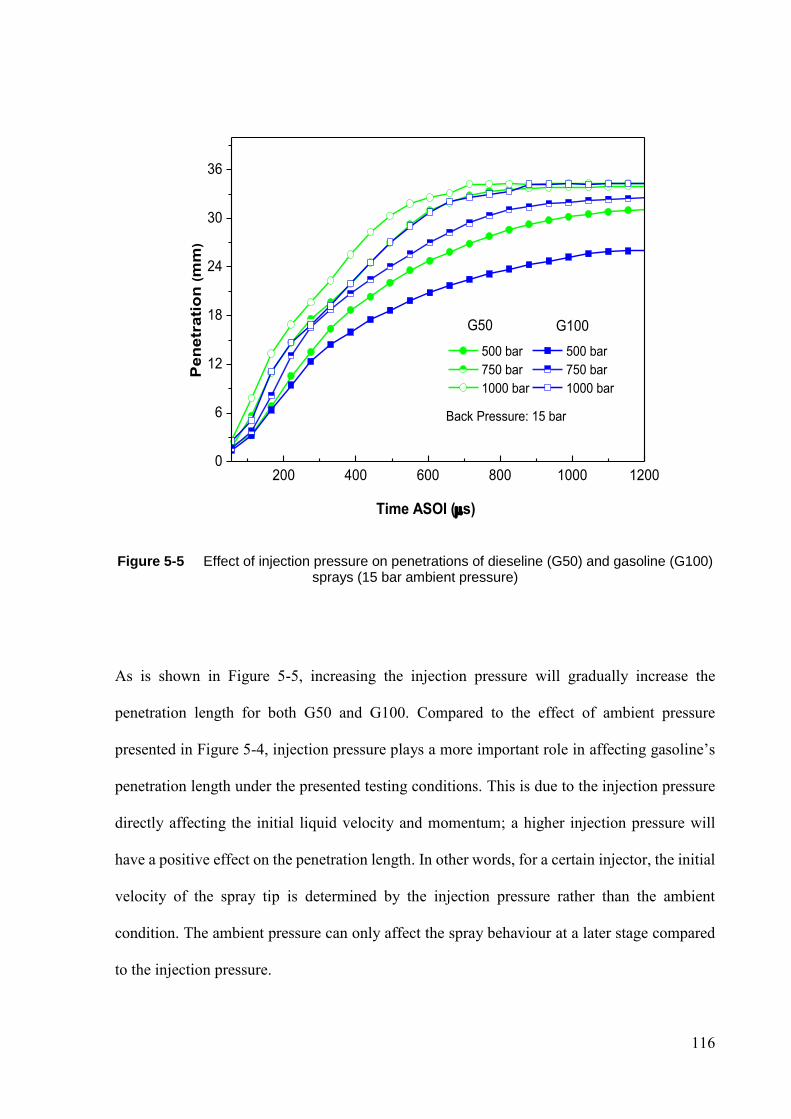
116
200 400 600 800 1000 12000
6
12
18
24
30
36
G100
500 bar 500 bar
750 bar 750 bar
1000 bar 1000 bar
Pe
ne
tra
tio
n (
mm
)
Time ASOI (s)
Back Pressure: 15 bar
G50
Figure 5-5 Effect of injection pressure on penetrations of dieseline (G50) and gasoline (G100) sprays (15 bar ambient pressure)
As is shown in Figure 5-5, increasing the injection pressure will gradually increase the
penetration length for both G50 and G100. Compared to the effect of ambient pressure
presented in Figure 5-4, injection pressure plays a more important role in affecting gasoline’s
penetration length under the presented testing conditions. This is due to the injection pressure
directly affecting the initial liquid velocity and momentum; a higher injection pressure will
have a positive effect on the penetration length. In other words, for a certain injector, the initial
velocity of the spray tip is determined by the injection pressure rather than the ambient
condition. The ambient pressure can only affect the spray behaviour at a later stage compared
to the injection pressure.

117
5.3.4 Droplet Size and Velocity Comparison of Diesel and Dieseline Sprays under
Different Gasoline/Diesel Blending Ratios
The effect of the gasoline/diesel blending ratio on the droplet mean diameter (MD) is shown in
Figure 5-6, where the test position is set at 40 mm downstream of the nozzle and the test
ambient condition is atmospheric. It can be seen from this diagram that the mean diameter
decreases gradually with the increase of the gasoline/diesel blending ratio at all injection
pressures. This result is consistent with the penetration analysis. The lower density and
viscosity of gasoline make it more favourable to enhance the atomization process and form
smaller droplets. In addition, gasoline may have stronger cavitation than diesel inside the
injector and thus better spray atomization at the injector exit. Furthermore, gasoline has a
higher vapour pressure which indicates a higher evaporation rate than diesel at a given
temperature. This will also contribute to its smaller droplet size.
0 20 40 60 80 100
8
9
10
11
12
13
14
500BAR
750BAR
1000BAR
1250BAR
Me
an
Dia
me
ter
m)
Blending Ratio (%)
Figure 5-6 Effect of gasoline/diesel blending ratio on droplet mean diameter (MD) under different injection pressures (position of 40 mm, 1 bar ambient pressure)
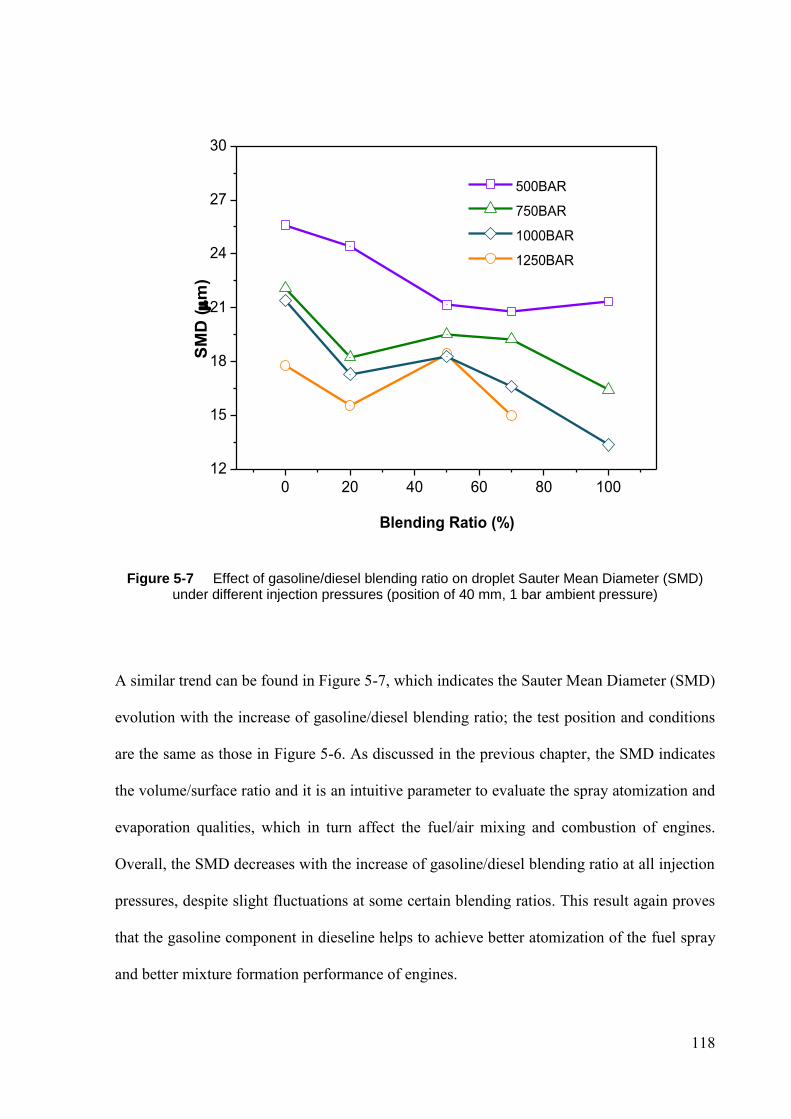
118
0 20 40 60 80 100
12
15
18
21
24
27
30
500BAR
750BAR
1000BAR
1250BAR
SM
D (m
)
Blending Ratio (%)
Figure 5-7 Effect of gasoline/diesel blending ratio on droplet Sauter Mean Diameter (SMD) under different injection pressures (position of 40 mm, 1 bar ambient pressure)
A similar trend can be found in Figure 5-7, which indicates the Sauter Mean Diameter (SMD)
evolution with the increase of gasoline/diesel blending ratio; the test position and conditions
are the same as those in Figure 5-6. As discussed in the previous chapter, the SMD indicates
the volume/surface ratio and it is an intuitive parameter to evaluate the spray atomization and
evaporation qualities, which in turn affect the fuel/air mixing and combustion of engines.
Overall, the SMD decreases with the increase of gasoline/diesel blending ratio at all injection
pressures, despite slight fluctuations at some certain blending ratios. This result again proves
that the gasoline component in dieseline helps to achieve better atomization of the fuel spray
and better mixture formation performance of engines.
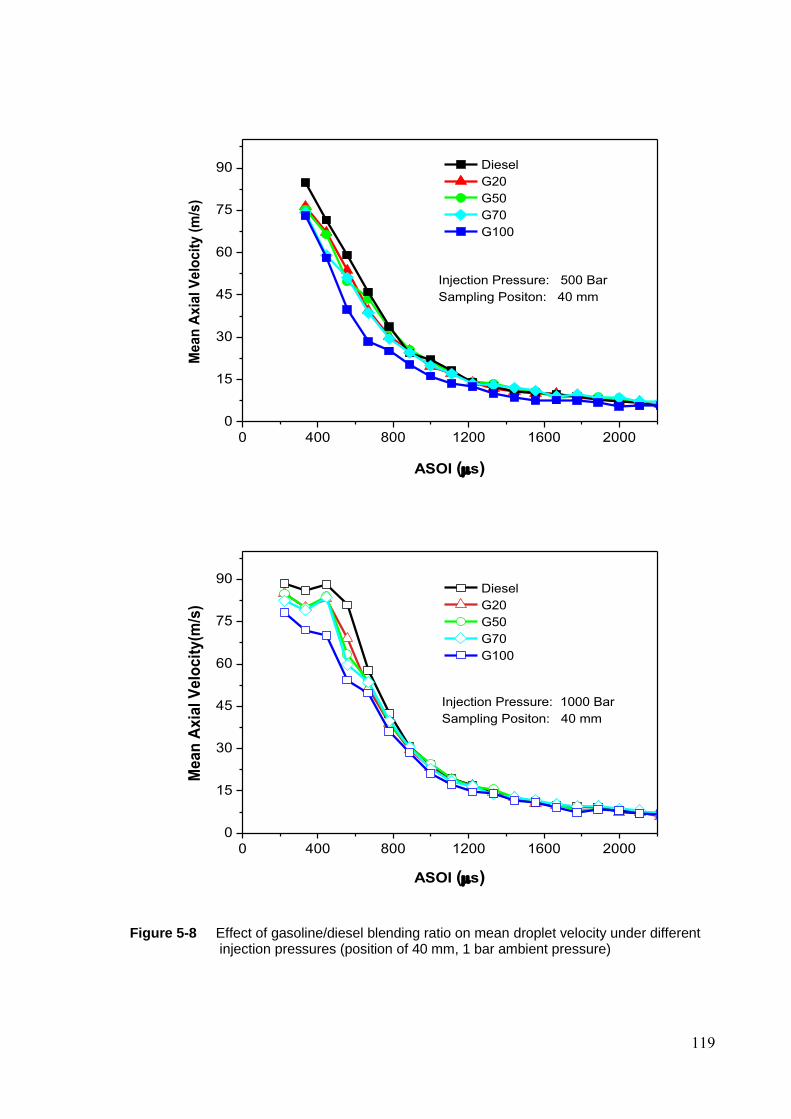
119
0 400 800 1200 1600 2000
0
15
30
45
60
75
90
Injection Pressure: 500 Bar
Sampling Positon: 40 mm
0.4
0.5
0.6
0.7
0.8
0.9
1
1.1
1.2
1.3
1.4
1.5
1.6
1.7
1.8
1.9
2
2.1
2.2
2.3
2.4
2.5
2.6
2.7
2.8
2.9
3
3.1
3.2
3.3
3.4
3.5
3.6
3.7
3.8
3.9
4
4.1
4.2
4.3
4.4
4.5
4.6
4.7
4.8
4.9
5
5.1
5.2
5.3
5.4
5.5
5.6
5.7
5.8
5.9
6
6.1
6.2
6.3
6.4
6.5
6.6
6.7
6.8
6.9
7
7.1
7.2
7.3
7.4
7.5
7.6
7.7
7.8
7.9
8
8.1
8.2
8.3
8.4
8.5
8.6
8.7
8.8
8.9
9
9.1
9.2
9.3
9.4
9.5
9.6
9.7
9.8
9.9
10
10.1
10.2
10.3
10.4
10.5
10.6
10.7
10.8
10.9
11
11.1
11.2
11.3
11.4
11.5
11.6
11.7
11.8
11.9
12
12.1
12.2
12.3
12.4
12.5
12.6
12.7
12.8
12.9
13
13.1
13.2
13.3
13.4
13.5
13.6
13.7
13.8
13.9
14
14.1
14.2
14.3
14.4
14.5
14.6
14.7
14.8
14.9
15
15.1
15.2
15.3
15.4
15.5
15.6
15.7
15.8
15.9
16
16.1
16.2
16.3
16.4
16.5
16.6
16.7
16.8
16.9
17
17.1
17.2
17.3
17.4
17.5
17.6
17.7
17.8
17.9
18
18.1
18.2
18.3
18.4
18.5
18.6
18.7
18.8
18.9
19
19.1
19.2
19.3
19.4
19.5
19.6
19.7
19.8
19.9
20
20.1
20.2
20.3
20.4
20.5
20.6
20.7
20.8
20.9
21
21.1
21.2
21.3
21.4
21.5
21.6
21.7
21.8
21.9
22
22.1
22.2
22.3
22.4
22.5
22.6
22.7
22.8
22.9
23
23.1
23.2
23.3
23.4
23.5
23.6
23.7
23.8
23.9
24
24.1
24.2
24.3
24.4
24.5
24.6
24.7
24.8
24.9
25
25.1
25.2
25.3
25.4
25.5
25.6
25.7
25.8
25.9
26
26.1
26.2
26.3
26.4
26.5
26.6
26.7
26.8
26.9
27
27.1
27.2
27.3
27.4
27.5
27.6
27.7
27.8
27.9
28
28.1
28.2
28.3
28.4
28.5
28.6
28.7
28.8
28.9
29
29.1
29.2
29.3
29.4
29.5
29.6
29.7
29.8
29.9
30
30.1
30.2
30.3
30.4
30.5
30.6
30.7
30.8
30.9
31
31.1
31.2
31.3
31.4
31.5
31.6
31.7
31.8
31.9
32
32.1
32.2
32.3
32.4
32.5
32.6
32.7
32.8
32.9
33
33.1
33.2
33.3
33.4
33.5
33.6
33.7
33.8
33.9
34
34.1
34.2
34.3
34.4
34.5
34.6
34.7
34.8
34.9
35
--
--
--
--
--
Ambinet Condition
Diesel
G20
G50
G70
G100
Me
an
Ax
ial V
elo
cit
y (
m/s
)
ASOI (s)
0 400 800 1200 1600 2000
0
15
30
45
60
75
90 Diesel
G20
G50
G70
G100
Injection Pressure: 1000 Bar
Sampling Positon: 40 mm
0.4
0.5
0.6
0.7
0.8
0.9
1
1.1
1.2
1.3
1.4
1.5
1.6
1.7
1.8
1.9
2
2.1
2.2
2.3
2.4
2.5
2.6
2.7
2.8
2.9
3
3.1
3.2
3.3
3.4
3.5
3.6
3.7
3.8
3.9
4
4.1
4.2
4.3
4.4
4.5
4.6
4.7
4.8
4.9
5
5.1
5.2
5.3
5.4
5.5
5.6
5.7
5.8
5.9
6
6.1
6.2
6.3
6.4
6.5
6.6
6.7
6.8
6.9
7
7.1
7.2
7.3
7.4
7.5
7.6
7.7
7.8
7.9
8
8.1
8.2
8.3
8.4
8.5
8.6
8.7
8.8
8.9
9
9.1
9.2
9.3
9.4
9.5
9.6
9.7
9.8
9.9
10
10.1
10.2
10.3
10.4
10.5
10.6
10.7
10.8
10.9
11
11.1
11.2
11.3
11.4
11.5
11.6
11.7
11.8
11.9
12
12.1
12.2
12.3
12.4
12.5
12.6
12.7
12.8
12.9
13
13.1
13.2
13.3
13.4
13.5
13.6
13.7
13.8
13.9
14
14.1
14.2
14.3
14.4
14.5
14.6
14.7
14.8
14.9
15
15.1
15.2
15.3
15.4
15.5
15.6
15.7
15.8
15.9
16
16.1
16.2
16.3
16.4
16.5
16.6
16.7
16.8
16.9
17
17.1
17.2
17.3
17.4
17.5
17.6
17.7
17.8
17.9
18
18.1
18.2
18.3
18.4
18.5
18.6
18.7
18.8
18.9
19
19.1
19.2
19.3
19.4
19.5
19.6
19.7
19.8
19.9
20
20.1
20.2
20.3
20.4
20.5
20.6
20.7
20.8
20.9
21
21.1
21.2
21.3
21.4
21.5
21.6
21.7
21.8
21.9
22
22.1
22.2
22.3
22.4
22.5
22.6
22.7
22.8
22.9
23
23.1
23.2
23.3
23.4
23.5
23.6
23.7
23.8
23.9
24
24.1
24.2
24.3
24.4
24.5
24.6
24.7
24.8
24.9
25
25.1
25.2
25.3
25.4
25.5
25.6
25.7
25.8
25.9
26
26.1
26.2
26.3
26.4
26.5
26.6
26.7
26.8
26.9
27
27.1
27.2
27.3
27.4
27.5
27.6
27.7
27.8
27.9
28
28.1
28.2
28.3
28.4
28.5
28.6
28.7
28.8
28.9
29
29.1
29.2
29.3
29.4
29.5
29.6
29.7
29.8
29.9
30
30.1
30.2
30.3
30.4
30.5
30.6
30.7
30.8
30.9
31
31.1
31.2
31.3
31.4
31.5
31.6
31.7
31.8
31.9
32
32.1
32.2
32.3
32.4
32.5
32.6
32.7
32.8
32.9
33
33.1
33.2
33.3
33.4
33.5
33.6
33.7
33.8
33.9
34
34.1
34.2
34.3
34.4
34.5
34.6
34.7
34.8
34.9
35
--
--
--
--
--
Ambinet Condition
Me
an
Ax
ial
Ve
locit
y(m
/s)
ASOI (s)
Figure 5-8 Effect of gasoline/diesel blending ratio on mean droplet velocity under different injection pressures (position of 40 mm, 1 bar ambient pressure)
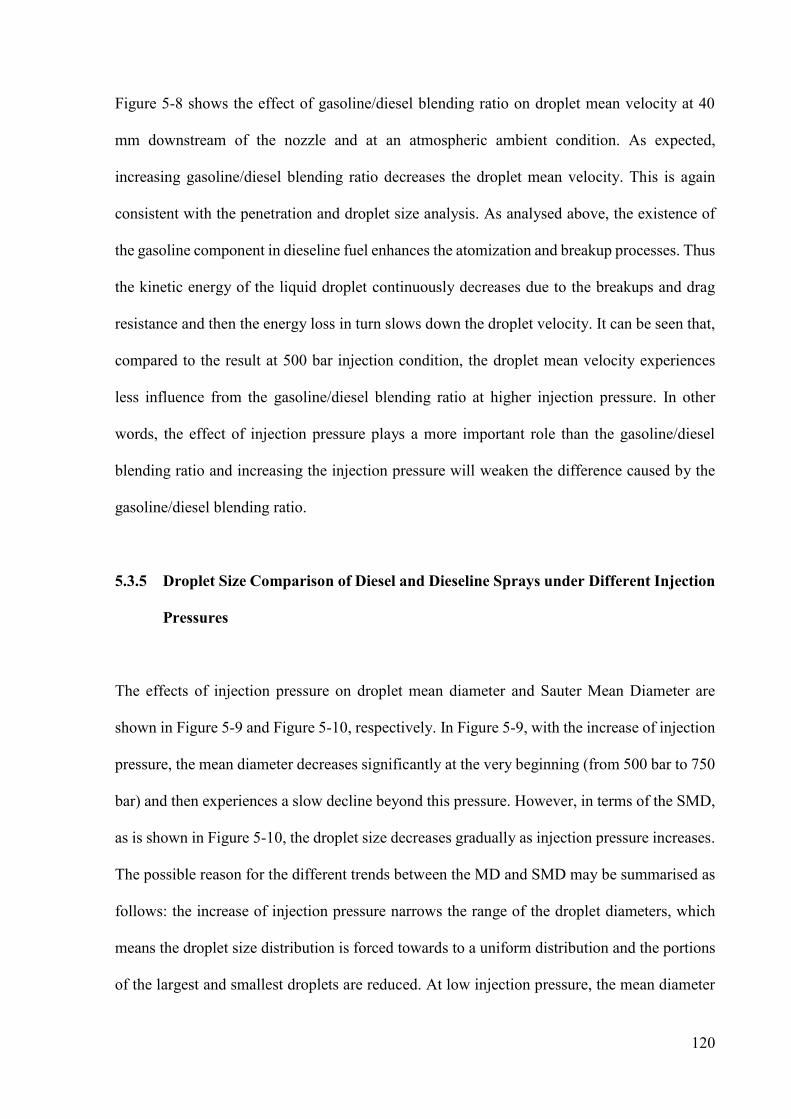
120
Figure 5-8 shows the effect of gasoline/diesel blending ratio on droplet mean velocity at 40
mm downstream of the nozzle and at an atmospheric ambient condition. As expected,
increasing gasoline/diesel blending ratio decreases the droplet mean velocity. This is again
consistent with the penetration and droplet size analysis. As analysed above, the existence of
the gasoline component in dieseline fuel enhances the atomization and breakup processes. Thus
the kinetic energy of the liquid droplet continuously decreases due to the breakups and drag
resistance and then the energy loss in turn slows down the droplet velocity. It can be seen that,
compared to the result at 500 bar injection condition, the droplet mean velocity experiences
less influence from the gasoline/diesel blending ratio at higher injection pressure. In other
words, the effect of injection pressure plays a more important role than the gasoline/diesel
blending ratio and increasing the injection pressure will weaken the difference caused by the
gasoline/diesel blending ratio.
5.3.5 Droplet Size Comparison of Diesel and Dieseline Sprays under Different Injection
Pressures
The effects of injection pressure on droplet mean diameter and Sauter Mean Diameter are
shown in Figure 5-9 and Figure 5-10, respectively. In Figure 5-9, with the increase of injection
pressure, the mean diameter decreases significantly at the very beginning (from 500 bar to 750
bar) and then experiences a slow decline beyond this pressure. However, in terms of the SMD,
as is shown in Figure 5-10, the droplet size decreases gradually as injection pressure increases.
The possible reason for the different trends between the MD and SMD may be summarised as
follows: the increase of injection pressure narrows the range of the droplet diameters, which
means the droplet size distribution is forced towards to a uniform distribution and the portions
of the largest and smallest droplets are reduced. At low injection pressure, the mean diameter
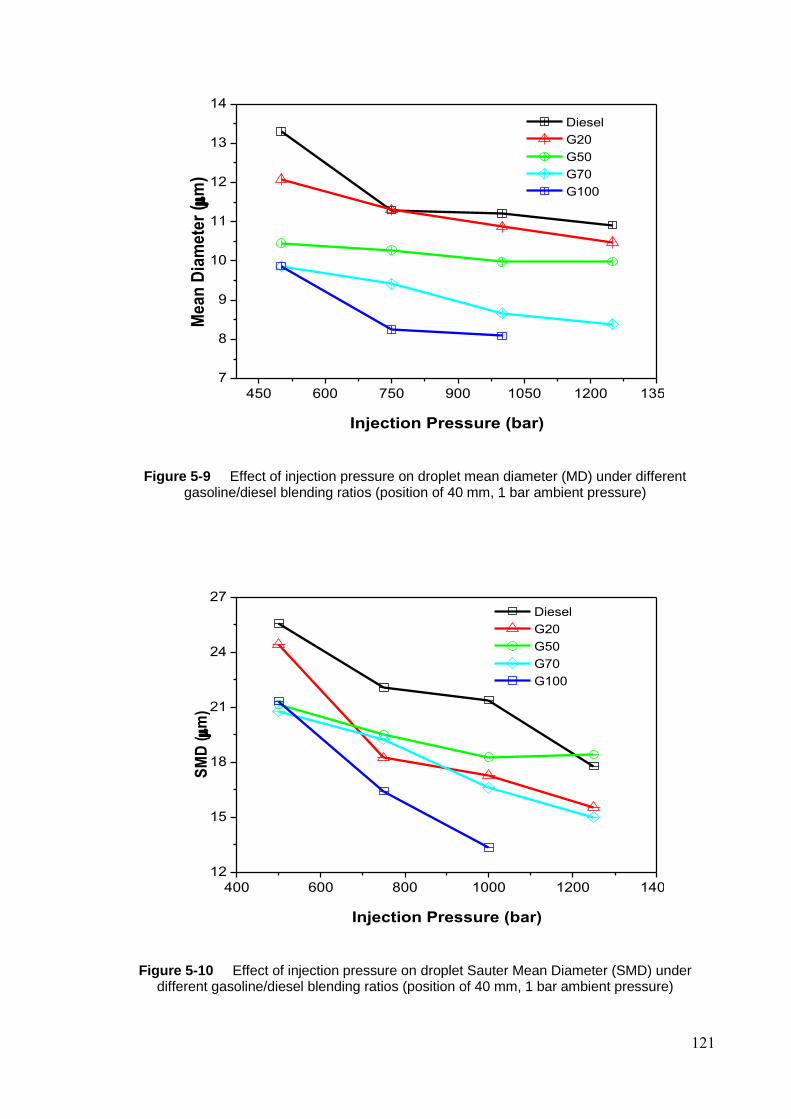
121
450 600 750 900 1050 1200 1350
7
8
9
10
11
12
13
14
Diesel
G20
G50
G70
G100
Mean
Dia
mete
r (
m)
Injection Pressure (bar)
Figure 5-9 Effect of injection pressure on droplet mean diameter (MD) under different gasoline/diesel blending ratios (position of 40 mm, 1 bar ambient pressure)
400 600 800 1000 1200 1400
12
15
18
21
24
27 Diesel
G20
G50
G70
G100
SM
D (m
)
Injection Pressure (bar)
Figure 5-10 Effect of injection pressure on droplet Sauter Mean Diameter (SMD) under different gasoline/diesel blending ratios (position of 40 mm, 1 bar ambient pressure)
122
can be affected by the individual large droplet easily; while at high injection pressure, the
droplet size distribution becomes more uniform and the mean diameter experiences less impact
from the large droplets. Thus the droplet mean diameter is more sensitive to the injection
pressure at the lower pressure range. While the SMD represents the volume/surface ratio and
will not be affected by the individual large or the small droplet as much as the MD, therefore
it is a more representative parameter to evaluate the spray atomization performance. The
increase of injection pressure is favourable for decreasing the SMD and enhances the
atomization of the spray. Another phenomenon which can be found in these two figures is that
increasing the gasoline/diesel blending ratio will also benefit the atomization of the spray,
despite the small fluctuation of G50. This is also consistent with the previous analysis of the
effect of gasoline/diesel blending ratio on the droplet size.
5.3.6 Fuel Droplet Size and Velocity Distribution
To have a holistic view of the atomization characteristics of dieseline throughout the spray
region, fuel droplet size and velocity distribution along the spray axis are investigated in this
section. Figure 5-11 and Figure 5-12 show the droplet mean diameter distribution and SMD
distribution along the spray axis of dieseline (G50), pure gasoline (G100) and pure diesel under
750 bar injection pressure and atmospheric conditions. It can be seen that, for all of the three
fuels, the droplet mean diameter for each fuel does not change much and experiences a slight
increase along the spray axis. However, the SMD distribution along the spray axis shows a
slightly different trend: it decreases significantly when the sampling position moves from 10
mm to 20 mm downstream and then does not change much beyond this distance. The reason
for this difference is as follows: the smaller droplets are slowed down by the drag force or
evaporated gradually during the transition, so some smaller droplets cannot reach a far distance.
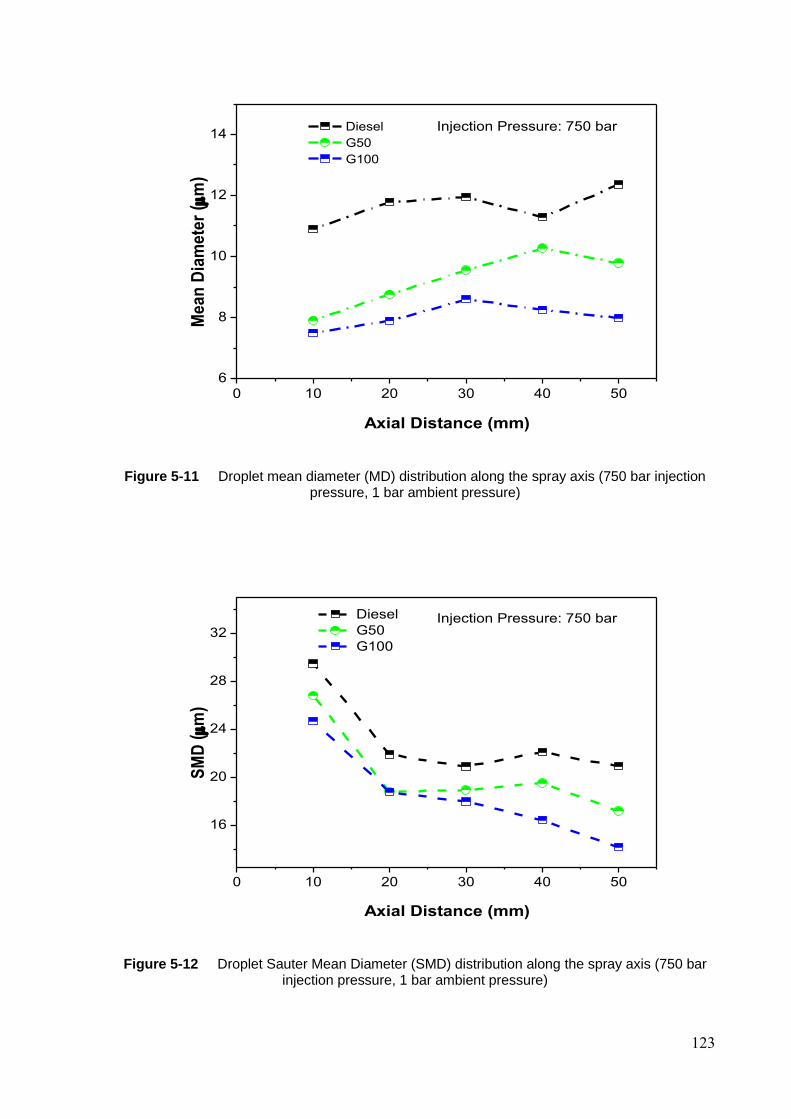
123
0 10 20 30 40 50
6
8
10
12
14 Diesel
G50
G100
Mean
Dia
mete
r (
m)
Axial Distance (mm)
Injection Pressure: 750 bar
Figure 5-11 Droplet mean diameter (MD) distribution along the spray axis (750 bar injection pressure, 1 bar ambient pressure)
0 10 20 30 40 50
16
20
24
28
32
Diesel
G50
G100
SM
D (m
)
Axial Distance (mm)
Injection Pressure: 750 bar
Figure 5-12 Droplet Sauter Mean Diameter (SMD) distribution along the spray axis (750 bar injection pressure, 1 bar ambient pressure)
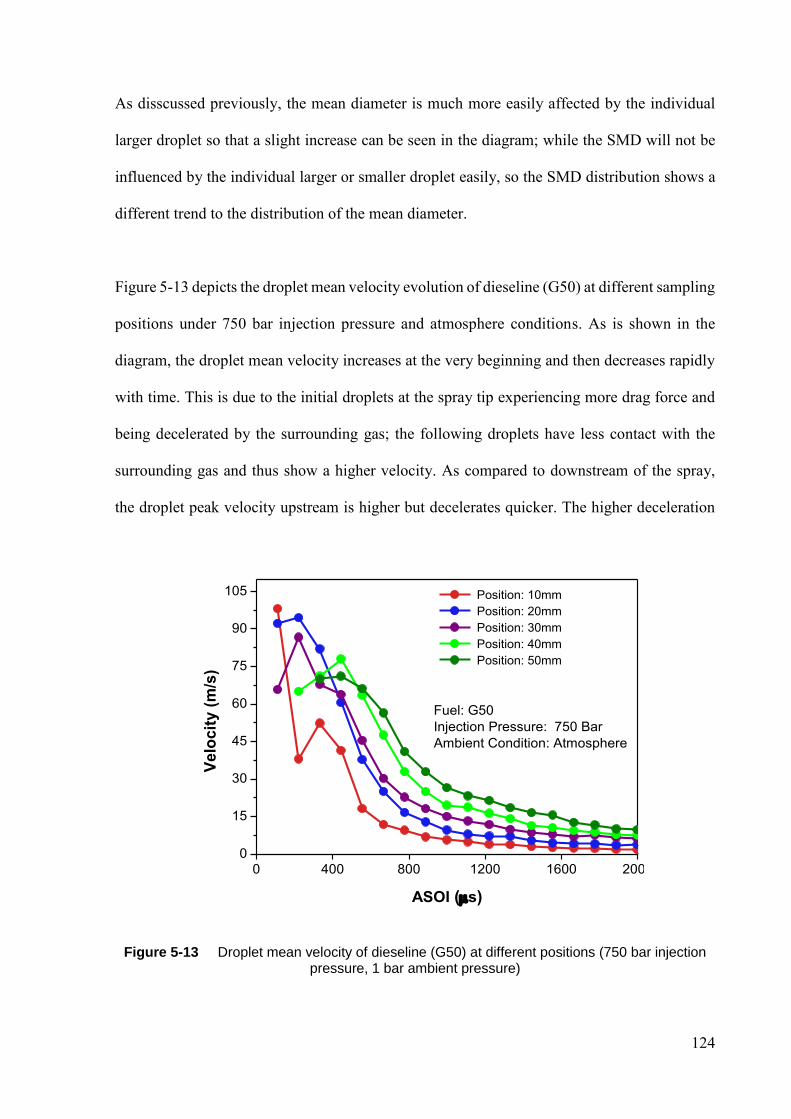
124
As disscussed previously, the mean diameter is much more easily affected by the individual
larger droplet so that a slight increase can be seen in the diagram; while the SMD will not be
influenced by the individual larger or smaller droplet easily, so the SMD distribution shows a
different trend to the distribution of the mean diameter.
Figure 5-13 depicts the droplet mean velocity evolution of dieseline (G50) at different sampling
positions under 750 bar injection pressure and atmosphere conditions. As is shown in the
diagram, the droplet mean velocity increases at the very beginning and then decreases rapidly
with time. This is due to the initial droplets at the spray tip experiencing more drag force and
being decelerated by the surrounding gas; the following droplets have less contact with the
surrounding gas and thus show a higher velocity. As compared to downstream of the spray,
the droplet peak velocity upstream is higher but decelerates quicker. The higher deceleration
0 400 800 1200 1600 2000
0
15
30
45
60
75
90
105
Fuel: G50
Injection Pressure: 750 Bar
Ambient Condition: Atmosphere
0.4
0.5
0.6
0.7
0.8
0.9
1
1.1
1.2
1.3
1.4
1.5
1.6
1.7
1.8
1.9
2
2.1
2.2
2.3
2.4
2.5
2.6
2.7
2.8
2.9
3
3.1
3.2
3.3
3.4
3.5
3.6
3.7
3.8
3.9
4
4.1
4.2
4.3
4.4
4.5
4.6
4.7
4.8
4.9
5
5.1
5.2
5.3
5.4
5.5
5.6
5.7
5.8
5.9
6
6.1
6.2
6.3
6.4
6.5
6.6
6.7
6.8
6.9
7
7.1
7.2
7.3
7.4
7.5
7.6
7.7
7.8
7.9
8
8.1
8.2
8.3
8.4
8.5
8.6
8.7
8.8
8.9
9
9.1
9.2
9.3
9.4
9.5
9.6
9.7
9.8
9.9
10
10.1
10.2
10.3
10.4
10.5
10.6
10.7
10.8
10.9
11
11.1
11.2
11.3
11.4
11.5
11.6
11.7
11.8
11.9
12
12.1
12.2
12.3
12.4
12.5
12.6
12.7
12.8
12.9
13
13.1
13.2
13.3
13.4
13.5
13.6
13.7
13.8
13.9
14
14.1
14.2
14.3
14.4
14.5
14.6
14.7
14.8
14.9
15
15.1
15.2
15.3
15.4
15.5
15.6
15.7
15.8
15.9
16
16.1
16.2
16.3
16.4
16.5
16.6
16.7
16.8
16.9
17
17.1
17.2
17.3
17.4
17.5
17.6
17.7
17.8
17.9
18
18.1
18.2
18.3
18.4
18.5
18.6
18.7
18.8
18.9
19
19.1
19.2
19.3
19.4
19.5
19.6
19.7
19.8
19.9
20
20.1
20.2
20.3
20.4
20.5
20.6
20.7
20.8
20.9
21
21.1
21.2
21.3
21.4
21.5
21.6
21.7
21.8
21.9
22
22.1
22.2
22.3
22.4
22.5
22.6
22.7
22.8
22.9
23
23.1
23.2
23.3
23.4
23.5
23.6
23.7
23.8
23.9
24
24.1
24.2
24.3
24.4
24.5
24.6
24.7
24.8
24.9
25
25.1
25.2
25.3
25.4
25.5
25.6
25.7
25.8
25.9
26
26.1
26.2
26.3
26.4
26.5
26.6
26.7
26.8
26.9
27
27.1
27.2
27.3
27.4
27.5
27.6
27.7
27.8
27.9
28
28.1
28.2
28.3
28.4
28.5
28.6
28.7
28.8
28.9
29
29.1
29.2
29.3
29.4
29.5
29.6
29.7
29.8
29.9
30
30.1
30.2
30.3
30.4
30.5
30.6
30.7
30.8
30.9
31
31.1
31.2
31.3
31.4
31.5
31.6
31.7
31.8
31.9
32
32.1
32.2
32.3
32.4
32.5
32.6
32.7
32.8
32.9
33
33.1
33.2
33.3
33.4
33.5
33.6
33.7
33.8
33.9
34
34.1
34.2
34.3
34.4
34.5
34.6
34.7
34.8
34.9
35
--
--
--
--
--
Ambinet Condition
Position: 10mm
Position: 20mm
Position: 30mm
Position: 40mm
Position: 50mm
Velo
cit
y (
m/s
)
ASOI (s)
Figure 5-13 Droplet mean velocity of dieseline (G50) at different positions (750 bar injection pressure, 1 bar ambient pressure)
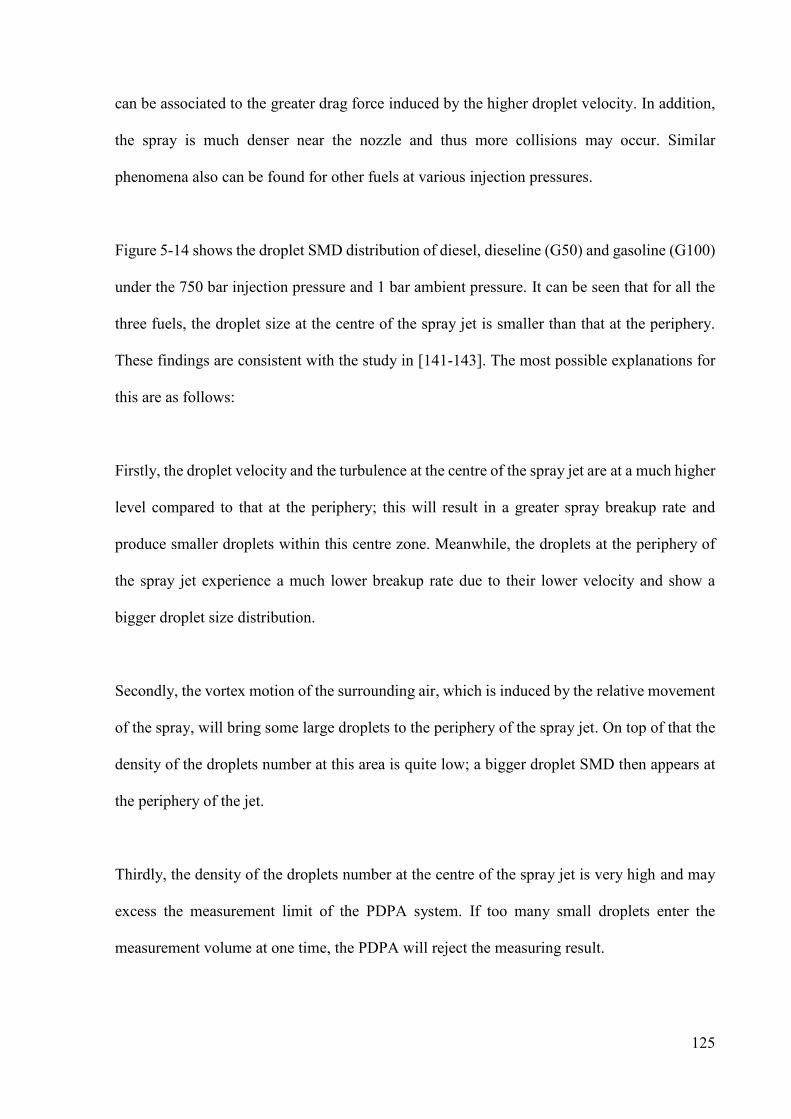
125
can be associated to the greater drag force induced by the higher droplet velocity. In addition,
the spray is much denser near the nozzle and thus more collisions may occur. Similar
phenomena also can be found for other fuels at various injection pressures.
Figure 5-14 shows the droplet SMD distribution of diesel, dieseline (G50) and gasoline (G100)
under the 750 bar injection pressure and 1 bar ambient pressure. It can be seen that for all the
three fuels, the droplet size at the centre of the spray jet is smaller than that at the periphery.
These findings are consistent with the study in [141-143]. The most possible explanations for
this are as follows:
Firstly, the droplet velocity and the turbulence at the centre of the spray jet are at a much higher
level compared to that at the periphery; this will result in a greater spray breakup rate and
produce smaller droplets within this centre zone. Meanwhile, the droplets at the periphery of
the spray jet experience a much lower breakup rate due to their lower velocity and show a
bigger droplet size distribution.
Secondly, the vortex motion of the surrounding air, which is induced by the relative movement
of the spray, will bring some large droplets to the periphery of the spray jet. On top of that the
density of the droplets number at this area is quite low; a bigger droplet SMD then appears at
the periphery of the jet.
Thirdly, the density of the droplets number at the centre of the spray jet is very high and may
excess the measurement limit of the PDPA system. If too many small droplets enter the
measurement volume at one time, the PDPA will reject the measuring result.
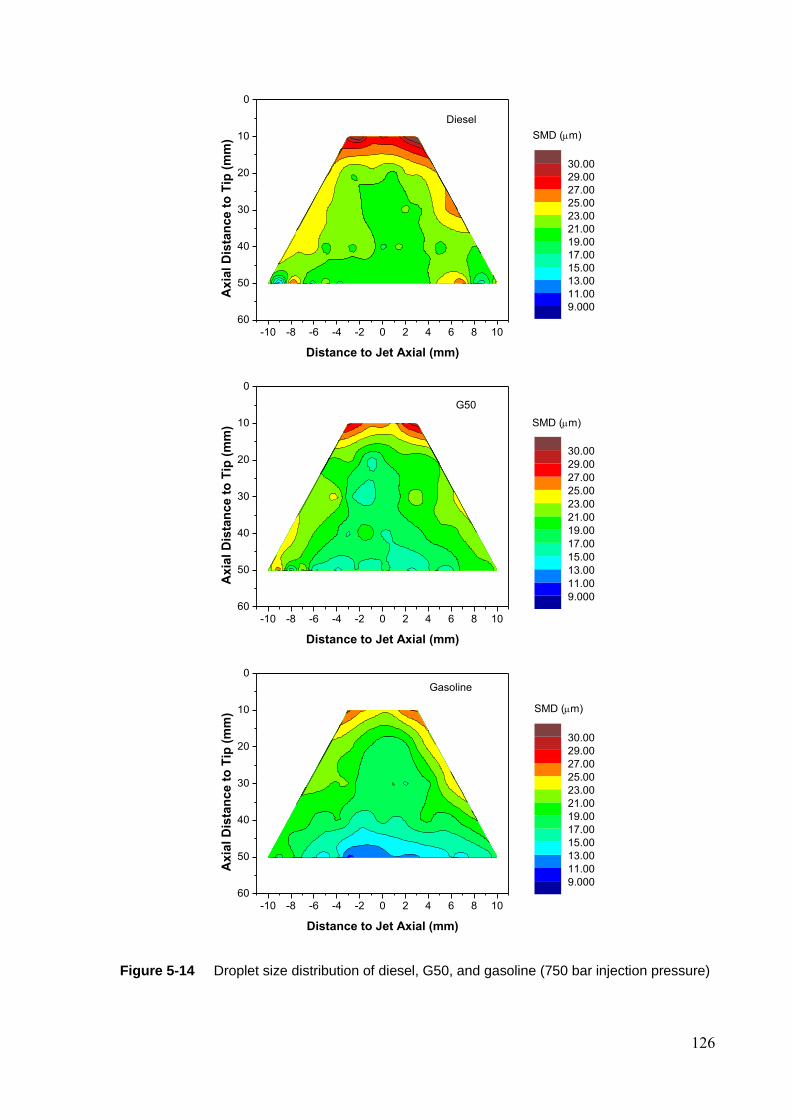
126
-10 -8 -6 -4 -2 0 2 4 6 8 10
60
50
40
30
20
10
0
SMD (m)
Axia
l D
ista
nce t
o T
ip (
mm
)
Distance to Jet Axial (mm)
9.000
11.00
13.00
15.00
17.00
19.00
21.00
23.00
25.00
27.00
29.00
30.00
Diesel
-10 -8 -6 -4 -2 0 2 4 6 8 10
60
50
40
30
20
10
0
Ax
ial
Dis
tan
ce
to
Tip
(m
m)
Distance to Jet Axial (mm)
9.000
11.00
13.00
15.00
17.00
19.00
21.00
23.00
25.00
27.00
29.00
30.00
G50
SMD (m)
-10 -8 -6 -4 -2 0 2 4 6 8 10
60
50
40
30
20
10
0
Ax
ial
Dis
tan
ce
to
Tip
(m
m)
Distance to Jet Axial (mm)
9.000
11.00
13.00
15.00
17.00
19.00
21.00
23.00
25.00
27.00
29.00
30.00
Gasoline
SMD (m)
Figure 5-14 Droplet size distribution of diesel, G50, and gasoline (750 bar injection pressure)

127
5.4 Summary
In this study, the spray characteristics of the diesel engine have been experimentally
investigated by using optical approaches such as high-speed photography and PDPA
measurement. The effects of injection pressure, ambient pressure, different fuels, including
gasoline, diesel and their blends – dieseline and the gasoline/diesel blending ratio on the spray
characteristics have been studied in detail. The conclusions drawn from the experimental
results are as below:
1. Higher ambient pressure decreases the spray penetration length due to the higher ambient
density increasing the aerodynamic drag force and enhancing the atomization and breakup
quality. As compared to diesel, the penetration length of gasoline (G100) is less sensitive
to the change of ambient pressure.
2. For all the tested fuels, higher injection pressure led to a longer penetration length and
improved the atomization and breakup performance. Higher injection pressure results in
stronger turbulence, cavitation and aerodynamic force, which helps to enhance the
atomization process. Thus the injection pressure is one of the dominating parameters in
affecting the fuel spray.
3. The gasoline/diesel blending ratio plays an important role in affecting the spray penetration
length. With the increase of the gasoline/diesel blending ratio, the penetration length
decreases gradually at low injection pressure and low ambient pressure conditions. While
at high injection pressure and high ambient pressure, this trend becomes less significant.
128
4. With the increase of the gasoline/diesel blending ratio, the droplet SMD decreases
significantly at all test conditions, which indicates a better atomization quality can be
achieved by increasing the proportion of gasoline in the dieseline fuel. The droplet mean
velocity can be also decreased as this ratio increases, which is consistent with the result of
the spray penetration.
129
6 CHAPTER 6 GASOLINE SPRAY MODEL
DEVELOPMENT AND VALIDATION
In this chapter, a numerical study of gasoline spray characteristics has been carried out and a
hybrid spray breakup model, named as the ‘Turbulence-Ligament-KH-RT’ (TL-KHRT) model,
was proposed based on the analysis of the turbulence and ligament evolutions. The new model
was validated with high-speed imaging and the PDPA experiments. The TL-KHRT model is
an effective supplement to the original KHRT breakup mechanism and helps to achieve
accurate CFD modelling of the fuel spray and mixture formations.
6.1 Introduction
In GDI engines, the fuel spray atomization process is known to play a key role in affecting
mixture formation, combustion efficiency and soot emissions. Therefore, a thorough
understanding of the fuel spray characteristics and atomization process is of great importance.
The spray atomization and breakup processes are typical two-phase flow phenomena which are
affected by turbulence fluctuation, vortices, cavitation effect and aerodynamic force [80, 97,
144-147]. As a combined result of these effects, the injected liquid fuel is disintegrated into
liquid segments and ligaments and then smaller droplets will be shed off from these
discontinuous liquid elements to form the atomized spray. According to the previous study in
Chapter 4, the turbulence is believed to be a most important factor in affecting the primary
breakup.
130
A series of numerical models based on these mechanisms under a Lagrangian framework have
been developed by researchers to simulate the spray atomization process in direct injection
engines. Some earlier studies [56, 60, 98, 148] do not distinguish the primary breakup and the
secondary breakup process and only adopt a single mechanism into the breakup model to
simulate the spray atomization process. However, the primary breakup process and the
secondary breakup process are dominated by different mechanisms. The former is mainly
caused by the combined effect of turbulence fluctuation, cavitation and aerodynamic force;
while the latter is mostly induced by the aerodynamic force. Obviously, it is more reasonable
to develop hybrid breakup models which could simulate the two breakup processes separately.
In the literature, Reitz et al [99] developed a widely used hybrid model which distinguished the
primary breakup and the secondary breakup processes by adopting Kelvin-Helmholtz and
Rayleigh-Taylor (KH-RT) breakup theories respectively[149]. Nevertheless, this model is still
based on the aerodynamically-induced breakup mechanism only. Huh et al [80] developed a
turbulence-induced breakup model for the primary atomization process and considered both
the turbulence effect and the aerodynamic force in their study. Som et al [104] developed the
Kelvin-Helmholtz-Aerodynamics-Cavitation-Turbulence (KH-ACT) model, which improved
the primary breakup by considering cavitation and turbulence. Li et al [150] proposed the Huh-
Gosman-KH-RT hybrid breakup model in their gasoline spray study by considering the
turbulence effect.
However, most of the above mentioned spray models are proposed for high pressure diesel
spray and only Li’s Huh-Gosman-KH-RT model is validated with the gasoline spray data. As
is generally known, the lower injection pressure, fuel properties, sac design, lower L/D aspect
ratios of the nozzle and stronger spray jet interactions make the turbulence, vortices and
cavitation of the fuel spray of the GDI engine differ from those of the diesel engine [151].
131
Therefore, more work on the investigations of the gasoline spray is required and this study
focuses on the effect of turbulence on the spray atomization process.
Studies [152-154] show that the primary breakup of a turbulent liquid jet was mainly associated
with the formation of ligaments along the liquid surface. In this study, a hybrid breakup model,
called the ‘Turbulence-Ligament-KH-RT’ (TL-KHRT) model was developed based on the
analysis of the ligament evolution. The comparison of the simulation results of the TL-KHRT
model and the KHRT model shows that the TL-KHRT model is an effective supplement to the
original KHRT breakup mechanism and helps to achieve accurate CFD modelling of the fuel
spray and mixture formations..
6.2 Gasoline Spray Model Development
6.2.1 TL-KHRT Breakup Model
As discussed in Chapter 4, the primary breakup process of the fuel spray of the DISI engine is
mainly affected by the turbulence effect and aerodynamic force, which agrees with the findings
in [150, 152]. Other studies [155-157] show that the cavitation phenomenon is also another
important factor to affect the primary breakup process; however, most of the numerical studies
on the fuel spray of the DISI engine neglect the effect of cavitation due to the uncertainty of
the injector parameters, such as the sac structure and the nozzle inlet R/D ratio and the relatively
low injection pressure compared to that of the diesel spray [150]. Therefore, it is assumed in
this work that the primary breakup process of the DISI engine spray is mainly induced by the
turbulence and aerodynamic force.
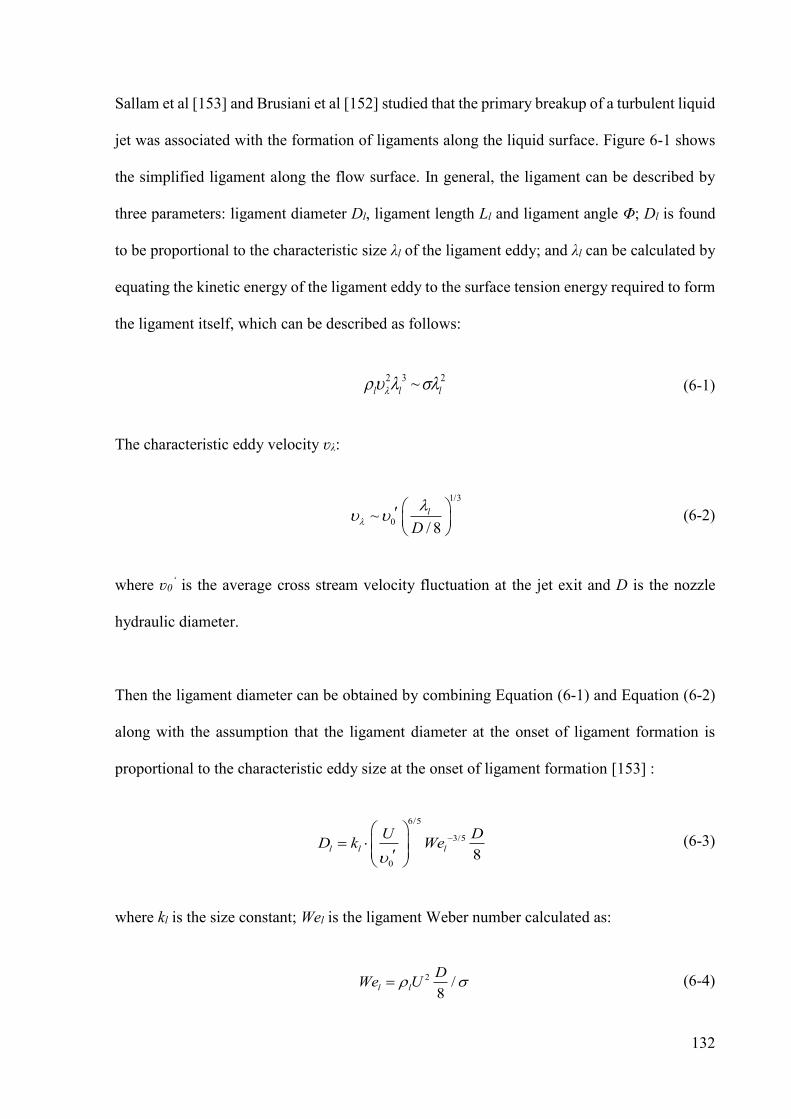
132
Sallam et al [153] and Brusiani et al [152] studied that the primary breakup of a turbulent liquid
jet was associated with the formation of ligaments along the liquid surface. Figure 6-1 shows
the simplified ligament along the flow surface. In general, the ligament can be described by
three parameters: ligament diameter Dl, ligament length Ll and ligament angle Φ; Dl is found
to be proportional to the characteristic size λl of the ligament eddy; and λl can be calculated by
equating the kinetic energy of the ligament eddy to the surface tension energy required to form
the ligament itself, which can be described as follows:
2 3 2~l l l (6-1)
The characteristic eddy velocity ʋλ:
1/3
0~/ 8
l
D
(6-2)
where ʋ0‘ is the average cross stream velocity fluctuation at the jet exit and D is the nozzle
hydraulic diameter.
Then the ligament diameter can be obtained by combining Equation (6-1) and Equation (6-2)
along with the assumption that the ligament diameter at the onset of ligament formation is
proportional to the characteristic eddy size at the onset of ligament formation [153] :
6/5
3/5
08
l l l
U DD k We
(6-3)
where kl is the size constant; Wel is the ligament Weber number calculated as:
2 /8
l l
DWe U (6-4)
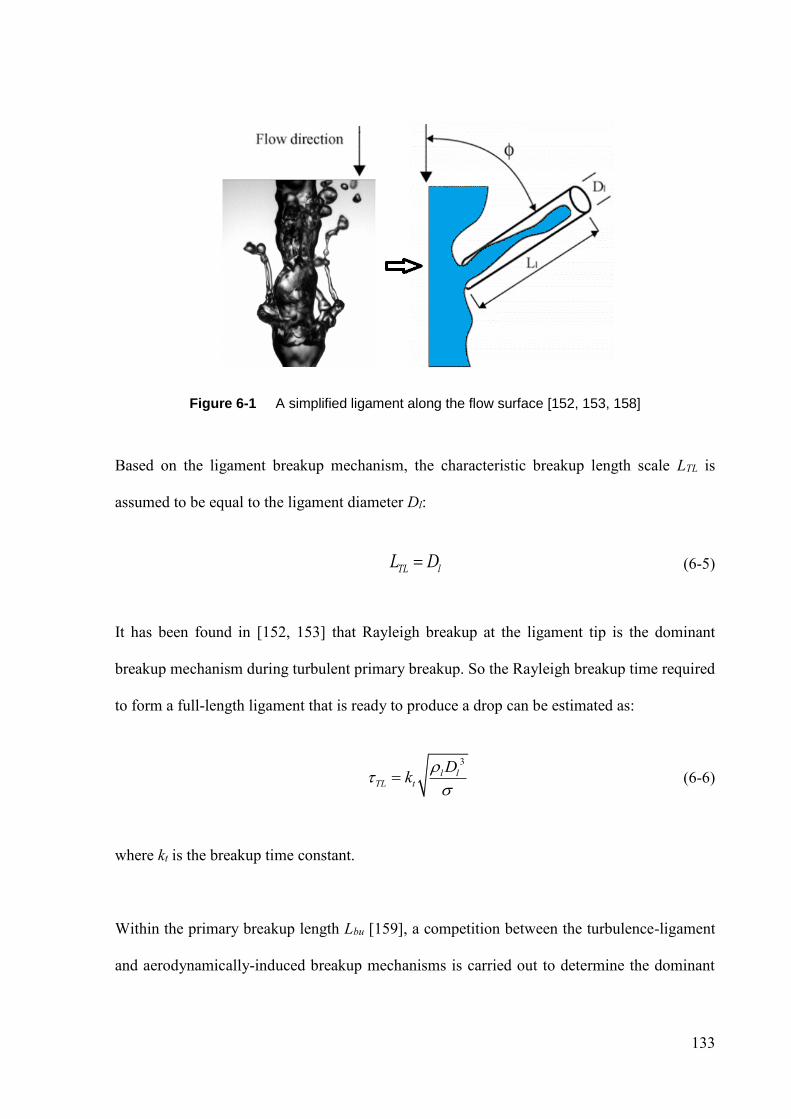
133
Figure 6-1 A simplified ligament along the flow surface [152, 153, 158]
Based on the ligament breakup mechanism, the characteristic breakup length scale LTL is
assumed to be equal to the ligament diameter Dl:
TL lL D (6-5)
It has been found in [152, 153] that Rayleigh breakup at the ligament tip is the dominant
breakup mechanism during turbulent primary breakup. So the Rayleigh breakup time required
to form a full-length ligament that is ready to produce a drop can be estimated as:
3
l lTL t
Dk
(6-6)
where kt is the breakup time constant.
Within the primary breakup length Lbu [159], a competition between the turbulence-ligament
and aerodynamically-induced breakup mechanisms is carried out to determine the dominant
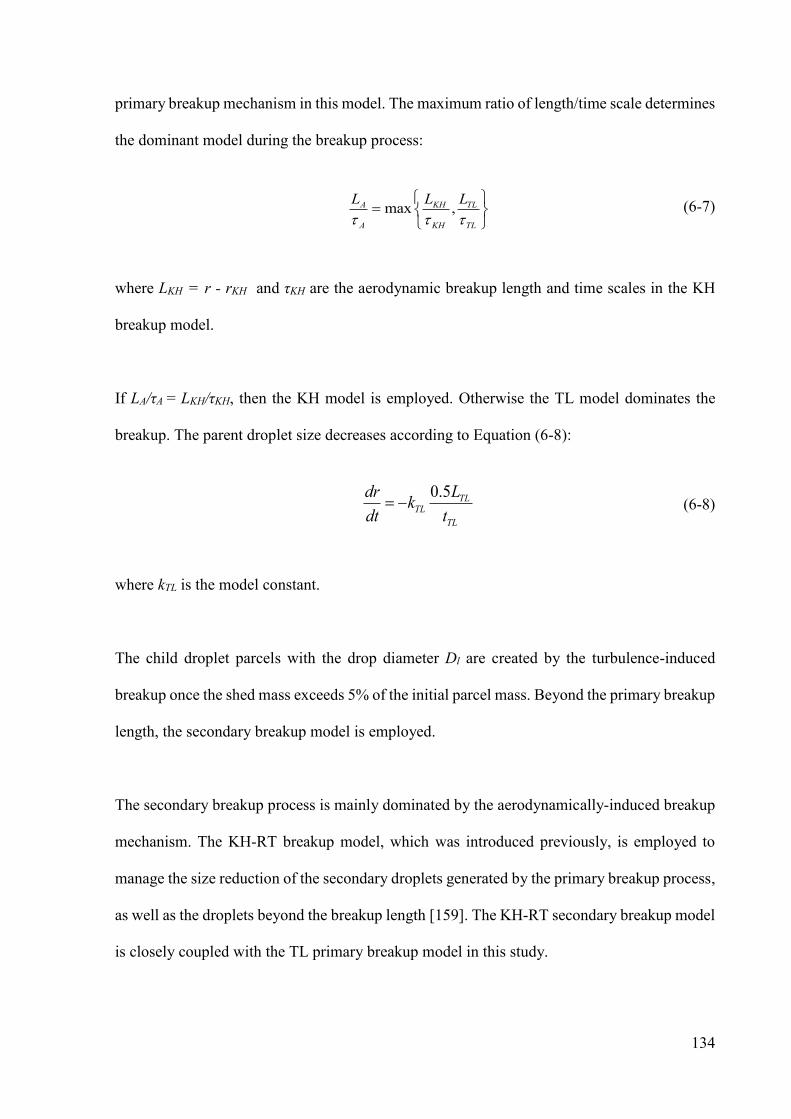
134
primary breakup mechanism in this model. The maximum ratio of length/time scale determines
the dominant model during the breakup process:
max ,A KH TL
A KH TL
L L L
(6-7)
where LKH = r - rKH and τKH are the aerodynamic breakup length and time scales in the KH
breakup model.
If LA/τA = LKH/τKH, then the KH model is employed. Otherwise the TL model dominates the
breakup. The parent droplet size decreases according to Equation (6-8):
0.5 TLTL
TL
Ldrk
dt t (6-8)
where kTL is the model constant.
The child droplet parcels with the drop diameter Dl are created by the turbulence-induced
breakup once the shed mass exceeds 5% of the initial parcel mass. Beyond the primary breakup
length, the secondary breakup model is employed.
The secondary breakup process is mainly dominated by the aerodynamically-induced breakup
mechanism. The KH-RT breakup model, which was introduced previously, is employed to
manage the size reduction of the secondary droplets generated by the primary breakup process,
as well as the droplets beyond the breakup length [159]. The KH-RT secondary breakup model
is closely coupled with the TL primary breakup model in this study.
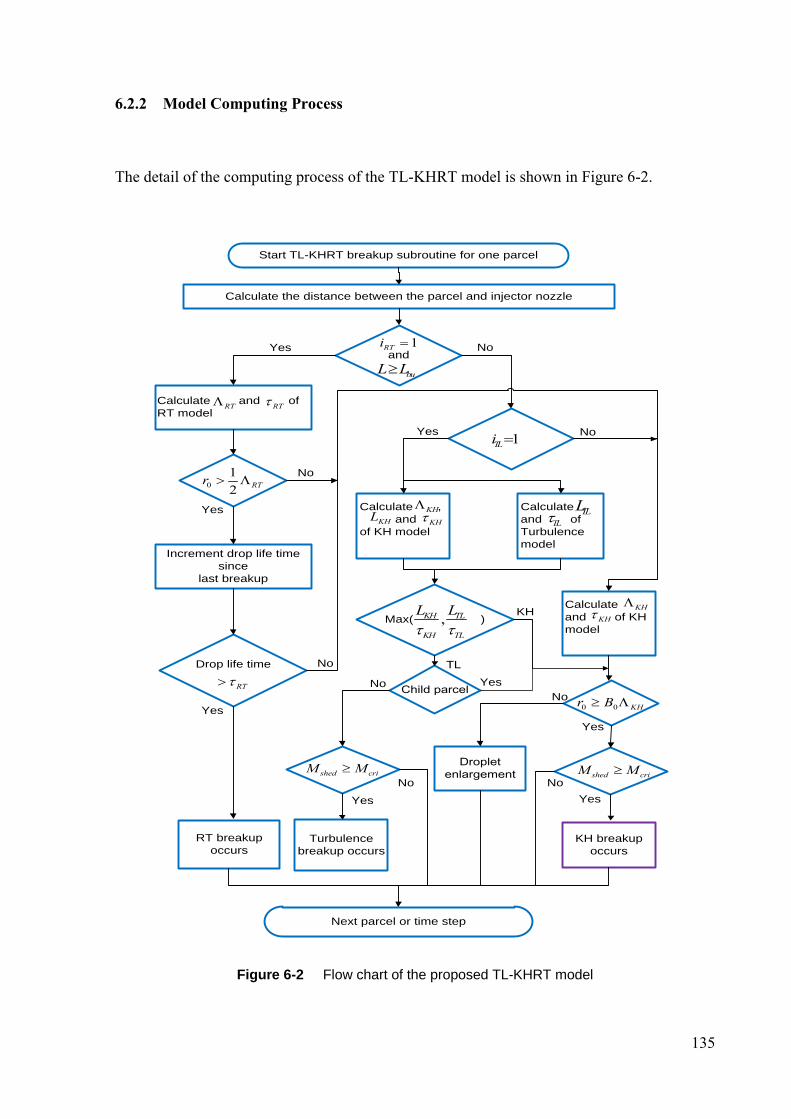
135
6.2.2 Model Computing Process
The detail of the computing process of the TL-KHRT model is shown in Figure 6-2.
Start TL-KHRT breakup subroutine for one parcel
Calculate the distance between the parcel and injector nozzle
and
buL L
Calculate and of
RT model
Yes
RT RT
1RTi
0
1
2RTr
Increment drop life time
since
last breakup
Drop life time
RT
RT breakup
occurs
Yes
Yes
Calculate ,
and
of KH model
KH
KHCalculate
and of
Turbulence
model
TLLTLKHL
Max( ),KH TL
KH TL
L L
No
No
No
1TLi Yes
Calculate
and of KH
model
KH
KH
0 0 KHr B
KH
Yes
KH breakup
occurs
Yes
Droplet
enlargement
NoChild parcel
YesNo
No
Turbulence
breakup occurs
Next parcel or time step
No
No
Yes
shed criM Mshed criM M
TL
Figure 6-2 Flow chart of the proposed TL-KHRT model
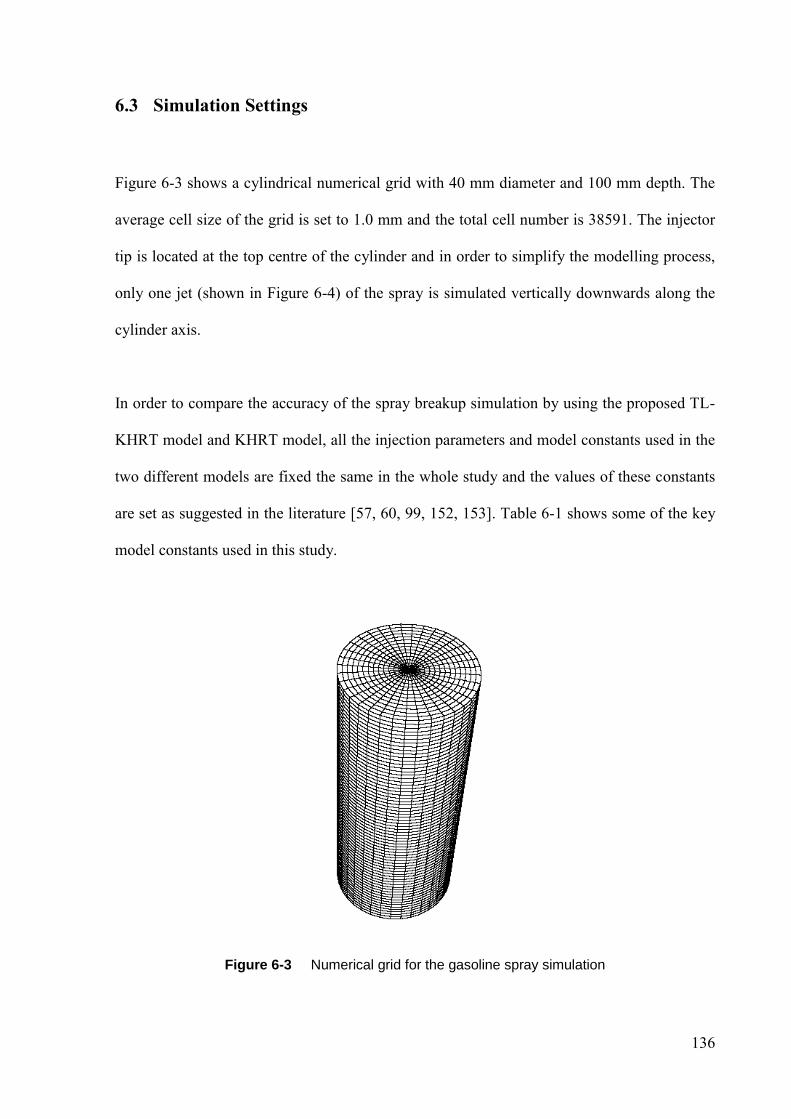
136
6.3 Simulation Settings
Figure 6-3 shows a cylindrical numerical grid with 40 mm diameter and 100 mm depth. The
average cell size of the grid is set to 1.0 mm and the total cell number is 38591. The injector
tip is located at the top centre of the cylinder and in order to simplify the modelling process,
only one jet (shown in Figure 6-4) of the spray is simulated vertically downwards along the
cylinder axis.
In order to compare the accuracy of the spray breakup simulation by using the proposed TL-
KHRT model and KHRT model, all the injection parameters and model constants used in the
two different models are fixed the same in the whole study and the values of these constants
are set as suggested in the literature [57, 60, 99, 152, 153]. Table 6-1 shows some of the key
model constants used in this study.
Figure 6-3 Numerical grid for the gasoline spray simulation
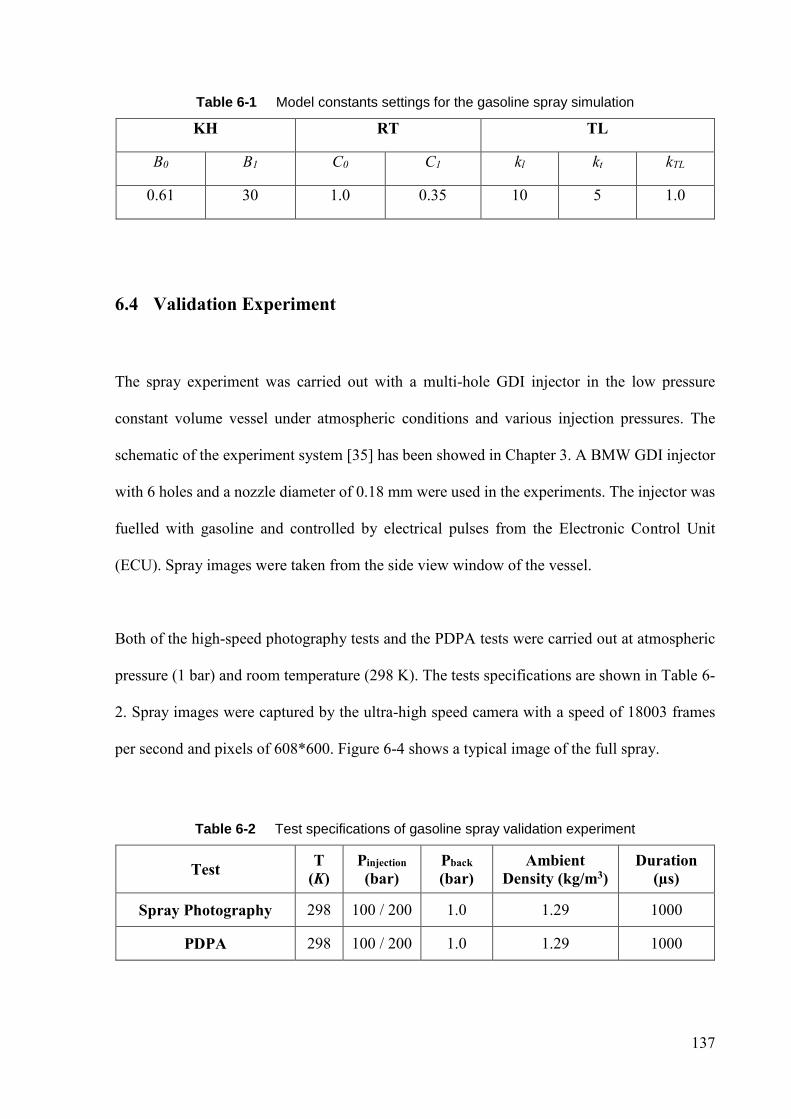
137
Table 6-1 Model constants settings for the gasoline spray simulation
KH RT TL
B0 B1 C0 C1 kl kt kTL
0.61 30 1.0 0.35 10 5 1.0
6.4 Validation Experiment
The spray experiment was carried out with a multi-hole GDI injector in the low pressure
constant volume vessel under atmospheric conditions and various injection pressures. The
schematic of the experiment system [35] has been showed in Chapter 3. A BMW GDI injector
with 6 holes and a nozzle diameter of 0.18 mm were used in the experiments. The injector was
fuelled with gasoline and controlled by electrical pulses from the Electronic Control Unit
(ECU). Spray images were taken from the side view window of the vessel.
Both of the high-speed photography tests and the PDPA tests were carried out at atmospheric
pressure (1 bar) and room temperature (298 K). The tests specifications are shown in Table 6-
2. Spray images were captured by the ultra-high speed camera with a speed of 18003 frames
per second and pixels of 608*600. Figure 6-4 shows a typical image of the full spray.
Table 6-2 Test specifications of gasoline spray validation experiment
Test T
(K)
Pinjection
(bar)
Pback
(bar)
Ambient
Density (kg/m3)
Duration
(µs)
Spray Photography 298 100 / 200 1.0 1.29 1000
PDPA 298 100 / 200 1.0 1.29 1000
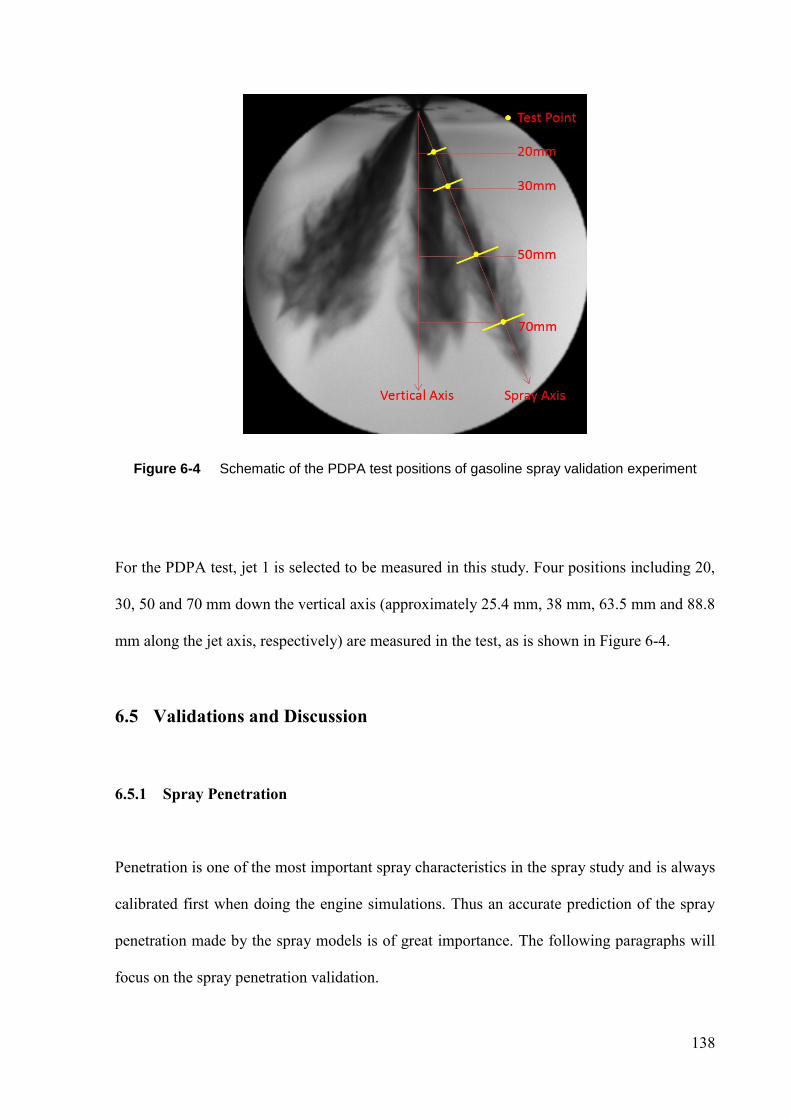
138
Figure 6-4 Schematic of the PDPA test positions of gasoline spray validation experiment
For the PDPA test, jet 1 is selected to be measured in this study. Four positions including 20,
30, 50 and 70 mm down the vertical axis (approximately 25.4 mm, 38 mm, 63.5 mm and 88.8
mm along the jet axis, respectively) are measured in the test, as is shown in Figure 6-4.
6.5 Validations and Discussion
6.5.1 Spray Penetration
Penetration is one of the most important spray characteristics in the spray study and is always
calibrated first when doing the engine simulations. Thus an accurate prediction of the spray
penetration made by the spray models is of great importance. The following paragraphs will
focus on the spray penetration validation.
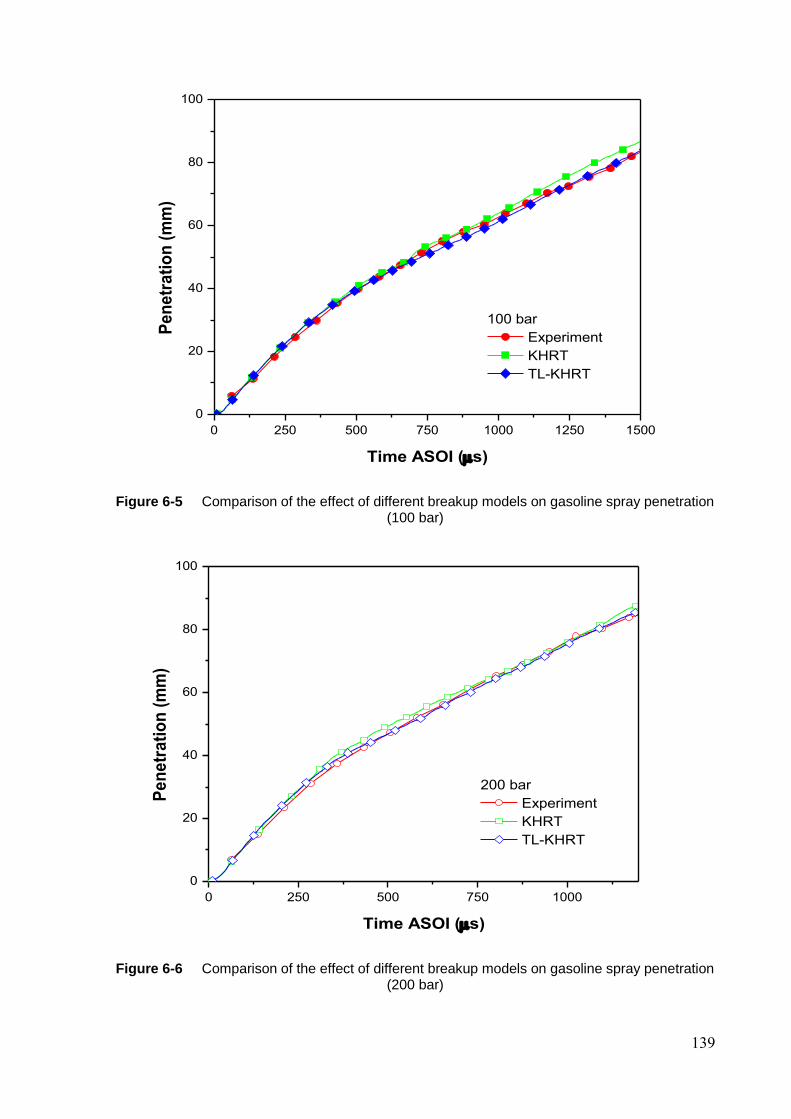
139
0 250 500 750 1000 1250 1500
0
20
40
60
80
100
Pe
ne
tra
tio
n (
mm
)
Time ASOI (s)
100 bar
Experiment
KHRT
TL-KHRT
Figure 6-5 Comparison of the effect of different breakup models on gasoline spray penetration (100 bar)
0 250 500 750 1000
0
20
40
60
80
100
Pe
ne
tra
tio
n (
mm
)
Time ASOI (s)
200 bar
Experiment
KHRT
TL-KHRT
Figure 6-6 Comparison of the effect of different breakup models on gasoline spray penetration (200 bar)
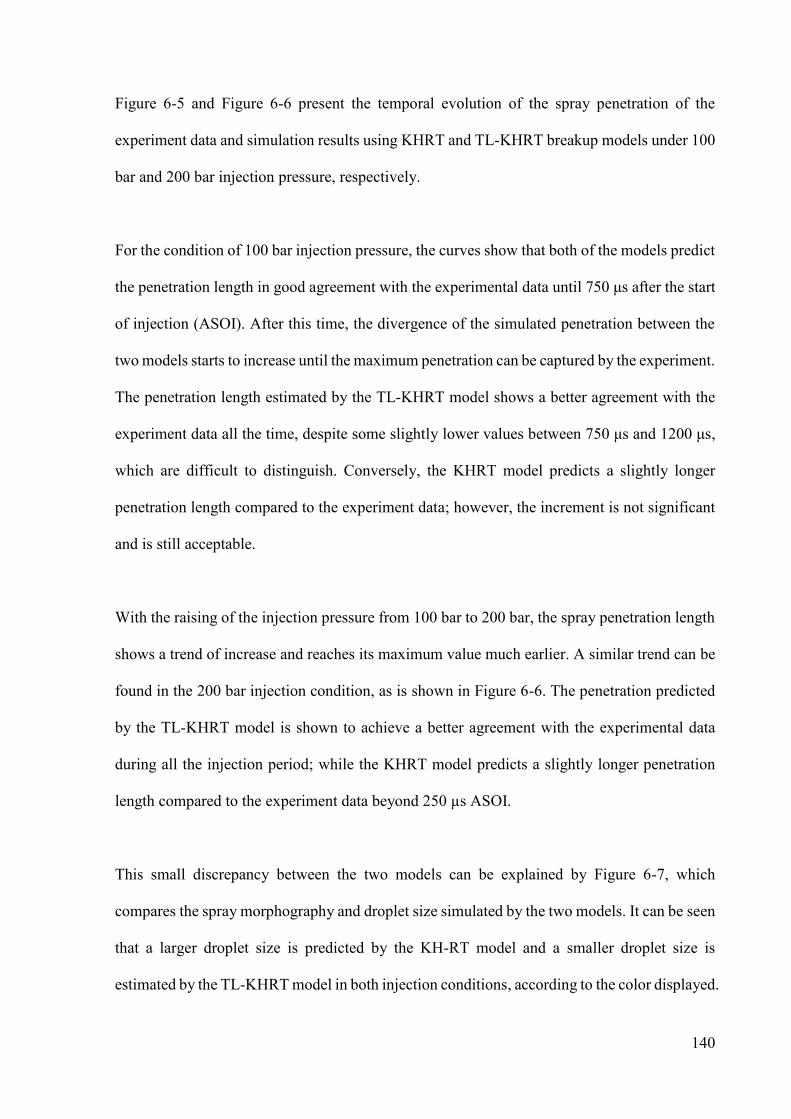
140
Figure 6-5 and Figure 6-6 present the temporal evolution of the spray penetration of the
experiment data and simulation results using KHRT and TL-KHRT breakup models under 100
bar and 200 bar injection pressure, respectively.
For the condition of 100 bar injection pressure, the curves show that both of the models predict
the penetration length in good agreement with the experimental data until 750 μs after the start
of injection (ASOI). After this time, the divergence of the simulated penetration between the
two models starts to increase until the maximum penetration can be captured by the experiment.
The penetration length estimated by the TL-KHRT model shows a better agreement with the
experiment data all the time, despite some slightly lower values between 750 μs and 1200 μs,
which are difficult to distinguish. Conversely, the KHRT model predicts a slightly longer
penetration length compared to the experiment data; however, the increment is not significant
and is still acceptable.
With the raising of the injection pressure from 100 bar to 200 bar, the spray penetration length
shows a trend of increase and reaches its maximum value much earlier. A similar trend can be
found in the 200 bar injection condition, as is shown in Figure 6-6. The penetration predicted
by the TL-KHRT model is shown to achieve a better agreement with the experimental data
during all the injection period; while the KHRT model predicts a slightly longer penetration
length compared to the experiment data beyond 250 µs ASOI.
This small discrepancy between the two models can be explained by Figure 6-7, which
compares the spray morphography and droplet size simulated by the two models. It can be seen
that a larger droplet size is predicted by the KH-RT model and a smaller droplet size is
estimated by the TL-KHRT model in both injection conditions, according to the color displayed.

141
Figure 6-7 Comparison of the effect of different breakup models on the gasoline spray morphography (100 bar and 200 bar)
It is believed that larger droplet size indicates a slower breakup process and a higher droplet
velocity, while smaller droplet size indicates a rapid breakup process and a lower droplet
velocity; and the different droplet velocities will lead to the longer and shorter penetration
lengths, respectively.
6.5.2 Droplet Velocity
Figure 6-8 and Figure 6-9 depict the temporal evolution of the mean droplet velocity in the
axial direction at the distance of 38 mm downstream of the nozzle exit. The experiment droplet
velocity in the axial direction is calculated by combining the vertical component and the
horizontal component measured by the PDPA system.
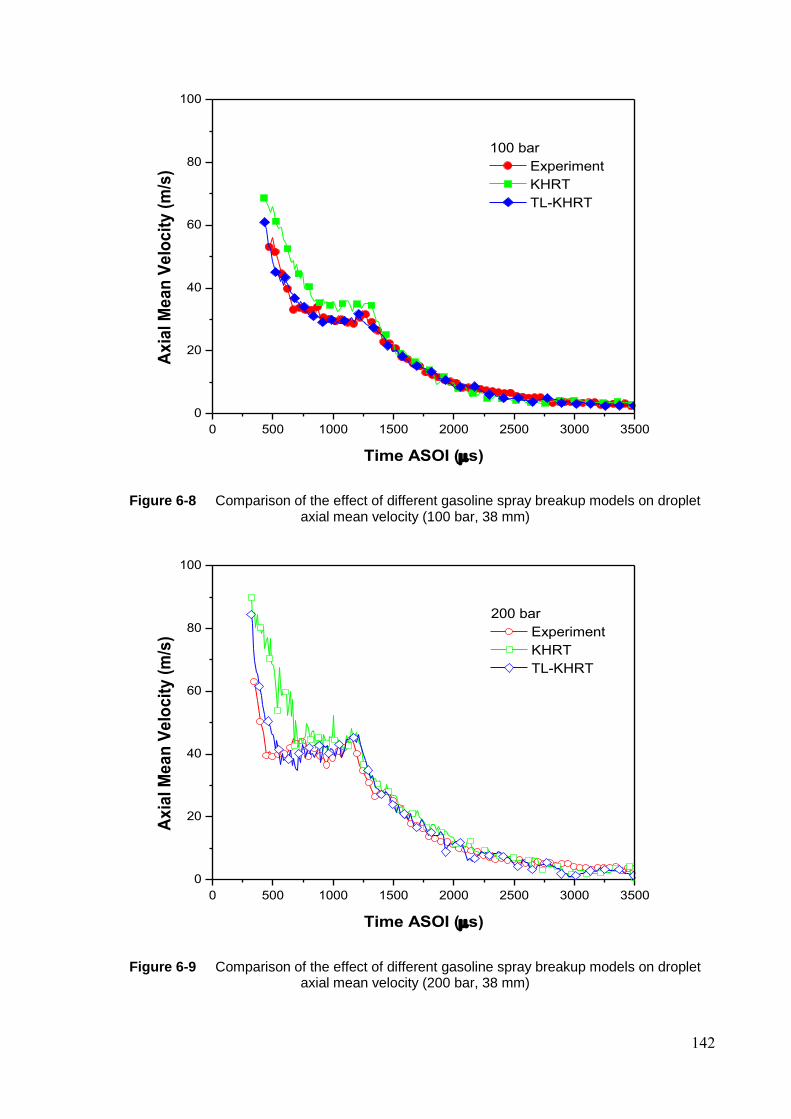
142
0 500 1000 1500 2000 2500 3000 3500
0
20
40
60
80
100
Ax
ial M
ea
n V
elo
cit
y (
m/s
)
Time ASOI (s)
100 bar
Experiment
KHRT
TL-KHRT
Figure 6-8 Comparison of the effect of different gasoline spray breakup models on droplet axial mean velocity (100 bar, 38 mm)
0 500 1000 1500 2000 2500 3000 3500
0
20
40
60
80
100
Ax
ial M
ea
n V
elo
cit
y (
m/s
)
Time ASOI (s)
200 bar
Experiment
KHRT
TL-KHRT
Figure 6-9 Comparison of the effect of different gasoline spray breakup models on droplet axial mean velocity (200 bar, 38 mm)
143
According to the literature [35, 36], the droplets need some time to arrive at the measurement
position after the start of injection, which is the so-called ‘arrival time’. After this time, the
droplets enter the test volume and the dynamic properties will be captured by the PDPA system.
As time goes on, the droplet velocity experiences a quick decrease first and is then followed
by a slight increase and a relatively stable period, which together make up the ‘spray head’. In
the spray head, the droplets in the spray front are firstly decelerated by the drag force and the
droplets behind experience relatively less drag force and show a slight increase of velocity. As
the spray head passes through the measurement point, a sudden and dramatic velocity drop is
observed and this rapid decline process is called ‘spray tail’.
The mean axial velocity predicted by the TL-KHRT and KHRT models under 100 bar and 200
bar injection pressure are compared and validated with the PDPA experiment data in Figure 6-
8 and Figure 6-9 respectively. The curves in the two figures show that higher injection pressure
leads to greater droplet velocity and shorter ‘arrival time’ in both the simulation results and the
experiment data. This indicates that either the new proposed TL-KHRT model or the original
KHRT model can capture the trend caused by different injection pressures.
However, not all of the models can predict the velocity in good agreement with the experiment
data. In Figure 6-8, it can be seen that the KHRT model over predicts the droplet velocity
through all the ‘spray head’ period and the TL-KHRT model estimates a more accurate result
despite some slight fluctuations. Similarly, the same trend can be found in Figure 6-9, under
200 bar injection condition. The droplet velocity simulated by the KHRT model is much higher
than the experiment data, especially at the very beginning of the ‘spray head’. While the result
of the TL-KHRT model is still a good match with that of the PDPA experiment.
144
This may due to the relatively slower droplet breakup in the KHRT model and the rapid breakup
in the TL-KHRT model leading to the droplet’s different kinetic energy losing. This is
consistent with the analysis in the penetration comparison, in which the higher axial velocity
leads to longer penetration length in the KHRT model and the lower axial velocity leads to
shorter penetration length in the TL-KHRT model. Obviously, the TL-KHRT model owns the
ability to control the droplet velocity properly.
6.5.3 Droplet Size
Droplet size is the characteristic of most concern in the fuel spray simulation since it will
represent the performance of the spray atomization directly. Figure 6-10 and Figure 6-11 show
the comparison of the temporal evolution of the Average Mean Diameter (AMD) between the
simulation results and the PDPA experimental data under 100 bar and 200 bar injection
pressures respectively.
As time goes on, the AMD experiences a dramatic decrease at the beginning and then decreases
slowly until the end of the ‘spray head’. It is believed that the collision and coalescence of the
droplets in the spray head lead to a larger AMD in the spray front. A similar result can be found
in [160]. To compare Figure 6-10 and Figure 6-11, it can be seen that both of the spray models
can predict the trend that the AMD decreases with the raising of the injection pressure.
Similar to the droplet velocity discussed previously, the AMD estimated by the TL-KHRT
model is in good agreement with PDPA data while the result predicted by the KHRT model is
over predicted significantly in both of the injection conditions.
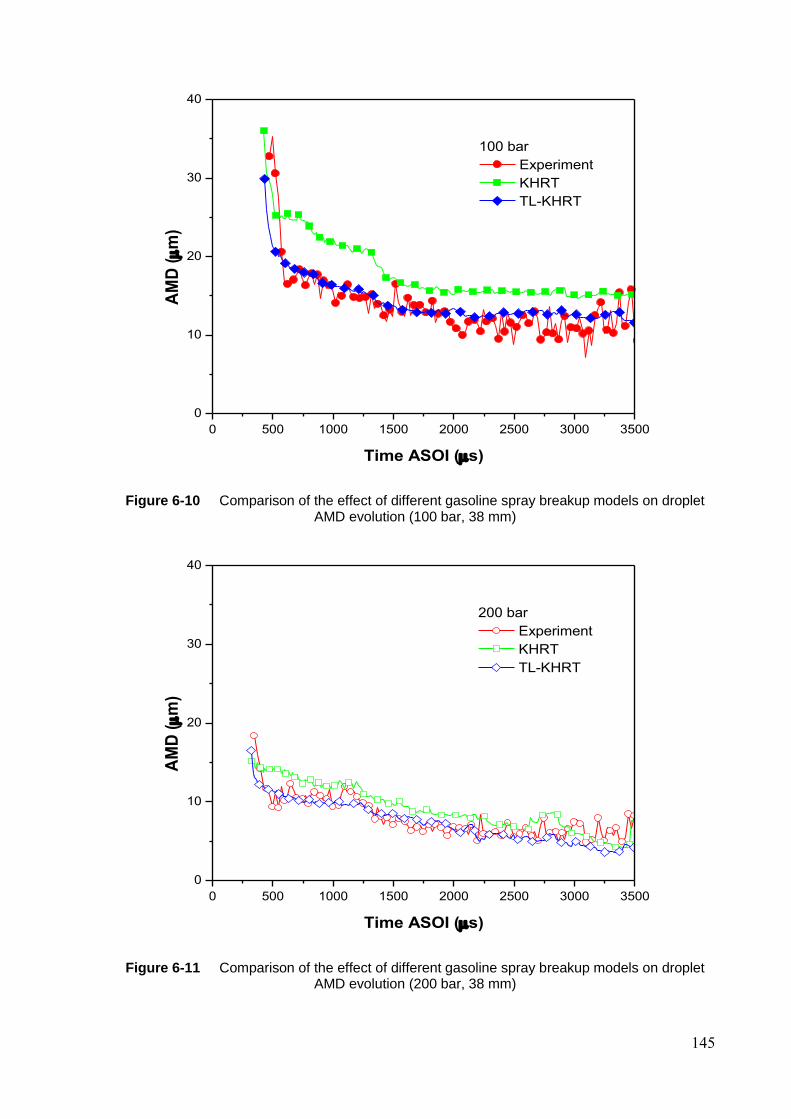
145
0 500 1000 1500 2000 2500 3000 3500
0
10
20
30
40
AM
D (m
)
Time ASOI (s)
100 bar
Experiment
KHRT
TL-KHRT
Figure 6-10 Comparison of the effect of different gasoline spray breakup models on droplet AMD evolution (100 bar, 38 mm)
0 500 1000 1500 2000 2500 3000 3500
0
10
20
30
40
AM
D (m
)
Time ASOI (s)
200 bar
Experiment
KHRT
TL-KHRT
Figure 6-11 Comparison of the effect of different gasoline spray breakup models on droplet AMD evolution (200 bar, 38 mm)

146
Figure 6-12 and Figure 6-13 present the spatial evolution of the droplet Sauter Mean Diameter
(SMD) at the distance of 20 mm, 38 mm, 60 mm and 80 mm downstream of the nozzle exit.
The simulation results are compared with the experimental data at 25.4 mm, 38 mm, 63.5 mm
and 88.8 mm along the jet axis which have been described in the previous section.
With the increasing of the axial distance from the nozzle, the SMD reduces significantly in the
first 40 mm and then keeps a relatively stable trend after this distance. It even shows a slight
increase of the SMD in the far distance. The reason for this phenomenon is that the continuous
breakups will reduce the droplet size before 40 mm; however, after this distance, the total
number of the breakups will be significantly reduced due to the lower droplet velocity. At a far
distance, the evaporation of the smaller droplets will result in an increase of the SMD. This
agrees with the findings in [161]. Compared to Figure 6-12, Figure 6-13 indicates a smaller
SMD value due to its higher injection pressure. This is as expected since higher injection
pressure will enhance the breakup process.
Again, the SMD estimated by the TL-KHRT model is in good agreement with PDPA data;
while the result predicted by the KHRT model over predicted for both injection conditions.
This result is consistent with the spray penetration analysis and droplet velocity analysis again.
There are two possible reasons which lead to a better simulation result by the proposed TL-
KHRT model. The first is attributed to the turbulence phenomenon inside the liquid enhancing
the atomization process and inducing a faster breakup rate of the big droplets. The second is
the child droplet size predicted by the new model based on the ligament analysis being closer
to the actual value in the spray. The combination of the results will lead to the lower and more
accurate SMD prediction of the new model.
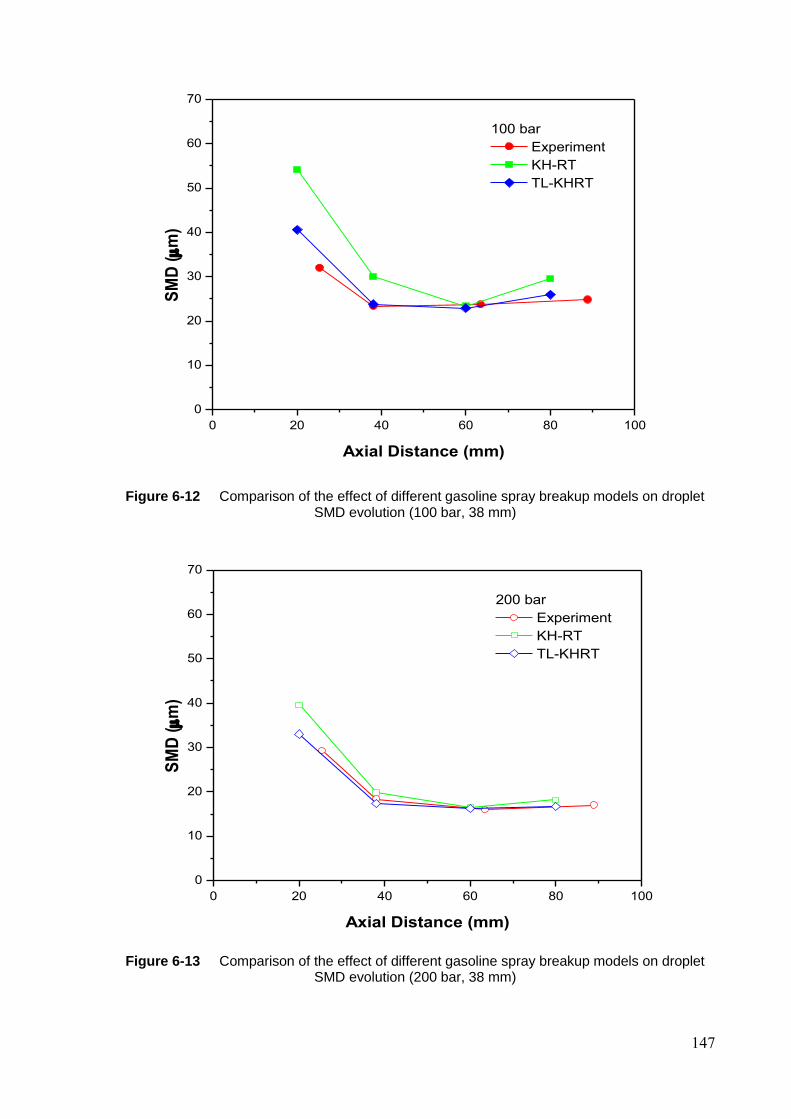
147
0 20 40 60 80 100
0
10
20
30
40
50
60
70
SM
D (m
)
Axial Distance (mm)
100 bar
Experiment
KH-RT
TL-KHRT
Figure 6-12 Comparison of the effect of different gasoline spray breakup models on droplet SMD evolution (100 bar, 38 mm)
0 20 40 60 80 100
0
10
20
30
40
50
60
70
SM
D (m
)
Axial Distance (mm)
200 bar
Experiment
KH-RT
TL-KHRT
Figure 6-13 Comparison of the effect of different gasoline spray breakup models on droplet SMD evolution (200 bar, 38 mm)
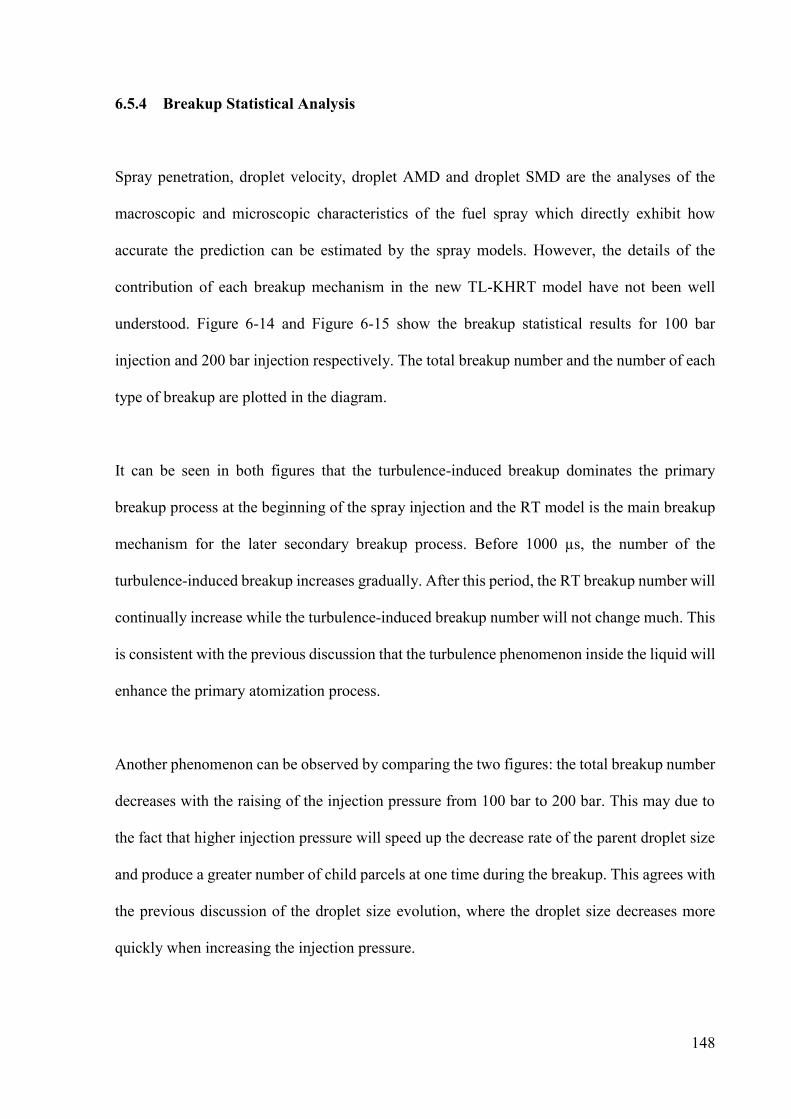
148
6.5.4 Breakup Statistical Analysis
Spray penetration, droplet velocity, droplet AMD and droplet SMD are the analyses of the
macroscopic and microscopic characteristics of the fuel spray which directly exhibit how
accurate the prediction can be estimated by the spray models. However, the details of the
contribution of each breakup mechanism in the new TL-KHRT model have not been well
understood. Figure 6-14 and Figure 6-15 show the breakup statistical results for 100 bar
injection and 200 bar injection respectively. The total breakup number and the number of each
type of breakup are plotted in the diagram.
It can be seen in both figures that the turbulence-induced breakup dominates the primary
breakup process at the beginning of the spray injection and the RT model is the main breakup
mechanism for the later secondary breakup process. Before 1000 µs, the number of the
turbulence-induced breakup increases gradually. After this period, the RT breakup number will
continually increase while the turbulence-induced breakup number will not change much. This
is consistent with the previous discussion that the turbulence phenomenon inside the liquid will
enhance the primary atomization process.
Another phenomenon can be observed by comparing the two figures: the total breakup number
decreases with the raising of the injection pressure from 100 bar to 200 bar. This may due to
the fact that higher injection pressure will speed up the decrease rate of the parent droplet size
and produce a greater number of child parcels at one time during the breakup. This agrees with
the previous discussion of the droplet size evolution, where the droplet size decreases more
quickly when increasing the injection pressure.
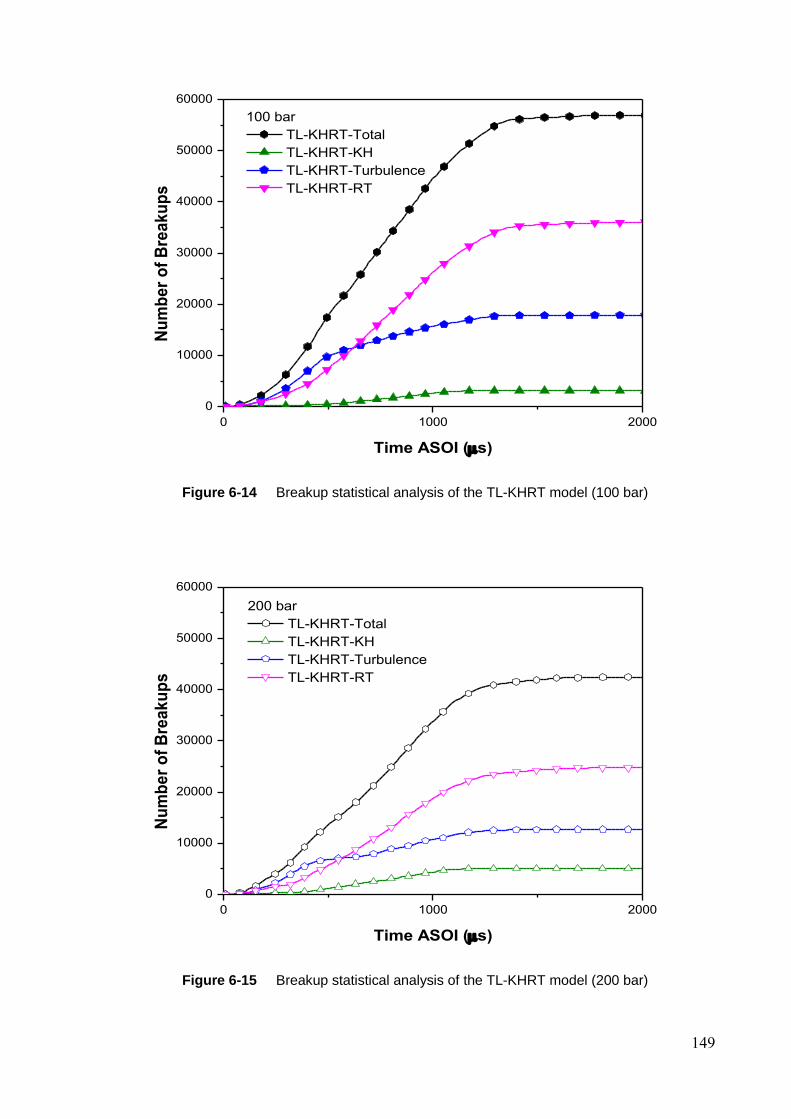
149
0 1000 2000
0
10000
20000
30000
40000
50000
60000
Nu
mb
er
of
Bre
ak
up
s
Time ASOI (s)
100 bar
TL-KHRT-Total
TL-KHRT-KH
TL-KHRT-Turbulence
TL-KHRT-RT
Figure 6-14 Breakup statistical analysis of the TL-KHRT model (100 bar)
0 1000 2000
0
10000
20000
30000
40000
50000
60000
Nu
mb
er
of
Bre
ak
up
s
Time ASOI (s)
200 bar
TL-KHRT-Total
TL-KHRT-KH
TL-KHRT-Turbulence
TL-KHRT-RT
Figure 6-15 Breakup statistical analysis of the TL-KHRT model (200 bar)
150
6.6 Summary
A turbulence-induced breakup mechanism coupled with aerodynamic instability was
developed in this study. The proposed TL-KHRT model improves the simulation accuracy by
employing a new droplet breakup mechanism based on the research that the droplet formation
is mainly linked to the ligament evolution during the turbulent breakup process. The new model
is validated with the high-speed imaging and PDPA experiments and the simulation result
shows a good agreement with the experimental data. Conclusions can be drawn from this study
as follows:
1. Turbulence from the nozzle has been proved to play an important role in spray breakup and
enhance the spray atomization process. By applying the turbulence-ligament breakup
mechanism into the spray model, significant improvements in the spray simulation can be
achieved.
2. Ligament formation and breakup due to the turbulence-induced instability along the liquid
surface are the main causes which result in the primary breakup of the fuel spray. By employing
the new droplet generation mechanism based on the ligament evolution, the child droplet size
of the new breakup model is proved to be closer to the experimental data than that of the
original KHRT model.
3. The spray characteristics such as spray penetration, droplet velocity, droplet AMD and
SMD can be clearly predicted by the proposed TL-KHRT model. The simulated spray
penetration length of the new model shows better agreement with the high-speed photography
data when compared to the slightly longer penetration predicted by the KHRT model. Likewise,
151
the droplet velocity and droplet size simulated by the TL-KHRT model also present better
agreements with the PDPA data.
4. The proposed TL-KHRT model is an effective supplement to the original KHRT breakup
model by considering the turbulence and ligament evolution during the spray aromatization
process. The development of this model helps to achieve an accurate spray simulation in GDI
engines.

152
7 CHAPTER 7 DIESEL SPRAY MODEL DEVELOPMENT
AND VALIDATION
This chapter focuses on the numerical modelling of diesel spray. In this study, an enhanced
Aerodynamic-Cavitation-Turbulence-induced primary breakup model is proposed. The
proposed model improves the primary breakup accuracy by optimizing the turbulence induced
breakup process; controlling the transition process of the primary and secondary breakups; and
employing a new child droplet size function and a new parent droplet size reduction rate. The
aerodynamic secondary breakup model has been modified to incorporate with the proposed
model and they have been coupled together to simulate the complete spray evolution and better
predict the secondary droplet size and velocity. This new model will be validated with the high-
speed imaging and Phase Doppler Particle Analyzer (PDPA) experimental results of the full-
cone diesel spray in a constant volume vessel under non-evaporating and various injection
conditions.
7.1 Introduction
Unlike the gasoline spray modelling, the diesel spray atomization models have experienced
more developments since the earlier utilization of direct injection technology in a diesel engine.
Various models have been implemented to simulate the spray atomization process in the
literature. Some studies do not distinguish the primary breakup and the secondary breakup
processes and only employ one model to simulate the spray atomization process.
153
Allocca O’Rourke et al [98, 148] simulated the breakup process by using a Taylor Analogy
Breakup (TAB) model only. Some early studies [56, 60] employed a Wave model only. The
later research of Reitz et al [99] distinguishes the primary breakup and the secondary breakup
processes by using Kelvin-Helmholtz and Rayleigh-Taylor (KH-RT) models. Other
researchers combine the primary breakup and secondary breakup models in their studies by
using various approaches, as shown in Table 7-1 [162]. Som et al [104] developed the Kelvin-
Helmholtz-Aerodynamics Cavitation Turbulence (KH-ACT) model, which improved the
primary breakup model by considering cavitation and turbulence effects along with
aerodynamically induced breakup.
A series of recent studies [104, 150, 163] indicates that cavitation and the turbulence
phenomenon play an important role in the primary breakup process of diesel spray. Compared
to the gasoline spray, the cavitation effect is taken into account in these studies. However,
some non-ignorable aspects such as the extent of the impact of these mechanisms and how far
downstream these effects last are still not fully understood. According to Som’s study [104],
these effects seem to be significant up to 10 mm downstream of the nozzle, which is about 60
nozzle diameters. After this distance, the primary breakup process is dominated by the KH
breakup model in the KH-ACT model. Li, Zhi-Hua et al [150] employed a Huh-Gosman-KH-
RT hybrid breakup model in their gasoline spray study; it can be estimated from their results
that the primary breakup process is dominated by the turbulence-induced mechanism up to 30
mm downstream. Obviously, a 30 mm distance will cover the KH breakup length in the KH-
RT model, which means that the primary breakup is determined by the turbulence breakup only.
Moreover, the influence of these models on some spray atomization characteristics such as
droplet size and droplet velocity has not been fully investigated in the studies [104, 150].
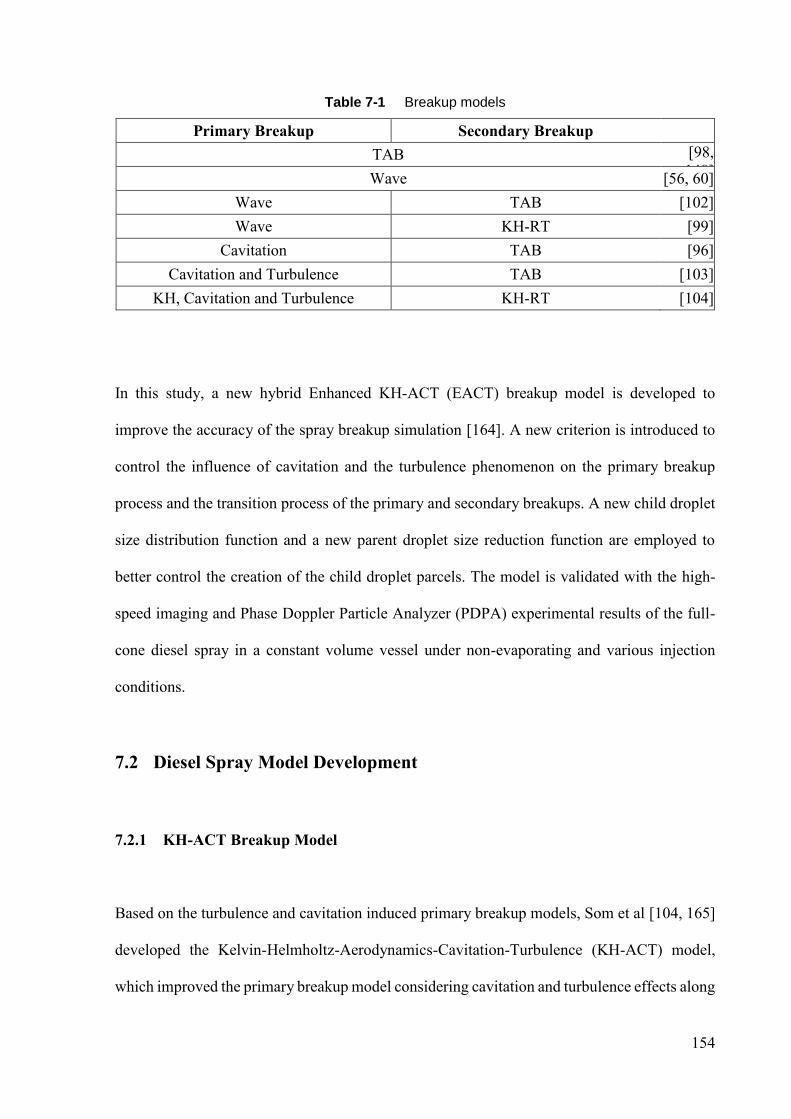
154
Table 7-1 Breakup models
Primary Breakup Secondary Breakup
TAB [98,
148] Wave [56, 60]
Wave TAB [102]
Wave KH-RT [99]
Cavitation TAB [96]
Cavitation and Turbulence TAB [103]
KH, Cavitation and Turbulence KH-RT [104]
In this study, a new hybrid Enhanced KH-ACT (EACT) breakup model is developed to
improve the accuracy of the spray breakup simulation [164]. A new criterion is introduced to
control the influence of cavitation and the turbulence phenomenon on the primary breakup
process and the transition process of the primary and secondary breakups. A new child droplet
size distribution function and a new parent droplet size reduction function are employed to
better control the creation of the child droplet parcels. The model is validated with the high-
speed imaging and Phase Doppler Particle Analyzer (PDPA) experimental results of the full-
cone diesel spray in a constant volume vessel under non-evaporating and various injection
conditions.
7.2 Diesel Spray Model Development
7.2.1 KH-ACT Breakup Model
Based on the turbulence and cavitation induced primary breakup models, Som et al [104, 165]
developed the Kelvin-Helmholtz-Aerodynamics-Cavitation-Turbulence (KH-ACT) model,
which improved the primary breakup model considering cavitation and turbulence effects along
155
with aerodynamically induced breakup. In the KH-ACT model, the length and time scales of
aerodynamically induced breakup, cavitation induced breakup and turbulence induced breakup
are based on the Kelvin-Helmholtz and Rayleigh-Taylor instability; the bubble collapse and
burst times; and the k-ε model, respectively.
The maximum ratio of length/time scale determines the dominant model during the breakup
process:
max , ,CAVA KH T
A KH CAV T
LL L L
(7-1)
where LKH = r - rKH and τKH are the aerodynamics’ breakup length and time scales in the KH
breakup model [60]; LCAV and τCAV are the cavitation breakup length and time scales in the
cavitation-induced breakup model [96] introduced previously.
The turbulence breakup length scale LT and time scale τT are calculated as:
1.5(t)( )
( )T
KL t C
t
(7-2)
(t)( )
( )T
Kt C
t
(7-3)
where K(t) and ε(t) are the turbulent kinetic energy and dissipation rate respectively and can be
estimated as follows:
156
1/( 1)
0
0 0
( )(1 ) ( 1)
CC
KK t
K C C C t C
(7-4)
0
0
( )( )
C
K tt
K
(7-5)
where K0 and ε0 are the initial values at the nozzle exit, calculated from the nozzle flow
simulations [166].
According to Equation (7-1), if the KH breakup model dominates the breakup process, then the
KH model is employed. Otherwise the breakup rate will follow the law:
,A
T CAV
A
LdrC
dt (7-6)
where CT,CAV is the adjustable model constant.
The new droplet parcel with the drop diameter LA will be created accordingly and these child
parcels may undergo further secondary breakups.
7.2.2 EACT Breakup Model
As already stated in the previous section, a new hybrid Enhanced KH-ACT (EACT) breakup
model was developed in order to optimize the effects of turbulence and cavitation induced
breakup on the spray atomization characteristics. In the proposed EACT model, a drop size
based criterion rcri was introduced to control the influence of cavitation and the turbulence
157
phenomenon on the primary breakup process and the transition process of the primary and
secondary breakups. The criterion drop radius rcri is set to:
0cri crir C r (7-7)
where Ccri is the transition switch parameter expected to be investigated in this study.
While the radius of the parent droplet r is greater than rcri, the primary breakup process follows
the similar law as in the KH-ACT model continually until r is reduced to rcri:
max , ,CAV twA KH
A KH CAV tw
L LL L
(7-8)
where LKH, τKH, LCAV and τCAV are the same as those in the KH-ACT model; Ltw and τtw are the
turbulence breakup length and time scales in the original Huh-Gosman turbulence-induced
breakup model.
Similarly in the KH-ACT model, if the KH breakup model dominates the breakup process, then
the KH model is employed; otherwise, the breakup rate will follow Equation (7-6). However,
the difference of the implementation of Equation (7-6) between the KH-ACT model and the
EACT model is in the parent droplet parcel breakup rate, if turbulence induced breakup is the
dominant mechanism. Instead of LT and τT used in KH-ACT model, the EACT model employs
Ltw and τtw in the original Huh-Gosman turbulence-induced breakup model to offer a new parent
droplet size reduction function.
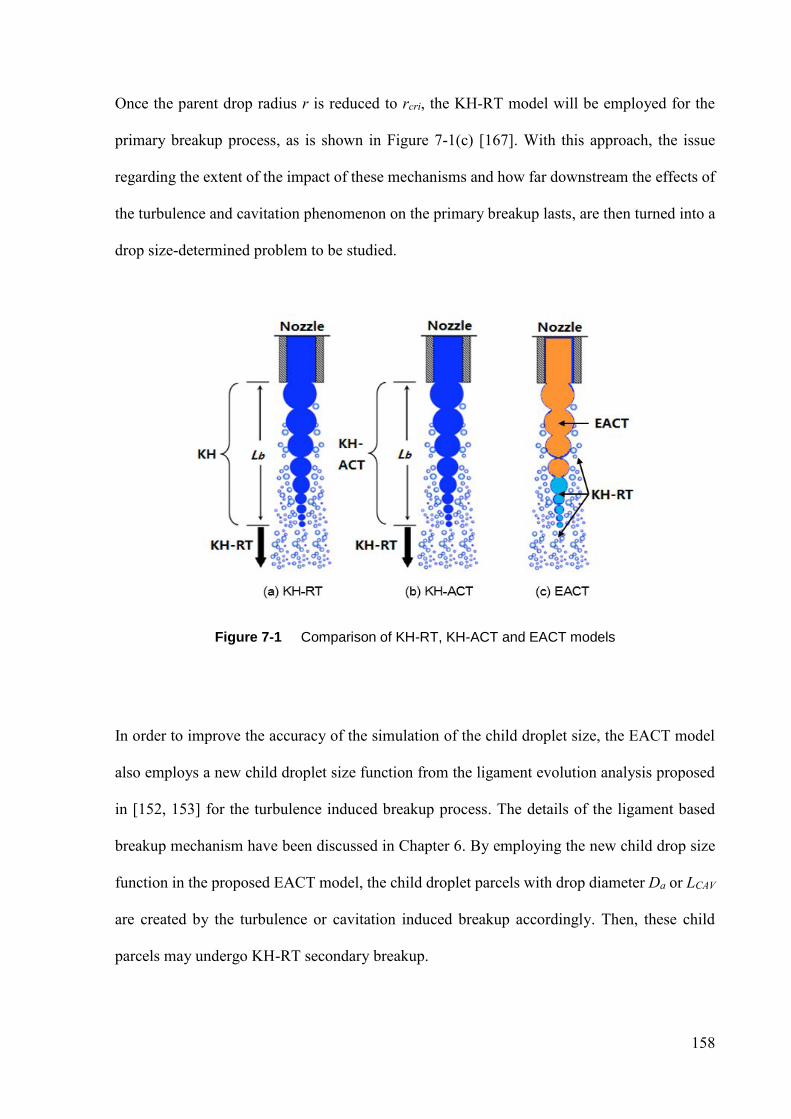
158
Once the parent drop radius r is reduced to rcri, the KH-RT model will be employed for the
primary breakup process, as is shown in Figure 7-1(c) [167]. With this approach, the issue
regarding the extent of the impact of these mechanisms and how far downstream the effects of
the turbulence and cavitation phenomenon on the primary breakup lasts, are then turned into a
drop size-determined problem to be studied.
Figure 7-1 Comparison of KH-RT, KH-ACT and EACT models
In order to improve the accuracy of the simulation of the child droplet size, the EACT model
also employs a new child droplet size function from the ligament evolution analysis proposed
in [152, 153] for the turbulence induced breakup process. The details of the ligament based
breakup mechanism have been discussed in Chapter 6. By employing the new child drop size
function in the proposed EACT model, the child droplet parcels with drop diameter Da or LCAV
are created by the turbulence or cavitation induced breakup accordingly. Then, these child
parcels may undergo KH-RT secondary breakup.
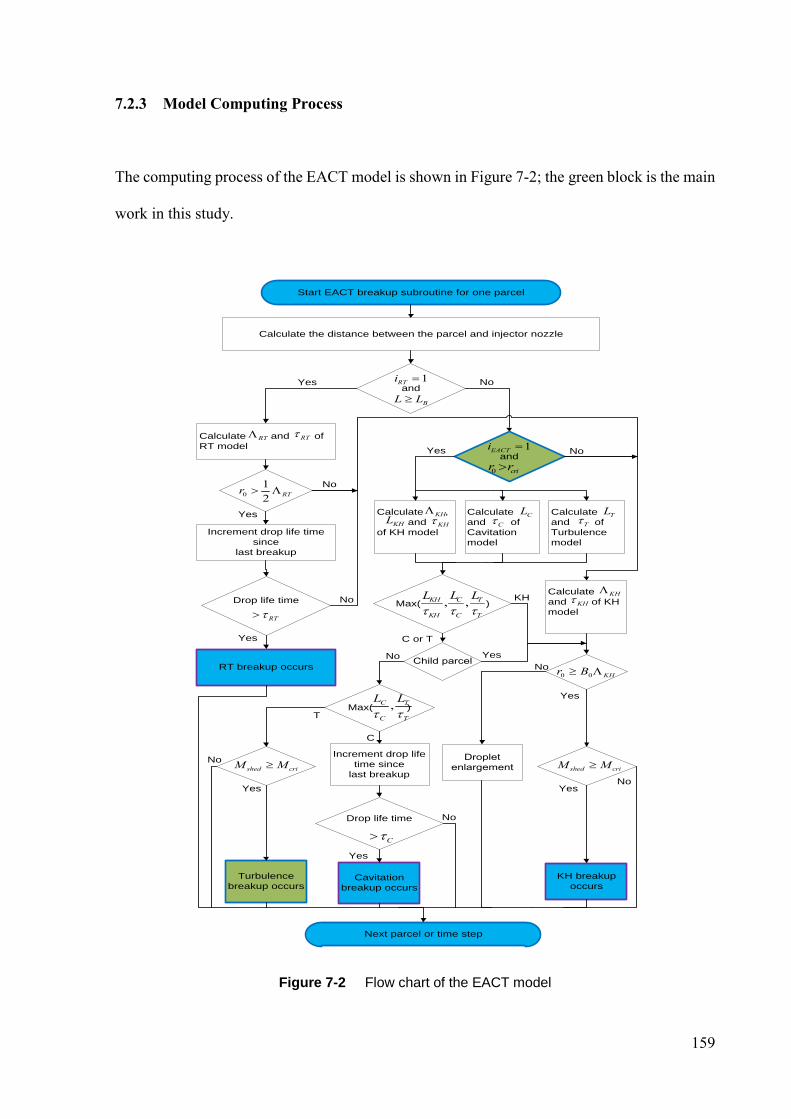
159
7.2.3 Model Computing Process
The computing process of the EACT model is shown in Figure 7-2; the green block is the main
work in this study.
Figure 7-2 Flow chart of the EACT model
Start EACT breakup subroutine for one parcel
Calculate the distance between the parcel and injector nozzle
and
BL L
Calculate and of
RT model
Yes
RT RT
1RTi
0
1
2RTr
Increment drop life time
since
last breakup
Drop life time
RT
RT breakup occurs
Yes
Yes
Calculate ,
and
of KH model
KH
KHCalculate
and of
Turbulence
model
TL
TCalculate
and of
Cavitation
model
CL
CKHL
Max( ), ,CKH T
KH C T
LL L
No
No
No
and1EACTi
0 crir r
Yes
Calculate
and of KH
model
KH
KH
0 0 KHr B
KH
Yes
KH breakup
occurs
Yes
Droplet
enlargement
NoChild parcel
Yes
C or T
Max( ),C T
C T
L L
No
Increment drop life
time since
last breakup
C
Drop life time
C
Cavitation
breakup occurs
Yes
No
No
T
Turbulence
breakup occurs
Next parcel or time step
No
No
Yes
shed criM M shed criM M
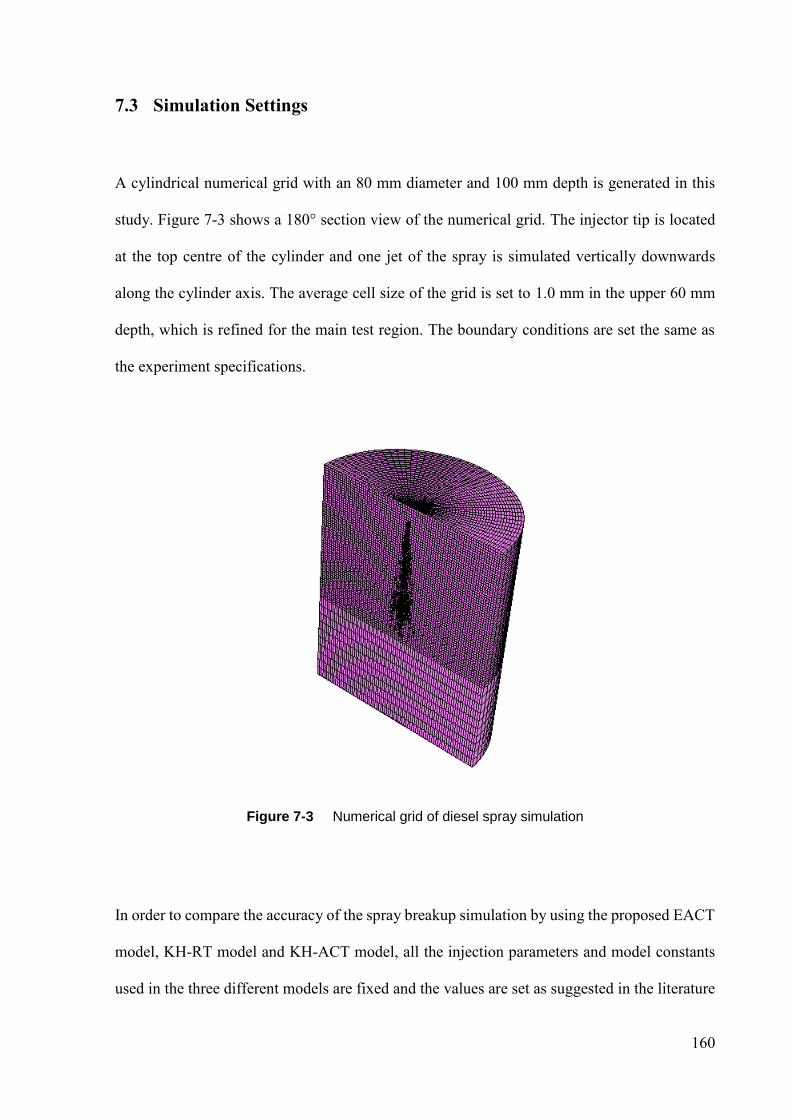
160
7.3 Simulation Settings
A cylindrical numerical grid with an 80 mm diameter and 100 mm depth is generated in this
study. Figure 7-3 shows a 180° section view of the numerical grid. The injector tip is located
at the top centre of the cylinder and one jet of the spray is simulated vertically downwards
along the cylinder axis. The average cell size of the grid is set to 1.0 mm in the upper 60 mm
depth, which is refined for the main test region. The boundary conditions are set the same as
the experiment specifications.
Figure 7-3 Numerical grid of diesel spray simulation
In order to compare the accuracy of the spray breakup simulation by using the proposed EACT
model, KH-RT model and KH-ACT model, all the injection parameters and model constants
used in the three different models are fixed and the values are set as suggested in the literature
161
[56, 104, 163, 168-170], except for the transition switch parameter Ccri. In order to investigate
the influence of the switch parameter Ccri on the breakup process, four different Ccri values are
studied: 0.3, 0.5, 0.7 and 0.9. Both of the 1000 bar and 1500 bar injection pressure conditions
are simulated and validated in this study and only the results of 1000 bar injection pressure are
shown here for the sake of brevity.
7.4 Validation Experiments
The spray experiment was carried out with a 7-hole common rail diesel injector in the two
constant volume vessels under non-evaporation and various injection conditions. The
experiment system has been introduced in Chapter 3. A solenoid DENSO injector with 7 holes
and a diameter of 0.15 mm was used in the experiments. The injector was fuelled with diesel
and controlled by electrical pulses, which were generated from an injection trigger unit and
amplified by a driver. The spray photography tests were done in the high pressure CVV
pressured by nitrogen; while the PDPA tests were carried out at atmospheric pressure in the
low pressure CVV, since it was difficult to obtain valid data in the high pressure vessel due to
its limited optical access area. Spray images were taken from the bottom window of the high
pressure CVV, with a visible diameter of 68 mm. The tests specifications are shown in Table
7-2.
Table 7-2 Diesel spray experiment specifications
Test Fuel Temp-
erature
Pinjection
(bar) Pback (bar)
Density
(kg/m3)
Injection
Duration
Photography Diesel 300 K 1000/1500 15.0 17.8 600 µs
PDPA Diesel 300 K 1000/1500 1.0 1.29 600 µs

162
7.5 Validations and Discussion
7.5.1 Spray Morphography Comparison
Figure 7-4 Comparison between experiment and simulated spray shape evolution (Scale 2:1)
163
The comparisons between the experimental and simulated spray shape evolution are shown in
Figure 7-4. It can be seen from the visualization results that the KH-RT model predicts a
slightly longer penetration and the KH-ACT model predicts a shorter penetration in comparison
with the experimental image. According to the color scale, it is noteworthy that the result of
the KH-ACT model presents more small droplets distributions than the other two models and
the result of the EACT model indicates a moderate sized distribution among the three models.
This is reasonable since the breakup is enhanced by turbulence induced and cavitation induced
breakup in the KH-ACT model and the EACT model; and the switch parameter Ccri in the
EACT model is a most effective drop size-based parameter to control the extent of the inclusion
of the turbulence and cavitation models. The detailed discussion of the droplet size validation
will be examined in the following sections.
7.5.2 Spray Penetration
Spray penetration is a macroscopic characteristic which is always considered firstly by fuel
spray researchers. Figure 7-5 shows the temporal evolution of spray penetration of the
experimental data and simulation results using KH-RT, KH-ACT and EACT breakup models.
It can be seen that all of the three models provide a penetration trend in good agreement with
the experiments until 300 µs after the start of injection (ASOI), which indicates a similar jet
velocity at the very beginning of the injection. After this point, the divergence of the simulated
penetration between different models starts to increase until the maximum penetration can be
captured by the experiment.
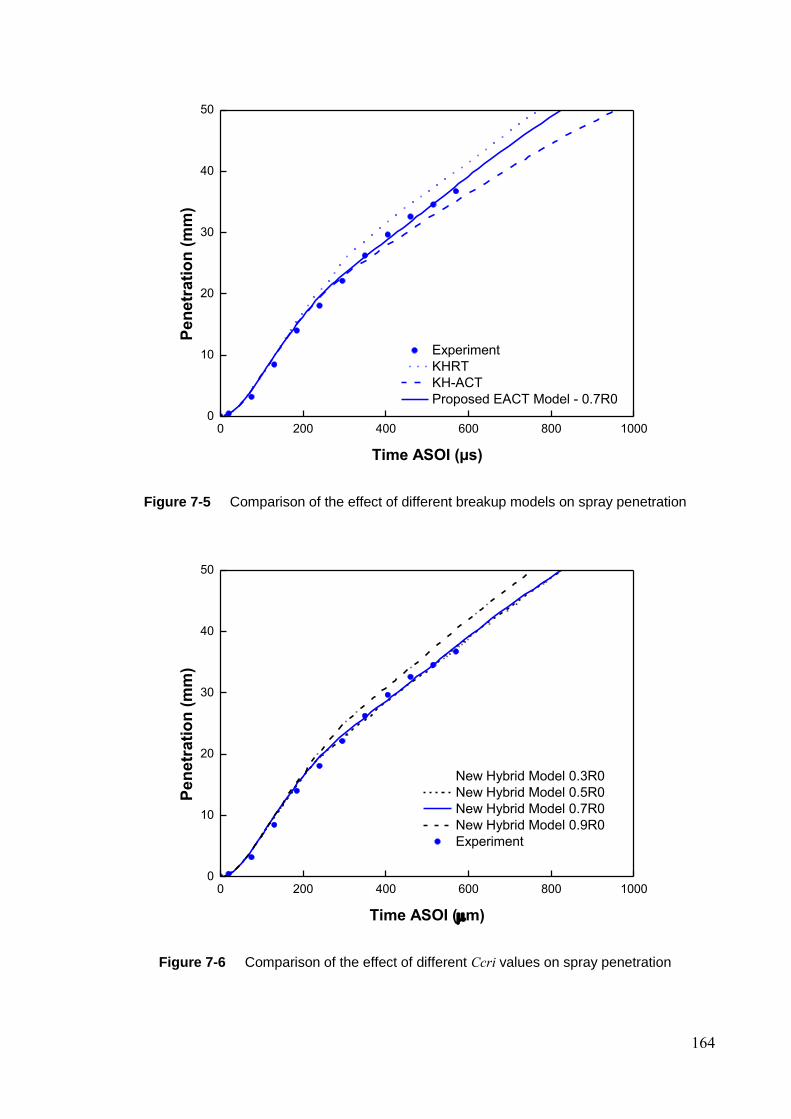
164
0 200 400 600 800 10000
10
20
30
40
50
Experiment
KHRT
KH-ACT
Proposed EACT Model - 0.7R0
Pe
ne
tra
tio
n (
mm
)
Time ASOI (µs)
Figure 7-5 Comparison of the effect of different breakup models on spray penetration
0 200 400 600 800 10000
10
20
30
40
50
New Hybrid Model 0.3R0
New Hybrid Model 0.5R0
New Hybrid Model 0.7R0
New Hybrid Model 0.9R0
Experiment
Pe
ne
tra
tio
n (
mm
)
Time ASOI (m)
Figure 7-6 Comparison of the effect of different Ccri values on spray penetration
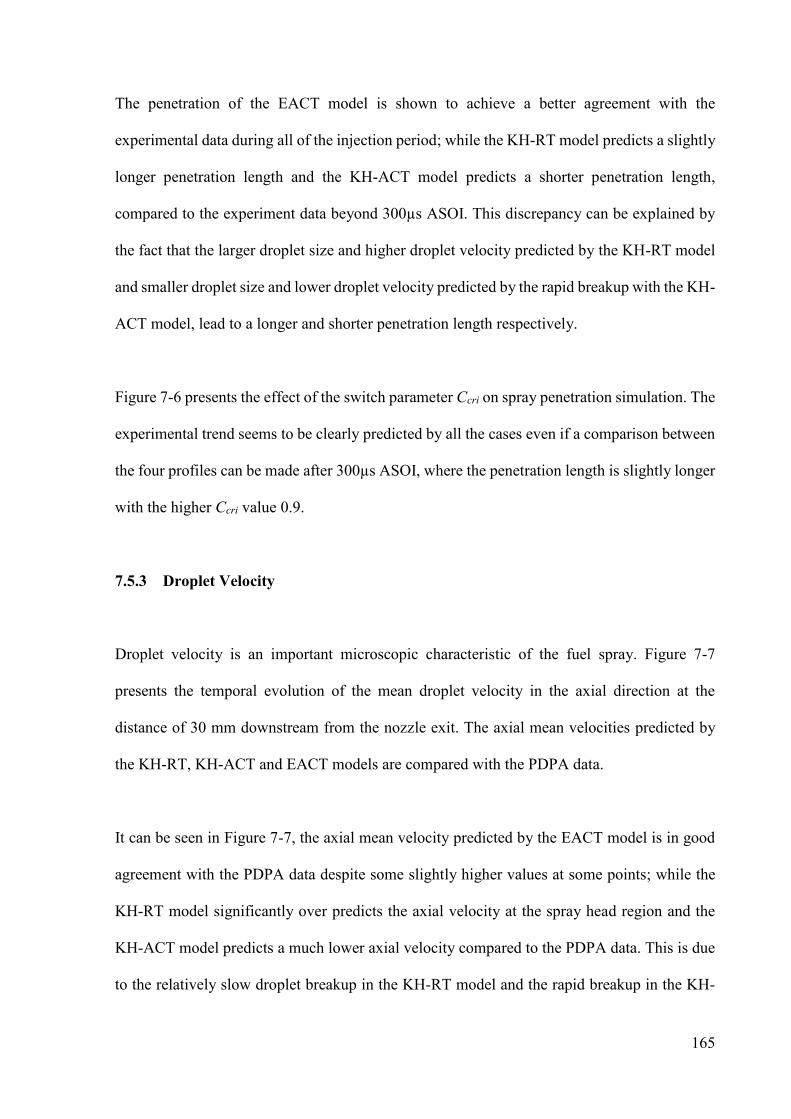
165
The penetration of the EACT model is shown to achieve a better agreement with the
experimental data during all of the injection period; while the KH-RT model predicts a slightly
longer penetration length and the KH-ACT model predicts a shorter penetration length,
compared to the experiment data beyond 300µs ASOI. This discrepancy can be explained by
the fact that the larger droplet size and higher droplet velocity predicted by the KH-RT model
and smaller droplet size and lower droplet velocity predicted by the rapid breakup with the KH-
ACT model, lead to a longer and shorter penetration length respectively.
Figure 7-6 presents the effect of the switch parameter Ccri on spray penetration simulation. The
experimental trend seems to be clearly predicted by all the cases even if a comparison between
the four profiles can be made after 300µs ASOI, where the penetration length is slightly longer
with the higher Ccri value 0.9.
7.5.3 Droplet Velocity
Droplet velocity is an important microscopic characteristic of the fuel spray. Figure 7-7
presents the temporal evolution of the mean droplet velocity in the axial direction at the
distance of 30 mm downstream from the nozzle exit. The axial mean velocities predicted by
the KH-RT, KH-ACT and EACT models are compared with the PDPA data.
It can be seen in Figure 7-7, the axial mean velocity predicted by the EACT model is in good
agreement with the PDPA data despite some slightly higher values at some points; while the
KH-RT model significantly over predicts the axial velocity at the spray head region and the
KH-ACT model predicts a much lower axial velocity compared to the PDPA data. This is due
to the relatively slow droplet breakup in the KH-RT model and the rapid breakup in the KH-
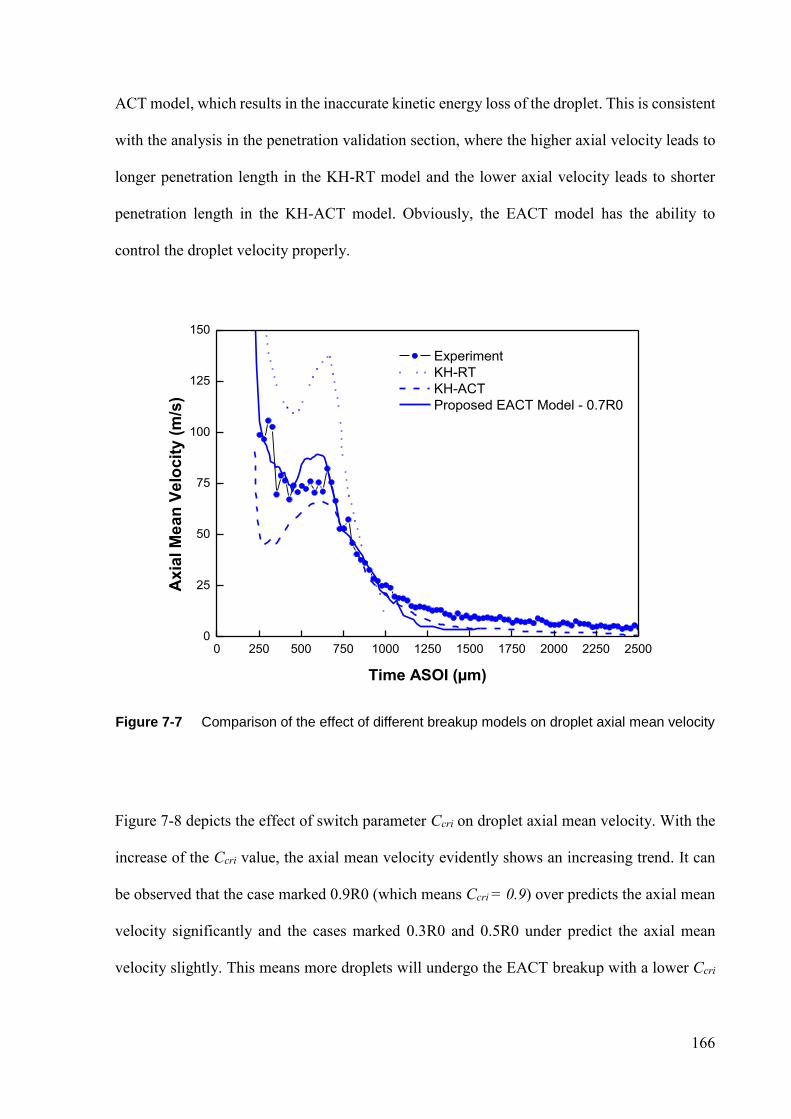
166
ACT model, which results in the inaccurate kinetic energy loss of the droplet. This is consistent
with the analysis in the penetration validation section, where the higher axial velocity leads to
longer penetration length in the KH-RT model and the lower axial velocity leads to shorter
penetration length in the KH-ACT model. Obviously, the EACT model has the ability to
control the droplet velocity properly.
0 250 500 750 1000 1250 1500 1750 2000 2250 25000
25
50
75
100
125
150
Experiment
KH-RT
KH-ACT
Proposed EACT Model - 0.7R0
Ax
ial M
ea
n V
elo
cit
y (
m/s
)
Time ASOI (µm)
Figure 7-7 Comparison of the effect of different breakup models on droplet axial mean velocity
Figure 7-8 depicts the effect of switch parameter Ccri on droplet axial mean velocity. With the
increase of the Ccri value, the axial mean velocity evidently shows an increasing trend. It can
be observed that the case marked 0.9R0 (which means Ccri = 0.9) over predicts the axial mean
velocity significantly and the cases marked 0.3R0 and 0.5R0 under predict the axial mean
velocity slightly. This means more droplets will undergo the EACT breakup with a lower Ccri
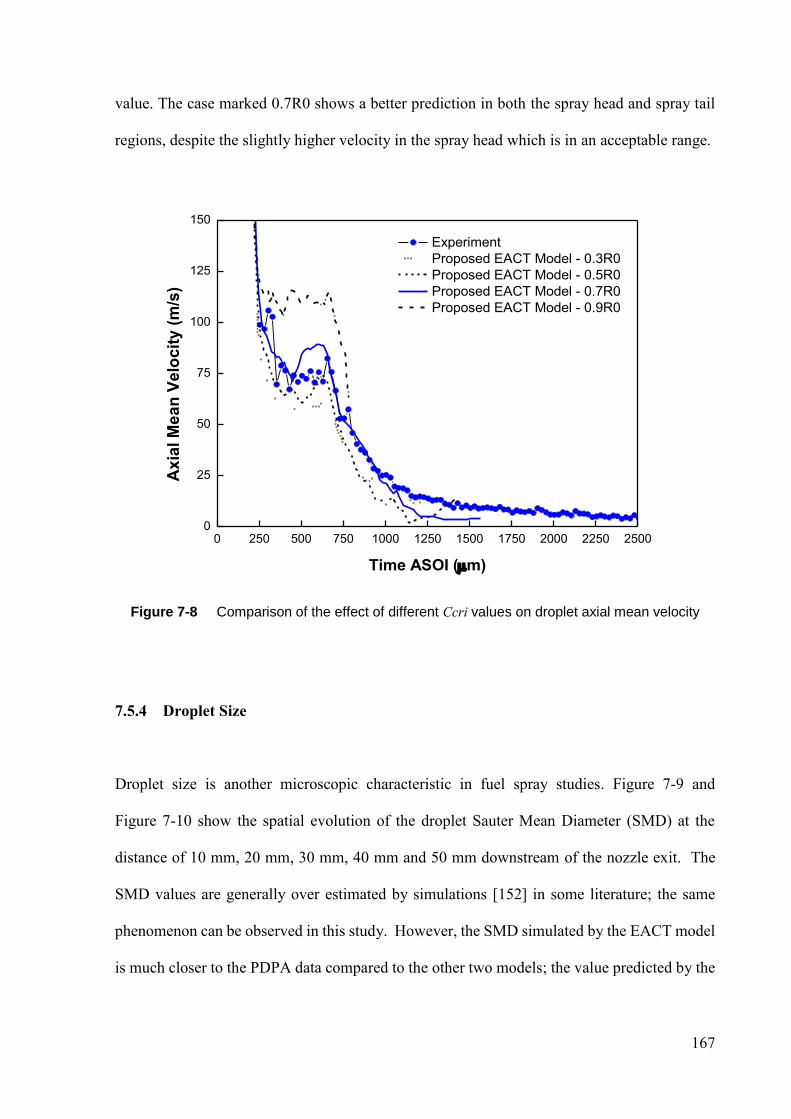
167
value. The case marked 0.7R0 shows a better prediction in both the spray head and spray tail
regions, despite the slightly higher velocity in the spray head which is in an acceptable range.
0 250 500 750 1000 1250 1500 1750 2000 2250 25000
25
50
75
100
125
150
Experiment
Proposed EACT Model - 0.3R0
Proposed EACT Model - 0.5R0
Proposed EACT Model - 0.7R0
Proposed EACT Model - 0.9R0
Ax
ial M
ea
n V
elo
cit
y (
m/s
)
Time ASOI (m)
Figure 7-8 Comparison of the effect of different Ccri values on droplet axial mean velocity
7.5.4 Droplet Size
Droplet size is another microscopic characteristic in fuel spray studies. Figure 7-9 and
Figure 7-10 show the spatial evolution of the droplet Sauter Mean Diameter (SMD) at the
distance of 10 mm, 20 mm, 30 mm, 40 mm and 50 mm downstream of the nozzle exit. The
SMD values are generally over estimated by simulations [152] in some literature; the same
phenomenon can be observed in this study. However, the SMD simulated by the EACT model
is much closer to the PDPA data compared to the other two models; the value predicted by the
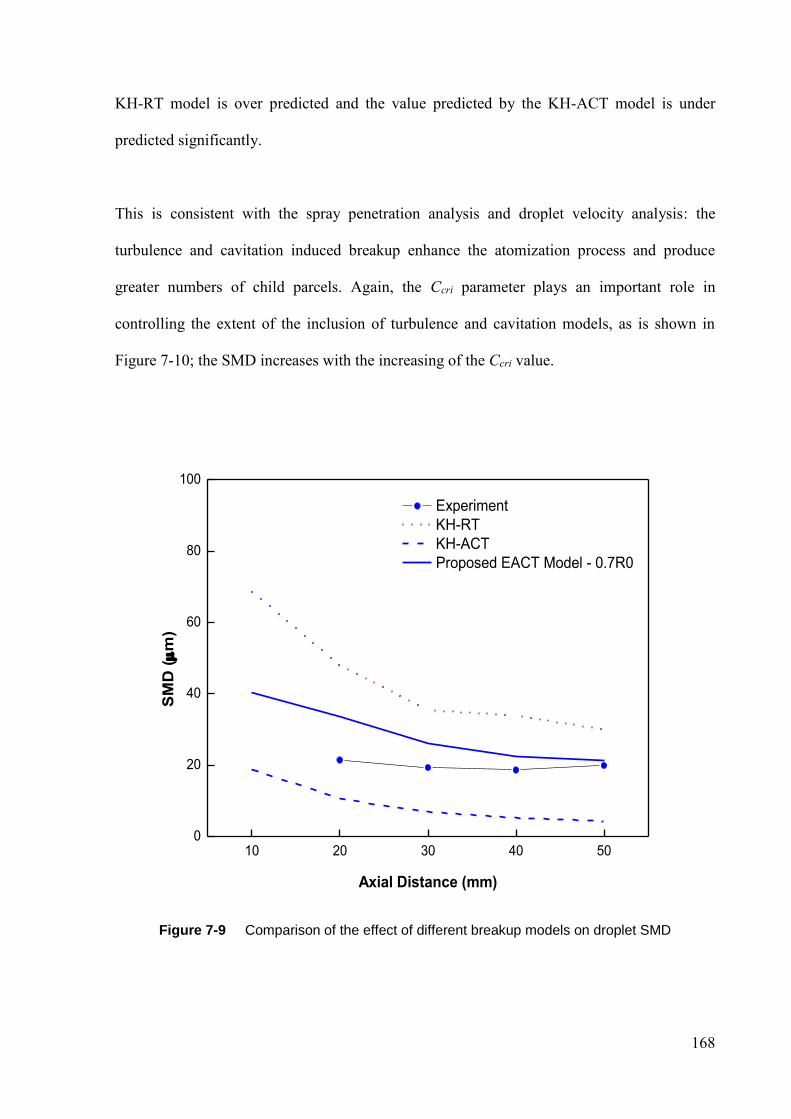
168
KH-RT model is over predicted and the value predicted by the KH-ACT model is under
predicted significantly.
This is consistent with the spray penetration analysis and droplet velocity analysis: the
turbulence and cavitation induced breakup enhance the atomization process and produce
greater numbers of child parcels. Again, the Ccri parameter plays an important role in
controlling the extent of the inclusion of turbulence and cavitation models, as is shown in
Figure 7-10; the SMD increases with the increasing of the Ccri value.
10 20 30 40 500
20
40
60
80
100
Experiment
KH-RT
KH-ACT
Proposed EACT Model - 0.7R0
SM
D (m
)
Axial Distance (mm)
Figure 7-9 Comparison of the effect of different breakup models on droplet SMD
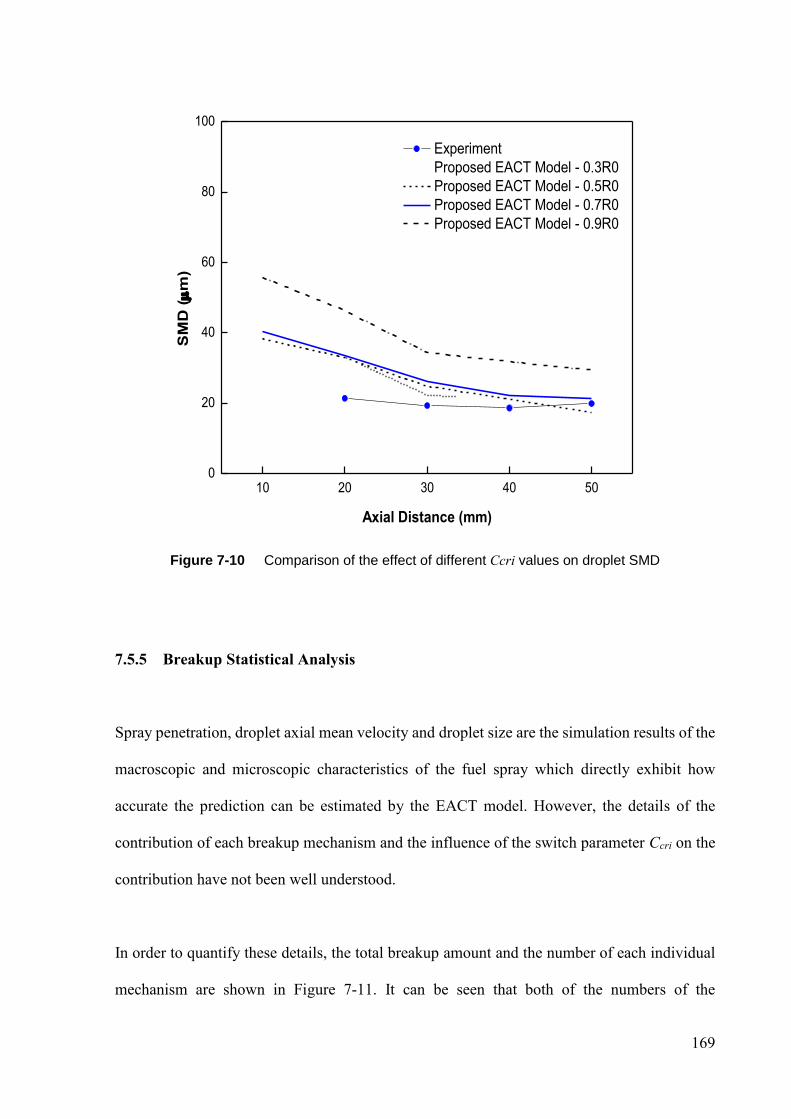
169
10 20 30 40 500
20
40
60
80
100
Experiment
Proposed EACT Model - 0.3R0
Proposed EACT Model - 0.5R0
Proposed EACT Model - 0.7R0
Proposed EACT Model - 0.9R0
SM
D (m
)
Axial Distance (mm)
Figure 7-10 Comparison of the effect of different Ccri values on droplet SMD
7.5.5 Breakup Statistical Analysis
Spray penetration, droplet axial mean velocity and droplet size are the simulation results of the
macroscopic and microscopic characteristics of the fuel spray which directly exhibit how
accurate the prediction can be estimated by the EACT model. However, the details of the
contribution of each breakup mechanism and the influence of the switch parameter Ccri on the
contribution have not been well understood.
In order to quantify these details, the total breakup amount and the number of each individual
mechanism are shown in Figure 7-11. It can be seen that both of the numbers of the
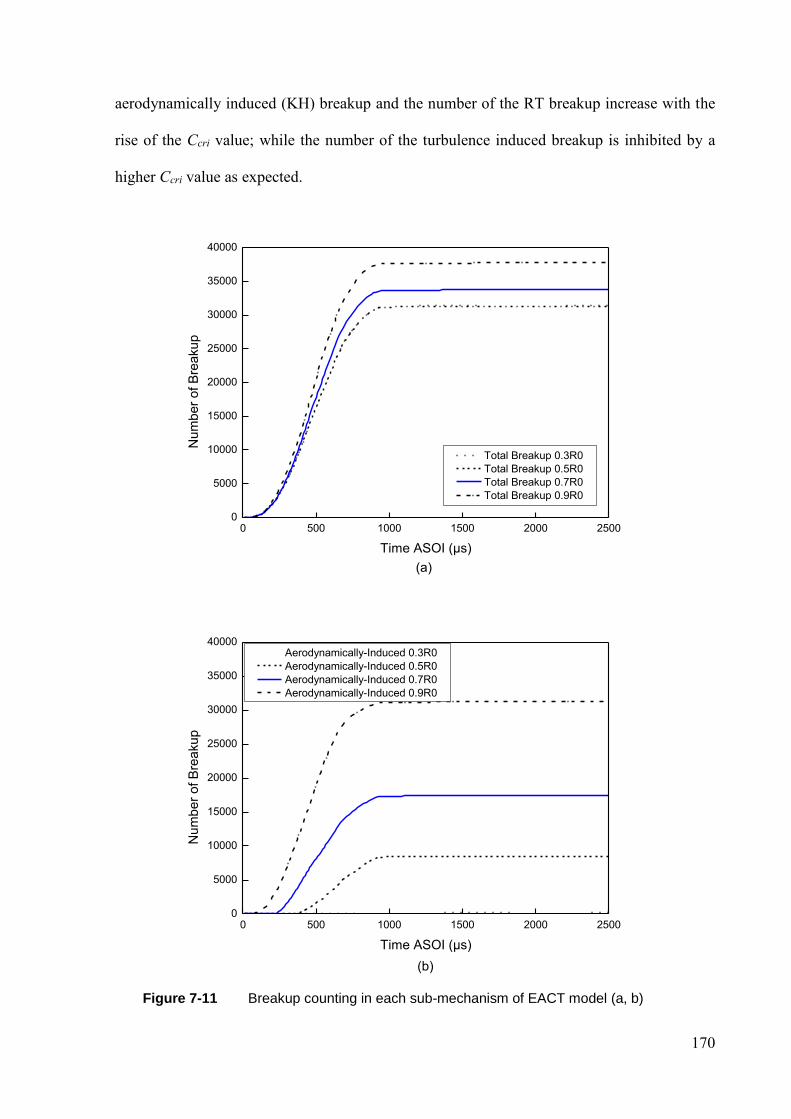
170
aerodynamically induced (KH) breakup and the number of the RT breakup increase with the
rise of the Ccri value; while the number of the turbulence induced breakup is inhibited by a
higher Ccri value as expected.
0 500 1000 1500 2000 25000
5000
10000
15000
20000
25000
30000
35000
40000
Total Breakup 0.3R0
Total Breakup 0.5R0
Total Breakup 0.7R0
Total Breakup 0.9R0
Nu
mb
er
of B
rea
ku
p
Time ASOI (µs)
(a)
0 500 1000 1500 2000 25000
5000
10000
15000
20000
25000
30000
35000
40000 Aerodynamically-Induced 0.3R0
Aerodynamically-Induced 0.5R0
Aerodynamically-Induced 0.7R0
Aerodynamically-Induced 0.9R0
Nu
mb
er
of B
rea
ku
p
Time ASOI (µs)
(b)
Figure 7-11 Breakup counting in each sub-mechanism of EACT model (a, b)
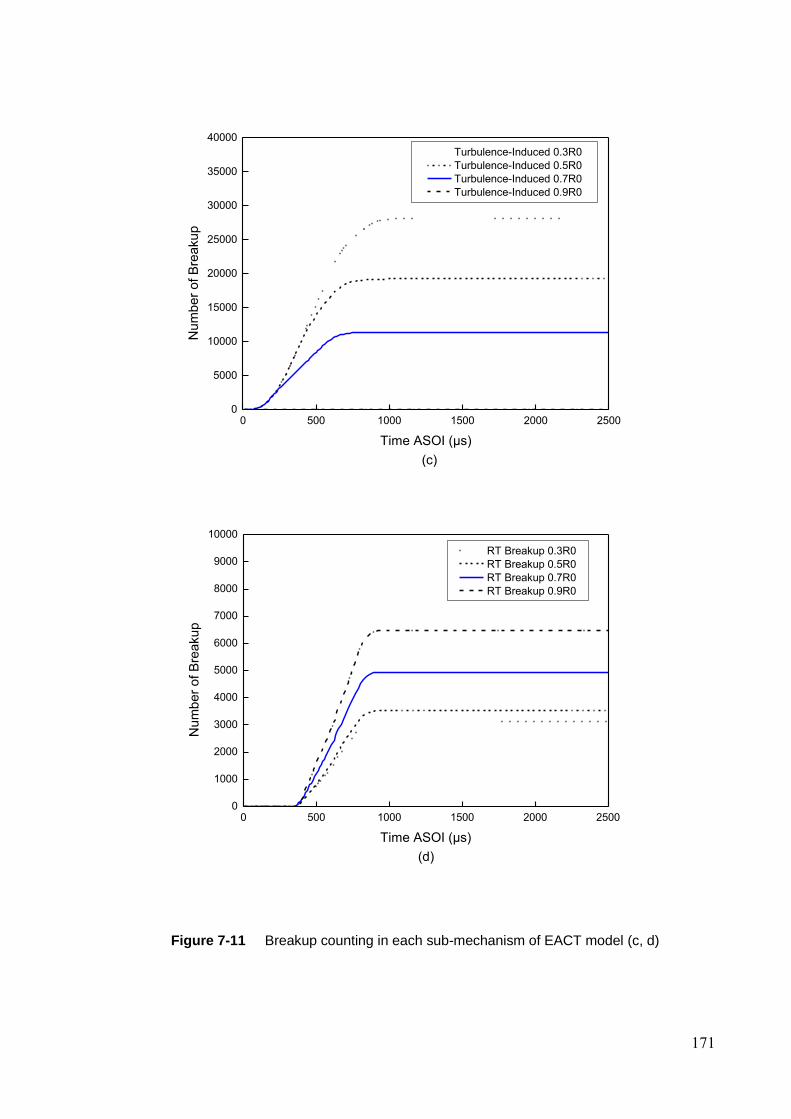
171
0 500 1000 1500 2000 25000
5000
10000
15000
20000
25000
30000
35000
40000
Turbulence-Induced 0.3R0
Turbulence-Induced 0.5R0
Turbulence-Induced 0.7R0
Turbulence-Induced 0.9R0N
um
be
r o
f B
rea
ku
p
Time ASOI (µs)
(c)
0 500 1000 1500 2000 25000
1000
2000
3000
4000
5000
6000
7000
8000
9000
10000
(d)
RT Breakup 0.3R0
RT Breakup 0.5R0
RT Breakup 0.7R0
RT Breakup 0.9R0
Nu
mb
er
of B
rea
ku
p
Time ASOI (µs)
Figure 7-11 Breakup counting in each sub-mechanism of EACT model (c, d)
172
The number of the cavitation induced breakup is not plotted here due to its much lower value;
and this is not beyond expectation since the amount of cavitation generated from the nozzle is
rather low, which can be studied in the literature [97, 169]. Turbulence from the nozzle is
proved to play an important role on spray breakup and leads to a rapid atomization process of
the spray. The optimization of the extent of the turbulence induced breakup can be realized by
controlling the switch parameter Ccri.
7.6 Summary
An enhanced turbulence and cavitation induced primary breakup model combined with an
aerodynamic breakup mechanism is proposed. The new EACT model improves the primary
breakup accuracy by optimizing the turbulence induced breakup mechanism; controlling the
primary and secondary breakup process; employing a new child droplet size function and a
new parent droplet size reduction function; and introducing a new size-based criterion to
control the extent of the EACT model. This new model is validated with the high-speed
imaging and Phase Doppler Particle Analyzer (PDPA) experimental results. The conclusions
can be drawn from this study as follows:
1. The spray penetration can be clearly predicted by the proposed EACT model with a proper
Ccri value and the result shows better agreement with the high-speed photography data,
compared to the slightly higher value simulated by the KH-RT model and the slightly lower
value simulated by the KH-ACT model.
2. The droplet velocity and droplet size simulated by the EACT model present good agreement
with the PDPA data, despite the higher SMD value which is generally over estimated by other
173
spray breakup models. This means that the optimized turbulence breakup rate and the new child
droplet size function in the EACT model offer a more accurate simulation of the fuel spray.
3. Turbulence from the nozzle is proved to play an important role in spray breakup and
enhances the atomization process of the spray; while the influence of cavitation generated from
the nozzle is relatively weaker compared to the turbulence induced breakup.
4. The breakup switch constant Ccri is an effective parameter to optimize the extent of the
effect of turbulence induced breakup; higher Ccri value moves the breakup trend towards the
similar results of the KH model and slow down the breakup process. A proper Ccri value helps
to achieve an accurate simulation of the fuel spray of diesel engines.
174
8 CHAPTER 8 CONCLUSIONS AND RECOMMENDATIONS
This chapter summarizes the conclusions for the research work carried out in this thesis and
gives some recommendations for future study.
8.1 Conclusions
The research work in this thesis focuses on the experimental and numerical studies of the fuel
spray characteristics of direct injection engines. The macroscopic and microscopic
characteristics of the fuel spray have been studied by using optical diagnostic technologies and
numerical approaches. Improved physical-numerical spray models have been developed and
validated. The main conclusions of this study are stated in the following paragraphs.
8.1.1 Spray Characteristics of GDI Engines
The effects of injection pressure, injection duration and different injector nozzle machining
methods on the spray characteristics of the GDI engine have been investigated in this study.
The results show that higher injection pressure will increase the penetration length and enhance
the spray atomization process. However, the spray angle is almost independent of the injection
pressure. The injection duration does not affect the spray penetration and atomization
performance at the initial stage of the injection. However, after the initial stage, longer
penetration length, higher droplet velocity and greater droplet size are found with the increase
of the injection duration. The spray angle is almost independent of the injection duration. With
175
the increase of the distance downwards of the nozzle, the droplet velocity decreases gradually,
while the droplet size decreases first and then increases slightly at a far distance. Compared to
the EDM injector, the LD injector shows a reduced penetration, larger spray angle and smaller
spray droplet size at all test conditions. The laser drilled injector nozzle can promote the spray
atomization performance due to its sharp inlet edge and fine inner surface produced by the laser
machining technology. The enhanced turbulence effect induced by the nozzle’s sharp inlet edge
plays an important role in accelerating the spray breakup and atomization processes. From this
study it is believed that the turbulence effect plays an important role in affecting the spray
breakup and atomization in GDI engines.
8.1.2 Spray Characteristics of Diesel Engines
The spray characteristics of the diesel engine have been experimentally investigated by using
optical approaches such as high-speed photography and PDPA measurement. The effects of
injection pressure, ambient pressure, different fuels including gasoline, diesel and their blends
– dieseline; and the gasoline/diesel blending ratio, on the spray characteristics have been
studied in detail. It is shown that for all the tested fuels, increasing the ambient pressure will
decrease the spray penetration and enhance the atomization and breakup quality; while raising
the injection pressure will increase the penetration length and improve the atomization and
breakup performance. It is believed that higher injection pressure and ambient pressure will
lead to stronger turbulence, cavitation and aerodynamic force; which will promote the spray
atomization process. Compared to pure diesel, the recently developed dieseline fuel shows
many advantages in terms of enhancing the spray atomization process. It is found that a reduced
penetration and a better atomization quality can be achieved by increasing the proportion of
176
gasoline in the dieseline fuel; due to its stronger cavitation phenomenon, higher volatility,
lower surface tension and lower viscosity.
8.1.3 Gasoline Spray Model Development and Validation
The injection parameters, fuel properties, sac design, lower L/D aspect ratios in the nozzle hole
and stronger spray jet interactions make the turbulence and vortices of the fuel spray of the
GDI engine differ from those of the diesel engine. The proposed TL-KHRT model improves
the simulation accuracy by employing a new droplet breakup mechanism based on the research
that the droplet formation is mainly linked to the ligament evolution during the turbulent
breakup process. The new model is validated with the high-speed imaging and PDPA
experiments; the simulation result shows good agreement with the experiment data. Turbulence
from the nozzle has proved to play an important role in spray breakup and enhances the spray
atomization process. By applying the turbulence-ligament breakup mechanism into the spray
model, significant improvements of the spray simulation can be achieved. Ligament formation
and breakup, due to the turbulence-induced instability along the liquid surface, are the main
causes of the primary breakup of the fuel spray. By employing the new droplet generation
mechanism, the child droplet size of the new breakup model is proved to be closer to the
experimental data than that of the original KHRT model. The spray characteristics such as
spray penetration, droplet velocity, droplet AMD and SMD can be precisely predicted by the
proposed TL-KHRT model. The proposed TL-KHRT model is an effective supplement to the
original KHRT breakup model as it considers the turbulence and ligament evolution during the
spray aromatization process. The development of this model helps to achieve an accurate spray
simulation in GDI engines.
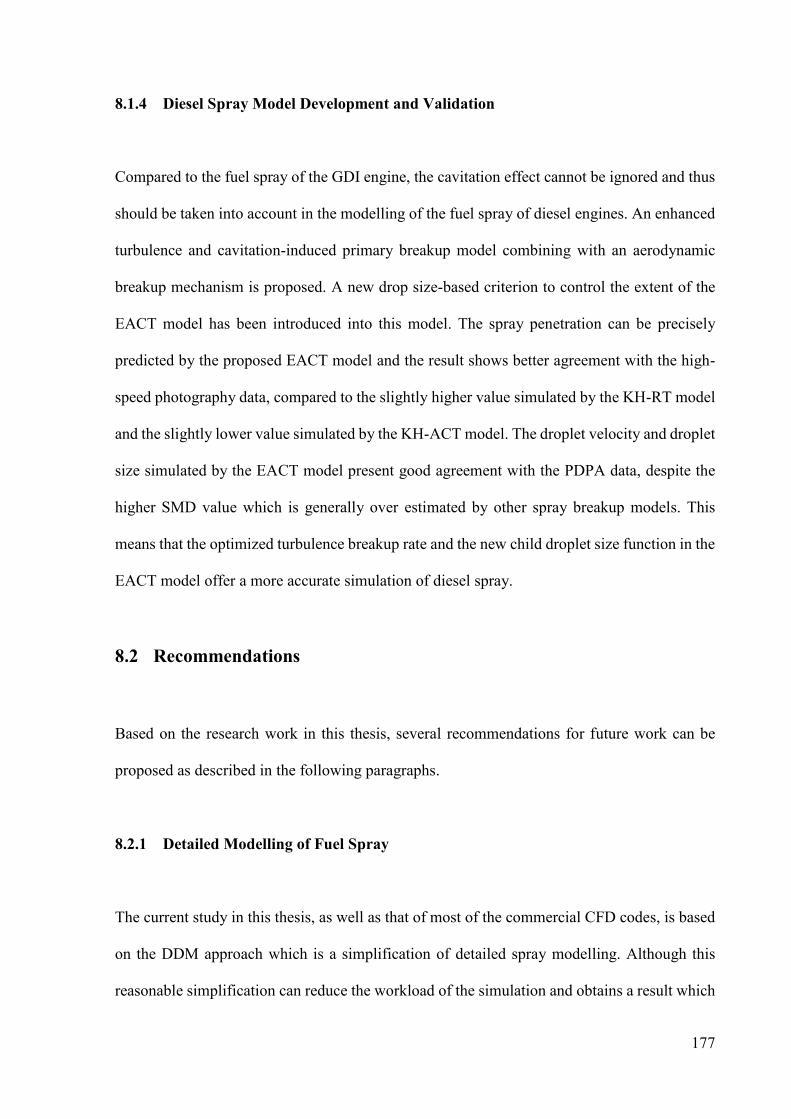
177
8.1.4 Diesel Spray Model Development and Validation
Compared to the fuel spray of the GDI engine, the cavitation effect cannot be ignored and thus
should be taken into account in the modelling of the fuel spray of diesel engines. An enhanced
turbulence and cavitation-induced primary breakup model combining with an aerodynamic
breakup mechanism is proposed. A new drop size-based criterion to control the extent of the
EACT model has been introduced into this model. The spray penetration can be precisely
predicted by the proposed EACT model and the result shows better agreement with the high-
speed photography data, compared to the slightly higher value simulated by the KH-RT model
and the slightly lower value simulated by the KH-ACT model. The droplet velocity and droplet
size simulated by the EACT model present good agreement with the PDPA data, despite the
higher SMD value which is generally over estimated by other spray breakup models. This
means that the optimized turbulence breakup rate and the new child droplet size function in the
EACT model offer a more accurate simulation of diesel spray.
8.2 Recommendations
Based on the research work in this thesis, several recommendations for future work can be
proposed as described in the following paragraphs.
8.2.1 Detailed Modelling of Fuel Spray
The current study in this thesis, as well as that of most of the commercial CFD codes, is based
on the DDM approach which is a simplification of detailed spray modelling. Although this
reasonable simplification can reduce the workload of the simulation and obtains a result which
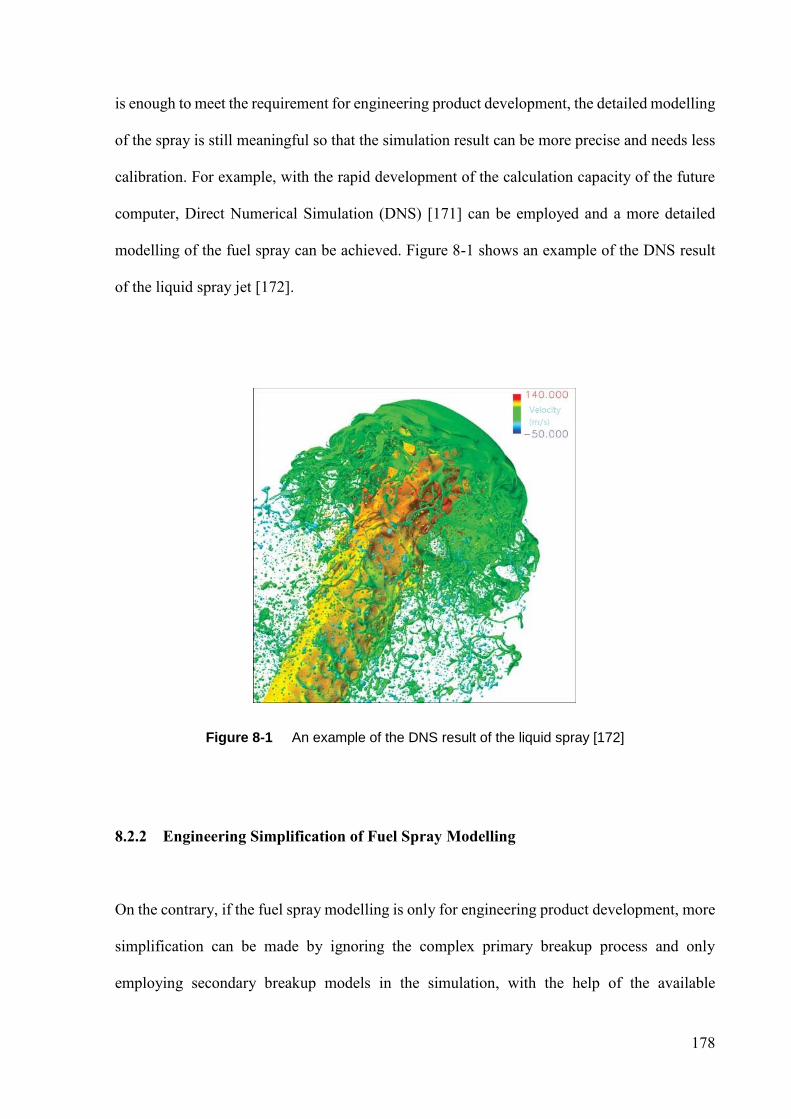
178
is enough to meet the requirement for engineering product development, the detailed modelling
of the spray is still meaningful so that the simulation result can be more precise and needs less
calibration. For example, with the rapid development of the calculation capacity of the future
computer, Direct Numerical Simulation (DNS) [171] can be employed and a more detailed
modelling of the fuel spray can be achieved. Figure 8-1 shows an example of the DNS result
of the liquid spray jet [172].
Figure 8-1 An example of the DNS result of the liquid spray [172]
8.2.2 Engineering Simplification of Fuel Spray Modelling
On the contrary, if the fuel spray modelling is only for engineering product development, more
simplification can be made by ignoring the complex primary breakup process and only
employing secondary breakup models in the simulation, with the help of the available

179
experiment data. For example, the spray droplet size and velocity measured by the PDPA
system can be used as the input for the engine simulation; thus the primary breakup process
can be replaced by these experiment data. In this way, the saved computation power can be
used for the secondary breakup process, combustion and emissions modelling.
8.2.3 Supercritical Spray Modelling
With the development of the concept of a high density combustion engine [173], supercritical
spray has started to become of concern recently. An example of supercritical spray is shown in
Figure 8-2. However, the modelling of the spray under a supercritical condition is distinctly
different from that of the traditional spray, due to the special property of the fuel; the classical
spray atomization and the breakup theory under this particular condition are questionable [174].
Figure 8-2 An example of supercritical spray [135]
180
APPENDIX A
Model Parameters of the TL-KHRT model:
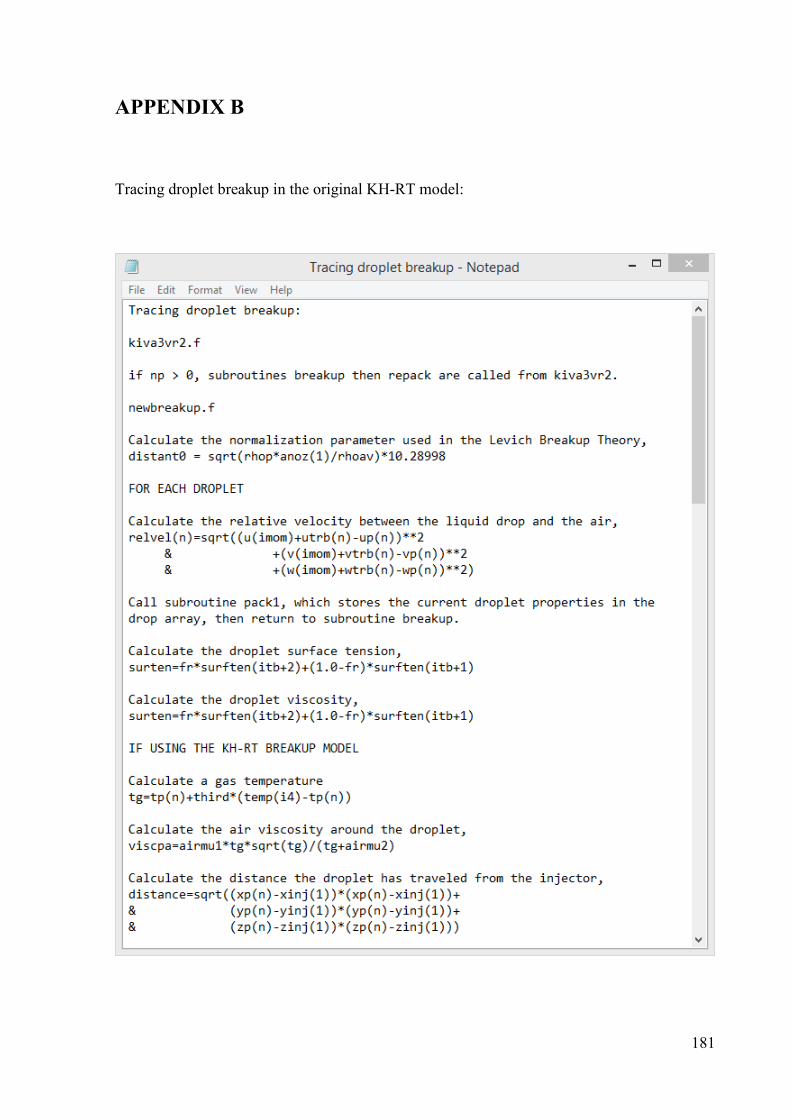
181
APPENDIX B
Tracing droplet breakup in the original KH-RT model:
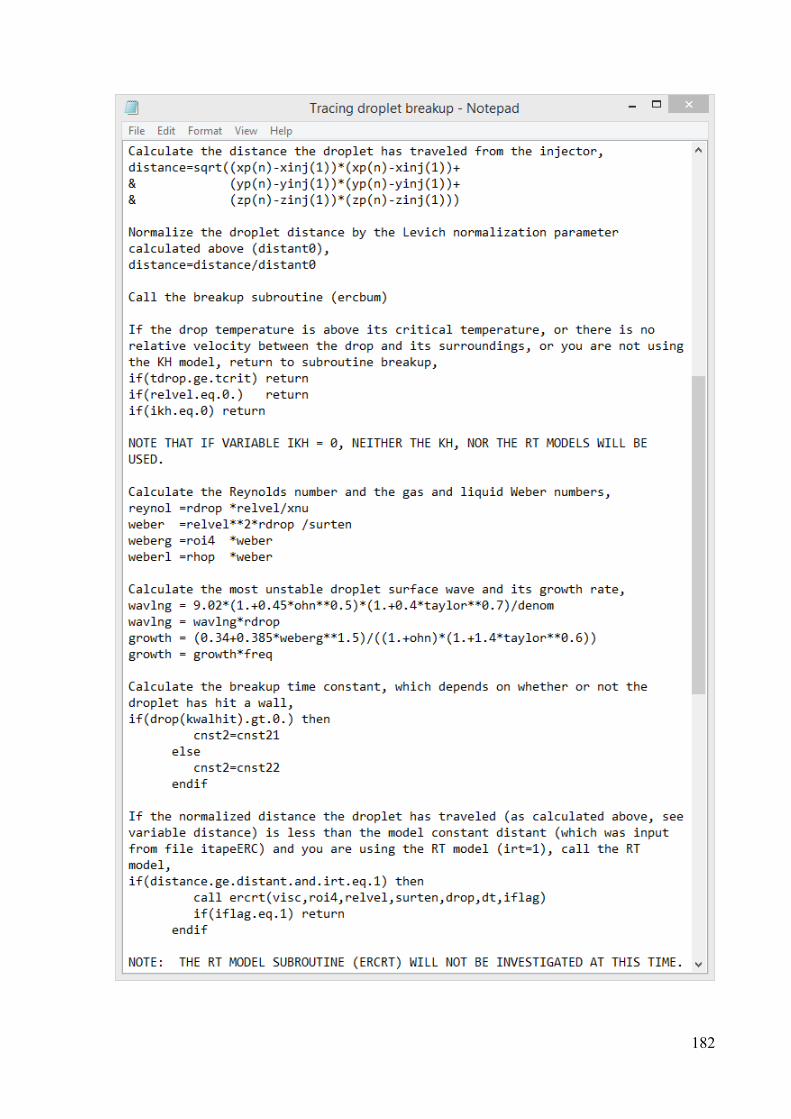
182
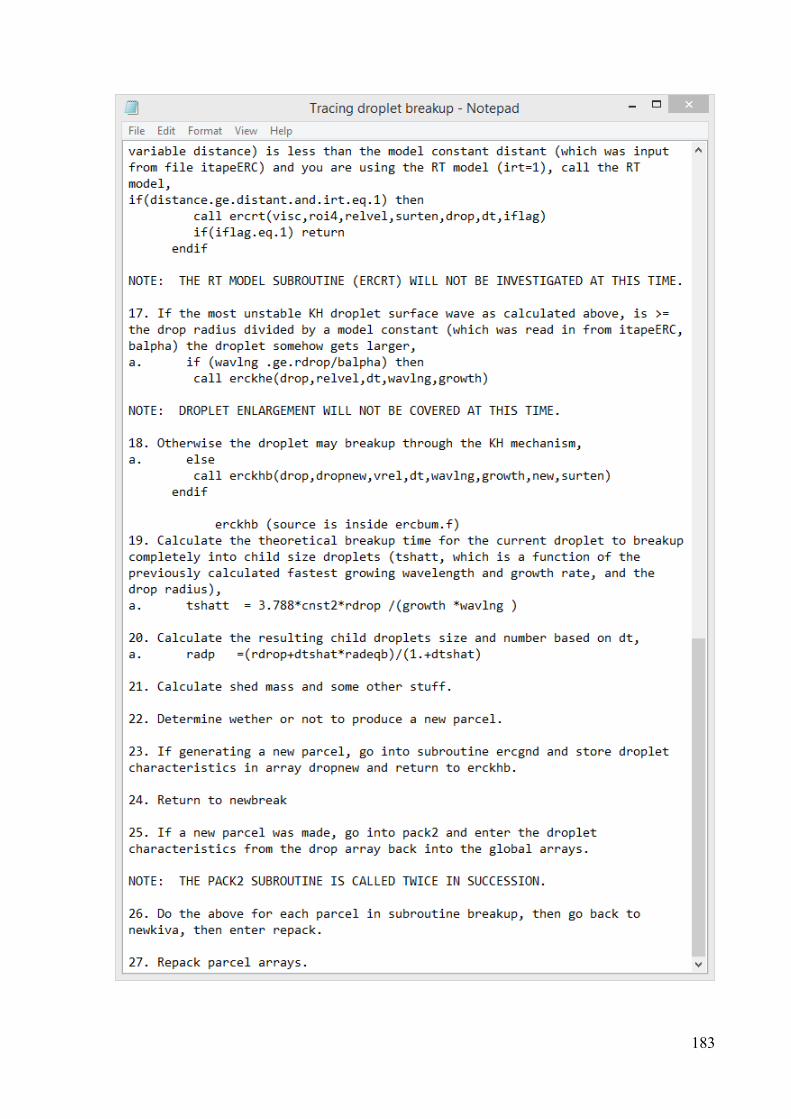
183
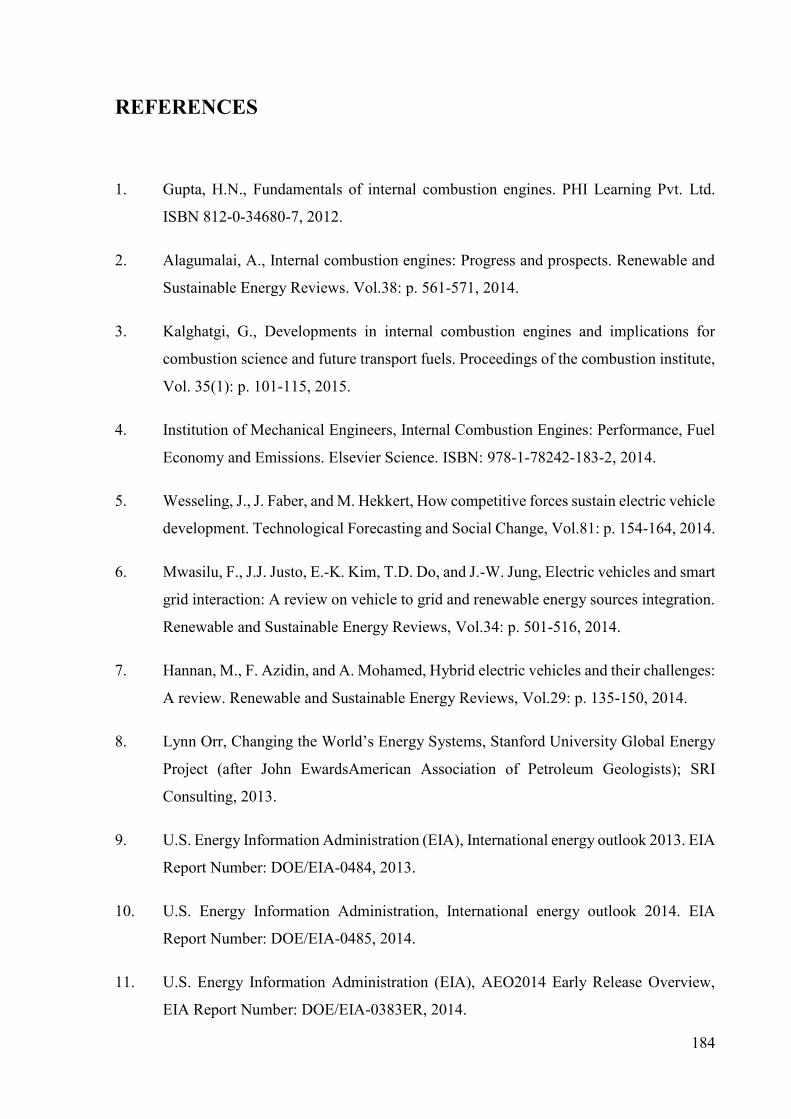
184
REFERENCES
1. Gupta, H.N., Fundamentals of internal combustion engines. PHI Learning Pvt. Ltd.
ISBN 812-0-34680-7, 2012.
2. Alagumalai, A., Internal combustion engines: Progress and prospects. Renewable and
Sustainable Energy Reviews. Vol.38: p. 561-571, 2014.
3. Kalghatgi, G., Developments in internal combustion engines and implications for
combustion science and future transport fuels. Proceedings of the combustion institute,
Vol. 35(1): p. 101-115, 2015.
4. Institution of Mechanical Engineers, Internal Combustion Engines: Performance, Fuel
Economy and Emissions. Elsevier Science. ISBN: 978-1-78242-183-2, 2014.
5. Wesseling, J., J. Faber, and M. Hekkert, How competitive forces sustain electric vehicle
development. Technological Forecasting and Social Change, Vol.81: p. 154-164, 2014.
6. Mwasilu, F., J.J. Justo, E.-K. Kim, T.D. Do, and J.-W. Jung, Electric vehicles and smart
grid interaction: A review on vehicle to grid and renewable energy sources integration.
Renewable and Sustainable Energy Reviews, Vol.34: p. 501-516, 2014.
7. Hannan, M., F. Azidin, and A. Mohamed, Hybrid electric vehicles and their challenges:
A review. Renewable and Sustainable Energy Reviews, Vol.29: p. 135-150, 2014.
8. Lynn Orr, Changing the World’s Energy Systems, Stanford University Global Energy
Project (after John EwardsAmerican Association of Petroleum Geologists); SRI
Consulting, 2013.
9. U.S. Energy Information Administration (EIA), International energy outlook 2013. EIA
Report Number: DOE/EIA-0484, 2013.
10. U.S. Energy Information Administration, International energy outlook 2014. EIA
Report Number: DOE/EIA-0485, 2014.
11. U.S. Energy Information Administration (EIA), AEO2014 Early Release Overview,
EIA Report Number: DOE/EIA-0383ER, 2014.
185
12. U.S. Energy Information Administration (EIA), Energy Information Administration,
Monthly Energy Review, May, 2014.
13. Reitz, R.D., Directions in internal combustion engine research. Combustion and Flame,
Vol.160(1): p. 1-8, 2013.
14. Ryley, T. and L. Chapman, Transport, Climate Change and the Environment. The
SAGE Handbook of Transport Studies, p. 412, 2013.
15. Xinhuanet, Air pollution reports, 2013, Available from: <http://news.xinhuanet.com/
politics/2013-01/14/c_124225848.htm> [20 March 2015].
16. Commission, E., Transport & Environment, Source available from: <http://ec.europa.
eu/environment /air/transport/road.htm> [20 March 2015].
17. Transportation, I.C.o.C., EU CO2 emission standards for passenger cars and light-
commercial vehicles. 2015.
18. David Sedgwick, Automotive News January 11, 2011. Available from <http://www.
autonews.com/article/20110111/OEM06/1101098/direct-injection-gains-momentum>
[20 March 2015].
19. Park, C., S. Kim, H. Kim, and Y. Moriyoshi, Stratified lean combustion characteristics
of a spray-guided combustion system in a gasoline direct injection engine. Energy, Vol.
41(1): p. 401-407, 2012.
20. Zhao, H., Overview of gasoline direct injection engines. Advanced Direct Injection
Combustion Engine Technologies and Development: Gasoline and Gas Engines, p. 1,
2014.
21. Zhao, H., Direct injection gasoline engines with autoignition combustion. Advanced
Direct Injection Combustion Engine Technologies and Development: Gasoline and Gas
Engines, p. 133, 2014.
22. Zhao, H., Advanced Direct Injection Combustion Engine Technologies and
Development: Diesel Engines. Elsevier Vol. 2, 2009.
186
23. Pereira, C., Atomization and Combustion of Liquids. Masters thesis, Instituto Superior
Técnico, Lisboa, Portugal, 2012.
24. O’Rourke, P. and F. Bracco, Modelling of drop interactions in thick sprays and a
comparison with experiments. Proceedings of the Institution of Mechanical Engineers,
p. 101-106, 1980.
25. Baumgarten, C., Mixture formation in internal combustion engines. Springer, 2006.
26. Faeth, G.M., L.P. Hsiang, and P.K. Wu, Structure and breakup properties of sprays.
International Journal of Multiphase Flow, Vol. 21, Supplement(0): p. 99-127, 1995.
27. O'Rourke, P.J., Collective drop effects on vaporizing liquid sprays. Los Alamos
National Lab., NM (USA). Report Number(s): LA-9069-T ON: DE82010958, 1981.
28. Hiroyasu, H. and M. Arai, Structures of fuel sprays in diesel engines. SAE Technical
Paper 900475, 1990.
29. Klein-Douwel, R., P. Frijters, X. Seykens, L. Somers, and R. Baert, Gas Density and
Rail Pressure Effects on Diesel Spray Growth from a Heavy-Duty Common Rail
Injector†. Energy & Fuels, Vol. 23(4): p. 1832-1842, 2008.
30. Klein-Douwel, R., P. Frijters, L. Somers, W. De Boer, and R. Baert, Macroscopic diesel
fuel spray shadowgraphy using high speed digital imaging in a high pressure cell. Fuel,
Vol. 86(12): p. 1994-2007, 2007.
31. Naber, J.D. and D.L. Siebers, Effects of gas density and vaporization on penetration
and dispersion of diesel sprays. SAE Technical Paper 960034, 1996.
32. Yule, A.J., P.R. Ereaut, and A. Ungut, Droplet sizes and velocities in vaporizing sprays.
Combustion and Flame, Vol. 54(1–3): p. 15-22, 1983.
33. Zhao, H. and N. Ladommatos, Engine combustion instrumentation and diagnostics.
Warrendale, PA: Society of Automotive Engineers, p. 842, 2001.
34. Araneo, L., V. Soare, R. Payri, and J. Shakal. Setting up a PDPA system for
measurements in a Diesel spray. in Journal of Physics: Conference Series, IOP
Publishing, 2006.

187
35. Tian, G., H. Li, H. Xu, Y. Li, and M. Satish, Spray characteristics study of DMF using
phase doppler particle analyzer. SAE Int. J. Passeng. Cars – Mech. Syst. 3(1):948-958,
2010.
36. Li, H., li, C., Ma, X., TU, P. et al., Numerical Study of DMF and Gasoline Spray and
Mixture Preparation in a GDI Engine, SAE Technical Paper 2013-01-1592, 2013.
37. Dantec-Dynamics, BSA Flow Software Version 4.10 Installation & User's Guide. 10th
ed, 2006.
38. Hiroyasu, H., M. Arai, and M. Tabata, Empirical equations for the Sauter mean
diameter of a Diesel spray. SAE Technical Paper 890464, 1989.
39. Estes, K.A. and I. Mudawar, Correlation of Sauter mean diameter and critical heat flux
for spray cooling of small surfaces. International Journal of Heat and Mass Transfer,
Vol. 38(16): p. 2985-2996, 1995.
40. Su, T., C. Chang, R.D. Reitz, P. Farrell, A. Pierpont, and T. Tow, Effects of injection
pressure and nozzle geometry on spray SMD and DI emissions. SAE Technical Paper
952360, 1995.
41. Sauter, J., Die Grössenbestimmung der im Gemischnebel von Verbrennung
skraftmaschinen vorhandenen Brennstoffteilchen. VDI-Verlag, 1926.
42. DeJuhasz, K.J., Dispersion of sprays in solid injection oil engines. Trans. ASME, Vol.
53: p. 65-77, 1931.
43. Castleman, R., The mechanism of atomization accompanying solid injection. US
Government Printing Office, 1932.
44. Hiroyasu, H. Diesel engine combustion and its modeling. in Proceedings of 1st
International Symposium on Diagnostics and Modeling of Combustion in internal
Combustion Engines. Tokyo, Japan. 1985.
45. Hiroyasu, H., M. Shimizu, and M. Arai. The breakup of high speed jet in a high pressure
gaseous atmosphere. in Proc. 2nd Int. Conf. on Liquid Atomization and Spray Systems.
1982.

188
46. Arai, M., M. Tabata, H. Hiroyasu, and M. Shimizu, Disintegrating process and spray
characterization of fuel jet injected by a diesel nozzle. SAE Technical Paper 840275,
1984.
47. Chehroudi, B., S.-H. Chen, F.V. Bracco, and Y. Onuma, On the intact core of full-cone
sprays. SAE Technical Paper 850126, 1985.
48. Wakuri, Y., M. Fujii, T. Amitani, and R. Tsuneya, Studies on the penetration of fuel
spray in a diesel engine. Bulletin of JSME, p. 123-130, 1960. 3(9).
49. Reitz, R.D. and F. Bracco, On the dependence of spray angle and other spray parameters
on nozzle design and operating conditions. SAE Technical Paper 790494, 1979.
50. Hiroyasu, H. and M. Arai, Fuel spray penetration and spray angle in diesel engines.
Trans. JSAE, Vol. 21(5): p. 11, 1980.
51. Ruiz, F. and N. Chigier, The effects of design and operating conditions of fuel injectors
on flow and atomization. SAE Technical Paper 870100, 1987.
52. Siebers, D.L., Liquid-phase fuel penetration in diesel sprays. SAE Technical Paper
980809, 1998.
53. Hiroyasu, H. and T. Kadota, Fuel droplet size distribution in diesel combustion chamber.
SAE Technical Paper 740715, 1974.
54. Dodge, L.G., D.J. Rhodes, and R.D. Reitz, Drop-size measurement techniques for
sprays: comparison of Malvern laser-diffraction and Aerometrics phase/Doppler.
Applied Optics, Vol. 26(11): p. 2144-2154, 1987.
55. Tabata, M., M. Arai, and H. HlROYASU, Atomization of high viscosity liquid by a
diesel nozzle. Bulletin of JSME, Vol. 29(252): p. 1795-1802, 1986.
56. Reitz, R.D., Atomization and other breakup regimes of a liquid jet. PhD thesis, 1978.
57. Reitz, R. and F. Bracco, Mechanism of atomization of a liquid jet. Physics of Fluids, p.
1730, 1982.
58. Tanner, F., Liquid jet atomization and droplet breakup modeling of non-evaporating
diesel fuel sprays. SAE Technical Paper 970050, 1997.
189
59. Hwang, S., Z. Liu, and R.D. Reitz, Breakup mechanisms and drag coefficients of high-
speed vaporizing liquid drops. Atomization and sprays, 1996.
60. Reitz, R.D., Modeling atomization processes in high-pressure vaporizing sprays.
Atomisation Spray Technology, p. 309-337, 1987.
61. Lin, S. and R. Reitz, Drop and spray formation from a liquid jet. Annual Review of
Fluid Mechanics, Vol. 30(1): p. 85-105, 1998.
62. Chigier, N. and R.D. Reitz, Regimes of jet breakup and breakup mechanisms- Physical
aspects. Recent advances in spray combustion: Spray atomization and drop burning
phenomena., p. 109-135, 1996.
63. Krzeczkowski, S.A., Measurement of liquid droplet disintegration mechanisms.
International Journal of Multiphase Flow, p. 227-239, 1980.
64. Liu, A.B. and R.D. Reitz, Mechanisms of air-assisted liquid atomization. Atomization
and sprays, 1993.
65. White, F.M. and I. Corfield, Viscous fluid flow. McGraw-Hill New York, Vol. 3, 1991.
66. Joseph, D.D., Stability of fluid motions. I, II. NASA STI/Recon Technical Report A,
Vol. 77: p. 12423, 1976.
67. Bekdemir, C., L. Somers, and L. de Goey, Numerical modeling of diesel spray
formation and combustion. PhD Thesis, Eindhoven University of Technology,
Netherlands, 2008.
68. Ranz WE. On Sprays and Spraying. Department of Engineering Research.
Pennsylvania State University. Bulletin, 1956.
69. Ohnesorge, W.V., Die bildung von tropfen an düsen und die auflösung flüssiger
strahlen. ZAMM‐Journal of Applied Mathematics and Mechanics/Zeitschrift für
Angewandte Mathematik und Mechanik, Vol. 16(6): p. 355-358, 1936.
70. Torda, T., Evaporation of drops and breakup of sprays. Astronautica Acta, p. 383-393,
1973.
190
71. Amsden, A.A., P. Orourke, and T. Butler, KIVA-2: A computer program for chemically
reactive flows with sprays. NASA STI/recon technical report N, p. 27975, 1989.
72. Amsden, A.A., KIVA-3V: A block-structured KIVA program for engines with vertical
or canted valves. Los Alamos National Lab., NM (United States), 1997.
73. Amsden, A.A., KIVA-3: A KIVA program with block-structured mesh for complex
geometries. Los Alamos National Lab., NM (United States), 1993.
74. Schweitzer, P., Mechanism of disintegration of liquid jets. Journal of Applied Physics,
p. 513-521, 1937.
75. Grant, R.P. and S. Middleman, Newtonian jet stability. AIChE Journal, p. 669-678,
1966.
76. Phinney, R.E., The breakup of a turbulent liquid jet in a gaseous atmosphere. Journal
of Fluid Mechanics, Vol. 60(04): p. 689-701, 1973.
77. Ruff, G., L. Bernal, and G. Faeth, Structure of the near-injector region of
nonevaporating pressure-atomized sprays. Journal of Propulsion and Power, Vol. 7(2):
p. 221-230, 1991.
78. Tseng, L.-K., G. Ruff, and G. Faeth, Effects of gas density on the structure of liquid
jets in still gases. AIAA journal, Vol. 30(6): p. 1537-1544, 1992.
79. Wu, P.-K., R. Miranda, and G. Faeth, Effects of initial flow conditions on primary
breakup of nonturbulent and turbulent round liquid jets. Atomization and sprays, 1995.
80. Huh KY, G.A., A Phenomenological Model of Diesel Spray Atomization. Proc Int Conf
on Multiphase Flows ’91, Tsukuba, Japan, 1991.
81. Bergwerk, W., Flow pattern in diesel nozzle spray holes. Proceedings of the Institution
of Mechanical Engineers, Vol. 173(1): p. 655-660, 1959.
82. Tamaki, N., M. Shimizu, and H. Hiroyasu, Enhancement of the atomization of a liquid
jet by cavitation in a nozzle hole. Atomization and sprays, 2001.
83. Tamaki, N., M. Shimizu, K. Nishida, and H. Hiroyasu, Effects of cavitation and internal
flow on atomization of a liquid jet. Atomization and sprays, 1998.
191
84. Park, B.S. and S.Y. Lee, An experimental investigation of the flash atomization
mechanism. Atomization and sprays, 1994.
85. Giffen, E. and A. Muraszew, The atomisation of liquid fuels. Champman & Hall, 1953.
86. Rupe, J., Jet Properties. Liquid Propellant Rocket Combustion Instability, NASA SP-
194, National Aeronautics and Space Administration, Washington DC, 1972.
87. Shkadov, V.Y., Wave formation on surface of viscous liquid due to tangential stress.
Fluid Dynamics, p. 473-476, 1970.
88. Pilch, M. and C. Erdman, Use of breakup time data and velocity history data to predict
the maximum size of stable fragments for acceleration-induced breakup of a liquid drop.
International Journal of Multiphase Flow, Vol. 13(6): p. 741-757, 1987.
89. Wierzba, A., Deformation and breakup of liquid drops in a gas stream at nearly critical
Weber numbers. Experiments in Fluids, p. 59-64, 1990.
90. Williams, F., Combustion theory: the fundamental theory of chemically reacting flow
systems, Benjamin/Cummings Publishing Company, Inc., 1985.
91. Amsden, A.A., L.A.N. Laboratory, and P.J. O'Rourke, KIVA-II, a Computer Program
for Chemically Reactive Flows with Sprays. Los Alamos National Laboratory, 1989.
92. Dukowicz, J.K., A particle-fluid numerical model for liquid sprays. Journal of
Computational Physics, Vol. 35(2): p. 229-253, 1980.
93. Reitz, R.D., A photographic study of flash-boiling atomization. Aerosol Science and
Technology, Vol. 12(3): p. 561-569, 1990.
94. Modeling Spray and Mixture Formation, in Mixture Formation in Internal Combustion
Engine. Springer Berlin Heidelberg. p. 85-210, 2006.
95. Launder, B.E. and D. Spalding, The numerical computation of turbulent flows.
Computer methods in applied mechanics and engineering, p. 269-289, 1974.
96. Arcoumanis, C., M. Gavaises, and B. French, Effect of fuel injection processes on the
structure of diesel sprays. SAE Technical Paper 970799, 1997.
192
97. Som, S., Ramirez, A., Aggarwal, S., Kastengren, A. et al., "Development and
Validation of a Primary Breakup Model for Diesel Engine Applications," SAE
Technical Paper 2009-01-0838, 2009.
98. O'Rourke, P.J. and A.A. Amsden, The TAB method for numerical calculation of spray
droplet breakup. Los Alamos National Lab., NM (USA), 1987.
99. Beale, J.C. and R.D. Reitz, Modeling spray atomization with the Kelvin-
Helmholtz/Rayleigh-Taylor hybrid model. Atomization and sprays, 1999.
100. Rayleigh, On the instability of jets, University Press, Scientific Papers Vol. 3: 1887-
1892, 1902.
101. Patterson, M.A. and R.D. Reitz, Modeling the Effects of Fuel Spray Characteristics on
Diesel Engine Combustion and Emission. SAE Technical Paper 980131, 1998.
102. Belardini, P., C. Bertoli, and M. Cameretti, Numerical analysis of the influence of the
jet breakup model formulation on diesel engine combustion computations. Atomization
and sprays, 1998.
103. Bianchi, G., P. Pelloni, F. Corcione, L. Allocca, and F. Luppino, Modeling atomization
of high-pressure diesel sprays. Journal of engineering for gas turbines and power, Vol.
123(2): p. 419-427, 2001.
104. Som, S. and S. Aggarwal, Effects of primary breakup modeling on spray and
combustion characteristics of compression ignition engines. Combustion and Flame,
Vol. 157(6): p. 1179-1193, 2010.
105. Amsden, A.A., KIVA-3V, release 2, improvements to KIVA-3V. Los Alamos National
Laboratory, Los Alamos, NM, Report No. LA-UR-99-915, 1999.
106. Amsden, A.A., P. O'rourke, and T. Butler, KIVA-II: A computer program for
chemically reactive flows with sprays. Los Alamos National Lab., NM (USA), 1989.
107. EnSight Ltd, CFD post-processing visualization and meshing tool, Manual, 2003.
108. Iwamoto, Y., K. Noma, O. Nakayama, T. Yamauchi, and H. Ando, Development of
gasoline direct injection engine. SAE Technical Paper 970541, 1997.
193
109. Zhao, F., D.L. Harrington, and M.-C.D. Lai, Automotive gasoline direct-injection
engines. Internal Combustion Engines, p. 02-12, 2014.
110. Binder, A., R. Ecker, A. Glaser, and K. Müller, Gasoline direct injection, in Gasoline
Engine Management. Springer. p. 110-121, 2015.
111. Trinidad, O., Gasoline Direct Injection. Southern Illinois University Carbondale,
Spring 3, 2011.
112. Zhao, F., M.-C. Lai, and D.L. Harrington, Automotive spark-ignited direct-injection
gasoline engines. Progress in energy and combustion science, Vol. 25(5): p. 437-562,
1999.
113. North Hills Automotive, Greenville, S., Why Cleaning Fuel Induction/Injection
Systems Is So Important! October, 2013.
114. Alkidas, A.C., Combustion advancements in gasoline engines. Energy Conversion and
Management, Vol. 48(11): p. 2751-2761, 2007.
115. Preussner, C., C. Döring, S. Fehler, and S. Kampmann, GDI: interaction between
mixture preparation, combustion system and injector performance. SAE Technical
Paper 980498, 1998.
116. Kawajiri, K., T. Yonezawa, H. Ohuchi, M. Sumida, and H. Katashiba, Study of
interaction between spray and air motion, and spray wall impingement. SAE Technical
Paper 2002-01-0836, 2002.
117. Mitroglou, N., J. Nouri, M. Gavaises, and C. Arcoumanis, Spray characteristics of a
multi-hole injector for direct-injection gasoline engines. International Journal of Engine
Research, p. 255-270, 2006. 7(3).
118. Georjon, T., E. Bourguignon, T. Duverger, B. Delhaye, and P. Voisard, Characteristics
of mixture formation and combustion in a spray-guided concept gasoline direct
injection engine: an experimental and numerical approach. SAE Technical Paper 2000-
01-0534, 2000.
194
119. Honda, T., M. Kawamoto, H. Katashiba, M. Sumida, N. Fukutomi, and K. Kawajiri, A
study of mixture formation and combustion for spray guided DISI. SAE Technical
Paper 2004-01-0046, 2004.
120. Peterson, B., D.L. Reuss, and V. Sick, On the ignition and flame development in a
spray-guided direct-injection spark-ignition engine. Combustion and Flame, Vol.
161(1): p. 240-255, 2014.
121. Breuninger, T., J. Schmidt, H. Tschoeke, M. Hese, A. Kufferath, and F. Altenschmidt,
Optical Investigations of the Ignition-Relevant Spray Characteristics from a Piezo-
Injector for Spray-Guided Spark-Ignited Engines. SAE Int. J. Engines 8(1):89-100,
2015.
122. Whitaker, P., P. Kapus, M. Ogris, and P. Hollerer, Measures to Reduce Particulate
Emissions from Gasoline DI engines. SAE Int. J. Engines 4(1):1498-1512, 2011.
123. Romoli, L., C.A.A. Rashed, and M. Fiaschi, Experimental characterization of the inner
surface in micro-drilling of spray holes: A comparison between ultrashort pulsed laser
and EDM. Optics & Laser Technology, Vol. 56(0): p. 35-42, 2014.
124. Smits, A.J., A physical introduction to fluid mechanics. John Wiley, 2000.
125. Dodge, L., Fuel preparation requirements for direct-injected spark-ignition engines.
SAE Technical Paper 962015, 1996.
126. Echouchene, F., H. Belmabrouk, L. Le Penven, and M. Buffat, Numerical simulation
of wall roughness effects in cavitating flow. International Journal of Heat and Fluid
Flow, Vol. 32(5): p. 1068-1075, 2011.
127. Kalghatgi, G.T., P. Risberg, and H.-E. Ångström, Partially Pre-Mixed Auto-Ignition of
Gasoline to Attain Low Smoke and Low NOx at High Load in a Compression Ignition
Engine and Comparison with a Diesel Fuel. SAE Technical Paper 2007-01-0006, 2007.
128. Ciatti, S. and S.N. Subramanian, An experimental investigation of low-octane gasoline
in diesel engines. Journal of engineering for gas turbines and power, Vol. 133(9): p.
092802, 2011.
195
129. Manente, V., P. Tunestål, and B. Johansson. Half load partially premixed combustion,
PPC, with high octane number fuels. Gasoline and ethanol compared with diesel. in
Symposium on International Automotive Technology: SIAT, 2009.
130. Zhang, F., H. Xu, J. Zhang, G. Tian, and G. Kalghatgi, Investigation into light duty
dieseline fuelled partially-premixed compression ignition engine. SAE Int. J. Engines
4(1):2124-2134, 2011.
131. Zhang, F., H. Xu, S.Z. Rezaei, G. Kalghatgi, and S.-J. Shuai, Combustion and emission
characteristics of a PPCI engine fuelled with dieseline. SAE Technical Paper 2012-01-
1138, 2012.
132. Zeraati Rezaei, S., F. Zhang, H. Xu, A. Ghafourian, J.M. Herreros, and S. Shuai,
Investigation of two-stage split-injection strategies for a Dieseline fuelled PPCI engine.
Fuel, Vol. 107: p. 299-308, 2013.
133. Turner, D., G. Tian, H. Xu, M.L. Wyszynski, and E. Theodoridis, An experimental
study of dieseline combustion in a direct injection engine. SAE Technical Paper 2009-
01-1101, 2009.
134. Weall, A. and N. Collings, Investigation into partially premixed combustion in a light-
duty multi-cylinder diesel engine fuelled with a mixture of gasoline and diesel. SAE
Technical Paper 2007-01-4058, 2007.
135. Han, D., A.M. Ickes, S.V. Bohac, Z. Huang, and D.N. Assanis, Premixed low-
temperature combustion of blends of diesel and gasoline in a high speed compression
ignition engine. Proceedings of the combustion institute, Vol. 33(2): p. 3039-3046,
2011.
136. Kalghatgi, G., L. Hildingsson, and B. Johansson, Low NOx and Low Smoke Operation
of a Diesel Engine Using Gasolinelike Fuels. Journal of engineering for gas turbines
and power, Vol. 132(9): p. 092803-092803, 2010.
137. Pickett, L.M. and D.L. Siebers, Soot in diesel fuel jets: effects of ambient temperature,
ambient density, and injection pressure. Combustion and Flame, Vol. 138(1): p. 114-
135, 2004.
196
138. Pickett, L. and D. Siebers, Non-Sooting, Low Flame Temperature Mixing-Controlled
DI Diesel Combustion. Combustion Research Facility, Sandia National Laboratories
(US), 2003.
139. Payri, R., A. García, V. Domenech, R. Durrett, and A.H. Plazas, An experimental study
of gasoline effects on injection rate, momentum flux and spray characteristics using a
common rail diesel injection system. Fuel, Vol. 97: p. 390-399, 2012.
140. Smallwood, G. and O. Gulder, Views on the structure of transient diesel sprays.
Atomization and sprays, p. 355-386, 2000.
141. Gulder, O.L. and G. Smallwood. Time-resolved structure of full cone diesel sprays.
Proceedings of the Second International Workshop on Advanced Spray Combustion.
1998.
142. Lee, C.S. and S.W. Park, An experimental and numerical study on fuel atomization
characteristics of high-pressure diesel injection sprays. Fuel, Vol. 81(18): p. 2417-2423,
2002.
143. Payri, F., J. Desantes, and J. Arregle, Characterization of DI Diesel sprays in high
density conditions. SAE Technical Paper 960774, 1996.
144. Arcoumanis, C., M. Badami, H. Flora, and M. Gavaises, Cavitation in real-size, multi-
hole diesel injector nozzles. SAE Technical Paper 2000-01-1249, 2000.
145. Serras-Pereira, J., Z. Van Romunde, P. Aleiferis, D. Richardson, S. Wallace, and R.
Cracknell, Cavitation, primary break-up and flash boiling of gasoline, iso-octane and
n-pentane with a real-size optical direct-injection nozzle. Fuel, Vol. 89(9): p. 2592-
2607, 2010.
146. Lucchini, T., D'Errico, G., and Nordin, N., CFD Modelling of Gasoline Sprays, SAE
Technical Paper 2005-24-086, 2005.
147. Costa, M., B. Iorio, U. Sorge, and S. Alfuso, Assessment of a numerical model for
multi-hole gasoline sprays to be employed in the simulation of spark ignition GDI
engines with a jet-guided combustion mode. SAE Technical Paper 2009-01-1915, 2009.
197
148. Allocca, L., F.E. Corcione, A. Fusco, F. Papetti, and S. SUCCI, Modeling of diesel
spray dynamics and comparison with experiments. SAE Technical Paper 941895, 1994.
149. Park, S.W. and C.S. Lee, Investigation of atomization and evaporation characteristics
of high-pressure injection diesel spray using Kelvin—Helmholz instability/droplet
deformation and break-up competition model. Proceedings of the Institution of
Mechanical Engineers, Part D: Journal of Automobile Engineering, Vol. 218(7): p. 767-
777, 2004.
150. Li, Z.-H., B.-Q. He, and H. Zhao, Application of a hybrid breakup model for the spray
simulation of a multi-hole injector used for a DISI gasoline engine. Applied Thermal
Engineering, 2014.
151. Lai, M.-C., Y. Zheng, M. Shost, X. Xie, A. Matsumoto, J. Wang, X. Zhang, S. Moon,
J. Gao, and K. Fezzaa, Characterization of Internal flow and Spray of Multihole DI
Gasoline Spray using X-ray Imaging and CFD. SAE Technical Paper 2011-01-1881,
2011.
152. Brusiani, F., G.M. Bianchi, and A. Tiberi, Primary Breakup Model for Turbulent Liquid
Jet Based on Ligament Evolution. Diesel Engine, p. 06-18, 2012.
153. Sallam, K. and G. Faeth, Surface properties during primary breakup of turbulent liquid
jets in still air. AIAA journal, Vol. 41(8): p. 1514-1524, 2003.
154. Shinjo, J. and A. Umemura, Simulation of liquid jet primary breakup: Dynamics of
ligament and droplet formation. International Journal of Multiphase Flow, Vol. 36(7):
p. 513-532, 2010.
155. Nouri, J., N. Mitroglou, Y. Yan, and C. Arcoumanis, Internal flow and cavitation in a
multi-hole injector for gasoline direct-injection engines. SAE Technical Paper 2007-
01-1405, 2007.
156. Papoulias, D., E. Giannadakis, N. Mitroglou, M. Gavaises, and A. Theodorakakos,
Cavitation in fuel injection systems for spray-guided direct injection gasoline engines.
SAE Technical Paper 2007-01-1418, 2007.
198
157. Mitroglou, N., J. Nouri, Y. Yan, M. Gavaises, and C. Arcoumanis, Spray structure
generated by multi-hole injectors for gasoline direct-injection engines. SAE Technical
Paper 2007-01-1417, 2007.
158. Villermaux, E., P. Marmottant, and J. Duplat, Ligament-Mediated Spray Formation.
Physical Review Letters, p. 074501, 2004.
159. Beale, J.C. and R.D. Reitz, Modeling spray atomization with the Kelvin-
Helmholtz/Rayleigh-Taylor hybrid model. Atomization and sprays, p. 623-650, 1999.
160. Lee, C.S., M.S. Chon, and D.S. Kim, Spray structure and characteristics of high-
pressure gasoline injectors for direct-injection engine applications. Atomization and
sprays, 2001.
161. Lee, S. and S. Park, Experimental study on spray break-up and atomization processes
from GDI injector using high injection pressure up to 30MPa. International Journal of
Heat and Fluid Flow, p. 14-22, 2014.
162. Rotondi, R., G. Bella, C. Grimaldi, and L. Postrioti, Atomization of high-pressure diesel
spray: Experimental validation of a new breakup model. Combustion, p. 10-05, 2014.
163. Desantes, J., R. Payri, F. Salvador, and J. De la Morena, Influence of cavitation
phenomenon on primary break-up and spray behavior at stationary conditions. Fuel,
Vol. 89(10): p. 3033-3041, 2010.
164. Jing, D., H. Xu, S.-j. Shuai, Z. Wang, and Y. Li, A Turbulence and Cavitation Induced
Breakup Model for Fuel Spray Modeling. 2014, SAE Technical Paper 2014-01-2737,
2014.
165. Som, S., G. D'Errico, D. Longman, and T. Lucchini, Comparison and Standardization
of Numerical Approaches for the Prediction of Non-reacting and Reacting Diesel
Sprays. SAE Technical Paper 2012-01-1263, 2012.
166. S. Som, S.K. Aggarwal, E.M. El-Hannouny, D.E. Longman, ASME J. Eng. Gas Turb.
Power Vol. 132 (4), p. 1-12, 2010.
199
167. Som, S., D. Longman, A. Ramirez, and S. Aggarwal, A comparison of injector flow
and spray characteristics of biodiesel with petrodiesel. Fuel, Vol. 89(12): p. 4014-4024,
2010.
168. Soteriou, C., Direct Injection Diesel Spray and the Effect of Cavitation and Hydraulic
Flip or Atomization. SAE Technical Paper 950080, 1995.
169. Som, S., E. El-Hannouny, D. Longman, and S. Aggarwal, Investigation of nozzle flow
and cavitation characteristics in a diesel injector. Journal of engineering for gas turbines
and power, Vol. 132(4): p. 042802, 2010.
170. Huh, K. and A. Gosman. A phenomenological model of diesel spray atomization.
Proceedings of the international conference on multiphase flows, 1991.
171. Moin, P. and K. Mahesh, Direct numerical simulation: a tool in turbulence research.
Annual Review of Fluid Mechanics, Vol. 30(1): p. 539-578, 1998.
172. FieldView image courtesy of Dr. Matsuo, Japan Aerospace Exploration Agency, or
JAXA, 2012.
173. Maozhao, X., Mechanism and Modeling of Transcritical/Supercritical Fuel Spray and
Mixture Formation in Internal Combustion Engines. Journal of Combustion Science
and Technology, 2014.
174. Oefelein, J., R. Dahms, and G. Lacaze, Detailed modeling and simulation of high-
pressure fuel injection processes in diesel engines. SAE Int. J. Engines 5(3):1410-1419,
2012.