Embed Size (px)
Citation preview
Experimental and Simulated Runoff by the Curve Number Model
for Cassava Cropping Under Different Agricultural Practices
Recife-PE-July 130 of 2014
Cleene A. Lima, Abelardo A. A. Montenegro , Thais E. M. Santos, Adriano L.
N. Monteiro and Elisângela G. Pereira
Federal Rural
University of
Pernambuco
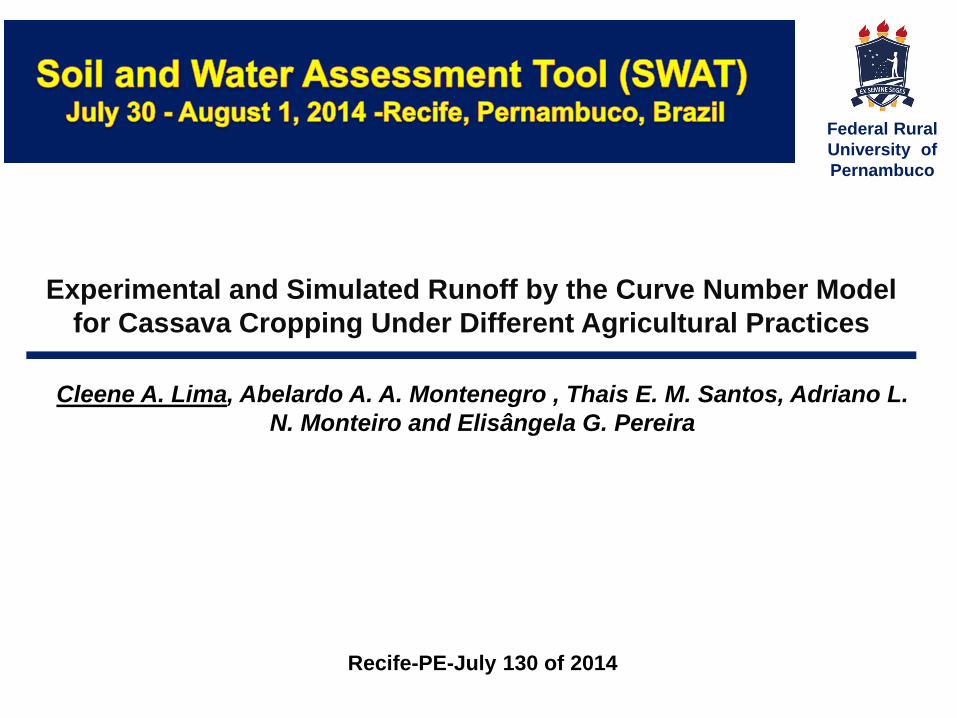
Introduction
Introduction
Hydrological models have become important planning and decision
making tools, mainly for assessing the surface runoff and the water
storage in a watershed (MUÑOZ-ROBLES et al., 2011).
Several methods have been used for runoff predictions (Rational
Method, Mac-Math Equation, Cook Equation, Curve number (CN), the
later being adopted by the Soil and Water Assessment Tool (SWAT).
Objective
This study aimed to evaluate experimental runoff produced by a rainfall
simulator and modeled by the curve number (CN) method in cassava
cropping under different agricultural practices in a Yellow Latosol.
Material and Methods
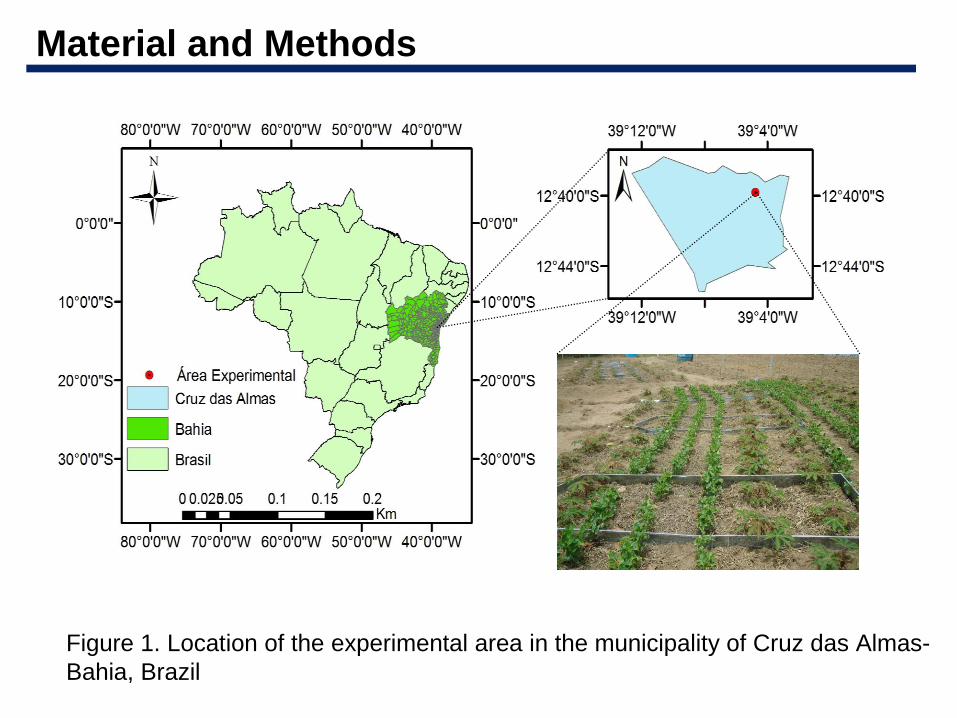
Figure 1. Location of the experimental area in the municipality of Cruz das Almas-
Bahia, Brazil
7% SLOPE
1
Material and Methods
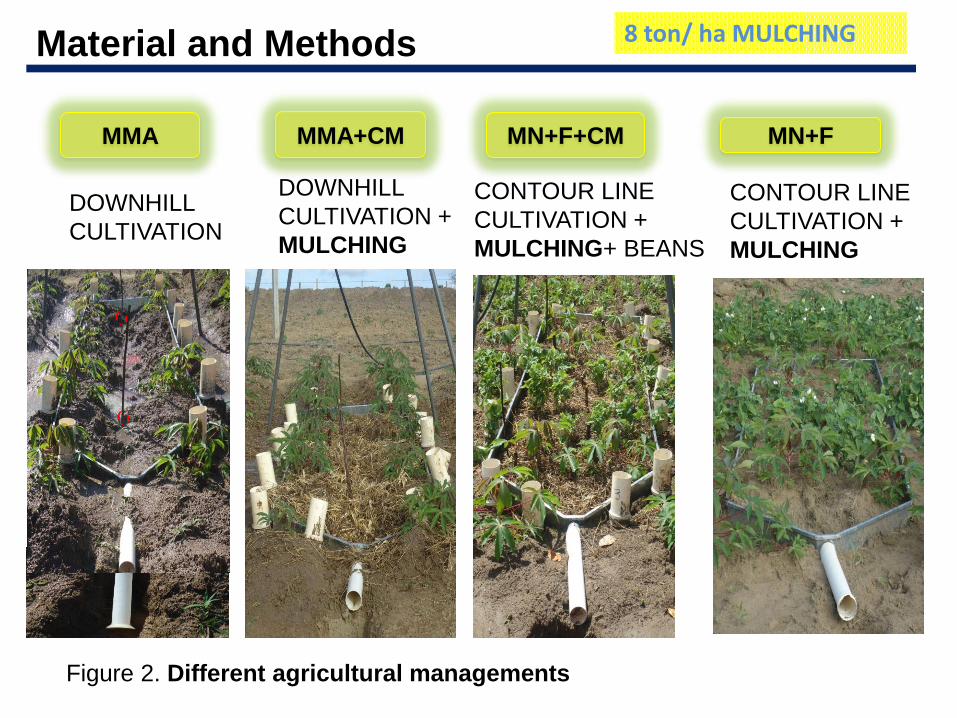
MN+F+CMMMA+CMMMA MN+F
Figure 2. Different agricultural managements
DOWNHILL
CULTIVATION
DOWNHILL
CULTIVATION +
MULCHING
CONTOUR LINE
CULTIVATION +
MULCHING+ BEANS
CONTOUR LINE
CULTIVATION +
MULCHING
8 ton/ ha MULCHING
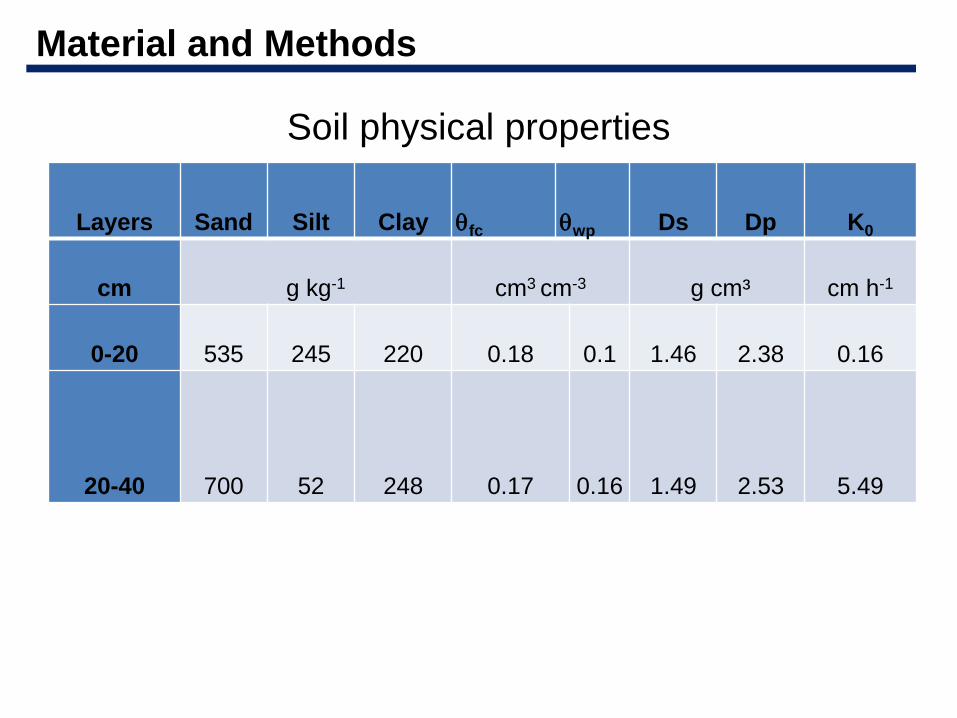
Soil physical properties
Layers Sand Silt Clay fc wp Ds Dp K0
cm g kg-1 cm3 cm-3 g cm³ cm h-1
0-20 535 245 220 0.18 0.1 1.46 2.38 0.16
20-40 700 52 248 0.17 0.16 1.49 2.53 5.49
Material and Methods
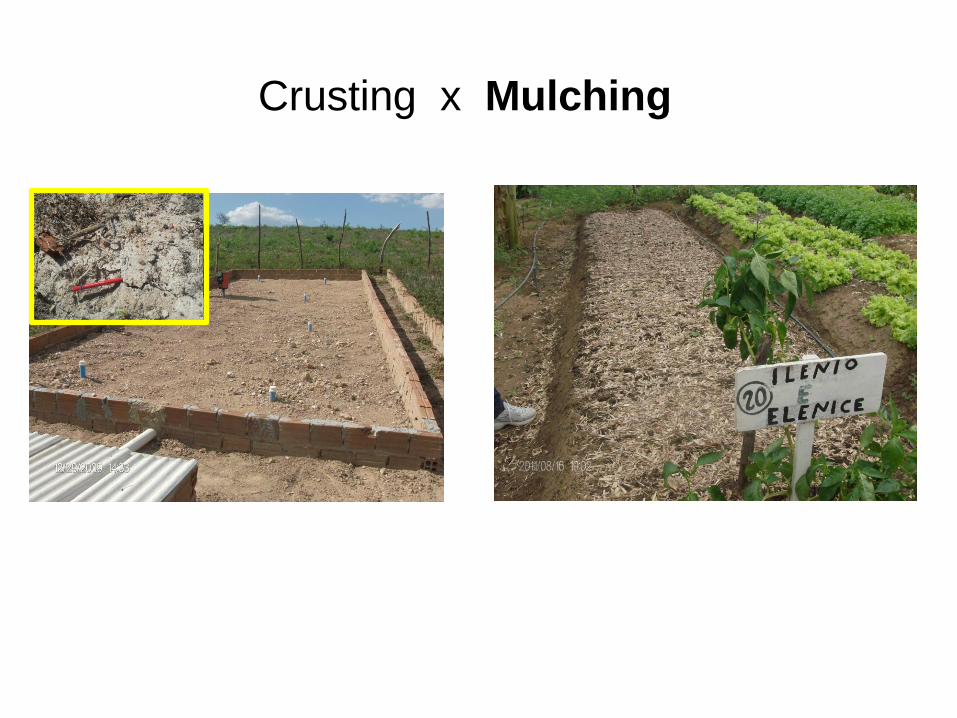
Crusting x Mulching
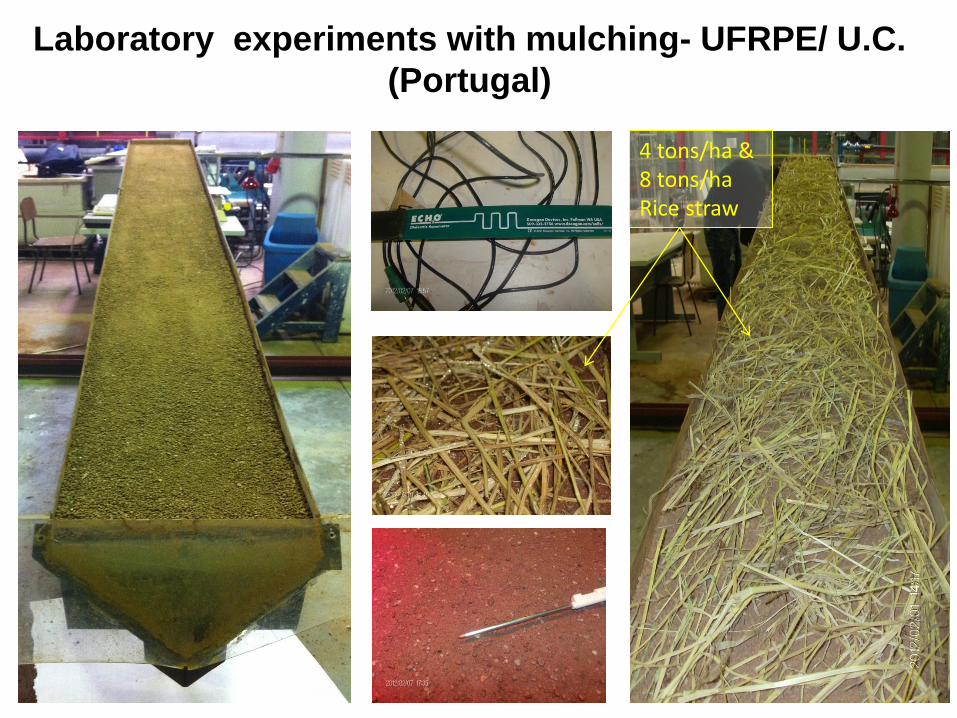
Laboratory experiments with mulching- UFRPE/ U.C.
(Portugal)
4 tons/ha & 8 tons/ha Rice straw
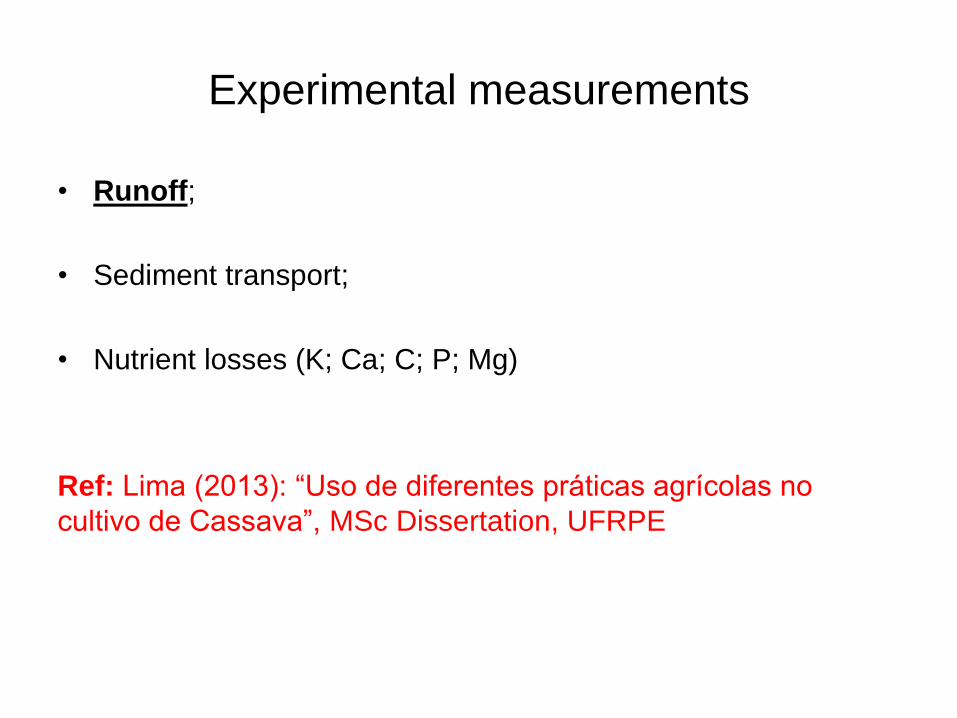
Experimental measurements
• Runoff;
• Sediment transport;
• Nutrient losses (K; Ca; C; P; Mg)
Ref: Lima (2013): “Uso de diferentes práticas agrícolas no
cultivo de Cassava”, MSc Dissertation, UFRPE
Material and Methods
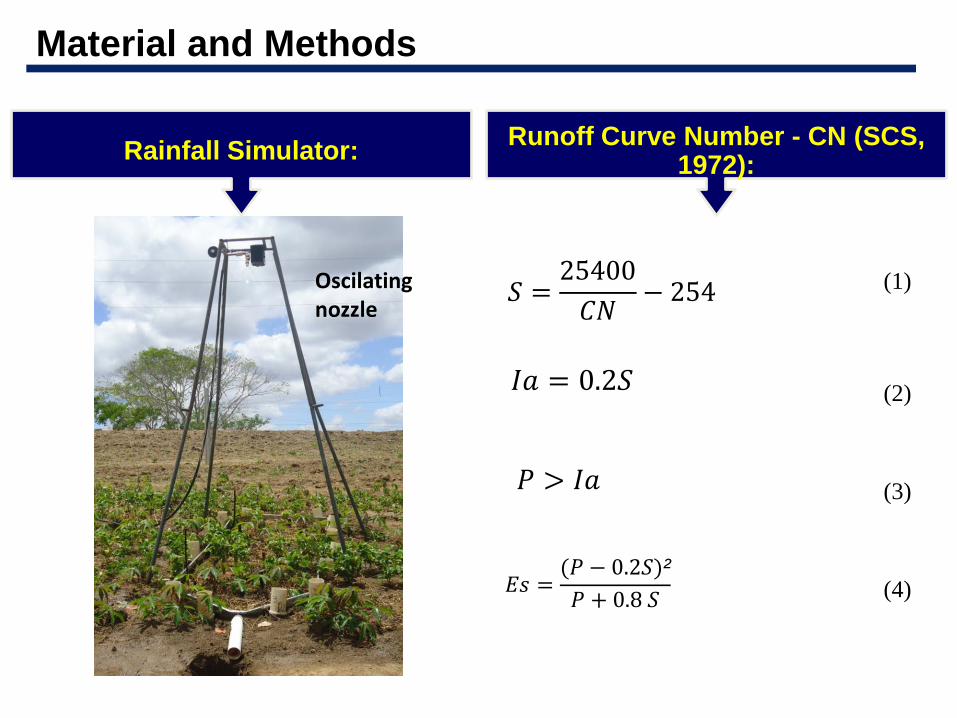
Rainfall Simulator:Runoff Curve Number - CN (SCS,
1972):
𝑆 =25400
𝐶𝑁− 254 (1)
𝐼𝑎 = 0.2𝑆 (2)
𝑃 > 𝐼𝑎 (3)
(4)𝐸𝑠 =(𝑃 − 0.2𝑆)²
𝑃 + 0.8 𝑆
Oscilatingnozzle
Results and Discussion
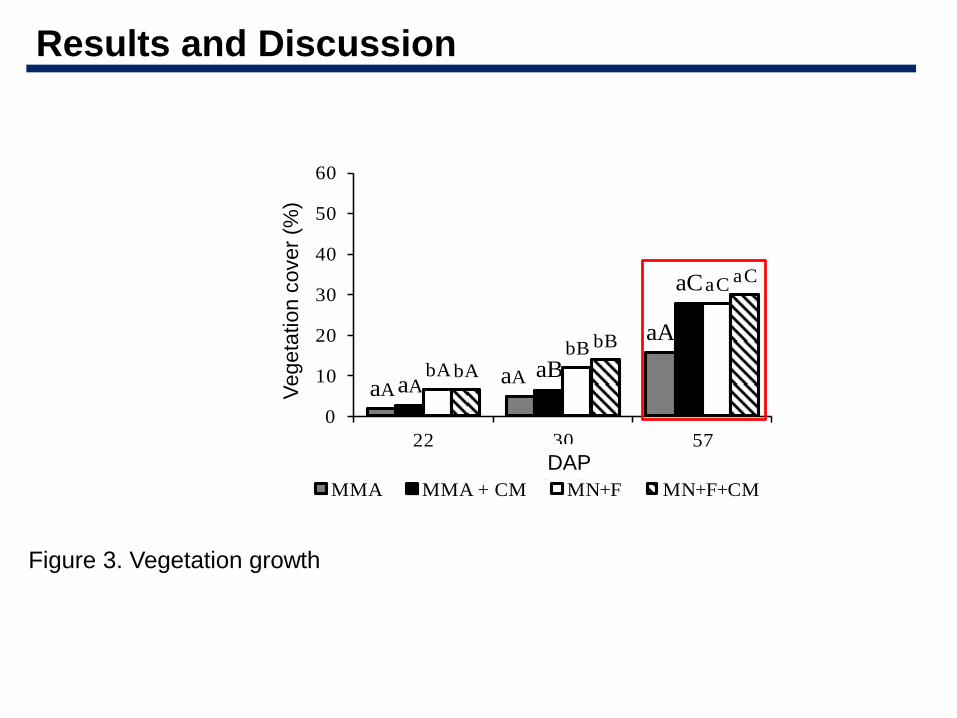
Figure 3. Vegetation growth
aAaA
aA
aAaB
aC
bAbB
aC
bA
bB
aC
0
10
20
30
40
50
60
22 30 57
Co
ber
tura
veg
eta
l (%
)
Dias após plantioMMA MMA + CM MN+F MN+F+CM
Vegeta
tion
cover
(%)
DAP
Results and Discussion
Management CN*
P
(mm)
S
(mm)
Es
estimated
(mm)
Es
measured
(mm)
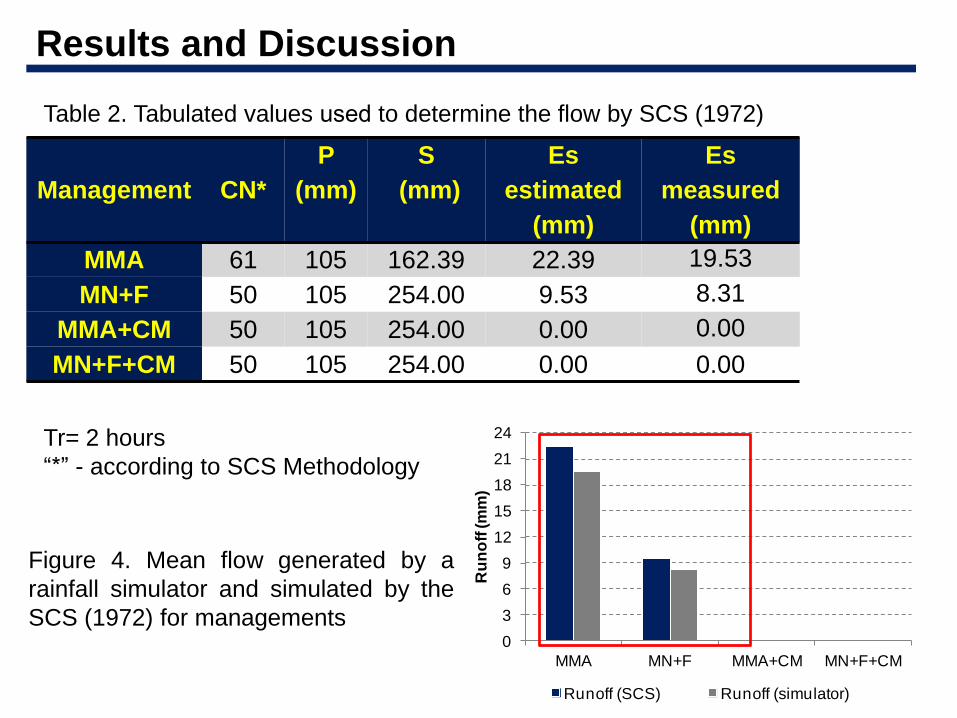
MMA 61 105 162.39 22.39 19.53
MN+F 50 105 254.00 9.53 8.31
MMA+CM 50 105 254.00 0.00 0.00
MN+F+CM 50 105 254.00 0.00 0.00
Table 2. Tabulated values used to determine the flow by SCS (1972)
Figure 4. Mean flow generated by a
rainfall simulator and simulated by the
SCS (1972) for managements0
3
6
9
12
15
18
21
24
MMA MN+F MMA+CM MN+F+CM
Ru
no
ff (m
m)
Runoff (SCS) Runoff (simulator)
Tr= 2 hours
“*” - according to SCS Methodology
Conclusions
The conservation practices for cassava in contour lines with cover and
without cover, and cassava downhill allowed runoff reduction;
Mulch cover resulted in no runoff, being a very effective practice;
Measured runoff values were always lower than those simulated by the
SCS model, for different agricultural practices, hence overestimating
runoff;
Those experimental results are expected to improve parameter
description in SWAT model, in particular for Cassava.
Acknowledgments