Embed Size (px)
Citation preview

27
Experimental and Simulation Studies of the Primary and Secondary Vacuum Freeze Drying
at Microwave Heating
Józef Nastaj and Konrad Witkiewicz West Pomeranian University of Technology, Szczecin
Poland
1. Introduction
Freeze drying (FD) is a dehydration method used to obtain high-quality products, mainly foodstuffs, biomaterials, pharmaceuticals and other thermolabile materials. Compared with standard methods, the freeze drying technique ensures retaining original shape, color and texture of the product as well as the preservation of its flavor, nutritive content and biological activity. However, FD is an expensive and lengthy dehydration process carried out in three stages: pre-freezing, primary drying when ice sublimation takes place under vacuum, followed by desorption of residual, unfreezable bounded water during the secondary stage. Material must be first cooled below its triple point to obtain frozen state. In the case of food and biomaterials freezing is done rapidly at temperature between -50°C and -80°C, below eutectic point to avoid destruction of cell walls by ice crystals. During the primary FD stage, the frozen water in dried material pores sublimates from the ice front, diffuses throughout the dried layer to the sample surface and next deposits on the condenser surface. The sublimation of water takes place in the range of temperature and pressure below the triple point (for water 273.16 K and 611.73 Pa, respectively). After primary drying, residual moisture content may be as high as 7%. Secondary drying is intended to reduce this to an optimum value for material stability – usually with moisture content between 0.5 and 2.0%. The typical freeze-dried products have a porous, nonshrunken structure resulted from structural rigidity achieved by frozen water and can be therefore easily rehydrated. The use of conventional FD on industrial scale is restricted to rather high-value products. Recent research is being focused on reducing operating costs of FD by intensifying heat and mass transfer in dried material. Proposed various heating methods, cycled pressure strategies and formulated optimal control policies are limited by temperature constraints (Liapis & Bruttini, 2006). They must be set to avoid ice melting and scorching of exposed dried material layer. The major difficulty of process optimization results from the fact that imposed thermal gradient has direction opposite to vapor concentration gradient. Moreover, dried layer acts as a thermal insulation for heat fluxes being transferred toward frozen layer. New FD method that overcomes these disadvantages is microwave freeze drying (MFD). Microwaves penetrate very well into ice and supply energy for sublimation volumetrically and selectively, bypassing the problem of heat transport through the dried layer of the
www.intechopen.com
Advances in Induction and Microwave Heating of Mineral and Organic Materials
616
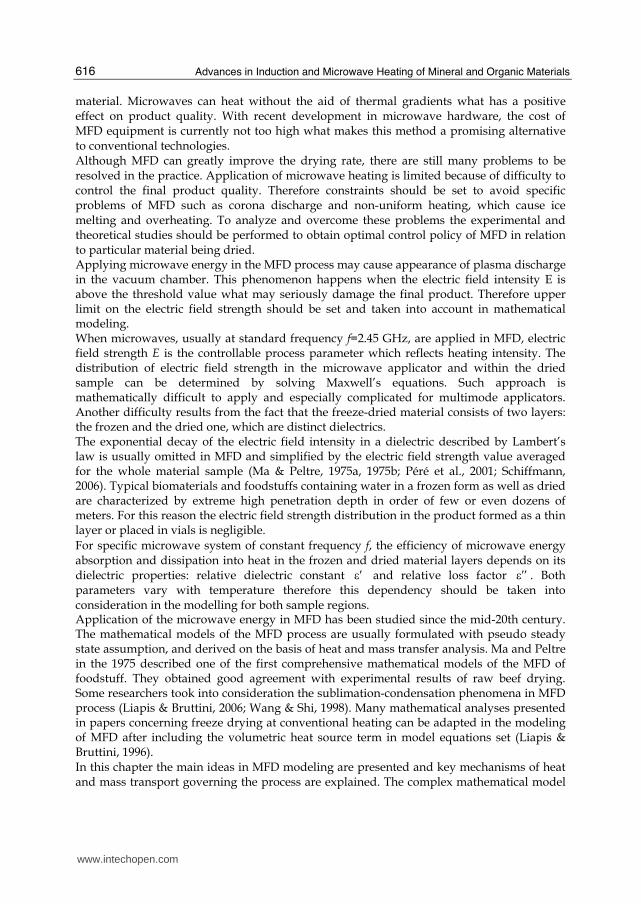
material. Microwaves can heat without the aid of thermal gradients what has a positive effect on product quality. With recent development in microwave hardware, the cost of MFD equipment is currently not too high what makes this method a promising alternative to conventional technologies. Although MFD can greatly improve the drying rate, there are still many problems to be resolved in the practice. Application of microwave heating is limited because of difficulty to control the final product quality. Therefore constraints should be set to avoid specific problems of MFD such as corona discharge and non-uniform heating, which cause ice melting and overheating. To analyze and overcome these problems the experimental and theoretical studies should be performed to obtain optimal control policy of MFD in relation to particular material being dried. Applying microwave energy in the MFD process may cause appearance of plasma discharge in the vacuum chamber. This phenomenon happens when the electric field intensity E is above the threshold value what may seriously damage the final product. Therefore upper limit on the electric field strength should be set and taken into account in mathematical modeling. When microwaves, usually at standard frequency f=2.45 GHz, are applied in MFD, electric field strength E is the controllable process parameter which reflects heating intensity. The distribution of electric field strength in the microwave applicator and within the dried sample can be determined by solving Maxwell’s equations. Such approach is mathematically difficult to apply and especially complicated for multimode applicators. Another difficulty results from the fact that the freeze-dried material consists of two layers: the frozen and the dried one, which are distinct dielectrics. The exponential decay of the electric field intensity in a dielectric described by Lambert’s law is usually omitted in MFD and simplified by the electric field strength value averaged for the whole material sample (Ma & Peltre, 1975a, 1975b; Péré et al., 2001; Schiffmann, 2006). Typical biomaterials and foodstuffs containing water in a frozen form as well as dried are characterized by extreme high penetration depth in order of few or even dozens of meters. For this reason the electric field strength distribution in the product formed as a thin layer or placed in vials is negligible.
For specific microwave system of constant frequency f, the efficiency of microwave energy absorption and dissipation into heat in the frozen and dried material layers depends on its dielectric properties: relative dielectric constant ′ε and relative loss factor ′′ε . Both parameters vary with temperature therefore this dependency should be taken into consideration in the modelling for both sample regions. Application of the microwave energy in MFD has been studied since the mid-20th century. The mathematical models of the MFD process are usually formulated with pseudo steady state assumption, and derived on the basis of heat and mass transfer analysis. Ma and Peltre in the 1975 described one of the first comprehensive mathematical models of the MFD of foodstuff. They obtained good agreement with experimental results of raw beef drying. Some researchers took into consideration the sublimation-condensation phenomena in MFD process (Liapis & Bruttini, 2006; Wang & Shi, 1998). Many mathematical analyses presented in papers concerning freeze drying at conventional heating can be adapted in the modeling of MFD after including the volumetric heat source term in model equations set (Liapis & Bruttini, 1996). In this chapter the main ideas in MFD modeling are presented and key mechanisms of heat and mass transport governing the process are explained. The complex mathematical model
www.intechopen.com

Experimental and Simulation Studies of the Primary and Secondary Vacuum Freeze Drying at Microwave Heating
617
of the primary and secondary FD stages at microwave heating is formulated to derive optimal control policy of the process depending on thermophysical properties and thickness of material being dried, total pressure and input microwave power. One-dimensional two-region model of the primary MFD was developed and then solved using various numerical approaches such as Landau’s transformation (LT) and Variable Time-Step (VTS) methods. Varying during the process sublimation front temperature caused by varying with time vapor diffusional mass transfer resistances was taken into account. Some of the simulated drying curves were compared with experimental results giving fairly good agreement. The mathematical model of the secondary MFD was also developed and solved using the Numerical Method of Lines (NMOL). Pressure drop in the material was taken into account and calculated using Ergun equation. As a result of the both models solution, the moisture contents and the temperature distributions in drying material were obtained. The analysis performed basing on mathematical modeling enables computation of optimal ranges of significant material and process parameters, which ensure obtaining good product quality and optimal MFD drying times.
2. Experimental
2.1 MFD equipment
Experimental investigations of the primary freeze drying of random solids at microwave heating were performed by means of the set-up composed of the microwave circuit, the vacuum system, the refrigeration system, the temperature and weight measurements devices and the data acquisition system (Fig. 1). A cylindrical Teflon container filled with material to be dried is hanged on the extensometer balance inside the vacuum chamber. Temperature of dried material is measured by the fluoroptic thermometer (FOT Lab Kit – Luxtron Corp.). A probe with a phosphorus sensor inserted to the sample is connected by optical fiber, via vacuum feedthrough with module m600 outside the chamber. The module emits photon pulses towards sensor and simultaneously records the decay of returning fluorescence signal which varies with material temperature. On this basis the module estimates measured temperature with a maximum absolute accuracy of 0.1°C. The fluoroptic thermometer essentially does not interfere with electromagnetic field in the applicator and is transparent for microwaves. Temperature inside the chamber is controlled by the refrigeration system with a refrigerant circulating in the vacuum chamber’s jacket. Sublimated vapors are removed from the chamber by the cold trap cooled by means of liquid nitrogen. The vacuum pump is operating constantly whilst self-regulated purge valve maintains pressure in the vacuum chamber at the level of 100 Pa. Generated microwaves of 2450 MHz frequency are transmitted via the waveguide, the coaxial cable, the directional coupler and the vacuum feedthrough to the applicator inside the vacuum chamber. Microwave power reflected in the applicator returns to the directional coupler which directs it to the dummy load where is totally dissipated. The sample is inserted into the microwave applicator which is constructed as a section of rectangular brazen waveguide and acts as a mono-modal resonant cavity (Fig. 2). One of applicator walls is the movable tuner and its position can be adjusted remotely by stepping motor. Microwave is transmitted via the coaxial cable to the type N connector coupled with the antenna. Electromagnetic wave propagates inside the applicator in TE01n mode where n is the number of half wavelengths.
www.intechopen.com

Advances in Induction and Microwave Heating of Mineral and Organic Materials
618
GHz
BALLANCE
AD/DAm600
P[ K ]
[ g ]
[ A ]
[ K ]
[ Pa ]
LN2
VACUUM PUMP
CONDENSER
FLUOROPTIC
PROBE
REFRIGERATING SYSTEM
APPLICATOR
POWER
GENERATOR
DIRECTIONAL COUPLER
MICROWAVE
DETECTOR
RS
-232
AMMETER
MICROWAVE
GENERATOR
RS
-232
[ A ]
MICROWAVE
DETECTOR
AMMETER
Fig. 1. The experimental set-up for investigations of the primary MFD
Theoretical wavelength in air for this construction amounts to about 15.5 cm, according to the following equation (Metaxas, 1996):
2
00 1
2w
a
λλ λ ⎛ ⎞= − ⎜ ⎟⎝ ⎠ (1)
where: λ0 – wavelength in air (12.24 cm for frequency f=2450 MHz); a – height of the waveguide (5 cm). A processed sample should be located at a distance of ¾ wavelength where electric field pattern achieves maximal values. Tuning of the applicator is performed on the basis of readings of the microwave detector, which is coupled with a magnetic loop under the sample. The current intensity of the detector is directly proportional to electric field strength in the applicator. The applicator is considered to be tuned when current signal of the microwave detector coupled with the magnetic loop under the sample achieves maximum, which means maximal electric field strength in the sample.
2.2 Methodology
Experiments of the primary microwave freeze drying were performed it two stages: first with measurements of sample mass decrement and second with only sample temperature
www.intechopen.com

Experimental and Simulation Studies of the Primary and Secondary Vacuum Freeze Drying at Microwave Heating
619
Fig. 2. Cross-section of a waveguide applicator
measurements. It was impossible to measure simultaneously both above mentioned values in the same experimental run. When temperature was measured, a fluoroptic probe was placed in the center of the sample. After freezing of the wet material in the vacuum chamber at the temperature about -50 °C, the apparatus is sealed and the vacuum pump started. When demanded process pressure in the chamber is achieved, the microwave generator is turned on. When a dried sample is inserted through the removable closure into the applicator, the waveguide is usually shortened and cavity needs to be tuned to a TE102 mode. However, as dielectric properties of a sample change as a result of moisture content or temperature fluctuations, the cavity length needs to be adjusted accordingly. During the single experimental run, the sample temperature or sample weight decrement as well as temperature and pressure in the vacuum chamber are recorded by DASYLab data acquisition program. Additionally, continuous measurements of current signal of the microwave detector coupled with magnetic loop inside the applicator indicate when the resonant cavity needs to be tuned during the experiments. Varying during an experimental run current signal may indicate that electric field strength in a dried sample is not constant. These changes were not significant, but taking them into account in mathematical modeling would require derivation of electric field strength distribution in sample layers. The average power absorbed volumetrically in the dried material (internal heat source
capacity) can be calculated provided that E - the magnitude of the electric field strength E
inside the sample is known (Metaxas, 1996; Schiffmann, 2006):
2 20 0
1tan tan
2vQ E f Eωε ε δ π ε ε δ′ ′= = (2a)
or
www.intechopen.com

Advances in Induction and Microwave Heating of Mineral and Organic Materials
620
2 2
0 01
2vQ E f Eωε ε π ε ε′′ ′′= = (2b)
where: tan /δ ε ε′′ ′= . In the case of drying of small samples, we can assume uniform electric
field inside the material, and then 0 .2 rmsE E E= = where 0E is the peak magnitude of the
field and .rmsE is the rms value. Applying this simplification to Eq. (2b) gives:
202vQ f Eπ ε ε ′′= (3)
In this chapter the symbol E is used instead of rmsE to define the electric field in the
material.
Dried layer II
( )=x X t
0=x
=x L
Frozen layer I
1 2, , , ,II II II II IIv diss eQ K Dμ μ
1 2, , ,I I I Iv dissQ K μ μ
( )− ⎡ ⎤⎣ ⎦dWX t
dt ∞IIα
( ), ( )s sT t C t
VC.
.
.
===
vc
vc
vc
P const
T const
C const
wN
Fig. 3. The physical model of the primary MFD
3. Mathematical modeling of the primary MFD
3.1 Model formulation and assumptions
Consider a dried material which has geometry of a slab of infinite length. The sample bottom is insulated for heat and mass transfer and the upper surface is exposed to a vacuum at drying chamber temperature, as shown in Figure 3. During the primary stage of the process, as sublimated vapors diffuse from the ice front towards exposed surface, moving boundary retreats until frozen free water is totally removed. The ice front (moving boundary) is assumed to be a plane of zero thickness and its initial position is arbitrary defined. In the frozen region I energy is transferred by conduction whereas conduction and convection are considered in the dried region II. For dominant polarization of the electric field normal to the sample surface, it can be assumed that the electric field strength is constant throughout the dried material and equal to the value at the surface. Such simplification is justified when the penetration depth of microwaves is much greater than the size of the sample.
www.intechopen.com
Experimental and Simulation Studies of the Primary and Secondary Vacuum Freeze Drying at Microwave Heating
621
3.2 Governing equations
The physical system is described by the following differential equations.
Frozen Region
Heat transfer:
2
2
∂ ∂= +∂ ∂I
II I
vI Ie
bu p
QT Ta
t cx ρ (4)
Dried Region
Heat transfer:
2
2
( )w IIII
II II II II
p vw IIII IIe
bu p bu p
c QN TT Ta
t c x cx ρ ρ∂∂ ∂= − +∂ ∂∂ . (5)
Steady capacities of internal heat sources in equations (4) and (5) are defined as follows:
2( )i iv diss iQ K T E= for ,i I II= (6)
where dissipation coefficient:
0( ) 2 ( ) for ,idiss i i iK T f T i I IIπ ε ε ′′= = (7)
Here, the dissipation coefficient in above equations is expressed as a linear function of material temperature:
1 2( )i i idissK T Tμ μ≈ + for ,i I II= (8)
where parameters 1μ and 2μ are determined by linear regression of experimental data
(Witkiewicz, 2006). Mass transfer:
2
2
∂ ∂= ∂∂IIeC C
Dtx
(9)
Effective diffusivity IIeD :
1 1 1
IIe K MD D D= + (10)
is a combination of Knudsen diffusivity (Coulson et al., 1999):
1.0638avgII
K pw
RTD r
M= ⋅ (11)
and molecular diffusivity (Poling et al., 2001):
( )1/23/2
2
1.8829 1/ 1/avgII w in
MAB AB
T M MD
Pσ⋅ += Ω (12)
www.intechopen.com

Advances in Induction and Microwave Heating of Mineral and Organic Materials
622
where ABσ and ABΩ are determined for the system water vapor ( A ) – air ( B ) on the basis
of tabulated constant of Lennard-Jones forces.
Sublimation front
The heat flux and mass flux at pseudo-steady-state conditions are related by:
s w sq N h= Δ (13)
Then energy balance is:
I II
I IIe e w s
T Tk k N h
x x
∂ ∂− + = Δ∂ ∂ (14)
The displacement of the moving boundary is related to the rate of sublimation:
( ) ( )IIw ini eq bu
dX tN W W
dtρ= − − (15)
Initial Conditions
The initial moving boundary positions can be determined as follows:
( )X t L δ= − , for 0t = (16)
where arbitrary initial thickness of the dried layer is chosen as δ =3% of sample thickness.
This value of δ is used to start the numerical computations of the formulated model. In the frozen layer constant initial temperature is imposed:
( , 0)I iniT x T= for 0 x X≤ ≤ and 0t = (17)
In the dried layer initial linear temperature and concentration profiles are assumed:
(0) ( , 0)
(0) (0)L II
L ini
T T x L x
T T δ− −=− for X x L≤ ≤ and 0t = (18)
where:
( )
(0)( )
II
II
II vc e sL
II e
L x T k TT
L x k
αα∞
∞− += − + for x L= and 0t = (19)
( )vcx X
CC C L x
x =∂⎛ ⎞= − −⎜ ⎟∂⎝ ⎠ for X x L≤ ≤ and 0t = (20)
Boundary Conditions
There is no heat transfer through the bottom boundary of the material, which is insulated by
the wall of a Teflon container:
0
0I
Ie
x
Tk
x =∂⎛ ⎞− =⎜ ⎟∂⎝ ⎠ for 0t ≥ (21a)
www.intechopen.com
Experimental and Simulation Studies of the Primary and Secondary Vacuum Freeze Drying at Microwave Heating
623
There is a heat transfer between the exposed material surface and surroundings:
( )II
IIe II vc L
x L
Tk T T
xα ∞=
∂⎛ ⎞ = −⎜ ⎟∂⎝ ⎠ for 0t ≥ (21b)
At the ice front the thermodynamic equilibrium between water vapor and ice is assumed. Thus the vapor mass concentration at the moving front is related by Clausius-Clapeyron relation:
( ) ( ) exp /( )s s w ss
aC t f T b M RT
T
⎛ ⎞= = +⎜ ⎟⎝ ⎠ for ( ) and 0x X t t= ≥ (21c)
where: a=-6320.152 and b=29.558 (Wolff et al., 1989). The condenser maintains low pressure of the vacuum chamber, therefore mass transfer resistance at the exposed surface is negligible:
( )L vcC t C= for and 0x L t= ≥ (21d)
3.3 Methods of model solution
The solution of the one-dimensional moving boundary problem in a planar medium
described by Equations (4), (5), (9), (14)-(21) cannot be easily obtained unless some
numerical techniques are used. Many approaches have been reported in the literature
concerning general moving boundary problem with such phase change as melting,
solidification or sublimation. Some researches use a fixed grid, fixed time-step formulation
but it fails to give a reliable estimation of the material’s temperature near the moving
boundary (Yuen & Kleinman, 1980).
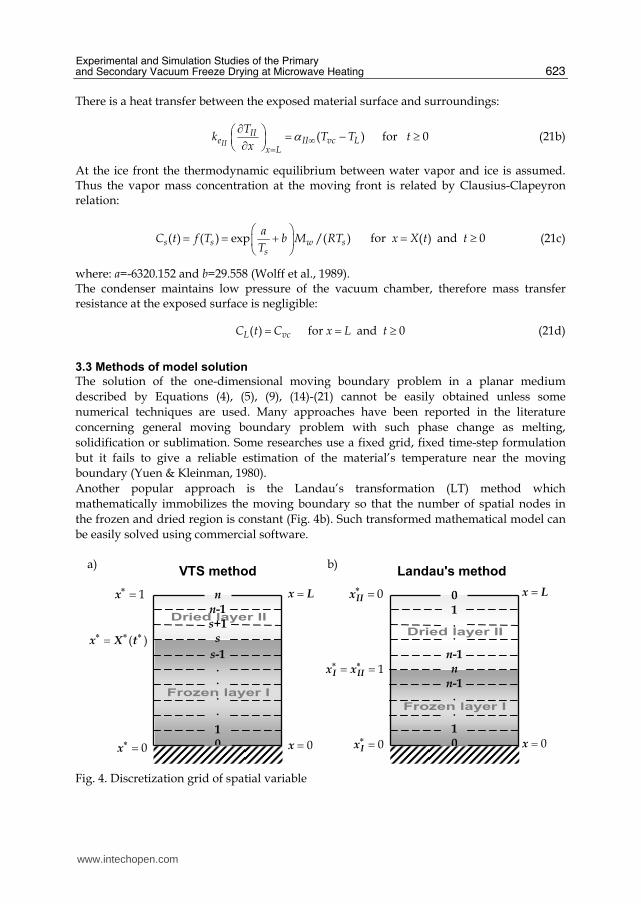
Another popular approach is the Landau’s transformation (LT) method which
mathematically immobilizes the moving boundary so that the number of spatial nodes in
the frozen and dried region is constant (Fig. 4b). Such transformed mathematical model can
be easily solved using commercial software.
Dried layer II
Frozen layer I
=x L
( )∗ ∗ ∗=x X t
0∗ =x
1∗ =x
0=x
0IIx∗ =
1I IIx x∗ ∗= =
0Ix∗ =
Dried layer II
Frozen layer I
=x L
0=x
nn-1s+1
s
s-1. .
.
.
10
VTS method Landau's method
01. .
n-1n
n-1.
.
10
a) b)
Fig. 4. Discretization grid of spatial variable
www.intechopen.com

Advances in Induction and Microwave Heating of Mineral and Organic Materials
624
In this work, this method is compared with the variable time-step (VTS) approach, introduced as an alternative and effective numerical technique of moving boundary problem solution. The VTS method uses a fixed grid and the time step is adjusted to cause movement of the interface exactly one grid space (Fig. 4a). This approach can be also applied together with the Landau’s transformation method. The formulated mathematical model of the microwave freeze drying was solved numerically using two approaches: VTS and LT. Equations (4), (5), (9), (14)-(15) make a set of mathematical model equations which are discretized by the implicit finite-difference Crank-Nicolson scheme and solved together with the adequate initial (16)-(20) and boundary conditions (21a)- (21d).
3.4 VTS method
The VTS method is a spatial fixed grid approach. The number of spatial nodes in computational grid resulting from discretization is constant. It means that in each step of computations the sublimation ice front should move exactly one grid space from the previous location. Instead of Eqs. (14) and (15) the following simultaneous heat and mass balance at the moving boundary must be fulfilled:
1, 1,
, 1
, ,
,( ) ( ) 0s j s j
I II II I I s j
s j I s j II
e e ini eq bu s bu p s j I
T T T T x xk k W W h c T T
x x t tρ ρ− +
−− − Δ Δ− − − − Δ − − =Δ Δ Δ Δ (22)
where in the above finite-difference scheme: the subscript s represents the space grid location
of the ice sublimation interface (moving boundary) and the subscript j indicates time step. The individual terms in above equation correspond to heat flux densities transferred from the frozen and dried material regions, heat flux utilized by sublimation and heat required to raise the temperature of interface node from previous time step to current one. The following dimensionless variables are introduced for the sake of solution convenience:
x
xL
∗ = (23)
X
XL
∗ = 2
eIa tt
L
∗ = ,3
vc
s vc
C CC
C C∗ −= −
0
0
II
vc
T TT
T T∗ −= − 0
0
IIII
vc
T TT
T T∗ −= − * eq
ini eq
W WW
W W
−= −
(24)
where W denotes the average moisture content of the material bed.
The governing equations (4)-(5), (9) can be now rewritten as:
22
20( )
I
I
VI I
e vc
Q LT T
k T Tx t
∗ ∗∗ ∗
∂ ∂− = − −∂ ∂ (25)
22
20
( )
( )w II I I II
II II II
p bu e ini eq e VII II II
e e e vc
c a W W a Q LT T TdX
k a k T Tx dt x t
ρ∗ ∗ ∗∗∗ ∗ ∗ ∗
−∂ ∂ ∂− − = − −∂ ∂ ∂ (26)
www.intechopen.com
Experimental and Simulation Studies of the Primary and Secondary Vacuum Freeze Drying at Microwave Heating
625
2
20I
II
e
e
aC C
Dx t
∗ ∗∗ ∗
∂ ∂− =∂ ∂ (27)
Heat and mass balance at the sublimation front (22) can be rewritten as:
, ,1, 1,
, , 10
( ) 0s j I s j IIs j s j
I II II I I s j Is j
ini eqe e bu s e e
vc
T T T T W W x xk k h a k T T
T Tx x t tρ− +
−
∗ ∗ ∗ ∗ ∗ ∗ ∗ ∗∗ ∗ ∗ ∗− − − Δ Δ− − − Δ − − =−Δ Δ Δ Δ (28)
In each calculation step, value of the actual time step corresponding to one spatial grid space movement is determined iteratively by bisection method as a root of Eq. (28). The initial conditions (16)-(20) become:
XL
δ∗ = for * 0t = (29a)
0IT∗ = for 0 x X∗ ∗≤ < and 0t∗ = (29b)
1
11 LII II
xT T
X
∗∗ ∗∗⎛ ⎞−= −⎜ ⎟⎜ ⎟−⎝ ⎠ for 1X x∗ ∗≤ ≤ and 0t∗ = (29c)
( )( ),3
II L
II
e vc ini IIII
e s vc s
k T T TC x
D C C h
∗∗ ∗−= − Δ for 1X x∗ ∗≤ ≤ and 0t∗ = (29d)
where
( )( )1
1L
II
IIII
II e
L XT
L X k
αα
∗∞∗ ∗∞−= − + for 1 and 0x t∗ ∗= = (29e)
The boundary conditions (21a)-(21d) become:
0IT
x
∗∗
∂ =∂ for 0 and 0x t∗ ∗= > (30a)
1 0IIe IIII
II
k TT
L xα∗∗ ∗∞
∂− − =∂ for 1 and 0x t∗ ∗= > (30b)
( )IIC f T∗ ∗= for and 0x X t∗ ∗ ∗= > (30c)
0C∗ = for 0 and 0x t∗ ∗= > (30d)
Finite difference schemes of Eqs. (25)-(28) together with the initial (29a)-(29e) and boundary
conditions (30a)-(30d) constitute the algebraic linear equations set, and can be easily solved
by the tridiagonal algorithm. The actual moving boundary position jX∗ versus time was
computed as: 0jX X x j∗ ∗ ∗= − Δ ⋅ , where j means the actual number of time steps.
www.intechopen.com

Advances in Induction and Microwave Heating of Mineral and Organic Materials
626
Analogically, the actual average moisture content jW ∗ versus time was computed as:
0jW W W j∗ ∗ ∗= − Δ ⋅ , where W x∗ ∗Δ = Δ .
3.5 LT method
The Landau’s transformation converts the problem of a moving boundary to that of a fixed
boundary (Ma & Peltre, 1973) by introducing the following definitions of dimensionless
position coordinates in the frozen and dried region:
( )
Ix
xX t
∗ = (31a)
( )
IIL x
xL X t
∗ −= − (31b)
They are used in conjunction with the dimensionless variables (24) defined in the same way
as in the VTS model. The mathematical model equations (4), (5), (9), (14)-(15) have now
more complex dimensionless form.
Heat transfer in the frozen layer is:
222 2
20( )
I
I
VI I II
e vcI I
Q LT T TdXx X X X
k T Tx dt x t
∗ ∗ ∗∗∗ ∗ ∗ ∗∗ ∗ ∗ ∗∂ ∂ ∂+ − = − −∂ ∂ ∂ (32)
Heat and mass transfer in the dried layer are as follows:
( )( ) ( )
2
2
22 2
( )1
1 1( )
w II I I
II II
I II
II II
p bu e ini eq eII IIII
e eII II
e VII
e e vc ini
c a W W aT TdXx X
k ax dt x
a Q LTX X
a k T Tt
ρ∗ ∗∗∗ ∗∗ ∗ ∗∗∗ ∗∗
⎡ ⎤−∂ ∂− + − +⎢ ⎥∂ ∂⎢ ⎥⎣ ⎦∂− − = − −−∂
(33)
( ) ( )2 2
21 1 0I I
II II
e eII
e eII II
a aC dX C Cx X X
D Dx dt x t
∗ ∗ ∗ ∗∗ ∗ ∗∗ ∗ ∗ ∗∂ ∂ ∂− − − − =∂ ∂ ∂ (34)
Heat and mass balance at the sublimation front:
1 1(1 )
II I
II I
e evc ini II Iw s
II Ix x
k kT T T TN h
L X x X x∗ ∗∗ ∗
∗ ∗ ∗ ∗= =
⎡ ⎤⎛ ⎞ ⎛ ⎞− ∂ ∂⎢ ⎥− + = Δ⎜ ⎟ ⎜ ⎟⎜ ⎟ ⎜ ⎟⎢ ⎥− ∂ ∂⎝ ⎠ ⎝ ⎠⎣ ⎦ (35)
Displacement of the interface:
( )( ),3
1
( )
1
II III
II
bu e ini eqe s vcw
II x
a W WD C C C dXN
Lx dtL X
ρ∗
∗ ∗∗ ∗∗ =
−− ⎛ ⎞∂= = −⎜ ⎟⎜ ⎟∂− ⎝ ⎠ for 0t∗ ≥ (36)
The initial conditions (16)-(20) become:
www.intechopen.com
Experimental and Simulation Studies of the Primary and Secondary Vacuum Freeze Drying at Microwave Heating
627
XL
δ∗ = for 1I IIx x∗ ∗= = and * 0t = (37a)
0IT∗ = for 0 1Ix∗≤ ≤ and 0t∗ = (37b)
( )1II II LT x T∗ ∗ ∗= − for 0 1IIx∗≤ ≤ and 0t∗ = (37c)
( )( )0
,3
II
II
e vc LII
e s vc s
k T T TC x
D C C h
∗∗ ∗−= − Δ for 0 1IIx∗≤ ≤ and 0t∗ = (37d)
where
( )( )1
1II
IIL
II e
L XT
L X k
αα
∗∞∗ ∗∞−= − + for 0 and 0IIx t∗ ∗= = (37e)
The boundary conditions (21a)-(21d) become:
0I
I
T
x
∗∗
∂ =∂ for 0 and 0Ix t∗ ∗= ≥ (38a)
1 0(1 )
IIe IIII
II II
k TT
X xα∗∗ ∗ ∗∞
∂− − =− ∂ for 0 and 0IIx t∗ ∗= ≥ (38b)
( )sC f T∗ ∗= for 1 and 0I IIx x t∗ ∗ ∗= = ≥ (38c)
0C∗ = for 0 and 0IIx t∗ ∗= ≥ (38d)
Finite difference schemes of Eqs. (32)-(36) together with the initial (37a)-(37e) and boundary conditions (38a)-(38d) constitute the algebraic nonlinear equations set, and it must be solved by the adequate numerical algorithm. Both the frozen and dried layer was divided into 20 equal space intervals. Resulting algebraic nonlinear equations set was solved in each time step by means of adequate numerical procedure in the Mathcad software.
In the LT method the actual moving boundary position X∗ versus time was computed
from solution of the set of discretized governing equations (32)-(36). The actual average
moisture content of the drying bed jW ∗ versus time was computed as: 0 jW W W j∗ ∗ ∗= − Δ ⋅ ,
where W x∗ ∗Δ = Δ .
3.6 Modeling results of the MFD primary stage The simulations of the MFD were performed using two described above numerical methods for three selected materials: Sorbonorit 4, beef and mannitol. Thermophysical properties and parameters of the Sorbonorit 4 MFD system are presented in Table 1. The thermophysical parameters of the beef were taken from paper (Ma & Peltre, 1973, 1975a, b). While the analogical data for mannitol is included in the article (Wang & Chen, 2003). The exemplary simulations results of the MFD of selected materials using the VTS and LT approach are shown in Figs. 5 through 7.
www.intechopen.com

Advances in Induction and Microwave Heating of Mineral and Organic Materials
628
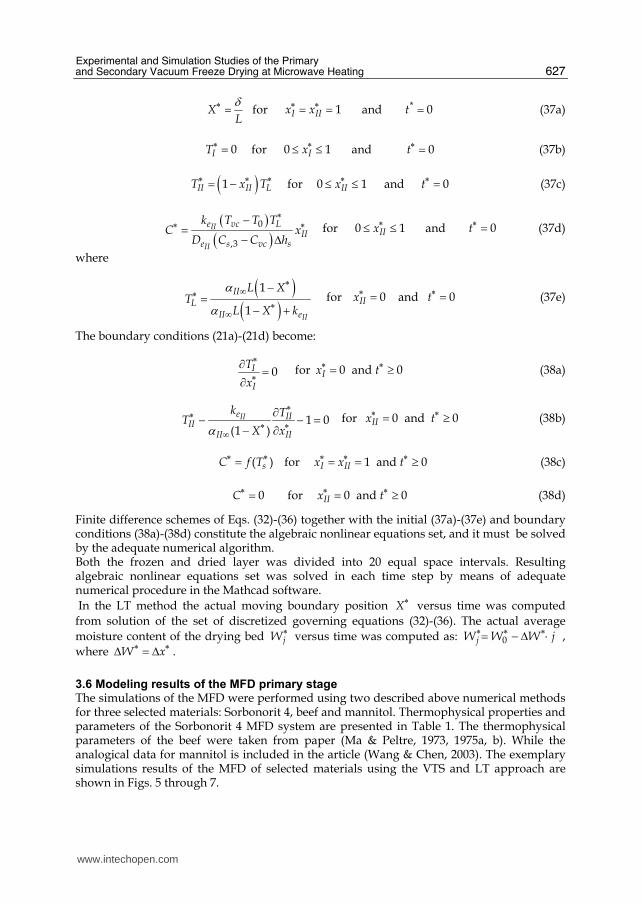
Fig. 5. Exemplary simulation results of Sorbonorit MFD: a) temperature and vapor concentration profiles for various process times – VTS method and b) LT method; c) temperature evolution on the sample surface TL, sample bottom T0 and sublimation front Ts versus dimensionless MB position; d) heat flux densities generated in the frozen layer qI, in dried layer qII and at MB qs versus dimensionless MB position; e) effects of the total pressure on the drying time and maximum temperature of the frozen region; f) effects of the sample thickness on the total drying time for various electric field strengths.
0.0 0.2 0.4 0.6 0.8 1.0x* [-]
-20
-10
0
10
20
TI,
TII
[oC
]
Sorbonorit 4
PVC=100 Pa, L=0.01 m,
E=1000 V/m
TI
TII
C
0.0006
0.001
0.0014
0.0018
C [k
g/m
3]1 - 0 min.
2 - 5 min.3 - 15 min.4 - 30 min.5 - 1 hour6 - 2 hours7 - 3 hours8 - ca 4 hours
3
4
5
6
7
8
1
2
3
4
56
7
8
-20
-10
0
10
TI, T
II [
oC
]
Sorbonorit 4
PVC=100 Pa, L=0.01 m,
E=1000 V/m
TI
TII
C
0 0.2 0.4 0.6 0.8 11 0.8 0.6 0.4 0.2 0 x* [-]
0 4 8 12 16 2020 16 12 8 4 0
numerical
grid
0.0006
0.0008
0.001
0.0012
0.0014
C [kg/m
3]
1 - 0 min.2 - 5 min.3 - 15 min.4 - 30 min.5 - 1 hour6 - 2 hours7 - 3 hours8 - ca 4 hours
1
2
3
4
5
6
7
8
1
2
3
4
5
6
7
8
0.0 0.2 0.4 0.6 0.8 1.0X* [-]
-20
-10
0
10
20
Ts, T
0, T
L [°C
]
Sorbonorit 4
PVC=100 Pa, L=0.01 m,
E=1000 V/m
TL
Ts
T0
0.0 0.2 0.4 0.6 0.8 1.0X* [-]
0
1000
2000
3000
4000q
s, q
I, q
II [W
/m2]
qs qII
qI
qI+qII
Sorbonorit 4
PVC=100 Pa, L=0.01 m,
E=1000 V/m
0 40 80 120 PVC [Pa]
4000
8000
12000
16000
20000
t [s
]
Sorbonorit 4
L=0.01 m
maximum TI
drying time
E=800 V/m
E=1000 V/m
E=1200 V/m
-20
-10
0
Maxim
um
TI [°C]
0.000 0.005 0.010 0.015 0.020L [m]
0
10000
20000
30000
t [s
]
Sorbonorit 4
PVC=100 Pa
630 V/m
850 V/m
1000 V/m
1260 V/m
1800 V/m
melting
a) b)
c) d)
e) f)
www.intechopen.com

Experimental and Simulation Studies of the Primary and Secondary Vacuum Freeze Drying at Microwave Heating
629
Material thickness L 0.005÷0.02 m Initial thickness δ 0.03 L⋅ m
Elec. field strength E 630÷1800 V/m VC pressure vcP 5÷133.33 Pa
Ambient temp. Tvc 20 °C Initial temperature Tini -20 °C Heat trans. coeff. IIα ∞ 20 W/(m2K) Bed porosity ε 0.71 m3/m3
Avg. moist. cont. eqW 0.05 kg/kg Eq. moisture content iniW 1.63 kg/kg
Layer parameter Frozen layer i=I Dried layer i=II
Thermal diffusivity iea 1.54 m2/s (100 Pa) 0.30 m2/s (100 Pa)
Thermal conductivity iek 1.60 W/mK (100 Pa) 0.094 W/mK (100 Pa)
Parameter in Eq. (8) 1 iμ 0.00090 W/(KmV2) 0.00079 W/(KmV2)
Parameter in Eq. (8) 2 iμ 0.41148 W/(mV2) 0.30905 W/(mV2)
Densityieρ 1048 kg/m3 400 kg/m3
Table 1. Thermophysical properties and parameters of the Sorbonorit 4 MFD system
Fig. 6. Exemplary simulation results of mannitol MFD: a) temperature and vapor concentration profiles in the sample for various process times – VTS method and b) LT method; c) drying curves; d) temperature evolution on the sample surface TL, sample bottom T0 and sublimation front Ts versus dimensionless MB position.
0.0 0.2 0.4 0.6 0.8 1.0x* [-]
-21
-20
-19
-18
TI,
TII
[oC
]
Mannitol
PVC=100 Pa, L=0.008 m,
E=12500 V/m
TI
TII
C
0.0008
0.00075
0.000775
C [k
g/m
3]1 - 0 min.
2 - 5 min.
3 - 15 min.4 - 30 min.
5 - 1 hour
6 - 2 hours7 - 2 hours 40 min.
1
2
3
4
5
6
7
4
5
67
-22
-20
-18
-16
-14TI, T
II [
oC
]
Mannitol
PVC=100 Pa, L=0.008 m,
E=12500 V/m
TI
TII
C
0 0.2 0.4 0.6 0.8 11 0.8 0.6 0.4 0.2 0 x* [-]
0 4 8 12 16 2020 16 12 8 4 0
numerical
grid
0.00073
0.00074
0.00075
0.00076
0.00077
C [kg
/m3]
1 - 0 min.2 - 5 min.3 - 15 min.4 - 30 min.5 - 1 hour6 - 2 hours7 - 2 hours 40 min.
1
2
3
4
5
6
7
1
2
3
4
5
6
7
0 2000 4000 6000 8000 10000t [s]
0.0
0.2
0.4
0.6
0.8
1.0
X*,
W*
[-]
Mannitol
PVC=100 Pa, L=0.008 m
E=12500 V/m
E=15000 V/m
E=20000 V/m
0.0 0.2 0.4 0.6 0.8 1.0X* [-]
-22
-20
-18
-16
-14
Ts, T
0, T
L [ °C
]
Mannitol
PVC=100 Pa, L=0.008 m,
E=12500 V/m
TL
Ts
T0
a) b)
c) d)
www.intechopen.com

Advances in Induction and Microwave Heating of Mineral and Organic Materials
630
Fig. 7. Exemplary simulation and experimental results of beef MFD: a) temperature and
vapor concentration profiles in the sample for various process times – VTS method and b)
drying curve; c) temperature evolution on the sample surface TL, sample bottom T0 and
sublimation front Ts versus dimensionless MB position; d) heat flux densities generated in
the frozen layer qI, in dried layer qII and at the MB qs versus dimensionless MB position.
The heat flux densities: qI and qII presented in the Figs. 5 through 7 were computed in the
actual time step as follows: ,i ji vq Q x= Δ∑ , for i=1,2, where j denotes number of the node in
the difference scheme. The heat flux density at the sublimation front qs was determined from
the Eqs. (14) and (15) for the actual time step tΔ and MB movement XΔ . The objective of these simulations is to determine the optimal control policy of the MFD primary stage of the selected materials to improve drying rate and simultaneously achieve desired product quality. The vacuum chamber pressure Pvc and microwave power E are considered the controllable factors in the MFD system in order to avoid gas breakdown (corona discharge) and melting. The corona discharge occurs when the electric field intensity is above the threshold value. The ionization of the residual gases in the vacuum
0.0 0.2 0.4 0.6 0.8 1.0x* [-]
-30
-20
-10
0
10
20
TI,
TII
[oC
]
Beef
PVC=40 Pa, L=0.0071 m
E=10300 V/m
TI
TII
C
0.0006
0.001
C [k
g/m
3]
1 - 0 min.2 - 5 min.3 - 15 min.4 - 30 min.5 - 1 hour6 - 2 hours7 - 3 hours8 - 4 hours9 - 5 hours
10- 6¼ hours
1
2
3
4
5
6
7
8
9
108
5
6
7
8
10
9
0 5000 10000 15000 20000 25000t [s]
0.0
0.2
0.4
0.6
0.8
1.0
X*,
W*
[-]
Beef
simulation
experiments:
PVC=40 Pa, L=0.0071 m, E=10300 V/m
PVC=26.66 Pa, L=0.008 m, E=12500 V/m
0.0 0.2 0.4 0.6 0.8 1.0X* [-]
-30
-20
-10
0
10
20
Ts,
T0,
TL [ °C
]
Beef
PVC=40 Pa, L=0.0071 m
E=10300 V/mTL
Ts
T0
0.0 0.2 0.4 0.6 0.8 1.0X* [-]
0
400
800
1200
1600
2000q
s,
qI,
qII
[W/m
2]
qs
qII
qIqI+qII
Beef
PVC=26.66 Pa, L=0.008 m
E=12500 V/m
a) b)
c) d)
www.intechopen.com

Experimental and Simulation Studies of the Primary and Secondary Vacuum Freeze Drying at Microwave Heating
631
chamber leads to great energy losses and can seriously damage the final product. Since the electric field intensity E is proportional to the power applied by the microwave generator, its settings should be controlled during the process. The threshold value of the electric field is a function of chamber pressure and has the minimum in the typical pressure range used in freeze-drying (10 – 300 Pa). Therefore upper limit on the electric field strength should be set.
Another limits need to be set on the temperature maxima in the dried product to keep its
demanded quality. The temperature throughout the dried layer must be lower than the
melting temperature and the temperature throughout the dried layer must not exceed the
scorch temperature. The melting temperature of frozen foodstuffs is lower than the melting
temperature of pure ice, due to existence of soluble chemical compounds in the material.
This value amounts usually to 3 1.5 C− ÷ − ° for foodstuffs (Ma & Peltre, 1975; Ang et al.,
1977). The scorch temperature of the dried layer is a temperature of material thermal
degradation and typically amounts to 50 60 C÷ ° . More restrictive temperature constraints
are set in microwave freeze-drying of biological and pharmaceutical products, when
biological activity is an important quality factor.
In Figure 5e the drying time and maximal temperatures reached in the frozen region are
plotted as a function of the vacuum chamber pressure at various electric field strengths for
Sorbonorit 4 bed ( =0.01 mL ). As can be seen, the drying time varies strongly with the
electric field strength and is generally linearly depended on 21/E . Increase of the vacuum
chamber pressure decreases the drying time. It is caused by improved heat transfer in dried
layer. Simultaneously, the temperatures in the material increase as a result of the greater
diffusion mass transfer resistances in the dried layer. As dissipation coefficients are linearly
temperature dependent, the internal heat source capacity is greater and implies
intensification of the process. The maximal temperatures reached in the frozen region,
shown in Figure 5e, indicate that increasing the vacuum chamber pressure and electric field
strength has its limit and exceeding some constraints causes melting. The influence of the
sample thickness on the drying time at various electric field strengths is shown in Figure 5f.
Analysis of this relation leads to conclusion that smaller sample thickness would enable
using higher electric field strengths. It should significantly shorten the drying time
providing that all set constraints are not violated.
4. Mathematical modeling of the secondary MFD
4.1 Model formulation and assumptions
After primary drying, residual moisture content may be as high as 7% (Rowe & Snowman, 1978). Secondary drying is intended to reduce this to an optimum value for material stability – usually with moisture content between 0.5 and 2.0 %. In secondary stage of the MFD there is not any ice and bound water in the material bed (by means of surface forces) is removed by desorption (Fig. 8). In formulating of the mathematical model of the secondary MFD the following assumptions are made:
• Initial average moisture content of material is equal to the equilibrium moisture content at average temperature of dried layer at the end of the primary freeze drying.
• Distribution of electric field in a sample is assumed to be uniform. Dissipation
coefficient value in the whole material bed corresponds with that of dried region IIdissK
in the primary freeze drying stage.
www.intechopen.com

Advances in Induction and Microwave Heating of Mineral and Organic Materials
632
• There are two mechanisms of mass transport in the material: moisture desorption and diffusion of water vapor throughout the bed.
• Gas phase in dried material and in vacuum chamber consists of water vapor and air (inert).
• Adsorption equilibrium is described by multitemperature Langmuir isotherm.
0=x
=x L
1 2, , , ,
( ),II II IIv diss e
eq
Q K D
T f x W W
μ μ= =
N
VC.
.
.
===
vc
vc
vc
P const
T const
C const
N
Fig. 8. The physical model of the secondary MFD
4.2 Governing equations
Mass conservation:
( ) ( )
0IIbuw w
w
y C y N W
t x M t
ρε
∂ ⋅ ∂ ⋅ ∂+ + =∂ ∂ ⋅ ∂ (39)
where 1w iny y+ = and /C P RT= is a sum of molar concentrations of components in gas
phase including inert (air). Moisture mass balance in solid phase results from driving force between equilibrium moisture content and actual moisture content of a material:
( )eqW
K W Wt
∂ = −∂ (40)
Adsorption equilibrium is expressed by multitemperature extended Langmuir isotherm (Chahbani & Tondeur, 2001):
exp
exp
1 exp
w
eq L
w
cb P y
a TW W
cTb P y
T
⎡ ⎤⎛ ⎞⋅ ⋅⎜ ⎟⎢ ⎥⎛ ⎞ ⎝ ⎠= ⎢ ⎥⎜ ⎟ ⎛ ⎞⎝ ⎠ ⎢ ⎥+ ⋅ ⋅⎜ ⎟⎢ ⎥⎝ ⎠⎣ ⎦ (41)
where LW , a , b and c are the Langmuir equation constants.
www.intechopen.com

Experimental and Simulation Studies of the Primary and Secondary Vacuum Freeze Drying at Microwave Heating
633
Mass transfer:
Kinetic coefficient K in Equation (40) is calculated applying the linear driving force conception (LDF) (Glueckauf, 1955):
2
60 eff
e
DK
d
⋅= (42)
The mechanism determining vacuum desorption process is the diffusion rate in material pores which is a combination of Knudsen and surface diffusion. Thus, effective diffusivity can be expressed as:
eqwp w
eff S Kp
yMD D D
W
ερ
∂= + ∂ (43)
where pε and pρ denote particle porosity and particle density, respectively. Heat transfer: Quasi-homogeneous heat balance equation can be expressed as:
2 2
21
0IIII i
bue i pg ads v
wi
T T T Wk N y c c H Q
x t M tx
ρΣ=
∂ ∂ ∂ ∂− + + + Δ − =∂ ∂ ∂∂ ∑ (44)
where cΣ denotes total volumetric specific heat defined as::
( ) 2
1II ibu s w i pg
i
c c Wc C y cρ εΣ == + + ⋅ ∑ (45)
Values wc and sc are the specific heat capacities of liquid water and dry material sample, respectively. Isosteric adsorption heat of water vapor in dried material included in Equation (41) is
estimated from Clausius-Clapeyron type equation (Do, 1998):
2 lnads
W
PH RT
T
∂⎛ ⎞Δ = − ⎜ ⎟∂⎝ ⎠ (46)
Above equation after incorporating multitemperature Langmuir isotherm can be rewritten
in analytical form:
exp( / )
exp( / ) exp( / )L
adsL L
R W a T W cH a c
W a T W W a T
⎛ ⎞⋅ ⋅Δ = − + −⎜ ⎟− ⎝ ⎠ (47)
Source term in Equation (44) resulting from dissipation of microwave energy in material
volume is defined as:
2IIv dissQ K E= (48)
Dissipation coefficient IIdissK in Equation (48) is expressed as a linear function of material
temperature (similarly as in equation (8)):
www.intechopen.com

Advances in Induction and Microwave Heating of Mineral and Organic Materials
634
1 2( )II II IIdissK T Tμ μ≈ + (49)
where parameters 1μ and 2μ are determined by linear regression of experimental data (Witkiewicz, 2006).
Momentum balance
Pressure drop along the sample axis is described by Ergun relation (Ergun, 1952):
2
2
1 E
i iD Di
kPN y M N
x C k C k
η=
∂ = − −∂ ⋅ ∑ (50)
where 1i = denotes water vapor and 2i = means inert gas (air). Parameter Dk in above Equation defines permeability of dried bed and Ek parameter describes inertial effect:
( ) ( )2 3
2
1.75 ;
150 1150 1
e eD E
d dk k
εεε= = −− (51)
In order to simplify calculation the following relation defining molar flux density of water vapor is derived (Sun et. al, 1995):
1
22
1
2 /
1 1 4 ( ) /
D
i i D Ei
Ck P xN
C y M k k P x
ηη
−−
−
∂ ∂= −+ + ⋅ ∂ ∂∑
(52)
Boundary and initial conditions
Formulated mathematical model is solved together with the following boundary and initial conditions:
0iy
x
∂ =∂ ; 0P
x
∂ =∂ ; 0T
x
∂ =∂ for 0x = (53a)
0T
x
∂ =∂ ; ( )P P t= for x L= (53b)
( ,0)W W x= ; ( ,0)T T x= ; ( ,0)P P x= for 0t = (54)
4.3 Solution of the mathematical model
Dimensionless variables
Model equations can be expressed in more convenient dimensionless form incorporating the following definitions of dimensionless variables:
*2IIea t
tL
= ; * xx
L= ;
PP
P∗ = Δ ; * 0T T
TT
−= Δ
* eq
ini eq
W WW
W W
−= − ; *
0
ww
w
y CC
C= ; ( )* 2 /v v eQ Q L k T= Δ ;
(55)
www.intechopen.com

Experimental and Simulation Studies of the Primary and Secondary Vacuum Freeze Drying at Microwave Heating
635
where pressure and temperature are normalized relatively to arbitrary chosen increments
PΔ and TΔ respectively.
Governing equations in dimensionless form
Mathematical model after transformation consists of mass balance in gas phase:
( ) ( ) *
0 * * *0II II
II
e bu ini eqwwe w
w
a W Wy NC Wa C L
Mt x t
ρε
∗ −∂ ⋅∂ ∂+ + =∂ ∂ ∂ (56)
mass balance in solid phase:
* 2
**
IIe
W LKW
at
∂ = −∂ (57)
quasi-homogeneous heat balance:
( )22 * * * *
**2 * * *
1
0II II
II i II
e ini eq bu adse i pg e v
wi
a W W HT T T Wk LN y c Lc k Q
T Mx x t t
ρΣ=
− Δ∂ ∂ ∂ ∂− + + + − =Δ∂ ∂ ∂ ∂∑ (58)
and Ergun equation:
( ) 2
2*
1
( )
E
i iD Di
P L L kP N y M N
C k C kx
η∗
=∂Δ = − −∂ ∑ (59)
where *W is expressed by multitemperature extended Langmuir isotherm. Mathematical model is solved numerically by means of numerical method of lines (NMOL)
which requires transformation of partial differential equations into set of ordinary
differential equations for time derivatives, and approximation of space derivatives by
adequate finite differences (Schiesser, 1991).
4.4 Modeling results of the MFD secondary stage
In theoretical analysis the vacuum desorption of water in Zeolite DAY-20F at microwave
heating is considered. Parameters of multitemperature Langmuir isotherm (Eq. (41)) for
water–Zeolite DAY-20F system listed in Table 2 were approximated by nonlinear
Levenberg-Marquardt estimation of data within temperature range of 293÷373 K (Sun et al.,
1995).
Constants of multitemperature Langmuir isotherm equation Component
, kg /kgLW , Ka -1, Pab , Kc
Water 0.370300 1387.82 -60.170 10⋅ 1511.02
Table 2. Constants of multitemperature Langmuir isotherm equation for water–Zeolite DAY- 20F system
www.intechopen.com
Advances in Induction and Microwave Heating of Mineral and Organic Materials
636
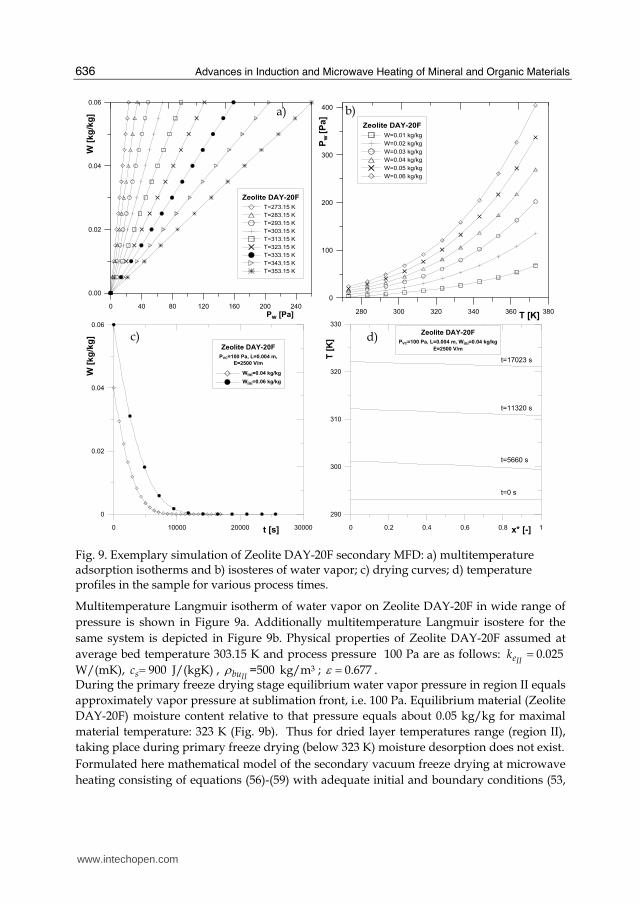
Fig. 9. Exemplary simulation of Zeolite DAY-20F secondary MFD: a) multitemperature adsorption isotherms and b) isosteres of water vapor; c) drying curves; d) temperature profiles in the sample for various process times.
Multitemperature Langmuir isotherm of water vapor on Zeolite DAY-20F in wide range of
pressure is shown in Figure 9a. Additionally multitemperature Langmuir isostere for the
same system is depicted in Figure 9b. Physical properties of Zeolite DAY-20F assumed at
average bed temperature 303.15 K and process pressure 100 Pa are as follows: 0.025IIek =
W/(mK), 900sc = J/(kgK) , =500IIbuρ kg/m3 ; 0.677ε = .
During the primary freeze drying stage equilibrium water vapor pressure in region II equals
approximately vapor pressure at sublimation front, i.e. 100 Pa. Equilibrium material (Zeolite
DAY-20F) moisture content relative to that pressure equals about 0.05 kg/kg for maximal
material temperature: 323 K (Fig. 9b). Thus for dried layer temperatures range (region II),
taking place during primary freeze drying (below 323 K) moisture desorption does not exist.
Formulated here mathematical model of the secondary vacuum freeze drying at microwave
heating consisting of equations (56)-(59) with adequate initial and boundary conditions (53,
0 40 80 120 160 200 240
Pw [Pa]
0.00
0.02
0.04
0.06
W [
kg
/kg
]
Zeolite DAY-20F
T=273.15 K
T=283.15 K
T=293.15 K
T=303.15 K
T=313.15 K
T=323.15 K
T=333.15 K
T=343.15 K
T=353.15 K
280 300 320 340 360 380T [K]
0
100
200
300
400
Pw
[P
a]
Zeolite DAY-20F
W=0.01 kg/kg
W=0.02 kg/kg
W=0.03 kg/kg
W=0.04 kg/kg
W=0.05 kg/kg
W=0.06 kg/kg
0 10000 20000 30000t [s]
0
0.02
0.04
0.06
W [
kg
/kg
]
Zeolite DAY-20F
PVC=100 Pa, L=0.004 m,
E=2500 V/m
Wini=0.04 kg/kg
Wini=0.06 kg/kg
0 0.2 0.4 0.6 0.8 1x* [-]
290
300
310
320
330T
[K
]Zeolite DAY-20F
PVC=100 Pa, L=0.004 m, Wini=0.04 kg/kg
E=2500 V/m
t=0 s
t=5660 s
t=11320 s
t=17023 s
a) b)
c) d)
www.intechopen.com

Experimental and Simulation Studies of the Primary and Secondary Vacuum Freeze Drying at Microwave Heating
637
54) was solved by 4th order Runge-Kutta method with the following process parameters:
L=0.004 m, =0.04iniW or 0.06 kg/kg, 61 1.107 10
IIμ −= × 2W/(mV K) , 3
2 1.021 10II
μ −= × 2W/(mV ) , 2500 V/mE = and initial bed temperature ( ,0) 293.15 KT x = . Calculated
dissipation coefficient at this conditions amounts to 31.054 10IIdissK −= × and average
capacity of internal volumetric heat source throughout the material equals: 3 6588 W/mvQ = . Obtained results of numerical simulation are presented in Figs. 9c and
9d.Moisture contents versus time for two initial bed moisture contents 0.04iniW = and
0. 06 /kg kg in Zeolite DAY-20F bed of thickness 0.04L m= are shown in Figure 9c. Figure
9d depicts dried bed temperatures versus dimensionless positions in the material layer, for
various process times at sample thickness 0.04L m= and initial moisture content
0.04 /iniW kg kg= .
5. Conclusions
The mathematical model of both the primary and the secondary freeze drying stages of
random solids at microwave heating was developed. Experimental and/or theoretical
investigations of the primary freeze drying at microwave heating were presented for three
selected materials: beef, Sorbonorit 4 activated carbon and mannitol. Furthemore, theoretical
analysis of the secondary freeze drying at microwave heating was performed for Zeolite
DAY-20F bed.
For dried granular materials such as: Sorbonorit 4, Zeolite DAY-20F, characterized by
considerable internal porosity, primary freeze drying stage is not sufficient to remove entire
moisture contained in the dried bed. During the primary freeze drying at microwave
heating free, interstitial moisture is removed. The secondary freeze drying stage is then
necessary to remove residual moisture which may be as high as 7%, after primary stage.
Kinetics of the microwave freeze drying process is enhanced in comparison with the freeze
drying at conventional heating. It is caused mainly by the fact, that in conventional heating
(e.g. contact or radiative) temperature and mass transfer gradients in the dried material have
opposite directions. On the contrary, in the freeze drying process at microwave heating both
temperature, and mass transfer gradients are cocurrent. It is very convenient phenomenon
from point of view of the qualitative final dried material properties.
Assumption of constant electric field strength in a dried material is valid for sample
dimensions up to half wavelength order in monomodal resonant cavities. Formulated
mathematical model can be also applicable in the microwave heating of sample dimensions
equaled multiple of wavelengths in multimodal applicators with uniform distribution of
electric field strength.
The model for the secondary freeze drying at microwave heating takes into account mass
transfer resistances which arise in vacuum desorption. The LDF mass transfer model with a
variable, lumped-resistance coefficient K was used. This numerical model was applied to
perform computer simulation of the vacuum desorption of pure water from Zeolite
DAY-20F.
Experimental verification of the some model simulations of the primary freeze drying at
microwave heating approved its fairly good usefulness for design applications. Furthemore,
mathematical model of the vacuum desorption in the secondary freeze drying enables
predictions of the drying kinetics for the granular solids.
www.intechopen.com

Advances in Induction and Microwave Heating of Mineral and Organic Materials
638
6. Nomenclature
ea effective thermal diffusivity (m2/s)
, wp pc c effective specific heat (material region, water vapor) (J/kg K)
gpc effective specific heat of gas phase ((J/mol K))
C gas phase molar concentration (mol/m3)
,3, w sC C water vapor mass concentration (general, triple point) (kg/m3)
ed equivalent particle diameter (m)
, , , IIe K M SD D D D water vapor diffusivity (effective, Knudsen, molecular, surface) in dry
layer (m2/s)
0, , , rmsE E EE electric field strength (general, spatial vector, peak, r.m.s.) (V/m)
f frequency (Hz)
dissK dissipation coefficient (W/mV2)
L sample thickness (m)
, w inM M molar mass (water, inert) (kg/mol)
N gas phase molar flux density in the secondary MFD (mol/m2s)
wN water vapor mass flux density from sublimation front (kg/m2s)
P total pressure (Pa)
q heat flux density (W/m2)
vQ volumetric heat source capacity (W/m3)
pr mean pore radius (m)
R universal gas constant (J/mol K)
t time (s)
,3 0, , , avgII sT T T T temperature (general, average in region II, triple point, starting value)
(K, °C)
0, , , Weq iniW W W moisture content of dried bed (average, equilibrium, initial, starting
value when microwave heating is turned on) (dry basis, kg/kg)
0, , x X X Cartesian position coordinate (general, moving boundary, starting) (m)
, eqw wy y water vapor mole fraction (general, equilibrium) (mol/mol)
Greek symbols
IIα ∞ heat transfer coefficient at the surface of dried region II (W/m2K)
δ arbitrary initial thickness of the dried layer (m)
tan δ dielectric loss tangent (-)
shΔ enthalpy of sublimation (J/kg)
adshΔ heat of adsorption (J/mol)
ε bed porosity, (-)
0ε free space permittivity (F/m)
′ε relative dielectric constant (–)
′′ε relative loss factor (–)
η gas phase viscosity (Pa s)
0 , wλ λ wavelength (free space, waveguide) (m)
1μ constant in Eq. (8) (W/mV2K)
2μ constant in Eq. (8) (W/mV2)
www.intechopen.com

Experimental and Simulation Studies of the Primary and Secondary Vacuum Freeze Drying at Microwave Heating
639
buρ bulk density (kg/m3)
ω angular frequency (rad/s)
Subscripts and superscripts
1, 2 gas phase (water vapor, air)
, I II region number (frozen, dried)
L at sample exposed surface
s at moving boundary (sublimation front)
vc vacuum chamber
∗ dimensionless value
Abbreviations
FD freeze drying LDF linear driving force LT Landau transformation MB moving boundary (sublimation front) MFD microwave freeze drying NMOL numerical method of lines VTS variable time-step
7. References
Ang, T.K.; Ford, J.D. & Pei, D.C.T. (1977). Microwave freeze-drying of food: a theoretical investigation, International Journal of Heat and Mass Transfer, 20, pp. 517-526.
Chahbani, M.H. & Tondeur, V. (2001). Pressure drop in fixed-bed adsorbers, Chem. Eng. J., 81, pp. 23-34.
Coulson, J.M.; Richardson, J.F. & Sinnott, R.K. (1999). Chemical Engineering, Vol. 6, Butterworth-Heinemann, Oxford.
Do, D.D. (1998). Adsorption Analysis: Equilibria and Kinetics, Imperial College Press, London. Ergun, S. (1952). Fluid flow through packed column, Chem. Eng. Progress, 48, pp. 89-94. Glueckauf, E. (1955). Theory of chromatography, Trans. Faraday Soc., 51, pp. 1540-1551. Liapis, A.I. & Bruttini R. (1996). Mathematical models for the primary and secondary drying
stages of the freeze drying of pharmaceuticals on trays and vials. In: Mathematical Modeling and Numerical Techniques in Drying Technology, Turner, I & Mujumdar, A.S., (Eds), pp. 481-536, CRC Press, ISBN: 9780824798185, Marcel Dekker, New York.
Liapis, A.I. & Bruttini, R. (2006). Freeze drying, In: Handbook of Industrial Drying, Mujumdar A.S., (Ed.), pp. 257-284, CRC Press, ISBN: 9781574446685, New York.
Ma, Y.H. & Peltre, P.R. (1973). Mathematical simulation of a freeze drying process using microwave energy, AIChE Symp. Ser., 132, 69, 47-54.
Ma, Y.H. & Peltre, P.R. (1975a). Freeze dehydration by microwave energy: Part I. Theoretical investigation. AIChE Journal, 21, 2, pp. 335-344.
Ma, Y.H. & Peltre, P.R. (1975b). Freeze dehydration by microwave energy: Part II. Experimental Study. AIChE Journal, 21, 2, pp. 344-350.
Metaxas, A. C. (1996). Foundations of Electroheat: A Unified Approach, John Wiley & Sons, New York.
www.intechopen.com
Advances in Induction and Microwave Heating of Mineral and Organic Materials
640
Péré, C.; Rodier, E. & Louisnard, O. (2001). Microwave vacuum drying of porous media: verification of a semi-empirical formulation of the total absorbed power. Drying Technology, 19, 6, pp. 1005-1022.
Poling, B.E.; Prausnitz, J.M. & O’Connell, J.P. (2001). The properties of gases and liquids, Fifth Edition, McGraw-Hill, New York.
Rowe, T.W. & Snowman, J.W. (1978). Edwards Freeze drying Handbook, Crawley, Cambridge. Schiesser, W.E. (1991). The Numerical Method of Lines: Integration of Partial Differential
Equations, Academic Press, New York. Schiffmann, R.F. (2006). Microwave and dielectric drying. In.: Handbook of Industrial Drying
Mujumdar A.S., (Ed.), pp. 286-306, CRC Press, ISBN: 9781574446685, New York. Sun, L.M.; Amar, N.B. & Meunier F. (1995). Numerical study on coupled heat and mass
transfer in an adsorber with external fluid heating, Heat Recovery Systems & CHP, 15, pp. 19-29.
Wang, Z.H. & Shi, M.H. (1998). Numerical study on sublimation-condensation phenomena during microwave freeze drying. Chemical Engineering Science, 53, 18, pp. 3189-3197.
Wang, W. & Chen, G. (2003). Numerical investigation on dielectric material assisted microwave freeze-drying of aqueous mannitol solution. Drying Technology, 21, 6, pp. 995-1017.
Witkiewicz, K. (2006). The Numerical Modeling of Freeze Drying of Granular Solids at Microwave Heating, Ph.D. Dissertation, Szczecin University of Technology, Szczecin, (in Polish).
Wolff, E.; Gilbert, H. & Rodolphe, F (1989). Vacuum freeze drying kinetics and modelling of a liquid in a vial, Chemical Engineering and Processing, 25, pp. 153-158.
Yuen, W.W. & Kleinman, A.M. (1980). Application of a variable time-step finite-difference method for the one-dimensional melting problem including the effect of subcooling, AIChE Journal, 26, 5, pp. 828-832.
Yun, J.-H.; Choi, D.-K. & Kim, S.-H. (1999). Equilibria and dynamics for mixed vapors of BTX in an activated carbon bed, AIChE. Journal, 45, 4, pp. 751- 760.
www.intechopen.com

Advances in Induction and Microwave Heating of Mineral andOrganic MaterialsEdited by Prof. Stanisław Grundas
ISBN 978-953-307-522-8Hard cover, 752 pagesPublisher InTechPublished online 14, February, 2011Published in print edition February, 2011
InTech EuropeUniversity Campus STeP Ri Slavka Krautzeka 83/A 51000 Rijeka, Croatia Phone: +385 (51) 770 447 Fax: +385 (51) 686 166www.intechopen.com
InTech ChinaUnit 405, Office Block, Hotel Equatorial Shanghai No.65, Yan An Road (West), Shanghai, 200040, China Phone: +86-21-62489820 Fax: +86-21-62489821
The book offers comprehensive coverage of the broad range of scientific knowledge in the fields of advancesin induction and microwave heating of mineral and organic materials. Beginning with industry application inmany areas of practical application to mineral materials and ending with raw materials of agriculture origin theauthors, specialists in different scientific area, present their results in the two sections: Section 1-Induction andMicrowave Heating of Mineral Materials, and Section 2-Microwave Heating of Organic Materials.
How to referenceIn order to correctly reference this scholarly work, feel free to copy and paste the following:
Józef Nastaj and Konrad Witkiewicz (2011). Experimental and Simulation Studies of the Primary andSecondary Vacuum Freeze Drying at Microwave Heating, Advances in Induction and Microwave Heating ofMineral and Organic Materials, Prof. StanisÅ‚aw Grundas (Ed.), ISBN: 978-953-307-522-8, InTech, Availablefrom: http://www.intechopen.com/books/advances-in-induction-and-microwave-heating-of-mineral-and-organic-materials/experimental-and-simulation-studies-of-the-primary-and-secondary-vacuum-freeze-drying-at-microwave-h

© 2011 The Author(s). Licensee IntechOpen. This chapter is distributedunder the terms of the Creative Commons Attribution-NonCommercial-ShareAlike-3.0 License, which permits use, distribution and reproduction fornon-commercial purposes, provided the original is properly cited andderivative works building on this content are distributed under the samelicense.