Embed Size (px)
Citation preview

Experimental and theoretical study of electronic structure of lutetium bi-phthalocyanineI. Bidermane, J. Lüder, S. Boudet, T. Zhang, S. Ahmadi et al. Citation: J. Chem. Phys. 138, 234701 (2013); doi: 10.1063/1.4809725 View online: http://dx.doi.org/10.1063/1.4809725 View Table of Contents: http://jcp.aip.org/resource/1/JCPSA6/v138/i23 Published by the AIP Publishing LLC. Additional information on J. Chem. Phys.Journal Homepage: http://jcp.aip.org/ Journal Information: http://jcp.aip.org/about/about_the_journal Top downloads: http://jcp.aip.org/features/most_downloaded Information for Authors: http://jcp.aip.org/authors
Downloaded 26 Sep 2013 to 130.238.171.100. This article is copyrighted as indicated in the abstract. Reuse of AIP content is subject to the terms at: http://jcp.aip.org/about/rights_and_permissions
THE JOURNAL OF CHEMICAL PHYSICS 138, 234701 (2013)
Experimental and theoretical study of electronic structureof lutetium bi-phthalocyanine
I. Bidermane,1,2,a) J. Lüder,1 S. Boudet,3 T. Zhang,2 S. Ahmadi,4 C. Grazioli,5 M. Bouvet,6
J. Rusz,1 B. Sanyal,1 O. Eriksson,1 B. Brena,1 C. Puglia,1 and N. Witkowski21Department of Physics and Astronomy, Uppsala University, Box-516, 75120 Uppsala, Sweden2Institut des Nanosciences de Paris, UPMC Univ. Paris 06, CNRS UMR 7588, F-75005 Paris, France3Laboratoire de Projection Thermique, CEA Le Ripault, Département Matériaux, 37260 Monts, France4Materialfysik, KTH-Electrum, Isafjordsgatan 22, 16440 Kista, Sweden5Sincrotrone Trieste S.C.p.A., Area Science Park, S.S.14, Km 163.5, 34012 Trieste, Italy6Institut de Chimie Moléculaire de l’Université de Bourgogne, CNRS UMR 6302, Université de Bourgogne,F-21078 Dijon, France
(Received 19 March 2013; accepted 23 May 2013; published online 17 June 2013)
Using Near Edge X-Ray Absorption Fine Structure (NEXAFS) Spectroscopy, the thickness depen-dent formation of Lutetium Phthalocyanine (LuPc2) films on a stepped passivated Si(100)2×1 recon-structed surface was studied. Density functional theory (DFT) calculations were employed to gaindetailed insights into the electronic structure. Photoelectron spectroscopy measurements have notrevealed any noticeable interaction of LuPc2 with the H-passivated Si surface. The presented studycan be considered to give a comprehensive description of the LuPc2 molecular electronic structure.The DFT calculations reveal the interaction of the two molecular rings with each other and withthe metallic center forming new kinds of orbitals in between the phthalocyanine rings, which allowsto better understand the experimentally obtained NEXAFS results. © 2013 AIP Publishing LLC.[http://dx.doi.org/10.1063/1.4809725]
I. INTRODUCTION
Hybrid systems are experiencing an unprecedented de-velopment for the fabrication of devices in various sectors ofnanotechnology. In such a context, phthalocyanine (Pc) com-plexes have received a great deal of attention because of theirunique optical and electronic properties and high thermal sta-bility. Many relevant applications have emerged such as en-ergy cells,1 electrochromic displays,2 and gas sensors.3, 4 Thisrapid development leads to the need of deep investigations andcomprehensive understanding of molecule/substrate interfaceformation in the initial growth phase and molecule/moleculeinteraction in the next phases. Electron spectroscopies, suchas X-ray Photoemission Spectroscopy (XPS) and Near EdgeX-ray Absorption Fine Structure Spectroscopy (NEXAFS)can provide direct information on the bonding between Pcand the substrate and the electronic charge distribution andthe geometric configuration (arrangement of the adsorbedmolecules).
Recently, rare-earth double-decker phthalocyaninemolecules have attracted a great attention for their applica-tion in organic-based field effect transistors5, 6 due to theirtunable electronic properties. In this study, we focus ondouble-decker lutetium phthalocyanine (LuPc2), which iscomposed of two identical phthalocyanines, rotated by 45 ◦
against each other and bridged via a Lu(III) ion as depicted inFig. 1. The electronic structure of LuPc2 is characterized bya single semi-occupied molecular orbital (SOMO) betweenthe highest occupied molecular orbital (HOMO) and the
a)Electronic mail: [email protected]
lowest unoccupied molecular orbital (LUMO), i.e., in theHOMO-LUMO gap. Therefore, the SOMO electronic statecan accommodate or donate its electron, making LuPc2 atunable donor or acceptor carrier transporter.
Despite a very large amount of work devoted to the elu-cidation of molecular interaction of Pc molecules on metalsurfaces,7, 8 only few studies have focused on the semicon-ducting surfaces9, 10 and even less on double-decker Pc’s onthese technologically relevant surfaces.11, 12 On most metal-lic surfaces, Pc molecules are known to lie flat, whereasthe molecular architectures are various on semiconductingsubstrates. Pc molecules are found lying flat on InSb(001)surface,9 whereas they are inclined on Si(001).11, 13 Further-more, a transition from lying-down to standing-up configura-tion occurs in less than one monolayer of CuPc on Si(111).14
The different orientations are also observed on passivatedsurfaces. PbPc molecules are found to be flat on passivatedGe,15 whereas CuPc molecules are standing up on Si(001)passivated with H or NH3.16 In this context, the orienta-tion of LuPc2 adsorbed on the passivated Si(100)-2×1:His here investigated by means of synchrotron based tech-niques, such as XPS and NEXAFS, in combination with DFTcalculations.
We show that LuPc2 has a weak chemical interaction withthe substrate. In this sense, our study can be considered as acomprehensive study of the electronic structure of the LuPc2
molecules. Our results elucidate the different electronic struc-ture of double decker phthalocyanines compared to singledecker phthalocyanines using experimental NEXAFS mea-surements supported by the DFT calculations. We also finda change in the orientation of the molecules as a function
0021-9606/2013/138(23)/234701/8/$30.00 © 2013 AIP Publishing LLC138, 234701-1
Downloaded 26 Sep 2013 to 130.238.171.100. This article is copyrighted as indicated in the abstract. Reuse of AIP content is subject to the terms at: http://jcp.aip.org/about/rights_and_permissions
234701-2 Bidermane et al. J. Chem. Phys. 138, 234701 (2013)
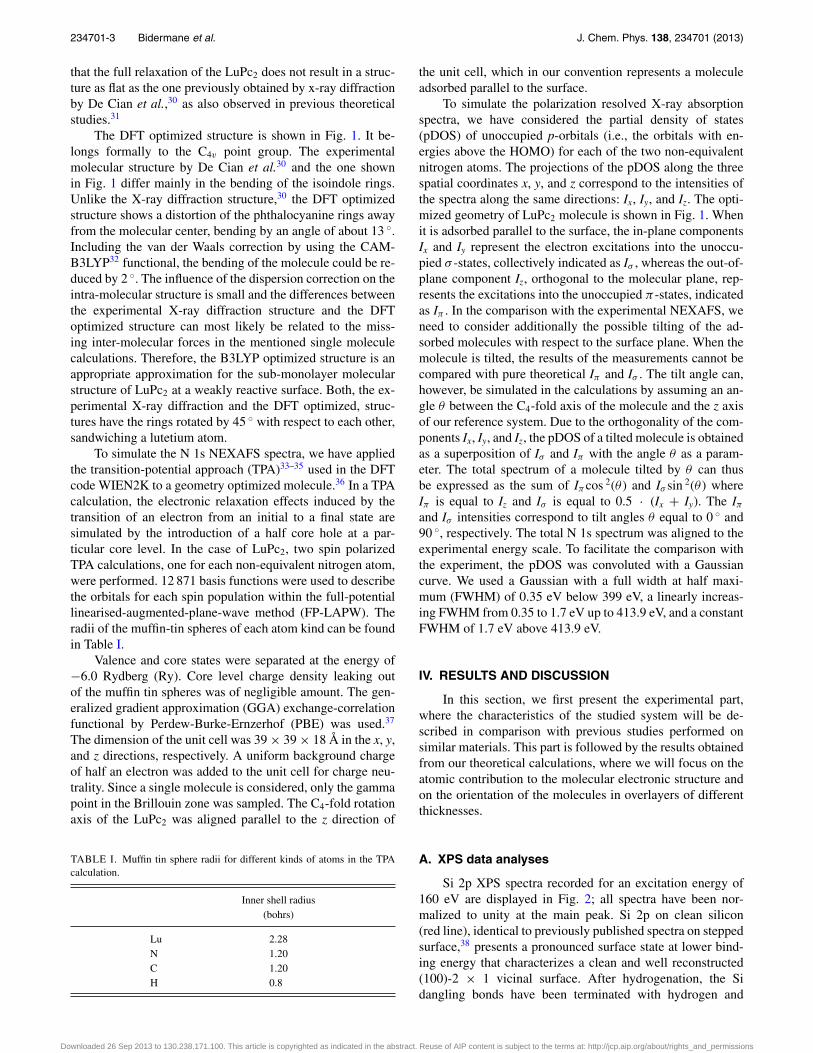
FIG. 1. LuPc2 structure optimized by DFT calculations.
of coverage and derive an average tilt angle from the DFTcalculations.
II. EXPERIMENTAL DETAILS
Experiments have been carried out at the Swedish na-tional synchrotron MAX-Lab on two beamlines – beamlineI511 surface branch-line and D1011 beamline, as well as atthe French national synchrotron SOLEIL on the beamlineTEMPO.
A. Sample preparation
Single-domain vicinal n-doped Si(001), provided by Sil-tronix, with a 4 ◦ miscut angle in [110] direction was pre-pared using a standard procedure already described in pre-vious works.17, 18 In order to reduce the interaction betweenthe substrate and the organic layer, required for a comprehen-sive molecular electronic structure investigation, the siliconsurface was passivated by a hydrogenation process, i.e., passi-vating the silicon surface atoms (dangling bonds) by hydrogenatoms.19 The hydrogenation was performed using an OmicronAtomic Hydrogen Source at the I511 end-station and D1011beam line, and a hot filament located few centimeters from thesurface of the sample at TEMPO beamline. The pressure dur-ing the hydrogenation was kept in the mid 10−8 mbar range,while setting the Si surface at 300 ◦C, leading to a 2 × 1 re-construction as checked with Low Energy Electron Diffrac-tion (LEED).
LuPc2 was synthesized according to the literaturemethods.20 Knudsen cell type evaporator from Ferrovac wasused to evaporate LuPc2, which was outgassed for few hoursat 250 ◦C until recovering the base pressure (low 10−10 mbarrange). During the molecular deposition, the crucible washeated resistively around 300 ◦C, while keeping the vaporpressure in the 10−9 mbar range. Several samples have beenprepared with varying thicknesses from submonolayer up toseveral layers.
The thicknesses of organic films (from monolayer upto bulk like film) were estimated from photoemission spec-troscopy data using a so-called overlayer method,21 assumingexponential decay of the substrate core level intensity.
B. XPS measurements
The experiment was carried out at TEMPO beamline atthe French synchrotron facility (SOLEIL) in France. TEMPO
is a soft x-rays beamline that can produce radiation with anyorientation of circular and linear polarization with photon en-ergy ranging from 50 eV to 1500 eV. The beamlines end sta-tion is equipped with a Scienta-200 electron analyzer dedi-cated to electron spectroscopy studies of surfaces. Details onthe TEMPO beamline and its end-station can be found in Ref.22.
Core level XPS spectra were taken in normal emissionof the photoelectrons. Photon energies of 160 eV and 330 eVwere used for Si 2p and C 1s core levels, respectively. Theoverall resolution of core level spectra was about 50 meV.Shirley background has been removed from all XPS spectra23
and, height has been normalized to unity on the largest peak.The binding energy (BE) has been calibrated with respect tothe Si 2p3/2 bulk component set at 99.35 eV in BE, as foundin the literature.24
C. NEXAFS measurements
The experiments were performed at beamlines I511 atthe MAX-Lab synchrotron radiation facility in Lund, Sweden.I511 is an undulator based beamline with a Zeiss SX700 planegrating monochromator providing high-intensity linearly po-larized synchrotron radiation of the photon energy rangingfrom 100 to 1500 eV. The end station was equipped with Sci-enta R4000 hemispherical electron energy analyzer and theanalysis chamber could be rotated around the incoming beam.Additional details about experimental set-up can be found inRef. 25.
Absorption spectra of nitrogen were recorded in Augerelectron yield mode in an energy window of 30 eV around thenitrogen KLL transition at 370 eV, the incoming photon en-ergy ranging from 395 eV to 425 eV. Electrons were detectedin a 45 ◦ angle with respect to the polarization vector. Thespectra were first normalized to the intensity of the incominglight measured on a gold mesh, then normalized to unity at425 eV.26 Two polarizations were investigated: in-plane po-larization (IPL) for which the polarization E vector of theradiation was parallel to the surface and out-of-plane polar-ization (OPL) for which the polarization was about 83 ◦ fromthe surface plane. The photon energy calibration was doneby measuring the first and second order light from the Si 2pcore level for thin layers, and C 1s core level spectra for thicklayers. The overall resolution of NEXAFS spectra is about100 meV. Due to poor statistics for thin layer measurementsobtained on I511, data from another experiment performed onD1011 (Max-Lab) on the same system were used, taking carethat the overall line shape of both spectra was identical.
III. COMPUTATIONAL DETAILS
The ground state calculation and geometry optimizationof LuPc2 were performed by means of DFT calculations us-ing the GAUSSIAN 09 program27 with the hybrid UB3LYPexchange-correlation functional.28 The lutetium atom wasdescribed by the Dresden/Stuttgart effective core potential(SDD) basis set29 and all the other atoms by the 6-31G(d,p)valence double ζ plus polarization basis set. It has to be noted
Downloaded 26 Sep 2013 to 130.238.171.100. This article is copyrighted as indicated in the abstract. Reuse of AIP content is subject to the terms at: http://jcp.aip.org/about/rights_and_permissions
234701-3 Bidermane et al. J. Chem. Phys. 138, 234701 (2013)
that the full relaxation of the LuPc2 does not result in a struc-ture as flat as the one previously obtained by x-ray diffractionby De Cian et al.,30 as also observed in previous theoreticalstudies.31
The DFT optimized structure is shown in Fig. 1. It be-longs formally to the C4v point group. The experimentalmolecular structure by De Cian et al.30 and the one shownin Fig. 1 differ mainly in the bending of the isoindole rings.Unlike the X-ray diffraction structure,30 the DFT optimizedstructure shows a distortion of the phthalocyanine rings awayfrom the molecular center, bending by an angle of about 13 ◦.Including the van der Waals correction by using the CAM-B3LYP32 functional, the bending of the molecule could be re-duced by 2 ◦. The influence of the dispersion correction on theintra-molecular structure is small and the differences betweenthe experimental X-ray diffraction structure and the DFToptimized structure can most likely be related to the miss-ing inter-molecular forces in the mentioned single moleculecalculations. Therefore, the B3LYP optimized structure is anappropriate approximation for the sub-monolayer molecularstructure of LuPc2 at a weakly reactive surface. Both, the ex-perimental X-ray diffraction and the DFT optimized, struc-tures have the rings rotated by 45 ◦ with respect to each other,sandwiching a lutetium atom.
To simulate the N 1s NEXAFS spectra, we have appliedthe transition-potential approach (TPA)33–35 used in the DFTcode WIEN2K to a geometry optimized molecule.36 In a TPAcalculation, the electronic relaxation effects induced by thetransition of an electron from an initial to a final state aresimulated by the introduction of a half core hole at a par-ticular core level. In the case of LuPc2, two spin polarizedTPA calculations, one for each non-equivalent nitrogen atom,were performed. 12 871 basis functions were used to describethe orbitals for each spin population within the full-potentiallinearised-augmented-plane-wave method (FP-LAPW). Theradii of the muffin-tin spheres of each atom kind can be foundin Table I.
Valence and core states were separated at the energy of−6.0 Rydberg (Ry). Core level charge density leaking outof the muffin tin spheres was of negligible amount. The gen-eralized gradient approximation (GGA) exchange-correlationfunctional by Perdew-Burke-Ernzerhof (PBE) was used.37
The dimension of the unit cell was 39 × 39 × 18 Å in the x, y,and z directions, respectively. A uniform background chargeof half an electron was added to the unit cell for charge neu-trality. Since a single molecule is considered, only the gammapoint in the Brillouin zone was sampled. The C4-fold rotationaxis of the LuPc2 was aligned parallel to the z direction of
TABLE I. Muffin tin sphere radii for different kinds of atoms in the TPAcalculation.
Inner shell radius(bohrs)
Lu 2.28N 1.20C 1.20H 0.8
the unit cell, which in our convention represents a moleculeadsorbed parallel to the surface.
To simulate the polarization resolved X-ray absorptionspectra, we have considered the partial density of states(pDOS) of unoccupied p-orbitals (i.e., the orbitals with en-ergies above the HOMO) for each of the two non-equivalentnitrogen atoms. The projections of the pDOS along the threespatial coordinates x, y, and z correspond to the intensities ofthe spectra along the same directions: Ix, Iy, and Iz. The opti-mized geometry of LuPc2 molecule is shown in Fig. 1. Whenit is adsorbed parallel to the surface, the in-plane componentsIx and Iy represent the electron excitations into the unoccu-pied σ -states, collectively indicated as Iσ , whereas the out-of-plane component Iz, orthogonal to the molecular plane, rep-resents the excitations into the unoccupied π -states, indicatedas Iπ . In the comparison with the experimental NEXAFS, weneed to consider additionally the possible tilting of the ad-sorbed molecules with respect to the surface plane. When themolecule is tilted, the results of the measurements cannot becompared with pure theoretical Iπ and Iσ . The tilt angle can,however, be simulated in the calculations by assuming an an-gle θ between the C4-fold axis of the molecule and the z axisof our reference system. Due to the orthogonality of the com-ponents Ix, Iy, and Iz, the pDOS of a tilted molecule is obtainedas a superposition of Iσ and Iπ with the angle θ as a param-eter. The total spectrum of a molecule tilted by θ can thusbe expressed as the sum of Iπcos 2(θ ) and Iσ sin 2(θ ) whereIπ is equal to Iz and Iσ is equal to 0.5 · (Ix + Iy). The Iπand Iσ intensities correspond to tilt angles θ equal to 0 ◦ and90 ◦, respectively. The total N 1s spectrum was aligned to theexperimental energy scale. To facilitate the comparison withthe experiment, the pDOS was convoluted with a Gaussiancurve. We used a Gaussian with a full width at half maxi-mum (FWHM) of 0.35 eV below 399 eV, a linearly increas-ing FWHM from 0.35 to 1.7 eV up to 413.9 eV, and a constantFWHM of 1.7 eV above 413.9 eV.
IV. RESULTS AND DISCUSSION
In this section, we first present the experimental part,where the characteristics of the studied system will be de-scribed in comparison with previous studies performed onsimilar materials. This part is followed by the results obtainedfrom our theoretical calculations, where we will focus on theatomic contribution to the molecular electronic structure andon the orientation of the molecules in overlayers of differentthicknesses.
A. XPS data analyses
Si 2p XPS spectra recorded for an excitation energy of160 eV are displayed in Fig. 2; all spectra have been nor-malized to unity at the main peak. Si 2p on clean silicon(red line), identical to previously published spectra on steppedsurface,38 presents a pronounced surface state at lower bind-ing energy that characterizes a clean and well reconstructed(100)-2 × 1 vicinal surface. After hydrogenation, the Sidangling bonds have been terminated with hydrogen and
Downloaded 26 Sep 2013 to 130.238.171.100. This article is copyrighted as indicated in the abstract. Reuse of AIP content is subject to the terms at: http://jcp.aip.org/about/rights_and_permissions

234701-4 Bidermane et al. J. Chem. Phys. 138, 234701 (2013)
Inte
nsity
(ar
b. u
nits
)
102 101 100 99
Binding energy (eV)
Si(100):H+LuPc2
Si(100):H
Si(100)
hν=160 eVSi 2p
FIG. 2. Silicon 2p XPS spectra recorded for a photon energy of 160 eV: cleansilicon (100)-2 × 1 vicinal surface (red line); hydrogenated silicon (100)-2× 1 vicinal surface (orange dashed line); 0.2 nm of LuPc2 on hydrogenatedsilicon (100)-2 × 1 vicinal surface (green line on top).
therefore no surface states are visible in the spectrum (or-ange dashed line Fig. 2). The general spectral shape is alsomodified and is similar to the one already published.39 More-over, the spectrum presents an energy shift of 0.3 eV to higherbinding energy, commonly attributed to a band bending dueto the charge transfer between adsorbed hydrogen atoms andsilicon.38 The small feature at around 101.4 eV is characteris-tic of a Si2+ oxidation state40 and is attributed to a slight watercontamination during the hydrogenation process. The greenline corresponds to 0.2 nm of LuPc2 deposited on the hydro-genated surface. The overall shape of the spectrum is identi-cal to the hydrogenated one and no additional features, whichcould be an indication of a bonding between the moleculesand the silicon, are visible. This supports the fact that thepassivated Si surface does not interact significantly with theLuPc2 molecules.
Figure 3 displays the C 1s spectra recorded for a thinfilm of 1 nm (a) and for a thick film deposition (b) on the H-terminated Si surface. The binding energy of the main struc-ture is found at the same position as in previously publishedXPS on LuPc2 thick film on silver41 and no energy shift isobserved for the different thicknesses, indicating equivalentinteraction for the thin and thick layers, a consequence of theSi surface passivation.
The C 1s XPS spectra provide further evidence of thenegligible interaction between the adsorbed molecules and thesilicon atoms. The spectra can be decomposed using Voigtfunctions into a series of six peaks. The three larger peaksat lower binding energies corresponding to inequivalent car-bons (illustrated in the sketch of Figure 3) are found, respec-tively, at 284.29 eV for the C-H contribution, 284.66 eV for
Binding energy (eV)
Inte
nsit
y (a
rb. u
nits
)
hv=330 eVC 1s
FIG. 3. C 1s XPS spectra recorded for photon energy of 330 eV on LuPc2deposited on hydrogenated silicon (100)-2 × 1 vicinal surface: (a) 1 nm;(b) bulk LuPc2; decomposition with Gaussian function is displayed for eachspectra.
the C1 contribution, and 285.48 eV for the C2 contribution.The three smaller additional features at higher binding ener-gies correspond to the shake-up transitions associated with thethree main transitions C-H, C1, and C2. Shake-up satellitesare identified at higher binding energies (i.e., lower kineticenergy) due to a kinetic-energy loss of photoelectrons via si-multaneously excited π − π� transitions. Fitting parametersare found in Table II.
The intensity ratio is found to be 1.9 : 1.9 : 4 (C1+shake-up : C2+shake-up : CH+shake-up) for the 1 nm layer and2.1 : 1.76 : 4 (C1+shake-up : C2+shake-up : CH+shake-up)for the bulk layer. The C2 intensity ratio is smaller than 2 dueto a slight beam damage of the layer. The overall ratios are invery good agreement with the numerical ratio of distinct typesof carbon atoms identified within the molecular ligand 2 : 2 :4 (C1+shake up : C2+shake up : CH+shake-up).
TABLE II. Fitting parameters for 1 nm thick and bulk films, FWHM corre-sponds to the full width at half maximum of the Voigt curve.
Position (eV) FWHM (eV) Height (Arb. Un.)
Peak label 1 nm bulk 1 nm bulk 1 nm bulk
C-H 284.29 284.29 0.62 0.62 0.82 0.82C-1 284.66 284.66 0.72 0.71 0.32 0.35C-2 285.48 285.48 0.71 0.71 0.34 0.31a
Shake-up C-H 286.08 286.08 0.76 0.76 0.06 0.04Shake-up C-1 286.78 286.78 0.76 0.76 0.04 0.04Shake-up C-2 287.28 287.28 0.76 0.76 0.04 0.03
aBeam damaged sample.
Downloaded 26 Sep 2013 to 130.238.171.100. This article is copyrighted as indicated in the abstract. Reuse of AIP content is subject to the terms at: http://jcp.aip.org/about/rights_and_permissions
234701-5 Bidermane et al. J. Chem. Phys. 138, 234701 (2013)
The fitting procedure reveals also the energy differencebetween the main feature and its associated shake-up. Foreach feature, both in the 1 nm thick film or in the bulk-like overlayer, the shake-up is found to be at 1.9 ± 0.2 eVhigher binding energy than the corresponding main feature.This shake-up gives information on the molecular bandgapand agrees with already published results.42, 43
Considering the results obtained on Si 2p and C 1s spec-tra, we can conclude that, as expected, there is no signifi-cant interaction between the molecules and Si atoms. Neitherthe N 1s spectrum (not presented here44) shows any differ-ences between the line shape or energy positions between thethin and thick layers of LuPc2. In general, both C 1s and N1s spectra have similar line shapes to simple, single deckerphthalocyanines,13–15, 41 indicating that the double molecularplanes do not influence significantly the photoemission corelines. However, more insights into the electronic structureof this double decker Pc come from the absorption spectraand from the DFT simulations presented in Subsections IV Band IV C.
B. Experimental NEXAFS spectra
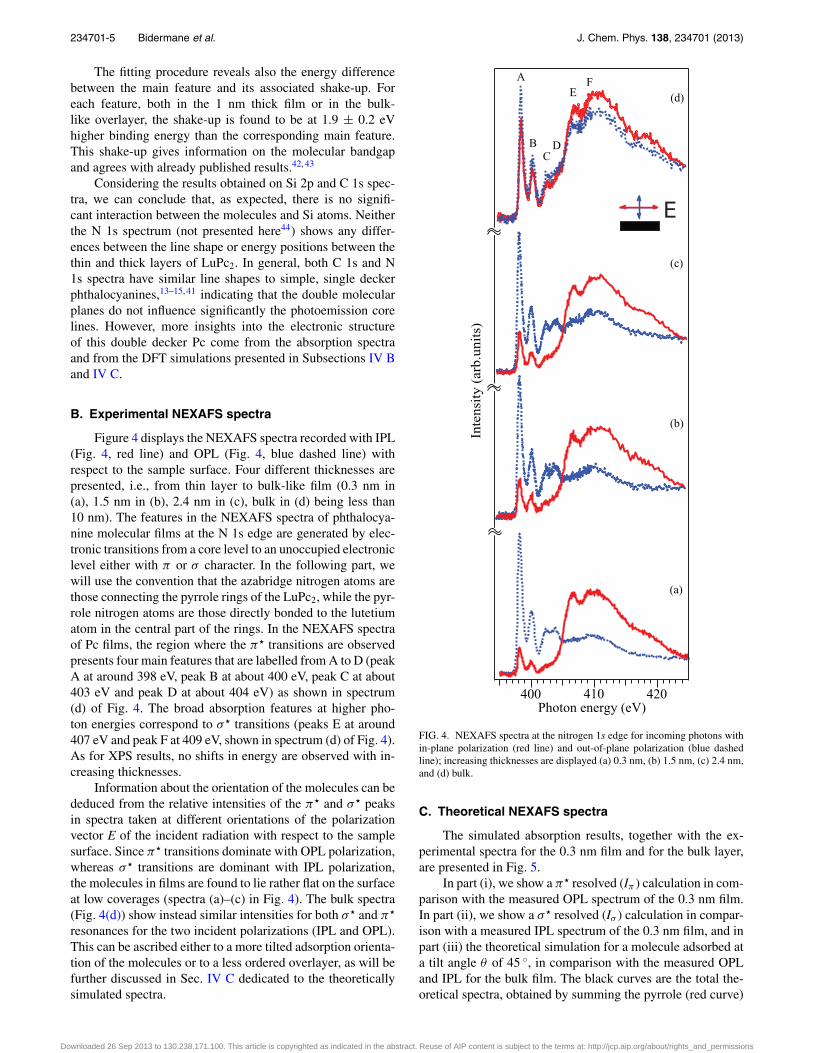
Figure 4 displays the NEXAFS spectra recorded with IPL(Fig. 4, red line) and OPL (Fig. 4, blue dashed line) withrespect to the sample surface. Four different thicknesses arepresented, i.e., from thin layer to bulk-like film (0.3 nm in(a), 1.5 nm in (b), 2.4 nm in (c), bulk in (d) being less than10 nm). The features in the NEXAFS spectra of phthalocya-nine molecular films at the N 1s edge are generated by elec-tronic transitions from a core level to an unoccupied electroniclevel either with π or σ character. In the following part, wewill use the convention that the azabridge nitrogen atoms arethose connecting the pyrrole rings of the LuPc2, while the pyr-role nitrogen atoms are those directly bonded to the lutetiumatom in the central part of the rings. In the NEXAFS spectraof Pc films, the region where the π� transitions are observedpresents four main features that are labelled from A to D (peakA at around 398 eV, peak B at about 400 eV, peak C at about403 eV and peak D at about 404 eV) as shown in spectrum(d) of Fig. 4. The broad absorption features at higher pho-ton energies correspond to σ � transitions (peaks E at around407 eV and peak F at 409 eV, shown in spectrum (d) of Fig. 4).As for XPS results, no shifts in energy are observed with in-creasing thicknesses.
Information about the orientation of the molecules can bededuced from the relative intensities of the π� and σ � peaksin spectra taken at different orientations of the polarizationvector E of the incident radiation with respect to the samplesurface. Since π� transitions dominate with OPL polarization,whereas σ � transitions are dominant with IPL polarization,the molecules in films are found to lie rather flat on the surfaceat low coverages (spectra (a)–(c) in Fig. 4). The bulk spectra(Fig. 4(d)) show instead similar intensities for both σ � and π�
resonances for the two incident polarizations (IPL and OPL).This can be ascribed either to a more tilted adsorption orienta-tion of the molecules or to a less ordered overlayer, as will befurther discussed in Sec. IV C dedicated to the theoreticallysimulated spectra.
Inte
nsit
y (a
rb.u
nits
)
400 410 420Photon energy (eV)
(c)
(b)
(d)
(a)
A
BC
D
EF
FIG. 4. NEXAFS spectra at the nitrogen 1s edge for incoming photons within-plane polarization (red line) and out-of-plane polarization (blue dashedline); increasing thicknesses are displayed (a) 0.3 nm, (b) 1.5 nm, (c) 2.4 nm,and (d) bulk.
C. Theoretical NEXAFS spectra
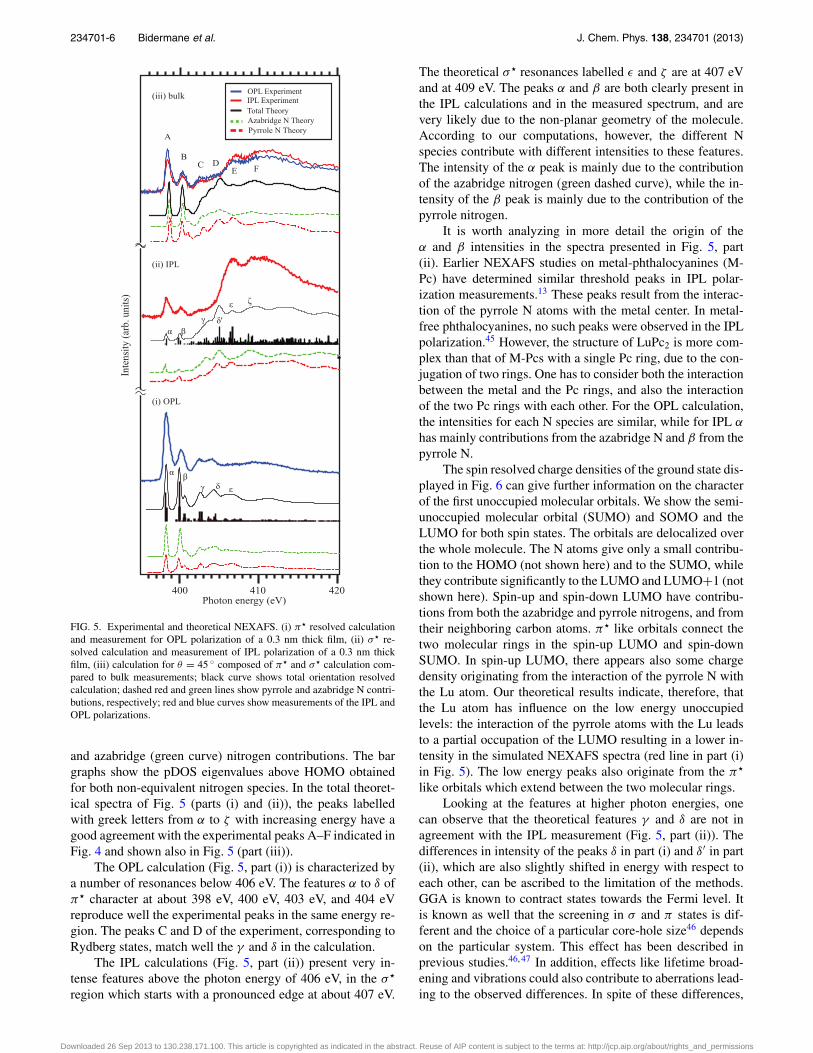
The simulated absorption results, together with the ex-perimental spectra for the 0.3 nm film and for the bulk layer,are presented in Fig. 5.
In part (i), we show a π� resolved (Iπ ) calculation in com-parison with the measured OPL spectrum of the 0.3 nm film.In part (ii), we show a σ � resolved (Iσ ) calculation in compar-ison with a measured IPL spectrum of the 0.3 nm film, and inpart (iii) the theoretical simulation for a molecule adsorbed ata tilt angle θ of 45 ◦, in comparison with the measured OPLand IPL for the bulk film. The black curves are the total the-oretical spectra, obtained by summing the pyrrole (red curve)
Downloaded 26 Sep 2013 to 130.238.171.100. This article is copyrighted as indicated in the abstract. Reuse of AIP content is subject to the terms at: http://jcp.aip.org/about/rights_and_permissions
234701-6 Bidermane et al. J. Chem. Phys. 138, 234701 (2013)
FIG. 5. Experimental and theoretical NEXAFS. (i) π� resolved calculationand measurement for OPL polarization of a 0.3 nm thick film, (ii) σ� re-solved calculation and measurement of IPL polarization of a 0.3 nm thickfilm, (iii) calculation for θ = 45 ◦ composed of π� and σ� calculation com-pared to bulk measurements; black curve shows total orientation resolvedcalculation; dashed red and green lines show pyrrole and azabridge N contri-butions, respectively; red and blue curves show measurements of the IPL andOPL polarizations.
and azabridge (green curve) nitrogen contributions. The bargraphs show the pDOS eigenvalues above HOMO obtainedfor both non-equivalent nitrogen species. In the total theoret-ical spectra of Fig. 5 (parts (i) and (ii)), the peaks labelledwith greek letters from α to ζ with increasing energy have agood agreement with the experimental peaks A–F indicated inFig. 4 and shown also in Fig. 5 (part (iii)).
The OPL calculation (Fig. 5, part (i)) is characterized bya number of resonances below 406 eV. The features α to δ ofπ� character at about 398 eV, 400 eV, 403 eV, and 404 eVreproduce well the experimental peaks in the same energy re-gion. The peaks C and D of the experiment, corresponding toRydberg states, match well the γ and δ in the calculation.
The IPL calculations (Fig. 5, part (ii)) present very in-tense features above the photon energy of 406 eV, in the σ �
region which starts with a pronounced edge at about 407 eV.
The theoretical σ � resonances labelled ε and ζ are at 407 eVand at 409 eV. The peaks α and β are both clearly present inthe IPL calculations and in the measured spectrum, and arevery likely due to the non-planar geometry of the molecule.According to our computations, however, the different Nspecies contribute with different intensities to these features.The intensity of the α peak is mainly due to the contributionof the azabridge nitrogen (green dashed curve), while the in-tensity of the β peak is mainly due to the contribution of thepyrrole nitrogen.
It is worth analyzing in more detail the origin of theα and β intensities in the spectra presented in Fig. 5, part(ii). Earlier NEXAFS studies on metal-phthalocyanines (M-Pc) have determined similar threshold peaks in IPL polar-ization measurements.13 These peaks result from the interac-tion of the pyrrole N atoms with the metal center. In metal-free phthalocyanines, no such peaks were observed in the IPLpolarization.45 However, the structure of LuPc2 is more com-plex than that of M-Pcs with a single Pc ring, due to the con-jugation of two rings. One has to consider both the interactionbetween the metal and the Pc rings, and also the interactionof the two Pc rings with each other. For the OPL calculation,the intensities for each N species are similar, while for IPL α
has mainly contributions from the azabridge N and β from thepyrrole N.
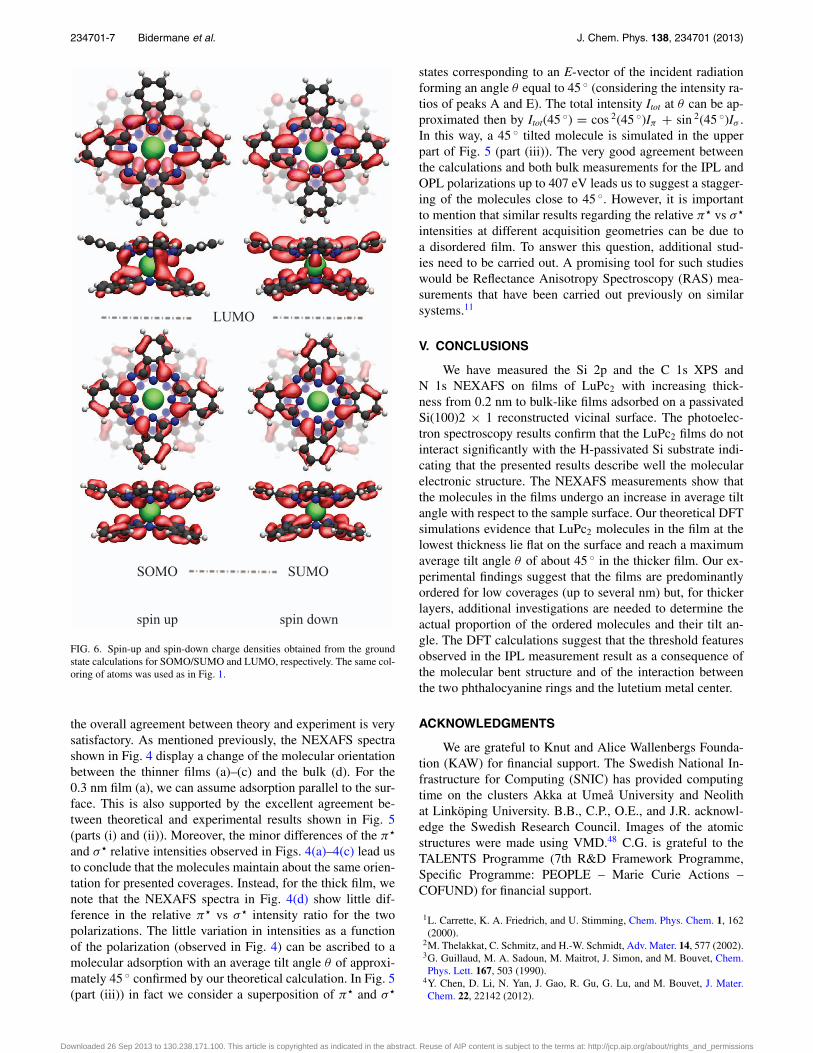
The spin resolved charge densities of the ground state dis-played in Fig. 6 can give further information on the characterof the first unoccupied molecular orbitals. We show the semi-unoccupied molecular orbital (SUMO) and SOMO and theLUMO for both spin states. The orbitals are delocalized overthe whole molecule. The N atoms give only a small contribu-tion to the HOMO (not shown here) and to the SUMO, whilethey contribute significantly to the LUMO and LUMO+1 (notshown here). Spin-up and spin-down LUMO have contribu-tions from both the azabridge and pyrrole nitrogens, and fromtheir neighboring carbon atoms. π� like orbitals connect thetwo molecular rings in the spin-up LUMO and spin-downSUMO. In spin-up LUMO, there appears also some chargedensity originating from the interaction of the pyrrole N withthe Lu atom. Our theoretical results indicate, therefore, thatthe Lu atom has influence on the low energy unoccupiedlevels: the interaction of the pyrrole atoms with the Lu leadsto a partial occupation of the LUMO resulting in a lower in-tensity in the simulated NEXAFS spectra (red line in part (i)in Fig. 5). The low energy peaks also originate from the π�
like orbitals which extend between the two molecular rings.Looking at the features at higher photon energies, one
can observe that the theoretical features γ and δ are not inagreement with the IPL measurement (Fig. 5, part (ii)). Thedifferences in intensity of the peaks δ in part (i) and δ′ in part(ii), which are also slightly shifted in energy with respect toeach other, can be ascribed to the limitation of the methods.GGA is known to contract states towards the Fermi level. Itis known as well that the screening in σ and π states is dif-ferent and the choice of a particular core-hole size46 dependson the particular system. This effect has been described inprevious studies.46, 47 In addition, effects like lifetime broad-ening and vibrations could also contribute to aberrations lead-ing to the observed differences. In spite of these differences,
Downloaded 26 Sep 2013 to 130.238.171.100. This article is copyrighted as indicated in the abstract. Reuse of AIP content is subject to the terms at: http://jcp.aip.org/about/rights_and_permissions
234701-7 Bidermane et al. J. Chem. Phys. 138, 234701 (2013)
FIG. 6. Spin-up and spin-down charge densities obtained from the groundstate calculations for SOMO/SUMO and LUMO, respectively. The same col-oring of atoms was used as in Fig. 1.
the overall agreement between theory and experiment is verysatisfactory. As mentioned previously, the NEXAFS spectrashown in Fig. 4 display a change of the molecular orientationbetween the thinner films (a)–(c) and the bulk (d). For the0.3 nm film (a), we can assume adsorption parallel to the sur-face. This is also supported by the excellent agreement be-tween theoretical and experimental results shown in Fig. 5(parts (i) and (ii)). Moreover, the minor differences of the π�
and σ � relative intensities observed in Figs. 4(a)–4(c) lead usto conclude that the molecules maintain about the same orien-tation for presented coverages. Instead, for the thick film, wenote that the NEXAFS spectra in Fig. 4(d) show little dif-ference in the relative π� vs σ � intensity ratio for the twopolarizations. The little variation in intensities as a functionof the polarization (observed in Fig. 4) can be ascribed to amolecular adsorption with an average tilt angle θ of approxi-mately 45 ◦ confirmed by our theoretical calculation. In Fig. 5(part (iii)) in fact we consider a superposition of π� and σ �
states corresponding to an E-vector of the incident radiationforming an angle θ equal to 45 ◦ (considering the intensity ra-tios of peaks A and E). The total intensity Itot at θ can be ap-proximated then by Itot(45 ◦) = cos 2(45 ◦)Iπ + sin 2(45 ◦)Iσ .In this way, a 45 ◦ tilted molecule is simulated in the upperpart of Fig. 5 (part (iii)). The very good agreement betweenthe calculations and both bulk measurements for the IPL andOPL polarizations up to 407 eV leads us to suggest a stagger-ing of the molecules close to 45 ◦. However, it is importantto mention that similar results regarding the relative π� vs σ �
intensities at different acquisition geometries can be due toa disordered film. To answer this question, additional stud-ies need to be carried out. A promising tool for such studieswould be Reflectance Anisotropy Spectroscopy (RAS) mea-surements that have been carried out previously on similarsystems.11
V. CONCLUSIONS
We have measured the Si 2p and the C 1s XPS andN 1s NEXAFS on films of LuPc2 with increasing thick-ness from 0.2 nm to bulk-like films adsorbed on a passivatedSi(100)2 × 1 reconstructed vicinal surface. The photoelec-tron spectroscopy results confirm that the LuPc2 films do notinteract significantly with the H-passivated Si substrate indi-cating that the presented results describe well the molecularelectronic structure. The NEXAFS measurements show thatthe molecules in the films undergo an increase in average tiltangle with respect to the sample surface. Our theoretical DFTsimulations evidence that LuPc2 molecules in the film at thelowest thickness lie flat on the surface and reach a maximumaverage tilt angle θ of about 45 ◦ in the thicker film. Our ex-perimental findings suggest that the films are predominantlyordered for low coverages (up to several nm) but, for thickerlayers, additional investigations are needed to determine theactual proportion of the ordered molecules and their tilt an-gle. The DFT calculations suggest that the threshold featuresobserved in the IPL measurement result as a consequence ofthe molecular bent structure and of the interaction betweenthe two phthalocyanine rings and the lutetium metal center.
ACKNOWLEDGMENTS
We are grateful to Knut and Alice Wallenbergs Founda-tion (KAW) for financial support. The Swedish National In-frastructure for Computing (SNIC) has provided computingtime on the clusters Akka at Umeå University and Neolithat Linköping University. B.B., C.P., O.E., and J.R. acknowl-edge the Swedish Research Council. Images of the atomicstructures were made using VMD.48 C.G. is grateful to theTALENTS Programme (7th R&D Framework Programme,Specific Programme: PEOPLE – Marie Curie Actions –COFUND) for financial support.
1L. Carrette, K. A. Friedrich, and U. Stimming, Chem. Phys. Chem. 1, 162(2000).
2M. Thelakkat, C. Schmitz, and H.-W. Schmidt, Adv. Mater. 14, 577 (2002).3G. Guillaud, M. A. Sadoun, M. Maitrot, J. Simon, and M. Bouvet, Chem.Phys. Lett. 167, 503 (1990).
4Y. Chen, D. Li, N. Yan, J. Gao, R. Gu, G. Lu, and M. Bouvet, J. Mater.Chem. 22, 22142 (2012).
Downloaded 26 Sep 2013 to 130.238.171.100. This article is copyrighted as indicated in the abstract. Reuse of AIP content is subject to the terms at: http://jcp.aip.org/about/rights_and_permissions

234701-8 Bidermane et al. J. Chem. Phys. 138, 234701 (2013)
5V. Parra, M. Bouvet, J. Brunet, M. L. Rodríguez-Méndez, and J. A. de Saja,Thin Solid Films 516, 9012 (2008).
6J. Brunet, V. P. Garcia, A. Pauly, C. Varenne, and B. Lauron, Sens. Actua-tors B 134, 632 (2008).
7J. D. Baran, J. A. Larsson, R. A. J. Woolley, Y. Cong, P. J. Moriarty, A. A.Cafolla, K. Schulte, and V. R. Dhanak, Phys. Rev. B 81, 075413 (2010).
8K. Nilson, J. Åhlund, M.-N. Shariati, E. Göthelid, P. Palmgren, J.Schiessling, S. Berner, N. Mårtensson, and C. Puglia, J. Phys. Chem. C114, 12166 (2010).
9E. Salomon, N. Papageorgiou, T. Angot, A. Verdini, A. Cossaro, L. Flo-reano, A. Morgante, L. Giovanelli, and G. Le Lay, J. Phys. Chem. C 111,12467 (2007).
10R. P. Berkelaar, H. Sode, T. F. Mocking, A. Kumar, B. Poelsema, andH. J. W. Zandvliet, J. Phys. Chem. C 115, 2268 (2011).
11S. Boudet, I. Bidermane, E. Lacaze, B. Gallas, M. Bouvet, J. Brunet,A. Pauly, Y. Borensztein, and N. Witkowski, Phys. Rev. B 86, 115413(2012).
12F. Seidel, M. Fronk, C. Himcinschi, V. Chis, and D. R. T. Zahn, Phys. StatusSolidi C 7, 222 (2010).
13J. Ahlund, K. Nilson, J. Schiessling, L. Kjeldgaard, S. Berner, N. Martens-son, C. Puglia, B. Brena, M. Nyberg, and Y. Luo, J. Chem. Phys. 125,034709 (2006).
14L. Wang, D. Qi, L. Liu, S. Chen, X. Gao, and A. T. S. Wee, J. Phys. Chem.C 111, 3454 (2007).
15B. N. Holland, G. Gavrila, D. R. T. Zahn, A. A. Cafolla, C. McGuinness,and I. T. McGovern, Phys. Status Solidi C 7, 218 (2010).
16J. Gardener, J. Owen, K. Miki, and S. Heutz, Surf. Sci. 602, 843 (2008).17Y. Borensztein and N. Witkowski, J. Phys. Condens. Matter 16, S4301
(2004).18N. Witkowski, R. Coustel, O. Pluchery, and Y. Borensztein, Surf. Sci. 600,
5142 (2006).19J. Boland, Surf. Sci. 261, 17 (1992).20M. Bouvet and J. Simon, Chem. Phys. Lett. 172, 299 (1990).21S. Hufner, Photoelectron Spectroscopy: Principles and Applications, 2nd
ed. (Springer-Verlag, 1996), pp. 12–13.22F. Polack, M. Silly, C. Chauvet, B. Lagarde, N. Bergeard, M. Izquierdo,
O. Chubar, D. Krizmancic, M. Ribbens, J. P. Duval, C. Basset, S. Kubsky,and F. Sirotti, AIP Conf. Proc. 1234, 185 (2010).
23D. A. Shirley, Phys. Rev. B 5, 4709 (1972).24C. Mathieu, X. Bai, J. J. Gallet, F. Bournel, S. Carniato, F. Rochet, E.
Magnano, F. Bondino, R. Funke, U. Kohler, and S. Kubsky, J. Phys. Chem.C 113, 11336 (2009).
25R. Denecke, P. Väterlein, M. Bässler, N. Wassdahl, S. Butorin, A. Nilsson,J. E. Rubensson, J. Nordgren, N. Mårtensson, and R. Nyholm, J. ElectronSpectrosc. Relat. Phenom. 101, 971 (1999).
26J. Stöhr, NEXAFS Spectroscopy, Springer Series in Surface Sciences Vol.25 (Springer, 2003), pp. 154–161.
27M. J. Frisch, G. W. Trucks, H. B. Schlegel et al., GAUSSIAN 09,Revision A.1, Gaussian, Inc., Wallingford, CT, 2009; found online athttp://www.gaussian.com/g_tech/g_ur/m_citation.htm.
28A. D. Becke, J. Chem. Phys. 98, 1372 (1993).29J. Yang and M. Dolg, Theor. Chem. Acc. 113, 212 (2005).30A. De Cian, M. Moussavi, J. Fisher, and R. Weiss, Inorg. Chem. 24, 3162
(1985).31R. Murdey, M. Bouvet, M. Sumimoto, S. Sakaki, and N. Sato, Synth. Met.
159, 1677 (2009).32T. Yanai, D. P. Tew, and N. C. Handy, Chem. Phys. Lett. 393, 51 (2004).33J. C. Slater, Adv. Quantum Chem. 6, 1 (1972).34J. C. Slater and K. H. Johnsson, Phys. Rev. B 5, 844 (1972).35L. Triguero, Y. Luo, L. G. M. Pettersson, H. Agren, P. Väterlein, M.
Weinelt, A. Föhlisch, J. Hasselström, O. Karis, and A. Nilsson, Phys. Rev.B 59, 5189 (1999).
36P. Blaha, K. Schwarz, G. K. H. Madsen, D. Kvasnicka, and J. Luitz,WIEN2k, an augmented plane wave + local orbitals program for calcu-lating crystal properties, Techn. Universität Wien, Austria, 2001.
37J. P. Perdew, M. Ernzerhof, and K. Burke, J. Chem. Phys. 105, 9982 (1996).38C. Mathieu, X. Bai, F. Bournel, J.-J. Gallet, S. Carniato, F. Rochet, F.
Sirotti, M. G. Silly, C. Chauvet, D. Krizmancic, and F. Hennies, Phys. Rev.B 79, 205317 (2009).
39R. Uhrberg, E. Landemark, and Y.-C. Chao, J. Electron. Spectrosc. Relat.Phenom. 75, 197 (1995).
40H. W. Yeom, H. Hamamatsu, T. Ohta, and R. I. G. Uhrberg, Phys. Rev. B59, R10413 (1999).
41M. Toader, M. Knupfer, D. R. T. Zahn, and M. Hietschold, J. Am. Chem.Soc. 133, 5538 (2011).
42L. Smykalla, P. Shukrynau, and M. Hietschold, J. Phys. Chem. C 116, 8008(2012).
43B. Brena, Y. Luo, M. Nyberg, S. Carniato, K. Nilson, Y. Alfredsson, J.Ahlund, N. Martensson, H. Siegbahn, and C. Puglia, Phys. Rev. B 70,195214 (2004).
44See supplementary material at http://dx.doi.org/10.1063/1.4809725 forcomparison of nitrogen 1s spectra.
45Y. Alfredsson, B. Brena, K. Nilson, J. Åhlund, and L. Kjeldgaard, J. Chem.Phys. 122, 214723 (2005).
46R. Laskowski, T. Gallauner, P. Blaha, and K. Schwarz, J. Phys.: Condens.Matter 21, 104210 (2009).
47M. Nyberg, Y. Luo, L. Triguero, L. G. M. Pettersson, and H. Agren, Phys.Rev. B 60, 7956 (1999).
48W. Humphrey, A. Dalke, and K. Schulten, J. Mol. Graphics Modell. 14, 33(1996).
Downloaded 26 Sep 2013 to 130.238.171.100. This article is copyrighted as indicated in the abstract. Reuse of AIP content is subject to the terms at: http://jcp.aip.org/about/rights_and_permissions