Embed Size (px)
Citation preview
661
i) Professor, Imperial College London, Department of Civil and Environmental Engineering, South Kensington Campus, London, UK(r.jardine@imperial.ac.uk).
ii) Lecturer, Department of Geotechnical Engineering, Tongji University, Shanghai, China (btangzh@tongji.edu.cn) (formerly PostdoctoralResearcher, Imperial College London, UK).
iii) Professor, Laboratoire Sols, Solides, Structures-Risques, Domaine Universitaire Grenoble, France (Pierre.Foray@hmg.inpg.fr).iv) Director, Cambridge Insitu, Little Eversden, Cambridge, UK (CamInsitu@aol.com).
The manuscript for this paper was received for review on September 1, 2008; approved on July 27, 2009.Written discussions on this paper should be submitted before May 1, 2010 to the Japanese Geotechnical Society, 4-38-2, Sengoku, Bunkyo-ku,Tokyo 112-0011, Japan. Upon request the closing date may be extended one month.
661
SOILS AND FOUNDATIONS Vol. 49, No. 5, 661–673, Oct. 2009Japanese Geotechnical Society
EXPERIMENTAL ARRANGEMENTS FOR INVESTIGATION OFSOIL STRESSES DEVELOPED AROUND A DISPLACEMENT PILE
RICHARD J. JARDINEi), BITANG ZHUii), PIERRE FORAYiii) and CLIVE P. DALTONiv)
ABSTRACT
Experimental arrangements are described that lead to reliable stress measurements in calibration chamber tests involv-ing steel displacement piles in dense sand. The research required: developments with the chamber and pile testing eq-uipment; novel approaches to the calibration and modelling of soil in-situ stress sensors; special arrangements for thesensors' deployment; and development, calibration and operation of a miniature instrumented ICP pile. Preliminaryresults are reported from pilot tests to demonstrate the capabilities of the resulting measurement systems.
Key words: axial load cell, calibration chamber, displacement pile, mini Imperial College pile, sand, soil stress sensor,surface stress transducer (IGC: E14)
INTRODUCTION
A group from Imperial College London and INPGGrenoble are investigating displacement pile behaviour insand, focusing on the evolution of the stresses on the pile,and within the soil mass. Stress conditions are studiedduring and after pile installation, as well as during staticand cyclic loading tests. This Paper describes the in-strumentation, calibrations and general arrangementsmade to make such measurements under highly challeng-ing conditions. Particular attention had to be given to themeasurement of in-situ soil stresses with small indepen-dent sensors, and Zhu et al. (2009) provide further detailson this topic in a companion paper.
Chow (1997) investigated the stresses developed on theshafts of displacement piles in sand at Dunkerque,France, in short term tests involving a highly instrument-ed `ICP' model pile. Long term tests with full scale drivenpiles (Chow et al., 1998; Jardine et al., 2006) demonstrat-ed both marked increases in capacity with time and inter-relationships between the piles' installation, in-situageing and cyclic loading characteristics. While conjec-tures have been made regarding these processes (Chow etal., 1998; Jardine et al., 2006; Axelsson, 2000; White andBolton, 2004, etc.), a sounder understanding of the soilstress states is required to identify the physical processesinvolved and establish their practical signiˆcance. The ac-quisition of a comprehensive and reliable dataset is vitalto advancing this potentially important topic.
Installation disturbance makes in-situ sand stresses
very di‹cult to measure in the ˆeld. However, withlaboratory calibration chamber tests earth pressure sen-sors may be pre-placed in the surrounding sand mass atsuitable locations prior to their burial (by controlledpluviation) and surcharge application. It is also possibleto have close and continuous environmental regulation.Potential drawbacks include the inevitable eŠects of cellboundary conditions, the restriction of being able to useonly freshly pluviated test sands and the costs anddi‹culties of running long-duration, uninterruptable,tests. Nauroy and Le Tirant (1983) employed calibrationchambers to observe sand stresses at distances of 2.5 and1.7 pile diameters from the centre line of small displace-ment piles, while Foray et al. (1993) made measurementsat 3 to 3.5 pile diameters with similar models to capturequalitative vertical, radial and circumferential sand stresstrends. However, displacement pile installation involvesextreme conditions and measurement di‹culties arise dueto stress sensor non-linearity, cell action and hysteresis.Dijkstra et al. (2006) reported interesting photo-elasticexperiments, but had to accept a low ratio (¿5) betweenthe pile diameter and particle size as well using an artiˆ-cial glass `sand'. Analytical and numerical approaches(e.g., Liyanapathirana et al., 2000; Sheng et al., 2005;White et al., 2005; Henke and Grabe, 2006) have also hadto accept considerable simpliˆcations to obtain solutions.Pile driving involves very large strains, boundary contactchanges, signiˆcant particle breakage, constrained dila-tion and interface shear, as well as irregular load cyclingimposed under complex (general) stress conditions.
662
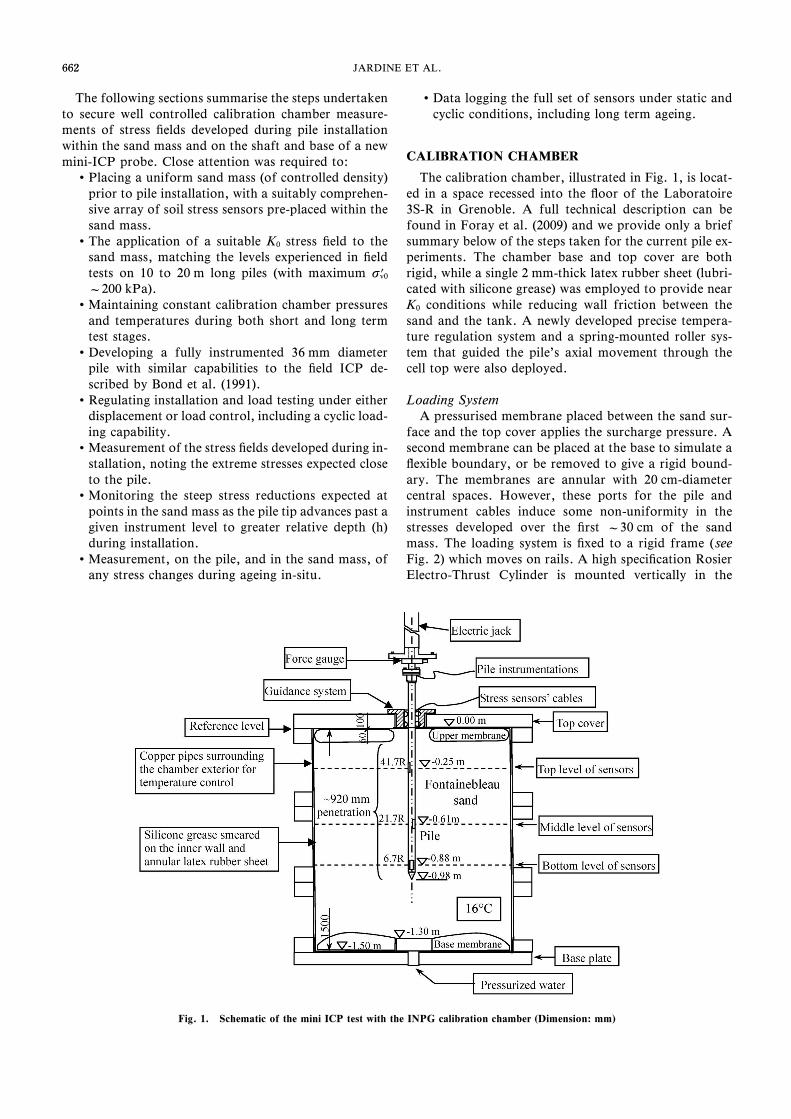
Fig. 1. Schematic of the mini ICP test with the INPG calibration chamber (Dimension: mm)
662 JARDINE ET AL.
The following sections summarise the steps undertakento secure well controlled calibration chamber measure-ments of stress ˆelds developed during pile installationwithin the sand mass and on the shaft and base of a newmini-ICP probe. Close attention was required to:
Placing a uniform sand mass (of controlled density)prior to pile installation, with a suitably comprehen-sive array of soil stress sensors pre-placed within thesand mass.
The application of a suitable K0 stress ˆeld to thesand mass, matching the levels experienced in ˆeldtests on 10 to 20 m long piles (with maximum s?v0
¿200 kPa).Maintaining constant calibration chamber pressures
and temperatures during both short and long termtest stages.
Developing a fully instrumented 36 mm diameterpile with similar capabilities to the ˆeld ICP de-scribed by Bond et al. (1991).
Regulating installation and load testing under eitherdisplacement or load control, including a cyclic load-ing capability.
Measurement of the stress ˆelds developed during in-stallation, noting the extreme stresses expected closeto the pile.
Monitoring the steep stress reductions expected atpoints in the sand mass as the pile tip advances past agiven instrument level to greater relative depth (h)during installation.
Measurement, on the pile, and in the sand mass, ofany stress changes during ageing in-situ.
Data logging the full set of sensors under static andcyclic conditions, including long term ageing.
CALIBRATION CHAMBER
The calibration chamber, illustrated in Fig. 1, is locat-ed in a space recessed into the ‰oor of the Laboratoire3S-R in Grenoble. A full technical description can befound in Foray et al. (2009) and we provide only a briefsummary below of the steps taken for the current pile ex-periments. The chamber base and top cover are bothrigid, while a single 2 mm-thick latex rubber sheet (lubri-cated with silicone grease) was employed to provide nearK0 conditions while reducing wall friction between thesand and the tank. A newly developed precise tempera-ture regulation system and a spring-mounted roller sys-tem that guided the pile's axial movement through thecell top were also deployed.
Loading SystemA pressurised membrane placed between the sand sur-
face and the top cover applies the surcharge pressure. Asecond membrane can be placed at the base to simulate a‰exible boundary, or be removed to give a rigid bound-ary. The membranes are annular with 20 cm-diametercentral spaces. However, these ports for the pile andinstrument cables induce some non-uniformity in thestresses developed over the ˆrst ¿30 cm of the sandmass. The loading system is ˆxed to a rigid frame ( seeFig. 2) which moves on rails. A high speciˆcation RosierElectro-Thrust Cylinder is mounted vertically in the
663
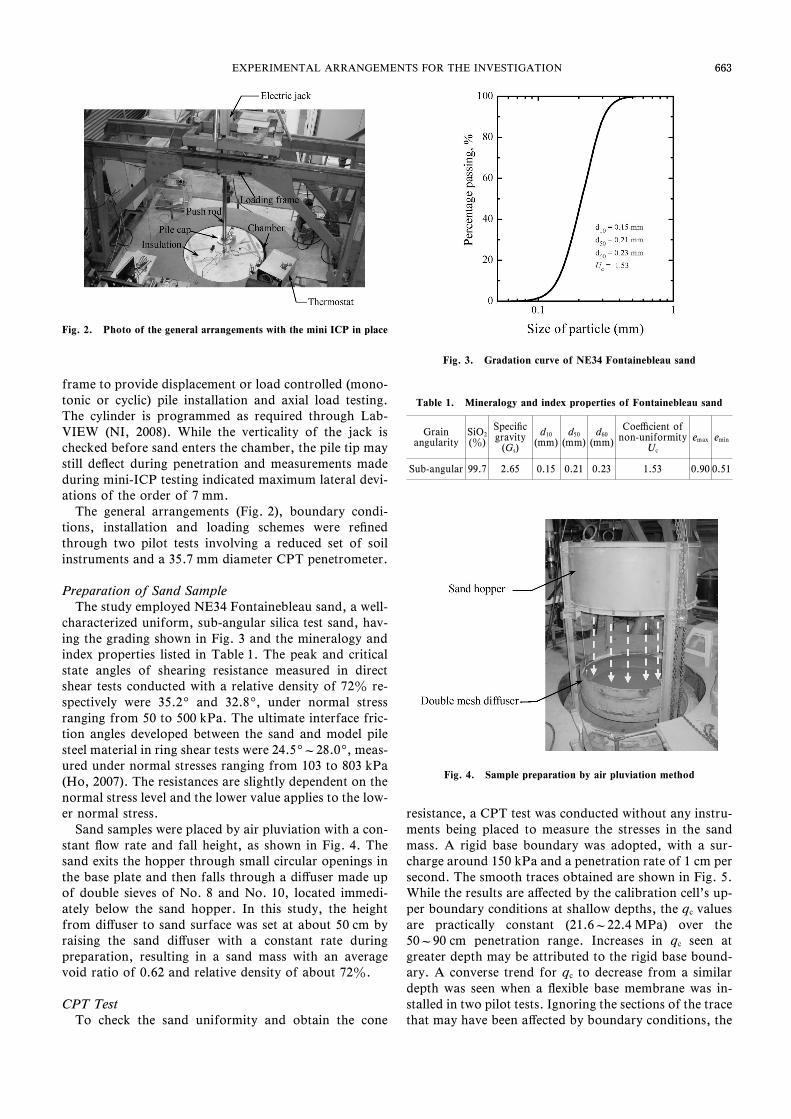
Fig. 2. Photo of the general arrangements with the mini ICP in place
Fig. 3. Gradation curve of NE34 Fontainebleau sand
Table 1. Mineralogy and index properties of Fontainebleau sand
Grainangularity
SiO2
(z)
Speciˆcgravity
(Gs)
d10
(mm)d50
(mm)d60
(mm)
Coe‹cient ofnon-uniformity
Uc
emax emin
Sub-angular 99.7 2.65 0.15 0.21 0.23 1.53 0.90 0.51
Fig. 4. Sample preparation by air pluviation method
663EXPERIMENTAL ARRANGEMENTS FOR THE INVESTIGATION
frame to provide displacement or load controlled (mono-tonic or cyclic) pile installation and axial load testing.The cylinder is programmed as required through Lab-VIEW (NI, 2008). While the verticality of the jack ischecked before sand enters the chamber, the pile tip maystill de‰ect during penetration and measurements madeduring mini-ICP testing indicated maximum lateral devi-ations of the order of 7 mm.
The general arrangements (Fig. 2), boundary condi-tions, installation and loading schemes were reˆnedthrough two pilot tests involving a reduced set of soilinstruments and a 35.7 mm diameter CPT penetrometer.
Preparation of Sand SampleThe study employed NE34 Fontainebleau sand, a well-
characterized uniform, sub-angular silica test sand, hav-ing the grading shown in Fig. 3 and the mineralogy andindex properties listed in Table 1. The peak and criticalstate angles of shearing resistance measured in directshear tests conducted with a relative density of 72z re-spectively were 35.29and 32.89, under normal stressranging from 50 to 500 kPa. The ultimate interface fric-tion angles developed between the sand and model pilesteel material in ring shear tests were 24.59¿28.09, meas-ured under normal stresses ranging from 103 to 803 kPa(Ho, 2007). The resistances are slightly dependent on thenormal stress level and the lower value applies to the low-er normal stress.
Sand samples were placed by air pluviation with a con-stant ‰ow rate and fall height, as shown in Fig. 4. Thesand exits the hopper through small circular openings inthe base plate and then falls through a diŠuser made upof double sieves of No. 8 and No. 10, located immedi-ately below the sand hopper. In this study, the heightfrom diŠuser to sand surface was set at about 50 cm byraising the sand diŠuser with a constant rate duringpreparation, resulting in a sand mass with an averagevoid ratio of 0.62 and relative density of about 72z.
CPT TestTo check the sand uniformity and obtain the cone
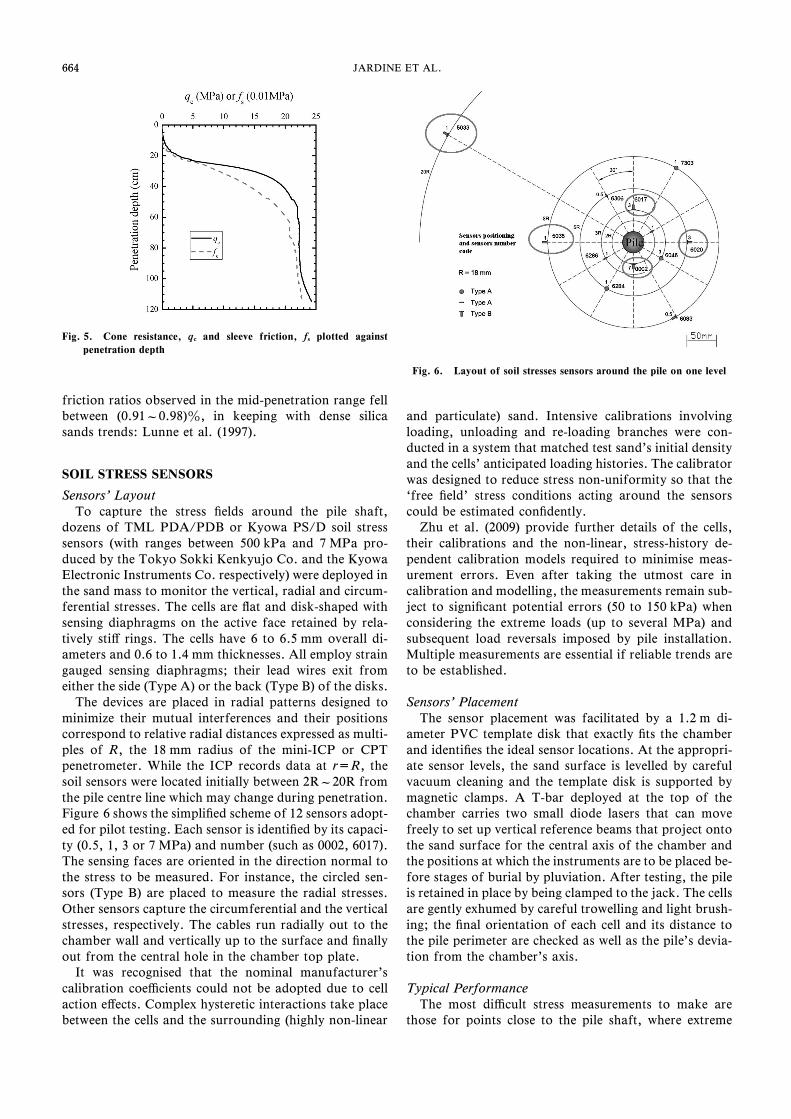
resistance, a CPT test was conducted without any instru-ments being placed to measure the stresses in the sandmass. A rigid base boundary was adopted, with a sur-charge around 150 kPa and a penetration rate of 1 cm persecond. The smooth traces obtained are shown in Fig. 5.While the results are aŠected by the calibration cell's up-per boundary conditions at shallow depths, the qc valuesare practically constant (21.6¿22.4 MPa) over the50¿90 cm penetration range. Increases in qc seen atgreater depth may be attributed to the rigid base bound-ary. A converse trend for qc to decrease from a similardepth was seen when a ‰exible base membrane was in-stalled in two pilot tests. Ignoring the sections of the tracethat may have been aŠected by boundary conditions, the
664
Fig. 5. Cone resistance, qc and sleeve friction, fs plotted againstpenetration depth
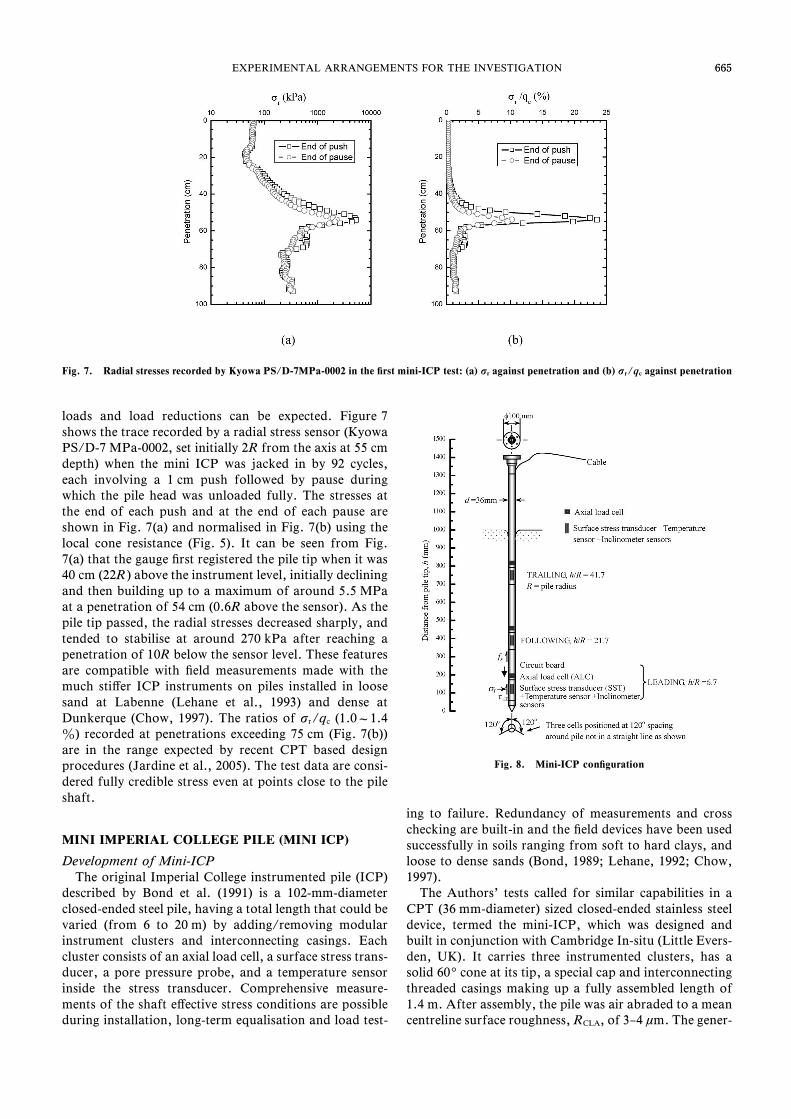
Fig. 6. Layout of soil stresses sensors around the pile on one level
664 JARDINE ET AL.
friction ratios observed in the mid-penetration range fellbetween (0.91¿0.98)z, in keeping with dense silicasands trends: Lunne et al. (1997).
SOIL STRESS SENSORS
Sensors' LayoutTo capture the stress ˆelds around the pile shaft,
dozens of TML PDA/PDB or Kyowa PS/D soil stresssensors (with ranges between 500 kPa and 7 MPa pro-duced by the Tokyo Sokki Kenkyujo Co. and the KyowaElectronic Instruments Co. respectively) were deployed inthe sand mass to monitor the vertical, radial and circum-ferential stresses. The cells are ‰at and disk-shaped withsensing diaphragms on the active face retained by rela-tively stiŠ rings. The cells have 6 to 6.5 mm overall di-ameters and 0.6 to 1.4 mm thicknesses. All employ straingauged sensing diaphragms; their lead wires exit fromeither the side (Type A) or the back (Type B) of the disks.
The devices are placed in radial patterns designed tominimize their mutual interferences and their positionscorrespond to relative radial distances expressed as multi-ples of R, the 18 mm radius of the mini-ICP or CPTpenetrometer. While the ICP records data at r=R, thesoil sensors were located initially between 2R¿20R fromthe pile centre line which may change during penetration.Figure 6 shows the simpliˆed scheme of 12 sensors adopt-ed for pilot testing. Each sensor is identiˆed by its capaci-ty (0.5, 1, 3 or 7 MPa) and number (such as 0002, 6017).The sensing faces are oriented in the direction normal tothe stress to be measured. For instance, the circled sen-sors (Type B) are placed to measure the radial stresses.Other sensors capture the circumferential and the verticalstresses, respectively. The cables run radially out to thechamber wall and vertically up to the surface and ˆnallyout from the central hole in the chamber top plate.
It was recognised that the nominal manufacturer'scalibration coe‹cients could not be adopted due to cellaction eŠects. Complex hysteretic interactions take placebetween the cells and the surrounding (highly non-linear
and particulate) sand. Intensive calibrations involvingloading, unloading and re-loading branches were con-ducted in a system that matched test sand's initial densityand the cells' anticipated loading histories. The calibratorwas designed to reduce stress non-uniformity so that the`free ˆeld' stress conditions acting around the sensorscould be estimated conˆdently.
Zhu et al. (2009) provide further details of the cells,their calibrations and the non-linear, stress-history de-pendent calibration models required to minimise meas-urement errors. Even after taking the utmost care incalibration and modelling, the measurements remain sub-ject to signiˆcant potential errors (50 to 150 kPa) whenconsidering the extreme loads (up to several MPa) andsubsequent load reversals imposed by pile installation.Multiple measurements are essential if reliable trends areto be established.
Sensors' PlacementThe sensor placement was facilitated by a 1.2 m di-
ameter PVC template disk that exactly ˆts the chamberand identiˆes the ideal sensor locations. At the appropri-ate sensor levels, the sand surface is levelled by carefulvacuum cleaning and the template disk is supported bymagnetic clamps. A T-bar deployed at the top of thechamber carries two small diode lasers that can movefreely to set up vertical reference beams that project ontothe sand surface for the central axis of the chamber andthe positions at which the instruments are to be placed be-fore stages of burial by pluviation. After testing, the pileis retained in place by being clamped to the jack. The cellsare gently exhumed by careful trowelling and light brush-ing; the ˆnal orientation of each cell and its distance tothe pile perimeter are checked as well as the pile's devia-tion from the chamber's axis.
Typical PerformanceThe most di‹cult stress measurements to make are
those for points close to the pile shaft, where extreme
665
Fig. 7. Radial stresses recorded by Kyowa PS/D-7MPa-0002 in the ˆrst mini-ICP test: (a) sr against penetration and (b) sr/qc against penetration
Fig. 8. Mini-ICP conˆguration
665EXPERIMENTAL ARRANGEMENTS FOR THE INVESTIGATION
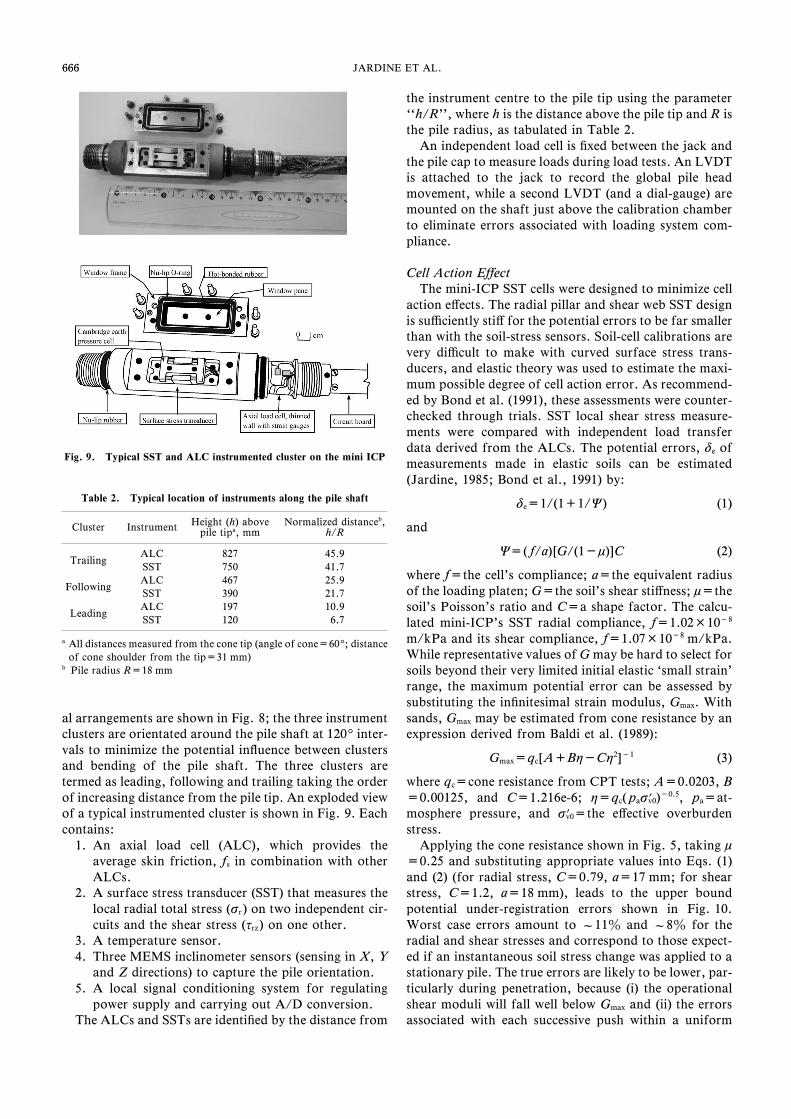
loads and load reductions can be expected. Figure 7shows the trace recorded by a radial stress sensor (KyowaPS/D-7 MPa-0002, set initially 2R from the axis at 55 cmdepth) when the mini ICP was jacked in by 92 cycles,each involving a 1 cm push followed by pause duringwhich the pile head was unloaded fully. The stresses atthe end of each push and at the end of each pause areshown in Fig. 7(a) and normalised in Fig. 7(b) using thelocal cone resistance (Fig. 5). It can be seen from Fig.7(a) that the gauge ˆrst registered the pile tip when it was40 cm (22R) above the instrument level, initially decliningand then building up to a maximum of around 5.5 MPaat a penetration of 54 cm (0.6R above the sensor). As thepile tip passed, the radial stresses decreased sharply, andtended to stabilise at around 270 kPa after reaching apenetration of 10R below the sensor level. These featuresare compatible with ˆeld measurements made with themuch stiŠer ICP instruments on piles installed in loosesand at Labenne (Lehane et al., 1993) and dense atDunkerque (Chow, 1997). The ratios of sr/qc (1.0¿1.4z) recorded at penetrations exceeding 75 cm (Fig. 7(b))are in the range expected by recent CPT based designprocedures (Jardine et al., 2005). The test data are consi-dered fully credible stress even at points close to the pileshaft.
MINI IMPERIAL COLLEGE PILE (MINI ICP)
Development of Mini-ICPThe original Imperial College instrumented pile (ICP)
described by Bond et al. (1991) is a 102-mm-diameterclosed-ended steel pile, having a total length that could bevaried (from 6 to 20 m) by adding/removing modularinstrument clusters and interconnecting casings. Eachcluster consists of an axial load cell, a surface stress trans-ducer, a pore pressure probe, and a temperature sensorinside the stress transducer. Comprehensive measure-ments of the shaft eŠective stress conditions are possibleduring installation, long-term equalisation and load test-
ing to failure. Redundancy of measurements and crosschecking are built-in and the ˆeld devices have been usedsuccessfully in soils ranging from soft to hard clays, andloose to dense sands (Bond, 1989; Lehane, 1992; Chow,1997).
The Authors' tests called for similar capabilities in aCPT (36 mm-diameter) sized closed-ended stainless steeldevice, termed the mini-ICP, which was designed andbuilt in conjunction with Cambridge In-situ (Little Evers-den, UK). It carries three instrumented clusters, has asolid 609cone at its tip, a special cap and interconnectingthreaded casings making up a fully assembled length of1.4 m. After assembly, the pile was air abraded to a meancentreline surface roughness, RCLA, of 3–4 mm. The gener-
666
Fig. 9. Typical SST and ALC instrumented cluster on the mini ICP
Table 2. Typical location of instruments along the pile shaft
Cluster Instrument Height (h) abovepile tipa, mm
Normalized distanceb,h/R
TrailingALC 827 45.9SST 750 41.7
FollowingALC 467 25.9SST 390 21.7
LeadingALC 197 10.9SST 120 6.7
a All distances measured from the cone tip (angle of cone=609; distanceof cone shoulder from the tip=31 mm)
b Pile radius R=18 mm
666 JARDINE ET AL.
al arrangements are shown in Fig. 8; the three instrumentclusters are orientated around the pile shaft at 1209inter-vals to minimize the potential in‰uence between clustersand bending of the pile shaft. The three clusters aretermed as leading, following and trailing taking the orderof increasing distance from the pile tip. An exploded viewof a typical instrumented cluster is shown in Fig. 9. Eachcontains:
1. An axial load cell (ALC), which provides theaverage skin friction, fs in combination with otherALCs.
2. A surface stress transducer (SST) that measures thelocal radial total stress (sr) on two independent cir-cuits and the shear stress (trz) on one other.
3. A temperature sensor.4. Three MEMS inclinometer sensors (sensing in X, Y
and Z directions) to capture the pile orientation.5. A local signal conditioning system for regulating
power supply and carrying out A/D conversion.The ALCs and SSTs are identiˆed by the distance from
the instrument centre to the pile tip using the parameter``h/R'', where h is the distance above the pile tip and R isthe pile radius, as tabulated in Table 2.
An independent load cell is ˆxed between the jack andthe pile cap to measure loads during load tests. An LVDTis attached to the jack to record the global pile headmovement, while a second LVDT (and a dial-gauge) aremounted on the shaft just above the calibration chamberto eliminate errors associated with loading system com-pliance.
Cell Action EŠectThe mini-ICP SST cells were designed to minimize cell
action eŠects. The radial pillar and shear web SST designis su‹ciently stiŠ for the potential errors to be far smallerthan with the soil-stress sensors. Soil-cell calibrations arevery di‹cult to make with curved surface stress trans-ducers, and elastic theory was used to estimate the maxi-mum possible degree of cell action error. As recommend-ed by Bond et al. (1991), these assessments were counter-checked through trials. SST local shear stress measure-ments were compared with independent load transferdata derived from the ALCs. The potential errors, de ofmeasurements made in elastic soils can be estimated(Jardine, 1985; Bond et al., 1991) by:
de=1/(1+1/C) (1)
and
C=( f/a)[G/(1-m)]C (2)
where f=the cell's compliance; a=the equivalent radiusof the loading platen; G=the soil's shear stiŠness; m=thesoil's Poisson's ratio and C=a shape factor. The calcu-lated mini-ICP's SST radial compliance, f=1.02×10⁻⁸
m/kPa and its shear compliance, f=1.07×10⁻⁸ m/kPa.While representative values of G may be hard to select forsoils beyond their very limited initial elastic `small strain'range, the maximum potential error can be assessed bysubstituting the inˆnitesimal strain modulus, Gmax. Withsands, Gmax may be estimated from cone resistance by anexpression derived from Baldi et al. (1989):
Gmax=qc[A+Bh-Ch2]-1 (3)
where qc=cone resistance from CPT tests; A=0.0203, B=0.00125, and C=1.216e-6; h=qc( pas?v0)-0.5, pa=at-mosphere pressure, and s?v0=the eŠective overburdenstress.
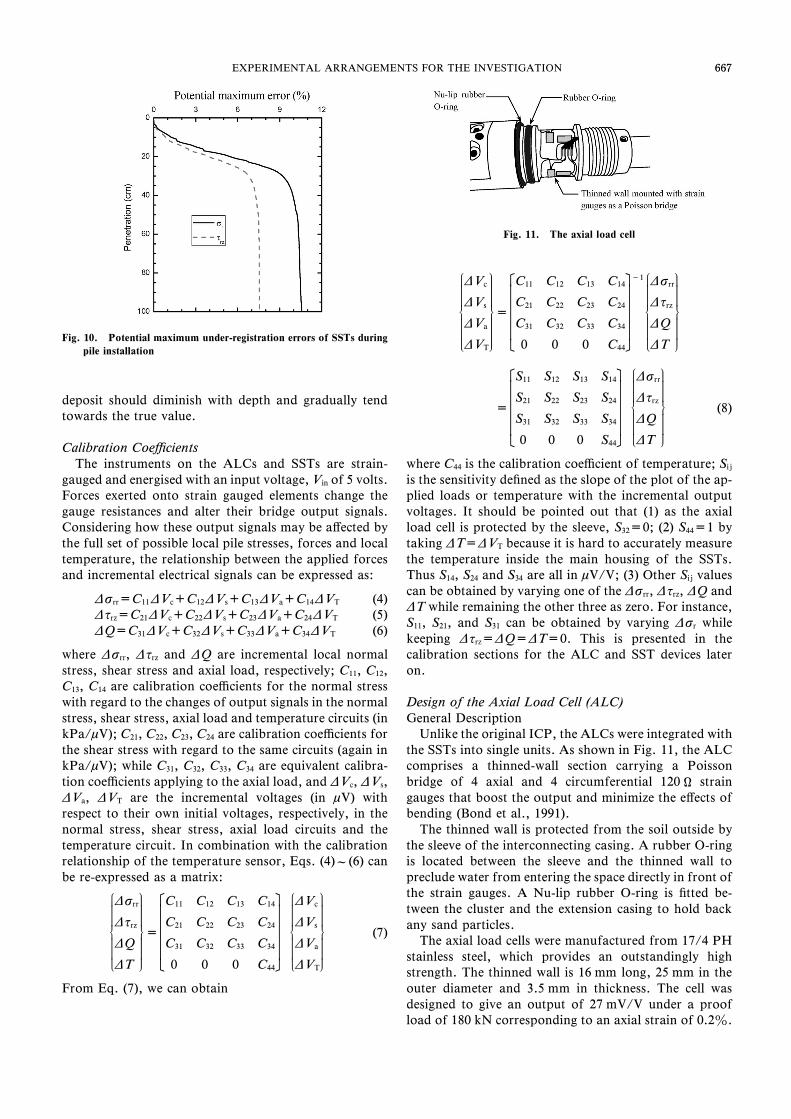
Applying the cone resistance shown in Fig. 5, taking m=0.25 and substituting appropriate values into Eqs. (1)and (2) (for radial stress, C=0.79, a=17 mm; for shearstress, C=1.2, a=18 mm), leads to the upper boundpotential under-registration errors shown in Fig. 10.Worst case errors amount to ¿11z and ¿8z for theradial and shear stresses and correspond to those expect-ed if an instantaneous soil stress change was applied to astationary pile. The true errors are likely to be lower, par-ticularly during penetration, because (i) the operationalshear moduli will fall well below Gmax and (ii) the errorsassociated with each successive push within a uniform
667
Fig. 10. Potential maximum under-registration errors of SSTs duringpile installation
Fig. 11. The axial load cell
667EXPERIMENTAL ARRANGEMENTS FOR THE INVESTIGATION
deposit should diminish with depth and gradually tendtowards the true value.
Calibration Coe‹cientsThe instruments on the ALCs and SSTs are strain-
gauged and energised with an input voltage, Vin of 5 volts.Forces exerted onto strain gauged elements change thegauge resistances and alter their bridge output signals.Considering how these output signals may be aŠected bythe full set of possible local pile stresses, forces and localtemperature, the relationship between the applied forcesand incremental electrical signals can be expressed as:
Dsrr=C11DVc+C12DVs+C13DVa+C14DVT (4)Dtrz=C21DVc+C22DVs+C23DVa+C24DVT (5)DQ=C31DVc+C32DVs+C33DVa+C34DVT (6)
where Dsrr, Dtrz and DQ are incremental local normalstress, shear stress and axial load, respectively; C11, C12,C13, C14 are calibration coe‹cients for the normal stresswith regard to the changes of output signals in the normalstress, shear stress, axial load and temperature circuits (inkPa/mV); C21, C22, C23, C24 are calibration coe‹cients forthe shear stress with regard to the same circuits (again inkPa/mV); while C31, C32, C33, C34 are equivalent calibra-tion coe‹cients applying to the axial load, and DVc, DVs,DVa, DVT are the incremental voltages (in mV) withrespect to their own initial voltages, respectively, in thenormal stress, shear stress, axial load circuits and thetemperature circuit. In combination with the calibrationrelationship of the temperature sensor, Eqs. (4)¿(6) canbe re-expressed as a matrix:
Dsrr
Dtrz
DQ
DT
=
C11
C21
C31
0
C12
C22
C32
0
C13
C23
C33
0
C14
C24
C34
C44
DVc
DVs
DVa
DVT
(7)
From Eq. (7), we can obtain
DVc
DVs
DVa
DVT
=
C11
C21
C31
0
C12
C22
C32
0
C13
C23
C33
0
C14
C24
C34
C44
-1
Dsrr
Dtrz
DQ
DT
=
S11
S21
S31
0
S12
S22
S32
0
S13
S23
S33
0
S14
S24
S34
S44
Dsrr
Dtrz
DQ
DT
(8)
where C44 is the calibration coe‹cient of temperature; Sij
is the sensitivity deˆned as the slope of the plot of the ap-plied loads or temperature with the incremental outputvoltages. It should be pointed out that (1) as the axialload cell is protected by the sleeve, S32=0; (2) S44=1 bytaking DT=DVT because it is hard to accurately measurethe temperature inside the main housing of the SSTs.Thus S14, S24 and S34 are all in mV/V; (3) Other Sij valuescan be obtained by varying one of the Dsrr, Dtrz, DQ andDT while remaining the other three as zero. For instance,S11, S21, and S31 can be obtained by varying Dsr whilekeeping Dtrz=DQ=DT=0. This is presented in thecalibration sections for the ALC and SST devices lateron.
Design of the Axial Load Cell (ALC)General Description
Unlike the original ICP, the ALCs were integrated withthe SSTs into single units. As shown in Fig. 11, the ALCcomprises a thinned-wall section carrying a Poissonbridge of 4 axial and 4 circumferential 120 Q straingauges that boost the output and minimize the eŠects ofbending (Bond et al., 1991).
The thinned wall is protected from the soil outside bythe sleeve of the interconnecting casing. A rubber O-ringis located between the sleeve and the thinned wall topreclude water from entering the space directly in front ofthe strain gauges. A Nu-lip rubber O-ring is ˆtted be-tween the cluster and the extension casing to hold backany sand particles.
The axial load cells were manufactured from 17/4 PHstainless steel, which provides an outstandingly highstrength. The thinned wall is 16 mm long, 25 mm in theouter diameter and 3.5 mm in thickness. The cell wasdesigned to give an output of 27 mV/V under a proofload of 180 kN corresponding to an axial strain of 0.2z.
668
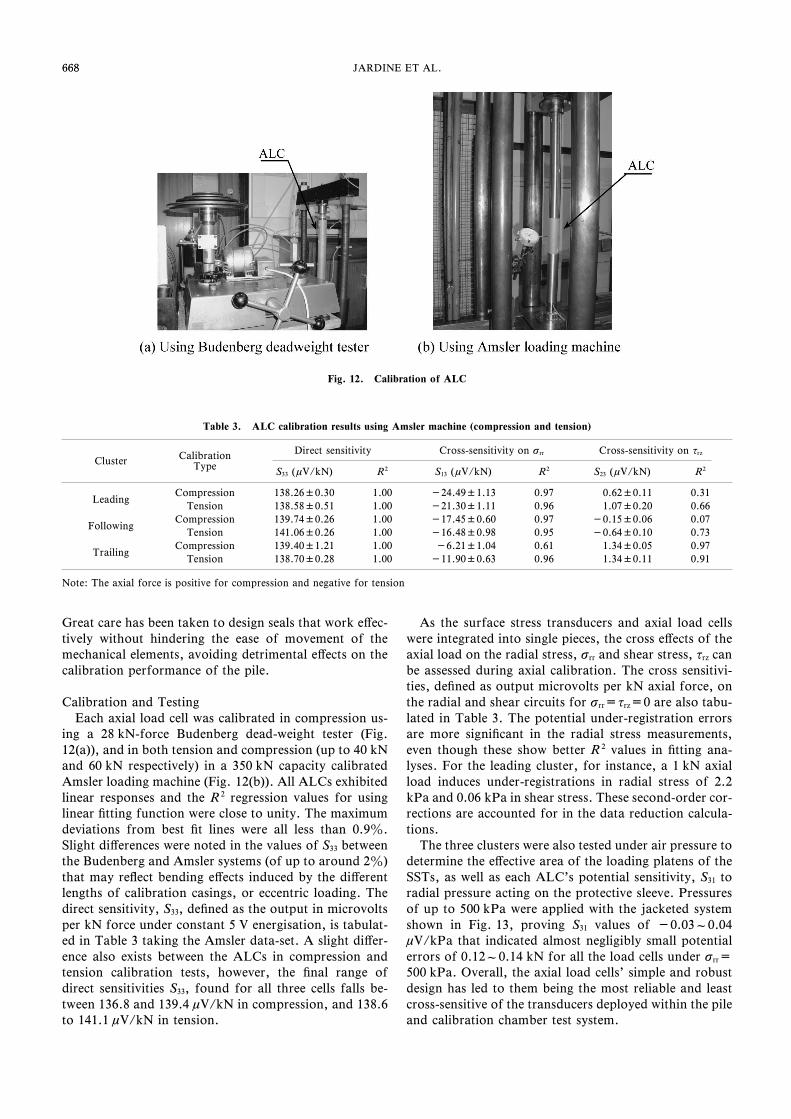
Fig. 12. Calibration of ALC
Table 3. ALC calibration results using Amsler machine (compression and tension)
Cluster CalibrationType
Direct sensitivity Cross-sensitivity on srr Cross-sensitivity on trz
S33 (mV/kN) R2 S13 (mV/kN) R2 S23 (mV/kN) R2
LeadingCompression 138.26±0.30 1.00 -24.49±1.13 0.97 0.62±0.11 0.31
Tension 138.58±0.51 1.00 -21.30±1.11 0.96 1.07±0.20 0.66
FollowingCompression 139.74±0.26 1.00 -17.45±0.60 0.97 -0.15±0.06 0.07
Tension 141.06±0.26 1.00 -16.48±0.98 0.95 -0.64±0.10 0.73
TrailingCompression 139.40±1.21 1.00 -6.21±1.04 0.61 1.34±0.05 0.97
Tension 138.70±0.28 1.00 -11.90±0.63 0.96 1.34±0.11 0.91
Note: The axial force is positive for compression and negative for tension
668 JARDINE ET AL.
Great care has been taken to design seals that work eŠec-tively without hindering the ease of movement of themechanical elements, avoiding detrimental eŠects on thecalibration performance of the pile.
Calibration and TestingEach axial load cell was calibrated in compression us-
ing a 28 kN-force Budenberg dead-weight tester (Fig.12(a)), and in both tension and compression (up to 40 kNand 60 kN respectively) in a 350 kN capacity calibratedAmsler loading machine (Fig. 12(b)). All ALCs exhibitedlinear responses and the R2 regression values for usinglinear ˆtting function were close to unity. The maximumdeviations from best ˆt lines were all less than 0.9z.Slight diŠerences were noted in the values of S33 betweenthe Budenberg and Amsler systems (of up to around 2z)that may re‰ect bending eŠects induced by the diŠerentlengths of calibration casings, or eccentric loading. Thedirect sensitivity, S33, deˆned as the output in microvoltsper kN force under constant 5 V energisation, is tabulat-ed in Table 3 taking the Amsler data-set. A slight diŠer-ence also exists between the ALCs in compression andtension calibration tests, however, the ˆnal range ofdirect sensitivities S33, found for all three cells falls be-tween 136.8 and 139.4 mV/kN in compression, and 138.6to 141.1 mV/kN in tension.
As the surface stress transducers and axial load cellswere integrated into single pieces, the cross eŠects of theaxial load on the radial stress, srr and shear stress, trz canbe assessed during axial calibration. The cross sensitivi-ties, deˆned as output microvolts per kN axial force, onthe radial and shear circuits for srr=trz=0 are also tabu-lated in Table 3. The potential under-registration errorsare more signiˆcant in the radial stress measurements,even though these show better R 2 values in ˆtting ana-lyses. For the leading cluster, for instance, a 1 kN axialload induces under-registrations in radial stress of 2.2kPa and 0.06 kPa in shear stress. These second-order cor-rections are accounted for in the data reduction calcula-tions.
The three clusters were also tested under air pressure todetermine the eŠective area of the loading platens of theSSTs, as well as each ALC's potential sensitivity, S31 toradial pressure acting on the protective sleeve. Pressuresof up to 500 kPa were applied with the jacketed systemshown in Fig. 13, proving S31 values of -0.03¿0.04mV/kPa that indicated almost negligibly small potentialerrors of 0.12¿0.14 kN for all the load cells under srr=500 kPa. Overall, the axial load cells' simple and robustdesign has led to them being the most reliable and leastcross-sensitive of the transducers deployed within the pileand calibration chamber test system.
669
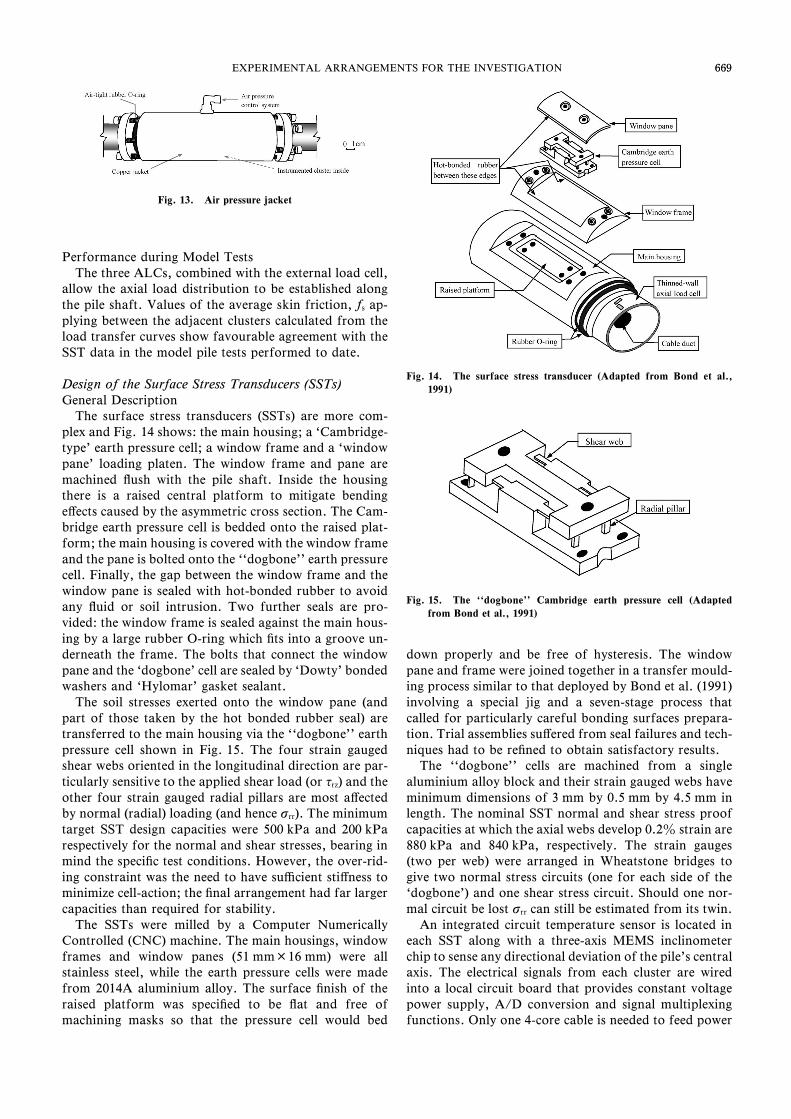
Fig. 13. Air pressure jacket
Fig. 14. The surface stress transducer (Adapted from Bond et al.,1991)
Fig. 15. The ``dogbone'' Cambridge earth pressure cell (Adaptedfrom Bond et al., 1991)
669EXPERIMENTAL ARRANGEMENTS FOR THE INVESTIGATION
Performance during Model TestsThe three ALCs, combined with the external load cell,
allow the axial load distribution to be established alongthe pile shaft. Values of the average skin friction, fs ap-plying between the adjacent clusters calculated from theload transfer curves show favourable agreement with theSST data in the model pile tests performed to date.
Design of the Surface Stress Transducers (SSTs)General Description
The surface stress transducers (SSTs) are more com-plex and Fig. 14 shows: the main housing; a `Cambridge-type' earth pressure cell; a window frame and a `windowpane' loading platen. The window frame and pane aremachined ‰ush with the pile shaft. Inside the housingthere is a raised central platform to mitigate bendingeŠects caused by the asymmetric cross section. The Cam-bridge earth pressure cell is bedded onto the raised plat-form; the main housing is covered with the window frameand the pane is bolted onto the ``dogbone'' earth pressurecell. Finally, the gap between the window frame and thewindow pane is sealed with hot-bonded rubber to avoidany ‰uid or soil intrusion. Two further seals are pro-vided: the window frame is sealed against the main hous-ing by a large rubber O-ring which ˆts into a groove un-derneath the frame. The bolts that connect the windowpane and the `dogbone' cell are sealed by `Dowty' bondedwashers and `Hylomar' gasket sealant.
The soil stresses exerted onto the window pane (andpart of those taken by the hot bonded rubber seal) aretransferred to the main housing via the ``dogbone'' earthpressure cell shown in Fig. 15. The four strain gaugedshear webs oriented in the longitudinal direction are par-ticularly sensitive to the applied shear load (or trz) and theother four strain gauged radial pillars are most aŠectedby normal (radial) loading (and hence srr). The minimumtarget SST design capacities were 500 kPa and 200 kParespectively for the normal and shear stresses, bearing inmind the speciˆc test conditions. However, the over-rid-ing constraint was the need to have su‹cient stiŠness tominimize cell-action; the ˆnal arrangement had far largercapacities than required for stability.
The SSTs were milled by a Computer NumericallyControlled (CNC) machine. The main housings, windowframes and window panes (51 mm×16 mm) were allstainless steel, while the earth pressure cells were madefrom 2014A aluminium alloy. The surface ˆnish of theraised platform was speciˆed to be ‰at and free ofmachining masks so that the pressure cell would bed
down properly and be free of hysteresis. The windowpane and frame were joined together in a transfer mould-ing process similar to that deployed by Bond et al. (1991)involving a special jig and a seven-stage process thatcalled for particularly careful bonding surfaces prepara-tion. Trial assemblies suŠered from seal failures and tech-niques had to be reˆned to obtain satisfactory results.
The ``dogbone'' cells are machined from a singlealuminium alloy block and their strain gauged webs haveminimum dimensions of 3 mm by 0.5 mm by 4.5 mm inlength. The nominal SST normal and shear stress proofcapacities at which the axial webs develop 0.2z strain are880 kPa and 840 kPa, respectively. The strain gauges(two per web) were arranged in Wheatstone bridges togive two normal stress circuits (one for each side of the`dogbone') and one shear stress circuit. Should one nor-mal circuit be lost srr can still be estimated from its twin.
An integrated circuit temperature sensor is located ineach SST along with a three-axis MEMS inclinometerchip to sense any directional deviation of the pile's centralaxis. The electrical signals from each cluster are wiredinto a local circuit board that provides constant voltagepower supply, A/D conversion and signal multiplexingfunctions. Only one 4-core cable is needed to feed power
670
Table 4. Calibration procedure for surface stress transducers
step Stage Calibration srr, kPa trz, kPa Sensitivity obtained
1 Exercise Sustained loads 848 +2652 Sustained loads 848 -2653 Rapid radial cycling 16–848 04 Rapid shear cycling 848 ±2655 Radial stress calibration Vary srr while keeping trz constant 16–848 06 109–848 +457 294–848 +89 S11 and S21
8 Eccentric loading Apply srr at +ea 16–758 09 Apply srr at -e 16–758 0
10 Calibration under air pressure Vary srr while keeping trz constant 0–500 0 Contribution of hot bonded rubber and S31
11 Shear calibration Vary trz while keeping srr constant 848 ±26512 756 ±26513 663 ±26514 571 ±22115 478 ±221 S12 and S22
16 386 ±19917 293 ±13318 201 ±11119 108 ±6720 Creep testing Sustained loads 663 +133 Stability check21 Temperature calibration Vary temperature 0 0 S14, S24 and S34
a Eccentricity e=1.5 mm
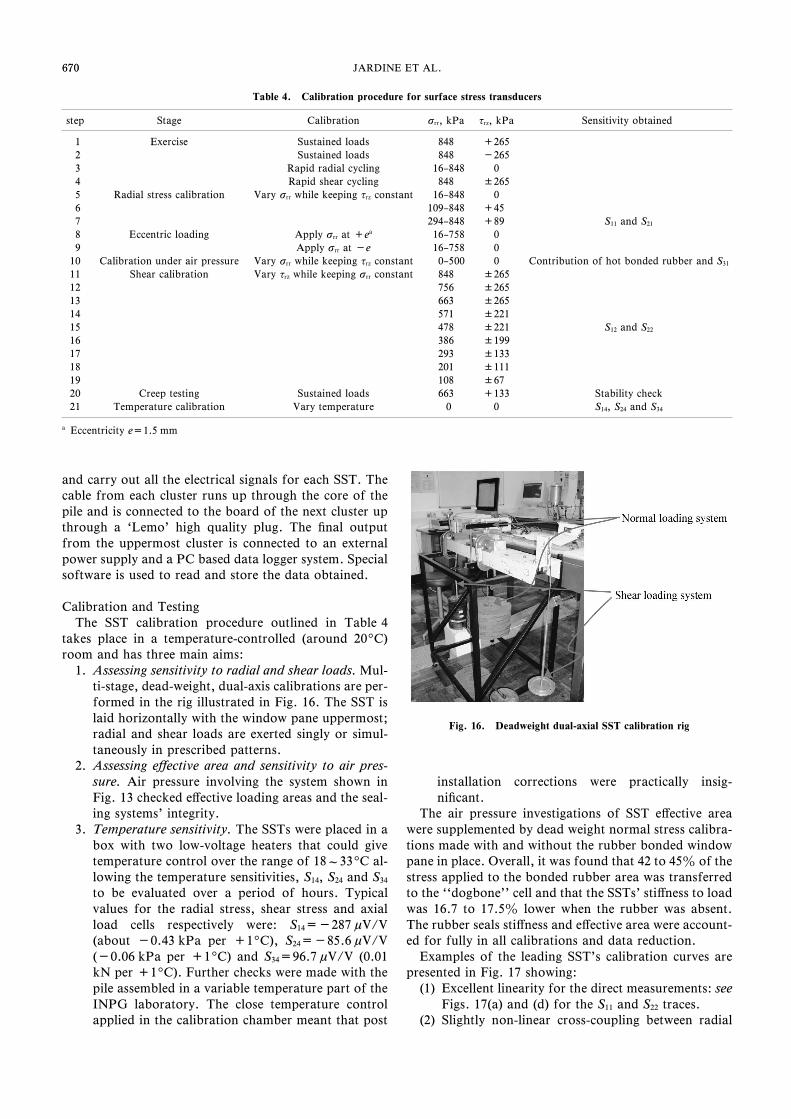
Fig. 16. Deadweight dual-axial SST calibration rig
670 JARDINE ET AL.
and carry out all the electrical signals for each SST. Thecable from each cluster runs up through the core of thepile and is connected to the board of the next cluster upthrough a `Lemo' high quality plug. The ˆnal outputfrom the uppermost cluster is connected to an externalpower supply and a PC based data logger system. Specialsoftware is used to read and store the data obtained.
Calibration and TestingThe SST calibration procedure outlined in Table 4
takes place in a temperature-controlled (around 209C)room and has three main aims:
1. Assessing sensitivity to radial and shear loads. Mul-ti-stage, dead-weight, dual-axis calibrations are per-formed in the rig illustrated in Fig. 16. The SST islaid horizontally with the window pane uppermost;radial and shear loads are exerted singly or simul-taneously in prescribed patterns.
2. Assessing eŠective area and sensitivity to air pres-sure. Air pressure involving the system shown inFig. 13 checked eŠective loading areas and the seal-ing systems' integrity.
3. Temperature sensitivity. The SSTs were placed in abox with two low-voltage heaters that could givetemperature control over the range of 18¿339C al-lowing the temperature sensitivities, S14, S24 and S34
to be evaluated over a period of hours. Typicalvalues for the radial stress, shear stress and axialload cells respectively were: S14=-287 mV/V(about -0.43 kPa per +19C), S24=-85.6 mV/V(-0.06 kPa per +19C) and S34=96.7 mV/V (0.01kN per +19C). Further checks were made with thepile assembled in a variable temperature part of theINPG laboratory. The close temperature controlapplied in the calibration chamber meant that post
installation corrections were practically insig-niˆcant.
The air pressure investigations of SST eŠective areawere supplemented by dead weight normal stress calibra-tions made with and without the rubber bonded windowpane in place. Overall, it was found that 42 to 45z of thestress applied to the bonded rubber area was transferredto the ``dogbone'' cell and that the SSTs' stiŠness to loadwas 16.7 to 17.5z lower when the rubber was absent.The rubber seals stiŠness and eŠective area were account-ed for fully in all calibrations and data reduction.
Examples of the leading SST's calibration curves arepresented in Fig. 17 showing:
(1) Excellent linearity for the direct measurements: seeFigs. 17(a) and (d) for the S11 and S22 traces.
(2) Slightly non-linear cross-coupling between radial
671
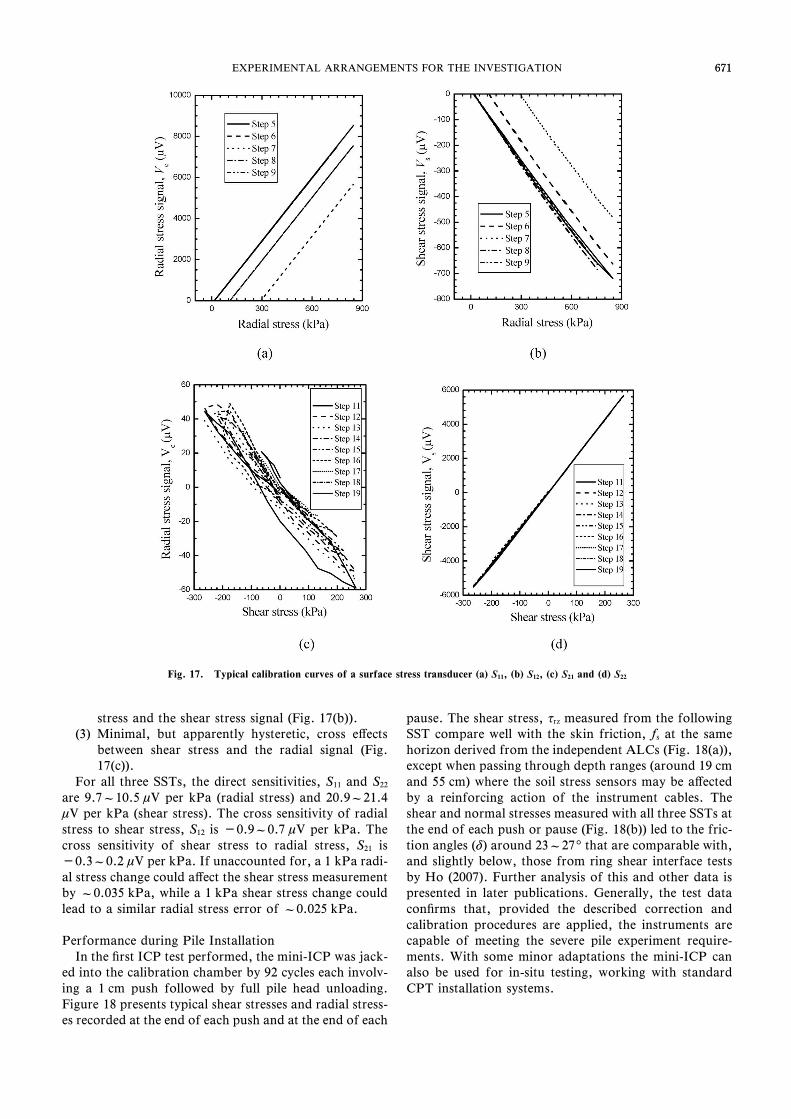
Fig. 17. Typical calibration curves of a surface stress transducer (a) S11, (b) S12, (c) S21 and (d) S22
671EXPERIMENTAL ARRANGEMENTS FOR THE INVESTIGATION
stress and the shear stress signal (Fig. 17(b)).(3) Minimal, but apparently hysteretic, cross eŠects
between shear stress and the radial signal (Fig.17(c)).
For all three SSTs, the direct sensitivities, S11 and S22
are 9.7¿10.5 mV per kPa (radial stress) and 20.9¿21.4mV per kPa (shear stress). The cross sensitivity of radialstress to shear stress, S12 is -0.9¿0.7 mV per kPa. Thecross sensitivity of shear stress to radial stress, S21 is-0.3¿0.2 mV per kPa. If unaccounted for, a 1 kPa radi-al stress change could aŠect the shear stress measurementby ¿0.035 kPa, while a 1 kPa shear stress change couldlead to a similar radial stress error of ¿0.025 kPa.
Performance during Pile InstallationIn the ˆrst ICP test performed, the mini-ICP was jack-
ed into the calibration chamber by 92 cycles each involv-ing a 1 cm push followed by full pile head unloading.Figure 18 presents typical shear stresses and radial stress-es recorded at the end of each push and at the end of each
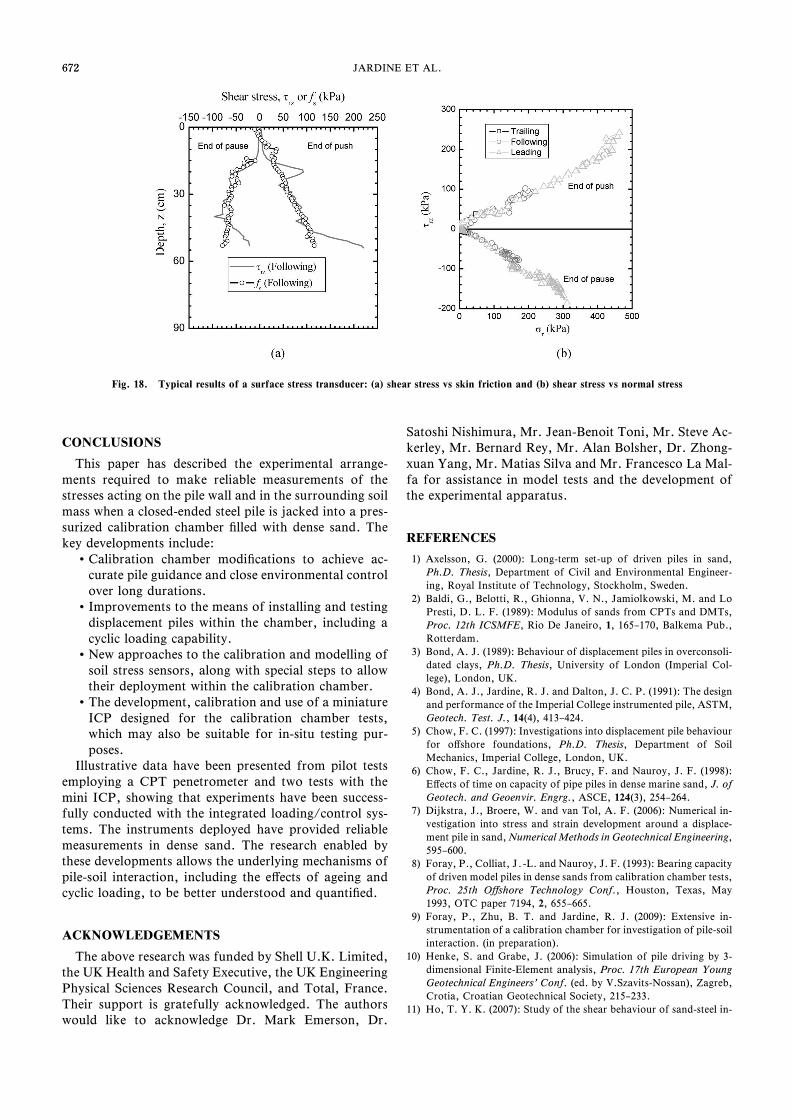
pause. The shear stress, trz measured from the followingSST compare well with the skin friction, fs at the samehorizon derived from the independent ALCs (Fig. 18(a)),except when passing through depth ranges (around 19 cmand 55 cm) where the soil stress sensors may be aŠectedby a reinforcing action of the instrument cables. Theshear and normal stresses measured with all three SSTs atthe end of each push or pause (Fig. 18(b)) led to the fric-tion angles (d) around 23¿279that are comparable with,and slightly below, those from ring shear interface testsby Ho (2007). Further analysis of this and other data ispresented in later publications. Generally, the test dataconˆrms that, provided the described correction andcalibration procedures are applied, the instruments arecapable of meeting the severe pile experiment require-ments. With some minor adaptations the mini-ICP canalso be used for in-situ testing, working with standardCPT installation systems.
672
Fig. 18. Typical results of a surface stress transducer: (a) shear stress vs skin friction and (b) shear stress vs normal stress
672 JARDINE ET AL.
CONCLUSIONS
This paper has described the experimental arrange-ments required to make reliable measurements of thestresses acting on the pile wall and in the surrounding soilmass when a closed-ended steel pile is jacked into a pres-surized calibration chamber ˆlled with dense sand. Thekey developments include:
Calibration chamber modiˆcations to achieve ac-curate pile guidance and close environmental controlover long durations.
Improvements to the means of installing and testingdisplacement piles within the chamber, including acyclic loading capability.
New approaches to the calibration and modelling ofsoil stress sensors, along with special steps to allowtheir deployment within the calibration chamber.
The development, calibration and use of a miniatureICP designed for the calibration chamber tests,which may also be suitable for in-situ testing pur-poses.
Illustrative data have been presented from pilot testsemploying a CPT penetrometer and two tests with themini ICP, showing that experiments have been success-fully conducted with the integrated loading/control sys-tems. The instruments deployed have provided reliablemeasurements in dense sand. The research enabled bythese developments allows the underlying mechanisms ofpile-soil interaction, including the eŠects of ageing andcyclic loading, to be better understood and quantiˆed.
ACKNOWLEDGEMENTS
The above research was funded by Shell U.K. Limited,the UK Health and Safety Executive, the UK EngineeringPhysical Sciences Research Council, and Total, France.Their support is gratefully acknowledged. The authorswould like to acknowledge Dr. Mark Emerson, Dr.
Satoshi Nishimura, Mr. Jean-Benoit Toni, Mr. Steve Ac-kerley, Mr. Bernard Rey, Mr. Alan Bolsher, Dr. Zhong-xuan Yang, Mr. Matias Silva and Mr. Francesco La Mal-fa for assistance in model tests and the development ofthe experimental apparatus.
REFERENCES
1) Axelsson, G. (2000): Long-term set-up of driven piles in sand,Ph.D. Thesis, Department of Civil and Environmental Engineer-ing, Royal Institute of Technology, Stockholm, Sweden.
2) Baldi, G., Belotti, R., Ghionna, V. N., Jamiolkowski, M. and LoPresti, D. L. F. (1989): Modulus of sands from CPTs and DMTs,Proc. 12th ICSMFE, Rio De Janeiro, 1, 165–170, Balkema Pub.,Rotterdam.
3) Bond, A. J. (1989): Behaviour of displacement piles in overconsoli-dated clays, Ph.D. Thesis, University of London (Imperial Col-lege), London, UK.
4) Bond, A. J., Jardine, R. J. and Dalton, J. C. P. (1991): The designand performance of the Imperial College instrumented pile, ASTM,Geotech. Test. J., 14(4), 413–424.
5) Chow, F. C. (1997): Investigations into displacement pile behaviourfor oŠshore foundations, Ph.D. Thesis, Department of SoilMechanics, Imperial College, London, UK.
6) Chow, F. C., Jardine, R. J., Brucy, F. and Nauroy, J. F. (1998):EŠects of time on capacity of pipe piles in dense marine sand, J. ofGeotech. and Geoenvir. Engrg., ASCE, 124(3), 254–264.
7) Dijkstra, J., Broere, W. and van Tol, A. F. (2006): Numerical in-vestigation into stress and strain development around a displace-ment pile in sand, Numerical Methods in Geotechnical Engineering,595–600.
8) Foray, P., Colliat, J‚-L. and Nauroy, J. F. (1993): Bearing capacityof driven model piles in dense sands from calibration chamber tests,Proc. 25th OŠshore Technology Conf., Houston, Texas, May1993, OTC paper 7194, 2, 655–665.
9) Foray, P., Zhu, B. T. and Jardine, R. J. (2009): Extensive in-strumentation of a calibration chamber for investigation of pile-soilinteraction. (in preparation).
10) Henke, S. and Grabe, J. (2006): Simulation of pile driving by 3-dimensional Finite-Element analysis, Proc. 17th European YoungGeotechnical Engineers' Conf. (ed. by V.Szavits-Nossan), Zagreb,Crotia, Croatian Geotechnical Society, 215–233.
11) Ho, T. Y. K. (2007): Study of the shear behaviour of sand-steel in-
673673EXPERIMENTAL ARRANGEMENTS FOR THE INVESTIGATION
terfaces by ring shear tests, MSc Dissertation, University of Lon-don (Imperial College), London, UK.
12) Jardine, R. J. (1985): Investigations of pile-soil behaviour, withspecial reference to the foundations of oŠshore structures, Ph.D.Thesis, University of London (Imperial College), London, UK.
13) Jardine, R. J., Chow, F. C., Overy, R., et al. (2005): ICP Designmethods for driven piles in sands and clays, Thomas Telford.
14) Jardine, R. J., Standing, J. R. and Chow, F. C. (2006): Some ob-servations of the eŠects of time on the capacity of piles driven insand, Geotechnique, 56(4), 227–244.
15) Lehane, B. M. (1992): Experimental investigations of pile behav-iour using instrumented ˆeld piles, Ph.D. Thesis, University ofLondon (Imperial College), London, UK.
16) Lehane, B. M., Jardine, R. J., Bond, A. J. and Frank, R. (1993):Mechanisms of shaft friction in sand from instrumented pile tests,J. Geotech. Engrg. Div., Proc. ASCE, 119(1), 19–35.
17) Liyanapathirana, D. S., Deeks, A. J. and Randolph, M. F. (2000):Numerical modelling of large deformations associated with drivingof open-ended piles, Int'l J. for Num. and Ana. Meth. in Geo-mech., 24, 1079–1101.
18) Lunne, T., Robertson, P. K. and Powell, J. J. M. (1997): Cone
penetration testing in geotechnical practice, Blackie Academic &Professional/London, UK.
19) Nauroy, J. F. and Le Tirant, P. (1983): Model tests of piles in cal-careous sands, Proc. Conf. on Geotechnical Practice in OŠshoreEngng., Austin, Texas, ASCE, 356–369.
20) National Instrument (NI), (2008): LabVIEW 8.5,http://www.ni.com/labview85/.
21) Sheng, D., Dieter Eigenbrod, K., and Wriggers, P. (2005): Finiteelement analysis of pile installation using large-slip frictional con-tact, Computers & Geotechnics, 32(1), 17–26.
22) White, D. J. and Bolton, M. D. (2004): Displacement and strainpaths during plane-plain model pile installation in sand, Geotech-nique, 54(6), 375–397.
23) White, D. J., Schneider J. A. and Lehane B. M. (2005): The in-‰uence of eŠective area ratio on shaft friction of displacement pilesin sand, Proc. Int'l Symposium on Frontiers in OŠshore Geo-technics, Perth, 741–747.
24) Zhu, B. T., Jardine, R. J. and Foray, P. (2009): The use of minia-ture soil stress measuring cells in laboratory applications involvingstress reversals, Soils and Foundations, 49(5), 675–688.