Embed Size (px)
Citation preview

LA—12124-MS
DE91 015986
Experimental Assessment
of Air Permeability
in a Concrete Shear Wall Subjected
to Simulated Seismic Loading
Steven P. GirrensCharles R. Farrar
Los Alamos National LaboratoryLos Alamos,New Mexico 87545
CrSTRIBUTHW OF THfS DOCUMENT IS

CONTENTS
ABSTRACT 1
I. INTRODUCTION 2
11. LITERATURE REVIEW 3
II I . CONCRETE AIR PERMEABILITY, CAP-1, MODEL CONSTRUCTION 6
IV. AIR PERMEABILITY TESTING 1 2
V. COMPARISON OF PERMEABILITY DATA WITH PUBLISHED
RESULTS 18
VI. STATIC LOAD-CYCLE TEST SETUP 20
VII . SEISMIC LOAD SIMULATION AND ACCOMPANYING AIRFLOW 2 2
VI I I . SUMMARY AND DISCUSSION 31
IX. RECOMMENDATIONS FOR FUTURE WORK 3 5
APPENDIX A. CONCRETE TEST CYLINDERS LAB REPORT 37
APPENDIX B. NEGATIVE WIND PRESSURE CALCULATION 43
B.1 SCOPE 44
B.2 BACKGROUND 44
B.3 STRATEGY 44
B.4 CALCULATION SUMMARY 45
B.5 CONCLUSION 46
REFERENCES 47
FIGURES
1. CAP-1 test structure detail 8
2. CAP-1 test structure with cover plates attached 9
3. CAP-1 test structure forms and rebar before concrete
placement 10

4. Permeability test setup 13
5. Transient-pressure data for uncoated concrete shear wallpermeability test 16
6. Transient-pressure data for coated concrete shear wallpermeability test 1 7
7. Static load frame component layout 21
8. Static test setup 23
9. CAP-1 load step vs load history 24
10. CAP-1 60-psi NBSS load vs displacement curve, cycle 3 24
11. CAP-1 130-psi NBSS load vs displacement curve, cycle 3 25
12. CAP-1 190-psi NBSS load vs displacement curve, cycle 3 25
13. CAP-1 285-psi NBSS failure load vs displacement cycle 27
14. CAP-1 crack pattern on front (coated) side of shear wall 28
15. CAP-1 crack pattern on back side of shear wall 29
16. Typical transient-pressure decay plot after test structuredamage 30
17. Pressure variation over eight days during steady airflow test 32
TABLES
I. CONCRETE MIX CONSTITUENT PORTIONS 1 1
11. MEASURED CONCRETE PROPERTIES 11
III. CONCRETE SHEAR WALL PERMEABILITY 1 6
IV. COATED CONCRETE SHEAR WALL PERMEABILITY 1 8
V. COMPARISON OF PUBLISHED CONCRETE PERMEABILITIES 1 9
vi

VI. CONCRETE PERMEABILITY AFTER LINEAR SEISMIC LOAD-
CYCLING RESPONSE 26
VII. TRANSIENT PERMEABILITY DATA IN CRACKED CONCRETE
SHEAR WALL 31
VII I . STEADY PERMEABILITY DATA FOR CRACKED CONCRETE
SHEAR WALL 32
V I I

EXPERIMENTAL ASSESSMENT OF AIR PERMEABILITY IN A CONCRETESHEAR WALL SUBJECTED TO SIMULATED SEISMIC LOADING
by
Steven P. Girrens and Charles R. Farrar
ABSTRACT
A safety concern for the proposed Special NuclearMaterials Laboratory (SNML) facility at the Los AlamosNational Laboratory was air leakage from the facility if itwere to experience a design basis earthquake event. Toaddress this concern, a study was initiated to estimate airleakage, driven by wind-generated pressure gradients, froma seismically damaged concrete structure. This reportdescribes a prototype experiment developed and performedto measure the air permeability in a reinforced concreteshear wall, both before and after simulated seismicloading.
A shear wall (48 x 36 x 6 in.) test structure wasfabricated with standard 4000-psi concrete mix. Thepercent of horizontal and vertical reinforcement in theshear wall was equal to the percent reinforcement proposedfor the actual SNML structure. Static load-cycle testingwas used to simulate earthquake loading. Permeabilitymeasurements were made by pressurizing one side of theshear wall above atmospheric conditions and recording thetransient-pressure decay.
Air permeability measurements made on the shearwall before loading fell within the range of values forconcrete permeability published in the literature. Inaddition, as long as the structure exhibited linear load-displacement response, no variation in the air permeabilitywas detected. However, experimental results indicate thatthe air permeability in the shear wall increased by a factorof 40 after the wall had been damaged (cracked). Details ofthe experimental activities, comparisons of permeabilitydata to published results, and recommendations for futurework are presented.

I. INTRODUCTION
JJnder normal operating conditions, the ventilation system for theproposed Special Nuclear Materials Laboratory (SNML) facility provides anegative pressure differential to prevent unfiltered air leakage from thebuilding. Air leakage is the uncontrolled movement of air through walls androofs both into a structure (infiltration) and out of a structure (exhaust).The air movement occurs as a result of pressure differences produced bywind, thermal effects, and the operation of mechanical ventilation systems.A loss of the ventilation system would allow the air pressure inside thebuilding to equilibrate with the external ambient air pressure. Normal orextreme wind loading on the building will result in regions where theexternal stagnation pressure is up to 1 psi less than the internal pressurecreating a driving potential for exhaust from the facility. A design basisearthquake (DBE) event could cause structural damage and ventilationsystem failure, thereby reducing the building's resistance to unfilteredexhaust. Estimating the exhaust rate from the SNML after a DBE eventrequires that the air permeability of the concrete walls, which have beenloaded to their seismic-design limit, be quantified.
Because of its porous nature, concrete is known to be permeable toboth liquids and gases. The objective of this study was to measure the airpermeability of a reinforced concrete shear wall both before and after thewall had been loaded to its seismic-design limit. An experiment to satisfythis objective was developed by constructing a single-prototype shear walltest structure, simulating seismic loading by static load cycling thestructure to its maximum-design shear stress, and performing airpermeability tests on the structure both before and after loading. A shearwall structure was selected for initial study because this structuralelement forms a significant portion of the confining barrier and providesthe dominant lateral load-carrying capability in the SNML facility. Thisreport details the procedures used and results obtained during the course ofthe experiment.

II. LITERATURE REVIEW
To obtain concrete with a consistency that allows it to be easilyplaced in forms and around rebar, more water than is necessary for thehydration of the cement is added to the mix. As the cement cures, excesswater is trapped below the aggregate and between the cement particles.Most of these water voids are eliminated during the hydration of thecement. Initially, the hydration process produces a gel that forces most ofthe free water out of the mixture, but some water voids always remain. Asthe curing process continues, the gel solidifies and decreases in volumeresulting in the formation of additional voids. Mixing of the concreteentraps air and further adds to the voids that are present. The water andair voids are typically interconnected causing the concrete to be permeable.Other leak paths will exist if the concrete cracks because of externallyapplied loads or because of adverse curing conditions. The use of air-entraining admixtures, typically specified for all structural concrete,should not affect the permeability of the concrete because the voidsproduced by these admixtures are not interconnected.
The flow rate of air through concrete depends upon the airpermeability, the thickness of the concrete, and the pressure gradientapplied. The air permeability coefficient is dependent upon the concretemix parameters, mixing and compaction methods, curing conditions, and age.Typically, factors that improve the compressive strength of the concretewill decrease its permeability. Permeability increases with increasingwater/cement (w/c) ratio. Curing reduces air permeability, but dryingsignificantly increases permeability at any age. Although a specificconcrete may be permeable to air, it may be impermeable to some othergases. Cracks and joints provide additional paths for air leakage. Airleakage rate through cracks is a function of the number of cracks, spacing,width, and penetration depth into the concrete. When cracks do notcompletely penetrate the concrete, the flow rate can be computed byassuming that the leakage is the air that flows through the uncrackedconcrete thickness.
The flow rate appears to be inversely proportional to the slabthickness and directly proportional to the pressure difference across theslab. Tests with pressure gradients up to 1.1 psi on concrete with

thicknesses varying from 4 in. to 9 in. give leakage rates in cubic inches persquare foot per hour equal to approximately 2.5 times the ratio of pressure(psi) to thickness (in.).1 These flow rates correspond to an air permeabilitycoefficient through undamaged concrete of 4.6 x 10*6 in4/lb-s. This valuefor the permeability coefficient is typical for concrete with 4000-psicompressive strength at 28 days made with 3/4-in. maximum sizeaggregate, 500 Ib cement per cubic yard, and a w/c ratio of 0.50.
A literature review covering the past 25 years examined publishedworks on air permeability measurements in concrete. Most of the worksreviewed dealt with gas flow and permeability measurements in undamagedconcrete. In 1973, Figg2 published a method for the in situ determination ofthe air permeability of concrete. The concept is based on (a) drilling a holeinto the surface of the concrete, (b) sealing the top of the hole with asilicon rubber plug, (c) inserting a hypodermic needle through the plug, (d)drawing a vacuum in the hole, and (e) correlating any pressure increase inthe hole with the air permeability in the concrete surrounding the hole.Despite being limited to a maximum of 1 bar in pressure differential,researchers found this method useful. Cather et al.3 and Kasai et al.4
modified the method for increased practicality. The 14.5-psi pressurelimitation was overcome by Hansen et al.5 who developed an apparatus thatapplies low air pressure to the surface and monitors the pressure increaseover time in a hole drilled to a known depth under the pressurizingapparatus. All in situ procedures reviewed made air permeabilitymeasurements within 2 in. from the surface.
Several in situ and laboratory experiments were aimed at correlatingair permeability with concrete characteristics. Kasai and coworkers6-7
used their version of the in situ vacuum test apparatus to determine arelationship between air permeability and concrete carbonation. Inaddition, they determined that the air permeabilities of concrete with w/cratios of 45% and 55% have about 1/4 the air permeability of concrete witha 65% w/c ratio. Laboratory experiments on concrete specimens of variousdimensions were also used to characterize air permeability. Nagataki andUjike8 investigated the behavior of airflow through concrete containing flyash and condensed silica. They found that the air tightness of concrete isimproved with the addition of fly ash and silica fume because of theseconstituents' effect on porosity. Martialay9 investigated the change in air
permeability of concrete slabs over a 20-year period and found that itstabilized in that period. Schonlin and Hilsdorf10 confirmed the behavior ofair permeability, which has been summarized previously, relative to curing,w/c ratio, and fly ash content. Laboratory tests to measure the intrinsicpermeability of concrete were developed by Dhir et al.11 As a result of thiswork, the air permeability test was found to provide a direct measure ofthe intrinsic permeability of concrete and results from the air test could beused to characterize hydraulic permeability.
A few research articles on airflow through penetrations and linermaterials were also examined. The influence of air leakage throughconcrete is slight when compared with air leakage through constructionjoints. Tests were performed by Nojiri and Fujii12 to investigate the airtightness of concrete with and without construction joints. Minimizing theair leakage through construction joints and penetrations was identified as acontrolling efficiency factor if concrete was used for evaporator shells.The gas permeability characteristics of organic polymeric materials,suitable for use as liners in concrete containment structures, were studiedexperimentally by Epstein and coworkers.13 The permeation of air, nitrogen,oxygen, krypton, and xenon was measured in polyvinyl chloride andchlorosulphonated polyethylene. This study concluded that, by using plasticliners, fission gas leak rates can be expected in the range of a fewhundredths of a percent of the total contained volume per day.
The only study found in the literature dealing with airflowmeasurements in cracked reinforced concrete was published by Mayrhoferet al.14 This study was aimed at determining the gas impermeability ofshelter roof slabs loaded to their maximum carrying capacity with uniformpressure. The out-of-plane pressure load causes the slabs to bend. Gasimpermeability for the slabs was defined by the ability to maintain aminimum overpressure of 0.5 to 1.0 mb. Square slabs with lengthdimensions of 45 in. and 118 in., 0.14% and 0.3% reinforcement by area, anda thickness of 7 in. were used in the experiments. The slabs were pressureloaded statically in monotonically increasing load steps. Airflow wasmeasured upon completely unloading the structure after each load step.Data presented included static load-deformation curves, crack patterns, andairflow-overpressure curves. A mathematical expression to correlate slab

deflection with gas permeability was described in detail. A correlationbetween deformation and permeability was possible because the loading andresulting crack patterns in all slabs were similar.
In summary, the literature review indicated that the SNML study coulduse only the data published on gas permeabilities in undamaged concrete.These data were used to verify the accuracy of the air permeabilitymeasurements made on the test structure used in this investigation beforeapplying any load. The experimental data reviewed, describing airpermeability in cracked concrete, are not directly applicable because thestructure tested was an out-of-plane, pressure-loaded slab. The initialSNML structure studied was a shear wall loaded in plane to its seismic-design shear stress limit.
III. CONCRETE AIR PERMEABILITY, CAP-1, MODEL CONSTRUCTION
A reinforced concrete, shear wall test structure (CAP-1) wasfabricated to support experiments to measure the air permeability inconcrete after seismic loading. The CAP-1 test structure contains a 6-in.-thick shear wall that is a 3/7-scale model of an upper-level exterior wallfor the proposed SNML facility.
The following construction information was supplied by the SNMLProject Architect/Engineer, Fluor Daniel, and is representative of the TitleI design. This information was incorporated into the design of the CAP-1test structure.
1. The concrete-design ultimate compressive strength is 4000 psi.
2. The minimum yield strength of the reinforcement is 60 000 psi(ASTM A615, Grade 60).
3. Typical wall reinforcement ratios, based on gross wall area, are0.0113 vertical and 0.0037 horizontal.

4. The design concrete mix will incorporate conventional hardrockaggregate (approx. 1 in. maximum size), portland cement, and sand.Water-reducing agents will probably be used to achieve low-slump,low-w/c ratio and 4000-psi strength.
Figure 1 shows the dimensions of the CAP-1 model. Two layers ofreinforcement (ASTM A615 Grade 60, No. 3 rebar, 0.375-in. diam) wereplaced throughout the model. Vertical layers were spaced at 3-in. centersproviding a 1.15% wall reinforcement ratio by area. Horizontal layers werespaced at 6-in. centers providing a 0.41% wall reinforcement ratio by area.Hook development lengths and minimum bend radii for the reinforcementwere specified to meet the requirements of ACI 318-83 (Ref. 15) sections12.5 and 7.5, respectively. A minimum of 1.0 in. of cover was provided forall reinforcement.
The structure was formed with Plexiglas so that the surfaces couldbe visually monitored during the concrete placement and compaction.Aluminum spacer rods were used to maintain proper clearances between therebar and the forms during the concrete placement. Six conduits (0.825-in.i.d.), extending completely through the top of the model from end wall toend wall, were placed in the top slab. The conduits accommodated 0.75-in.threaded rods that were used to attach bearing plates during static loading.Twenty 0.5-in. threaded rods were located every 6 in. along the center ofthe concrete face bordering each open end of the test structure. These rodswere used to attach the aluminum cover plates as shown in Fig. 2. Twenty1.25-in. bolts were placed through sleeves in the base to restrain thestructure during the static load cycling. Figure 1 shows the bolt pattern onone side of the shear wall. Figure 3 shows the forms and reinforcementbefore placement of the concrete.
The concrete for CAP-1 was placed on July 31, 1990. CAP-1 wasplaced from 2 cubic yards of concrete from a commercial source thatarrived at 12:45 p.m. The concrete mix was specified to have 4000-psinominal ultimate compressive strength, a 4.0-in. slump, and a 0.75-in.maximum aggregate size. Table I summarizes the mix portions. The slumpwas measured per ASTM C143 (Ref. 16) and was found to be 3.5 in. The w/cratio of the concrete was 0.35. Concrete was placed in the base of
CD
DIMENSIONS (in.)S T R U C T U R E a b o d e f g h
M O D E L 1 48 36 6 6 24 36 3 6 1
REBAR MAX AGGREGATEdiam SIZE
0.375 0.75
Fig. 1. CAP-1 test structure detail.

Fig. 2. CAP-1 test structure with cover plates attached.
the structure first and was compacted with mechanical vibrators. Next, thewalls were placed and compacted with mechanical vibrators as thealuminum spacer bars were removed. CAP-1 was completely placed by 1:30p.m. No defects were noticed on the surface of the structure after thecompaction was complete. The structure was left in its form for a 28-daycuring period, and exposed surfaces were kept moist and covered with atarp.

Fig. 3. CAP-1 test structure forms and rebar before concrete placement.

During the placement of the structure, fifteen standard 6-in.-diam by12-in.-high test cylinders were taken per ASTM C172 (Ref. 17) and ASTMC31 (Ref. 18). The test cylinders were left in their molds and cured withthe structure for 28 days. Tests on the cylinders included ultimatecompressive strength (ASTM C39),19 modulus of elasticity (ASTM C469),20
and split-cylinder tensile strength (ASTM C496).21 The cylinders weretested on October 2, 1990, by Western Technologies in Albuquerque. Fromthe group of fifteen cylinders, ten were tested for ultimate strength andmodulus and five were tested for split-cylinder tensile strength. Theresults of the concrete tests are summarized in Table II, and the reportfrom the testing lab is included as Appendix A.
TABLE ICONCRETE MIX CONSTITUENT PORTIONS
ConstituentSand
Coarse aggregateCementWater
Weiaht (Ib)303034201232434
TABLE IIMEASURED CONCRETE PROPERTIES
AverageMinimumMaximum
UltimateCompressive
Strength (psrt608657206670
TensileStrength
(psi)516440600
Modulusof Elasticity
(psi)4.62 x 1064.11 x 1064.87 x 106
11

IV. AIR PERMEABILITY TESTING
Air permeability measurements were made on the shear wall beforeexposing the test structure to static load cycling. The air permeability wasdetermined by pressurizing one side of the test structure slightly aboveatmospheric levels and recording the transient-pressure decay associatedwith the air leakage through the shear wall.
To accommodate structure pressurization, an aluminum cover plate(40 x 52 x 3/4 in.) was attached to the structure as shown in Fig. 2. Thecover plates provided resistance and sealing support for internalpressurization. Square (0.275-in.) BUNA-N O-ring cord stock and Abeazonvacuum sealant were used to form a seal between the concrete face and thecover plate. In later permeability tests, flooring contact cement was alsoused to ensure an airtight seal between the O-ring material and theconcrete face. The interior surfaces of the side walls and the top andbottom slabs on the side of the shear wall to be pressurized were spraypainted with three coats of epoxy paint to ensure impermeability. Internalpressurization of the test structure did not exceed 0.7 psig. Thepressurized volume, 7.5 cu ft, was filled with dry bottled air and purgedwith a vacuum pump three times before filling for test. Pressure levelswere monitored with a Paroscientific digiquartz pressure transducer havinga range of 0 to 30 psia and a resolution of 0.0001 psia. Afterpressurization, transient internal pressure, atmospheric pressure, andinternal temperature were monitored with a Hewlett Packard 3497A datascanner. Figure 4 shows the permeability test setup.
In these experiments the permeability coefficient that wasdetermined is referred to in the literature as the intrinsic permeability.The intrinsic permeability is dependent only on the internal structure of theconcrete and is independent of the properties of the migrating fluid. Airpermeability tests best characterize the intrinsic permeability of concrete.For the direct measurement of the permeability of concrete in accordancewith Darcy's law, conditions of steady-state flow should exist. Theintrinsic permeability can be expressed by the following relation:
Q/A = - k/n(dp/dl) , (1)
12

CO
Fig. 4. Permeability test setup.
where Q is the volume rate of flow, A is the cross-sectional areaperpendicular to the flow direction, k is the intrinsic permeability, \i is thedynamic viscosity, and dp/dl is the pressure gradient in the direction offlow. For a compressible gas, the volume flow rate varies with change ofpressure according to the relationship
PmQm = constant = PQ , (2)
where
Pm = (Pt+ Pt+At)/2 ,
Ptand Pt+At correspond to readings in the pressurized volume at times t andt+At, respectively, and Qm is the flow rate at the mean pressure, Pm. Uponsubstituting the relationship for Q shown in Eq. (2) into Eq. (1) and notingthat the outlet pressure will be atmospheric, the direct integration of Eq.(1) can be performed over the wall thickness and corresponding inlet andoutlet pressures to obtain
k = 2^LPmQm/A(Pm2-PATM2) t ( 3 )
where PATM is the atmospheric pressure and L is the length of the concretein the flow direction. The volume flow rate passing through the shear wallcan be expressed as
Q = Am/pAt , (4)
where p is the density and Am is the incremental change in the mass duringthe time increment At. Assuming that the airflow behaves in accordancewith the ideal gas law, the incremental mass can be expressed as
Am = V(Pt/Tt - Pt+At/Tt+At)/R , (5)
where R is the ideal gas constant, V is the volume that is pressurized, and Tcorresponds to absolute temperature. Substituting Eq. (5) into Eq. (4) andnoting that pm = Pm/RTm yields
14

Qm = TmV(P,/T t- P,+At/T,+At)/PmAt . (6)
Substituting Eq. (6) into Eq. (3), the permeability coefficient in the shearwall is calculated with the expression
k = 2nLVTm(P,/T t- Pt+At/Tt+At)/AAt(Pm2- PATM2) • (7)
The following values and units were used in Eq. (7):
k =
H =L =
V =
A =
t =P =
T =
[ in2 ] ,[ I b - s / f t 2 ] ,
0.5 ft,7.5 ft.3,
6.0 ft2,
[s],[psi], andRl.
Transient pressure and temperature data were recorded over a periodof seven days. These data are shown in Fig. 5. The volume was initiallypressurized to approximately 12 psia. After three days of data collection,the volume was again repressurized. The actual data used to compute k,using Eq. (7), were the specific values recorded at midnight on each day.This was done to average out the wide variation in temperature because theexperiment was located outside. Table III lists the recorded pressures andtemperatures along with the computed air permeabilities.
In the above calculations for permeability, the dynamic viscosity ofair was assumed to vary with temperature according to the relation
\n= (5.672 x 10⁻⁵T + 0.0338) x 10~5 Ib-s/ft2 ,
where T is in degrees F.
15

Pt
(psi)11.946711.913411.830611.956711.687511.6071
TABLE IIICONCRETE SHEAR WALL PERMEABILITY
T,
519.5522.5523.5521.1516.2516.3
11
11
11
Pt+At
(psi)1.84511.80741.71511.80271.60431.5066
Tt+At
IB)522.5523.5523.1516.1516.3518.2
1
1
11
11
PATM
(psi)1.30321.31941.28441.35861.23841.2298
k
(x10~13 in2^0.4140.4510.5210.6370.4040.918
12.6
2 12.4QL
• 12.2
CK12
a: 118a.LJ 11.6
J 114 -OV)GO 1 1 9 i
11
BLOCK PRESSURE TEMP CORRECTED
BLOCK PRESSURE
AMBIENT PRESSURE
12 13 14 15 16 17 18 19 20 21DAY OF MONTH
Fig. 5. Transient-pressure data for uncoated concrete shear wallpermeability test.
16

After the first series of permeability tests were performed on theshear wall structure, the concrete was coated with a decontaminablecoating system. The special coating system was applied in four distinctlayers: (1) an epoxy clear sealer, (2) a chemical-resistant patchingcompound, (3) a strike flush coat of surfacing enamel, and (4) a spray-applied body coat of surfacing enamel. The primary purpose of the coatingsystem is to permit the efficient decontamination of concrete walls andceilings. In this experiment, the coating system was applied to measure itsaffect on concrete permeability.
After the coating system was allowed to cure, transient pressure andtemperature data were recorded over a period of three days. The data areillustrated graphically in Fig. 6. Twenty-four-hour data used to computethe concrete permeability are listed in Table IV. The coating
12.8
< 12.6</)°" 12.4
•>LLJOC 12.2
O 11.4 -(/)CD< 11.2 -
11
BLOCK .PRESSURE TEMP CORRECTED
BLOCK PRESSURE
AMBIENT PRESSURE
8 9DAY OF MONTH
10 11
Fig. 6. Transient-pressure data for coated concrete shear wallpermeability test.
17

TABLE IVCOATED CONCRETE SHEAR WALL PERMEABILITY
Pt
(pg»)111111
.9943
.8509
.7584
T,
(B)491.491.491.
7
7
8
1
11
Pt+At
(PS')1.77891.70331.6323
Tt+At
im491.8491.8491.8
1
11
PATM
(pgi)1.48081.47601.4443
k(x 10-13
111
.27
.18
.22
in2)
system had no impact on the measured concrete permeability because, asevident when comparing Tables III and IV, the permeability increased. Theincrease in permeability was most likely caused by the additional sevenweeks of concrete drying time because drying significantly increases thepermeability.1-11
V. COMPARISON OF PERMEABILITY DATA WITH PUBLISHED RESULTS
In this section, the measurement of air permeability in concrete byothers will be summarized. The experiments described were all performedin laboratory settings on small concrete samples.
Measurements of the intrinsic permeability of concrete wereperformed by Dhir et al.11 using an air permeability test. Pressure cellswere designed to test 100-mm- and 50-mm-diameter by 50-mm-thick testspecimens that were subjected to an externally maintained constant airpressure at one end and atmospheric pressure at the other end while thecircumferential surface was sealed. The air supply to the cell was dried toless than 0.1% RH. Before testing, specimens were conditioned using 105°Coven drying. After conditioning, the test specimen was placed in thepressure cell and an inlet pressure of 0.34 MPa was applied. When themeasured inlet and outlet flow rates equilibrated, the steady-state flowrate and inlet pressure were recorded. Permeability data were presentedfor various specimen-curing and w/c ratios. Table V summarizes the datapublished for concrete specimens cured for 28 days in air at 20°C with 55%RH.
18

1111
5588
22
0.40.470.40.550.40.30.56
TABLE VCOMPARISON OF PUBLISHED CONCRETE PERMEABILITIES
Reference w/c Compressive Strength k(psi) (x 10-13in2)
9425 2.4
7975 4.0
12500 0.08
3770 0.66
0.4-1.0
0.6
6815 0.13-5.3
Hansen et al.5 described a method, theory, and portable apparatus forestimating the gas permeability of concrete in situ. The test applies lowair pressure to the surface of the concrete and monitors the pressureincrease, over time, for a given depth, as a measure of the air permeability.Three sets of 200-mm cubes were prepared for three different w/c ratios,1.00, 0.55, and 0.40. A specially designed drill jig is used to cut a hole to apredetermined depth below the surface. A pressure head is attached on theconcrete surface directly above the end of the drilled hole. Pressuresensors are used to detect pressure changes in the concrete below thepressure head. Pressures around 150 kPa are applied to the surface and therate of pressure increase in the hole, over time, is recorded. The airpermeability is obtained by comparing the pressure-time curvesexperimentally measured to solutions of the 1-D conservation of massequation incorporating Darcy's law. Air permeabilities that weredetermined, using this procedure, are contained in Table V.
Nagataki and Ujike confirmed that the flow of air through concreteobeyed Darcy's law.8 Concrete prisms 150 mm by 150 mm and 530 mm inlength were cast for various w/c ratios. After water curing for 28 days,the specimens were conditioned in air at 20°C and 60% RH until tested.Test specimens were cut to 120 mm in length, and the four sides parallel tothe airflow direction were coated with epoxy resin. The specimens wereset in a pressure vessel, and one side was subjected to pressures in therange 0.2 to 0.6 MPa. The quantity of airflow through the concrete was
19

measured after the flow reached steady state. The air permeability of theconcrete specimens was found to increase with the increase of w/c ratioand the length of drying period. Air permeabilities reported in thispublication are listed in Table V.
Huovinen22 measured the volume flow rate of air through cylindricalconcrete specimens 150 mm in diameter and 60 to 100 mm in thickness.The specimens were also tested in steel pressure cells. The space betweenthe specimen and steel cell was made airtight by filling the void withbitumen. Compressed air was applied to one side of the specimen withpressures in the range 1 bar to 5 bar. The measured range of steady-stateair permeabilities reported in this research is also listed in Table V.
The Handbook of Concrete Engineering^ infers that an air permeabilityof 0.12 x 10~13 in2 is typical for concrete with 4000-psi compressivestrength and a w/c ratio of 0.5. As can be seen in Table V, the permeabilityof air in concrete varies by more than an order of magnitude above thisvalue even among well-controlled experiments in the laboratory. The "asconstructed" air permeabilities measured in this experiment (1.2 x 10~13
in2) are well within the range of published values. In addition, themeasurements taken during this experiment were not obtained fromlaboratory specimens but from an actual shear wall structure that wascured in the field.
VI. STATIC LOAD-CYCLE TEST SETUP
The model was constructed in place on the load frame base that wasto be used in the cyclic testing. The load frame base consisted of two 90 x120 x 6 in. steel plates bolted together with 1.25-in. steel bolts. The teststructure was attached to the load frame with twenty 1.25-in. bolts and 3.5x 4 x 0.25 in. washers as shown in Fig. 1. The bolts were torqued to 250 ft-Ib.
The steel load frame was assembled adjacent the test structure. Alayout of the major load frame components is shown in Fig. 7. Aninstrumentation frame was located on the exterior side of the modelopposite the load frame. Two Ono-Sokki EG-233 displacement transducers
20

• I T 1 S I 9 I «
s QO Q 6 Q|
if.
r i o o o o
Fig. 7. Static load frame component layout.

were placed against the model 3 in. from the top and bottom of the teststructure and centered in the midplane of the shear wall. Thesetransducers were used to measure overall structural deformation. AnENERPAC hydraulic actuator was used to load the structure, and force inputwas monitored with a Transducers Model T42 load cell located between theactuator and the steel load-distribution yoke. At specified loadincrements, the displacement transducers and load cell were scanned witha Hewlett Packard 3497A data scanner and the results were recorded by aHewlett Packard 87 computer. Figure 8 shows the static test setup.
The structure was loaded for 3 cycles each to nominal base shearstress (NBSS) levels of ±60 psi, ±130 psi, and ±190 psi. In this context,NBSS is defined as the applied force divided by the cross-sectional area ofthe shear wall (288 in2). During each cycle, readings from the load cell anddisplacement transducers were made at increments of 1/5 the peak load.The actual load history is shown in Fig. 9. Each integer on the horizontalaxis in Fig. 9 represents a point at which the data were scanned. Load-displacement plots were prepared for each cycle of loading. The completeload reversals shown in the load history were applied to represent the forceinduced in a structure during seismic excitation. These quasi-static loadcycles simulate an earthquake by applying the positive and negative shearforces associated with a DBE to the structure. This ioading procedure wasrecommended for use by the Technical Review Group evaluating the UnitedStates Nuclear Regulatory Commission sponsored Seismic Category I (SCI)Structures Program at Los Alamos.23'25
VII. SEISMIC LOAD SIMULATION AND ACCOMPANYING AIRFLOW
The overall horizontal deformation versus load curves wereconstructed from the displacement transducer and load cell measurementsand are shown in Figs. 10-12. The displacements represent a totaldisplacement for the top measurement location relative to the bottommeasurement location. Only the third load cycle for each set of 60-, 130-,and 190-psi NBSS are shown. The structure showed linear response throughall of the load cycles. This indicated that the structure experienced nointernal damage when loaded up to the maximum nominal-design shear
22

SCO
toBo
CO
00
d>
23

10-
TOXUJ 0 -CJDC
ou_QLU - 5 -Z3 •a.a.
-10-
kA A AA A A
\ \/\ \\l V V \V V V I\Yi
i
i . . . . . . . .
A A H /I •A A 1\ \ \ \ \\ \ \ \ \ i -/ \ / \ / i / i /
/ \ / \ / / i /\/ v / /V Y / /V v 11 '! I U
-
3b
0 -
-6-5
50 150100
LOAD STEPFig. 9. CAP-1 load step vs load history.
200
CYCLE 3K = 12.2 X 10⁶ LB/IN
TOTAL DISPLACEMENT X 103 (IN)Fig. 10. CAP-1 60-psi NBSS load vs displacement, cycle 3.
24

CO
b
-6
Fig . 1 1 .
6
CYCLE 3K = 11.9 X 10⁶ LB/IN
-5
TOTAL DISPLACEMENT X 1O3 (IN)CAP-1 130-psi NBSS load vs displacement, cycle 3.
3to
o-8cc2S
-6
CYCLE 3K = 12.0 X 10⁶ LB/IN
-5
TOTAL DISPLACEMENT X 103 (IN)Fig. 12. CAP-1 190-psi NBSS load vs displacement, cycle 3.
25

stress of 190 psi. Stiffnesses calculated using the load-displacement dataare within 7% of the structural stiffness determined from a 3-D finiteelement analysis (FEA) of the test structure. The variation is mostprobably caused by the fact that the base boundary condition in the FEAassumes an ideal fixed condition, whereas the base of the test structure isbolted to the load frame. The test cylinder data only provide an estimate ofthe actual concrete material properties. The test cylinder data were usedin the FEA, and the actual properties of the structure could be differentfrom those obtained from these data.
Because the structure experienced no internal damage, the concreteair permeability was also not affected. This is evidenced by the three daysof pressure data contained in Table VI. The air permeabilities computedwith these data are in agreement with the preload data listed in Table IV.
Next, the structure was subjected to one 285-psi NBSS load cycle.The SNML Project Architect/Engineer, Fluor Daniel, requested that the teststructure be loaded to an NBSS level 50% above the seismic-design level of190 psi. Figure 13 shows the load-displacement curve constructed fromthe data taken during the single high-level load cycle. The structurecracked on the first load increment above the 190-psi NBSS level.Confirmation that cracking occurred is evident from the change in slope ofthe load-displacement curve in the positive direction. The load-displacement curve also indicated cracking through stiffness reductionduring loading in the negative direction of the cycle. Actual shear wall
TABLE VICONCRETE PERMEABILITY AFTER
LINEAR SEISMIC LOAD-CYCLING RESPONSE
Pt Tt Pt+At Tt+At PATM k(psi) (R) (psi) (R) (psi)
11.9866 491.8 11.7505 491.7 11.3664 1.14
11.7060 491.6 11.5848 491.7 11.3612 1.05
11.4631 491.7 11.3920 491.7 11.2880 1.26
26
TOTAL DISPLACEMENT X 1O3 (IN)
Fig. 13. CAP-1 285-psi NBSS failure load vs displacement cycle.
crack patterns are shown in Figs. 14 and 15. Most of the shear cracksidentified penetrated completely through the wall. The positive andnegative direction cracking loads of 60 670 Ib (211-psi NBSS) and 62 760Ib (218-psi NBSS), respectively, were determined by computing the load atthe intersection of the load-displacement curves corresponding to theuncracked and cracked structural response. Based on a comparison withdata taken during the SCI Program tests,23"25 this test structure waspredicted to crack at 230-psi NBSS when its average measured tensilestrength of 516 psi was considered.
27

Fig. 14. CAP-1 crack pattern on front (coated) side of shear wall.

Fig. 15. CAP-1 crack pattern on back side of shear wall.

Airflow measurements were made after the test structure was
damaged. The cracking had a significant effect on the leakage of air
through the shear wall. Both transient and steady-state airflow data were
taken. A typical transient-pressure decay plot is illustrated in Fig. 16. For
this test, the volume was charged to 12.0 psi with dry air. Table VII gives
a summary of the pertinent information used to compute the average
permeability for the transient test data shown in Fig. 16. Even though the
presence of the cracks affects the theory behind Eq. (7), the average value
of pseudo air permeability corresponding to the data is 5.5 x 10~12 in 2 .
Helium leak tests were performed to insure that the aluminum cover
plate seals and fittings were not leaking. The leak-testing equipment
verified that significant leakage was occurring through the shear cracks in
the wal l .
COa.LLJer.COCOLUOC
KAVG = 5.5 X 10"12 IN2
111 2 3
TIME (H)Fig. 16. Typical transient-pressure decay plot after test structure damage.
30

TABLE VIITRANSIENT PERMEABILITY DATA FOR CRACKED CONCRETE SHEAR WALL
TimeihX0.00.51.0
1.52.0
PVOL
(psi)
12.07411.80711.57411.51211.317
1
111
1
PATM
(psi)1.1121.1051.1121.1141.110
Pm(pS\)
-
11.9411.6911.5411.41
AP(psi)
-
0.2680.2330.0620.195
On(ft3/h)
-
0.340.300.080.26
k(x10-12 in2l
-
3.54.4
1.67.2
2.5 11.180 11.111 11.25 0.137 0.18 11.1
A flowmeter was attached to the air-charging orifice on thealuminum cover plate. While approximately maintaining a constantpressure in the volume (see Fig. 17), the airflow through the shear wall wasmonitored for 168 hours. The steady airflow through the shear wall was0.4 ft3/h. Table VIII gives a summary of the pertinent information used tocompute the average permeability for the steady test data shown in Fig. 17.The pseudo air permeability corresponding to the steady flow rate andaverage pressure gradient is 4.7 x 10~12 in2.
VIII. SUMMARY AND DISCUSSION
The objective of this study was to measure the air permeability in areinforced concrete shear wall, both before and after seismic simulationloading. To accomplish this objective, a 6-in. shear wall test structure wasfabricated with standard concrete mix and rebar materials. Four-thousand-psi compressive strength concrete and typical wall reinforcement ratioscalled out in the SNML Title I design were used in the construction of thisstructure. The concrete was placed, cured, and tested outside in anenvironment similar to that which an actual building will experience. Thew/c ratio of the concrete was 0.35. Strength tests performed on testsamples yielded an average compressive strength of 6086 psi and anaverage tensile strength of 516 psi.
31

COQ-
Ld
12.8
12.6
12.4
12.2
% 12UJ
a. 11.8
11.6
O 11.4 -COm< 11.2 -
11
BLOCK PRESSURE TEMP CORRECTED
BLOCK PRESSURE
AMBIENT PRESSURE
23 24 25 26 27 28 29DAY OF MONTH
30 31 32
Fig. 17. Pressure variation over eight days during steady airflow test.
TABLE VIIISTEADY PERMEABILITY DATA FOR CRACKED CONCRETE SHEAR WALL
Time(day)
1.02.03.04.05.06.07.08.0
11111111
PATM
(psi)
1.35551.33551.39641.30711.29301.21621.29621.4700
PVOL
(P?i)12.243512.134412.076611.938611.846211.846212.168112.1453
TVOL
(Bi513.3520.5522.9526.2521.9524.0514.9522.5
k(x10-12 in2)
3.84.24.95.35.35.33.94.9
32

Air permeability measurements were made on the shear wall beforestatic load cycling. One side of the test structure was pressurized with dryair to approximately 0.7 psig above atmospheric conditions. This pressurecorresponds to the maximum pressure differential caused by wind that wascalculated for the SNML facility. The transient-pressure decay wasmonitored, and the intrinsic permeability was computed in accordance withDarcy's law. An air permeability of 1.2 x 10~13 in2 was measured for thisshear wall. A decontaminable coating system was also applied to the shearwall, but it did not have an impact on the measured permeability.
The air permeability measured before loading was compared toconcrete permeability data published in the literature. Even forexperiments performed on small laboratory specimens that wereconstructed and tested under very controlled conditions, published airpermeabilities were found to vary by more than an order of magnitude.However, the results from the shear wall tests agreed best with theintrinsic permeability measurements performed by Dhir et al.11 From theDhir measurements, the air permeability of 0.47 w/c ratio concrete was 4.0x 10"13 in2 and the air permeability of 0.40 w/c ratio concrete was 2.4 x10⁻¹³ in2. These two results show good agreement with the shear wallpermeability measurements of 1.2 x 10~13 in2. As previously stated, theshear wall had a 0.35 w/c ratio concrete. Because permeability increaseswith increasing w/c ratio, the permeability results obtained in thisinvestigation are consistent with those reported by Dhir.
Static load-cycle testing was used to simulate earthquake loading.The SNML Title 1 design showed that the actual structure would experiencea peak NBSS of 190 psi during a DBE. The test structure was subjected tothis same peak stress level during the static load cycling. Linear load-displacement response was observed when the structure was loaded to themaximum stress level. This response indicated that the shear wall was notdamaged internally. Because the shear wall experienced no internaldamage, the air permeability was not affected.
A single high-level load-cycle test resulted in damage (shearcracking) to the structure. The cracking was determined to have occurredat approximately 215-psi NBSS. Airflow measurements, taken after thestructural damage had occurred, showed that the cracking had a significanteffect on air leakage through the shear wall. The steady airflow through
33

the shear wail was measured to be 0.4 ft3/h. Even though the presence ofthe cracks affects the porous media assumptions used in the intrinsicpermeability calculations, a pseudo air permeability was computed for thecracked concrete wall. The pseudo permeability corresponding to thesteady flow rate and average pressure gradient measured was 4.7 x 10~12
in2. Thus, air permeability in the shear wall increased by a factor of 40after the wall experienced shear cracking.
The results from this experiment can be used to estimate the airleakage through the exterior walls of the SNML facility in the event ofventilation system failure. A base-line leakage can be calculated byassuming that all of the exterior walls are undamaged. A maximum leakagecan be calculated by using the measured air permeability associated withshear damage. Air leakage from the facility will only occur in wall areasexposed to a negative pressure gradient (i.e., internal air pressure exceedsthe external air pressure). The maximum negative pressure gradient causedby wind loading on SNML, Bldg. 55-179 (see Appendix B) is -51.6 psf. The
method used to compute the pressure loads caused by atmospheric winds wasin accordance with standard Department of Energy (DOE) design practices.The negative pressure impacts only the side and leeward walls of astructure. Therefore, the total SNML wall area affected by the negativepressure gradient is approximately 22 800 ft2. Assuming 14-in.-thick walls,the base-line and maximum volume flow rates are 0.14 cfm and 5.4 cfm,respectively. Because air leakage is directly proportional to permeabilityand pressure gradient, a reduction in either of these variables will reducethe leakage rate.
A prototype experiment was successfully designed and performed tomeasure the air permeability in a reinforced concrete shear wall bothbefore and after seismic simulation loading. Air permeabilitymeasurements made on the "as constructed" shear wall were in goodagreement with concrete permeability values published in the literature.The shear wall deformation remained linear (i.e., no damage) when loaded upto the maximum-design shear stress level. As long as the structureexhibited linear load-displacement response, no variation in the value of airpermeability was detected. At approximately 13% above the maximum-design shear stress, the shear wall cracked. It should be noted that, for agiven load history, the onset of cracking is controlled by the concrete's
34

tensile strength. The compressive ultimate strength for the concrete usedin this test structure was considerably higher than the Title I minimumdesign value and, hence, the tensile strength was also higher than might beexpected for the actual structure. If the tensile strength of the actualSNML facility concrete was less, the structure might crack during the DBE.The air permeability in the shear wall increased by a factor of 40 as aresult of the cracking.
IX. RECOMMENDATIONS FOR FUTURE WORK
Further work needs to be done in order to adequately consider severalissues arising from this study. The primary concerns are presented belowin statements recommending future experimental activities.
1. Testing should be done on the shear wall test structure to assess thepaniculate filtering effectiveness of the cracked shear wall. Thistesting can be performed by substituting an aerosol (dioctylsebacate,DOS) for the dry air. For a base-line, the aerosol should also be used inpermeability experiments before loading the structure.
2. The experiment described in this report was concerned with only thatpart of the structure loaded in shear. An out-of-plane bending testshould also be performed. The bending stresses and shear stresses arethe two significant stresses that would cause the concrete to crack and,hence, allow air leakage through the walls. The bending test shouldsimulate the loading on the building wall by subjecting the test wall to amoment that will produce bending stresses in the wall. A test structurefor the bending test could be similar to the shear wall test structurewith the shear wall removed.
3. Because concrete is a statistical material and no two batches areidentical, more experiments using the same test structure configurationand testing procedures should be performed. Four to six tests of both theshear and bending configurations should provide enough data to quantifythe range of values that can be expected.
35

4. Shear wall test structures should be fabricated with a shear wallthickness larger than 6 in. Air permeability testing on these structureswould be useful to address the issue of thickness scaling on bothpermeability and crack leakage measurements.
5. Test structures can easily be modified to study the effects ofpenetrations and construction joints on air leakage rates after seismicsimulation loading.
6. The potential to retrofit critical facilities with impermeable liners canbe addressed by installing candidate liner materials on structures thathave been damaged and by performing air permeability experiments tomeasure liner effectiveness.
The results from the above recommended activities can be used in astudy of existing facilities' confinement capabilities. First, any structureutilizing concrete walls for confinement barriers can be analyzed tocalculate the stress levels that will result during the DBE and to determineif these levels are sufficient to cause cracking of the walls. Second, ifseismic-induced cracking is credible, airflow calculations can be performedusing the measured permeabilities for damaged structures to determine ifincreased leakage rates are a concern.
The test that was performed in this study showed that theeffectiveness of using a concrete structure as a confinement barrier can bequantified. Even though/the SNML Project at Los Alamos has beenterminated, the results from this work are applicable to safety issueswherever concrete is used as a confinement barrier. Therefore, theinformation gained from performing the additional recommendedexperiments is directly applicable to addressing safety considerationsthroughout the DOE complex.
36

APPENDIX A
CONCRETE TEST CYLINDERS LAB REPORT
37

WESTERN•reaINCa
fiJOS Washington PI ve . NXAlbuquerque, New Mexico 87113(505)823-4488 • 821-2963 FAX
LABORATORY REPORT
Client Los Alamos National LaboratoryP.O. Box 1663, MS J576Los Alamos, NM 87545Attent ion: Mr. Lee Dalton
Project
Location
Concrete Permeabil i ty ExperimentL o s Alamos, New Mexico
Material/Specimen Concrete
Source Tes t Box Unit
Test Procedure ASTM
//2-LF0-Q2131-1 Job No
Lab./Invoice No
Date of Repopt-—•>
Reviewed By Z&<
32400995
11-5-90
Sampled By Client
Submitted By B i l 1 Whaley/WT
Authorized By Cl ient
D a t e " "
D a t e 9-20-90
D a t e 9-20-90
RESULTS
SPLITTING TENSILE STRENGTH OF
CYLINDRICAL CONCRETE SPECIMENS
TESTED ON 10-02-90
SPECIMEN
,vl
'•n
•v:3
i-4
v5
MAX. LOAD FORCE (lbs.)
49274
54650
67885
61386
58307
SPLITTING TENSILE STRENGTH ( p s i )
440
480
600
540
520
Copies to 3-Client
38
TECHNOLOGIES
me.
8.'O5 Washing or Place ML.Albuquerque, New Mexico 87113(505) 823-4488 • 821-2963 FAX LABORATORY REPORT
Client Los Alamos National LaboratoryP.O. Box 1663, MS J576Los Alamos, NM 87545At ten t ion : Mr. Lee Dalton
Proect Concrete Permeabil i ty Experiment
//2-LFO-Q2131-1
Location Alamos > New Mexico
Material/Specimen Concrete
Source Test Box Unit
Test Procedure... A S ™ C 3 9 " 8 6 > C469-87a
.Sampled By .
Submitted By.
Authorized By
Job No. - ...
Lab./lnvoiceNo.
Date of Rep
Reviewed
Client
Bill Whaley/WT
Client
32400995
Date.-
Date.
Date
9-20-90
9-20-90
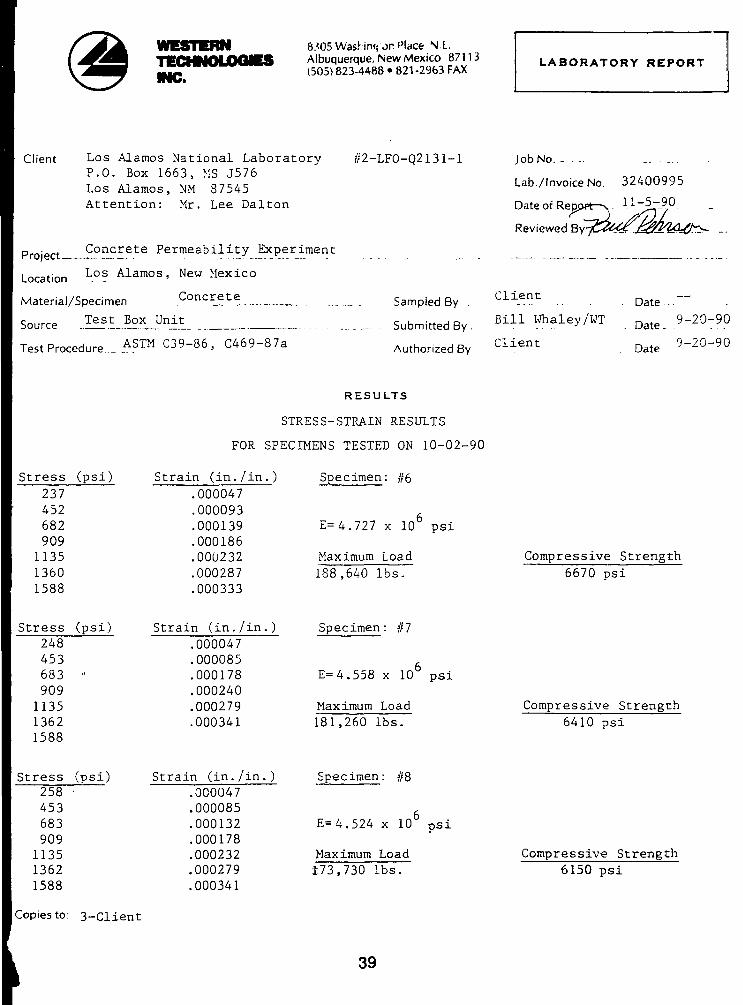
RESULTS
STRESS-STRAIN RESULTS
FOR SPECIMENS TESTED ON 10-02-90
Stress Cpsi;237452682909113513601588
Stress (psi)248453683 •'909113513621588
Stress (psi)258453683909113513621588
Strain (m./in.).000047.000093.000139.000186.000232.000287.000333
Strain (in./in.).000047.000085.000178.000240.000279.000341
Strain (in./in.).000047.000085.000132.000178.000232.000279.000341
Specimen: #6
E=4.727 x 10 psi
Maximum Load
1S8.640 lbs.
Specimen: #7
E= 4.558 x 10 psi
Maximum Load181,260 lbs.
Specimen: #8
E=4.524 x 10 psi
Maximum Load173,730 lbs.
Compressive Strength6670 psi
Compressive Strength6410 psi
Compressive Strength6150 psi
Copies to: 3-Client
39

TECHNOLOQICS8305 ^/ashingtor. Pl.-e, N.!!.Albuquerque, New Mexico 87113(505) 823-4488 • 821-2963 FAX L A B O R A T O R Y REPORT
Client Los Alamos Nat ional LaboratoryP.O. Box 1663, MS J576Los Alamos, NM 87545A t t e n t i o n : Mr. Lee Dalton
p r o i e c t Concrete Permeabi l i ty Experiment
Location Los_Alamos , New Mexico
Material/Specimen . _
//2-LFO-Q2131-1
Source Test Box Unit
Test Procedure ASTMC39-86, C469-87a
Sampled By
_. . Submitted By
Authorized By
Job No.
Lab./Invoice No. 32400995
Date of Re°«rr—x 11-5-90
Reviewed By
Client
Bill Whaley/WT
Client
. Date
Date-9"?0."5
Date 9-20-9'!
RESULTS
STRESS-STRAIN RESULTS
FOR SPECIMENS TESTED ON 10-02-90
Stress (psi)244452683909113513621588
Stress (psi)269452682909113513621588
Stress (psi)
269453682909113513621588
Copies to: 3-Client
Strain (in./in.).000047,000093.000139.000186.000232.000287.000341
Strain (in./in.).000047.000085,999132.000170.000217.000271.000318
Strain (in./in . )
.0000^7
.000085
.000124
.000170
.000217
.000263
.000318
Specimen: #9
E=4.571 x 10 psi
Maximum Load
168,820 lbs.
Specimen: #10
r
E=4.867 x 10 psi
Maximum Load161,910 lbs.
Specimen: #11
f.E=4.867 x 10 psi
Maximum Load175,500 lbs.
Compressive Strength
5970 psi
Compressive Strength5730 psi
Compressive Strength
6210 psi
40

WESTERNTECING»
8305 .Vaiihington Pla .e, N.FAlbuquerque, New Mexico 87113(505) 823-4488 • 821 -2963 FAX
LABORATORY REPORT
Client
Project
Location
Los Alamos National LaboratoryP.O. Box 1663, MS J576Los Alamos, NM 87545Attention: Mr. Lee Dalton
Concrete Permeability Experiment
Los Alamos, New Mexico
//2-LFO-Q2131-1
Material/Specimen
Test Box Unit
Concrete
Source
Test Procedure ASTM C39-86, C469-87a
Job No.
Lab/Invoice No
Date of Repoj
Reviewed By
Sampled By
Submitted By
Authorized By
Client
Bill Whaley/WT
Client
Date
Date
Date
—
9-20-9C
9-20-9C
RESULTS
STRESS-STRAIN RESULTS
FOR SPECIMENS TESTED ON 10-02-90
Stress (psi)
251453682909113513621588
Stress (psi)
248453682909113513621588
Stress (psi)
233453682909113513621588
Copies to: 3-ciient
Straxn (in./in.)
.000047
.000085
.000139
.000178
.000232
.000279
.000333
Strain (in./in.)
.000047
.000085
.000139
.000178
.000225
.000271
.000325
Strain (in./in.).000047.000093.000147.000194.000248.000294.000349
Specimen: ,712
E=4.674 x 10 psi
Maximum Load165,310 lbs.
Specimen: #13
E=4.815 x 10 psi
Maximum Load163,710 lbs.
Specimen: #14
f.E=i.494 x 10 psi
Maximum Load179,930 lbs.
Compressive Strength5850 psi
Compressive Strength5790 psi
Compressive Strength6360 psi
I 41

-nECHNOLOQKSINC.
8305 Washington Place, N.E.Albuquerque, New Mexico 67113(505) 823-4488 • 821-2963 FAX
LABORATORY REPORT
Client Los Alamos National LaboratoryP.O. Box 1663, MS J576Los Lamos, NM 87545Attention: Mr. Lee Dalton
Proiect Concrete Permeability Experiment
Location _ Los_Ala.I?os_>__New M e x i c o
Material/Specimen Concrete
Source T e s t B o x Un i t
Test Procedure A S ™ C39-86, C469-87a
#2-LFO-Q2131-l
Sampled By
Submitted By
Authorized By
Job No.
Lab./Invoice No.
Date of Report—^
Reviewed By/^£2
Client
32400995
11-5-90
Date
Bill Whaley/WT D a t e 9-20-90
Client D a t e 9-20-90
RESULTS
STRESS-SRAIN RESULTS
FOR SPECIMENS TESTED ON 10-02-90
Stress (Dsi)251453682909113513621588
Strain (in./in.).000047.000093.000147.000194.000248.000294.000349
Specimen: #15
E=4.110 x 10 psi
Maximum Load161,700 lbs.
Compressive Strength5720 psi
Copies to: 3-Client
42

APPENDIX B
NEGATIVE WIND PRESSURE CALCULATION
SNML, BLDG 55-179
43

B.1 SCOPE
The following text describes the ANSI A58.126 approach forcalculating the negative pressure gradient caused by wind loading on SNML,Bldg 55-179.
B.2 BACKGROUND
Wind flow around a structure causes varying pressures on the wallsurfaces and roof. The dynamic pressure on the windward surfaces isgreater than the dynamic pressure on the sides, leeward, and roof areas.This phenomenon results in a positive pressure acting toward the structureon the windward side and a negative pressure, or suction force, acting onthe other areas. Pressure inside the structure is not affected by the windwhen the structure is sealed. The negative pressure on the sides, leeward,and roof areas results in a positive pressure gradient between the insideand outside of the structure, creating a potential for air leakage throughthe structure to the outside.
The Bernoulli equation mathematically describes the change inpressure caused by wind on a structure. The equation basically states that,in a streamline, pressure decreases as velocity increases. As air flowstowards a structure along a streamline, the building forces the flow toalter its path and go around the structure. This change in flow pathincreases the distance that the air must travel and forces an increase invelocity. As a result, the corners of the roof and walls experience thegreatest change in velocity and, hence, the lowest pressures.
B.3 STRATEGY
The analytical procedures described in ANSI A58.1 and demonstratedin the Wind Load Provisions (WLP) Guide27 for components and cladding areused to calculate the pressure loads caused by atmospheric winds.
44

The components and cladding approach allows one to determine themaximum wind load conditions. The governing equation for calculating thedesign pressure, p, is
p = qh(GCp) - qh(GCpi) (Ref. 26, Table 4, h<60 ft) ,
whereqh = velocity pressure (psf) at the mean roof height, h (ft),qh = 0.00256Kh(IV)2 (Ref. 27, Eq. 2-4),
Kh = velocity pressure coefficient at height h(Ref. 26, Table 6),
I = importance factor(Ref. 26, Table 5),
V = basic wind speed (mph)(Ref. 28, Table 5-3),
GCp= gust response factor times the external pressure coefficient(Ref. 26, Fig. 3), and
GCpj= gust response factor times the internal pressure coefficient(Ref. 26, Table 9).
The overall analytical procedure involves (1) selecting an exposurecategory, (2) determining V, the basic wind speed, (3) calculating qh the
velocity pressure, and (4) calculating p, the design wind pressure.
B.4 CALCULATION SUMMARY
All elevation/siting views (N, S, E, W) were considered in determiningthe worst case negative pressure gradient. The southern exposure wasfound to give the largest negative value and is detailed below.
(1) Exposure C. Required by ANSI A58.1 when using components andcladding approach for structures less than 60 ft.
45

(2) Per UCRL-15910, the Los Alamos National Laboratory has a highhazard wind speed of 107 mph. This wind speed has a 0.0001annual probability of exceedance.
(3)
(4)
hI
Kh
PhaAGCpGCpi
P
= 52 ft,= 1.07,= 1.14, and
= 0.00256(1.14)[(1.07)(107)]2 = 38
= 0.4h - 20.8 ft,= 20.8(52) = 1081.6 ft2,
= - 1 . 1 ,= 0.25, and
= 38.25(-1.1) - 38.25(0.25) = -51.6
.25 psf.
psf.
B.5 CONCLUSION
The worst case negative pressure gradient caused by wind loading on
the SNML facility, Bldg 55-179 is -51.6 psf. This value was determined by
considering normal wind incidence on all four siting exposures.
46

REFERENCES
1. Handbook of Concrete Engineering, M. Fintel, Ed. (Van NostrandReinhold, New York), 1974, pp.176-177.
2. J. W. Figg, "Method of Measuring the Air Permeability of Concrete,"Magazine of Concrete Research 25 (85), 213-218 (1973).
3. R. Cather et al., "Improvements to the Figg Method for Determining theAir Permeability of Concrete," Magazine of Concrete Research 36(129), 241-245 (1984).
4. Y. Kasai, I. Matsui, and M. Nagano, "On Site Rapid Air Permeability Testfor Concrete," in In Situ/Nondestructive Testing of Concrete V. M.Malhotra, Ed., SP-82 (American Concrete Institute, Detroit, Michigan,1984), pp. 525-541.
5. A. J. Hansen, N.S. Ottosen, and C. G. Petersen, "Gas-Permeability ofConcrete In Situ: Theory and Practice," in In Situ/NondestructiveTesting of Concrete V. M. Malhotra, Ed., SP-82 (American ConcreteInstitute, Detroit, Michigan, 1984), pp. 543-556.
6. Y. Kasai, I. Matsui, and M. Nagano, "Relationship Between Carbonationand Air Permeability of Concrete," Transactions of the Japan ConcreteInstitute6, 171-178 (1984).
7. Y. Kasai, I. Matsui, and T. Aoki, "Long Term Changes of AirPermeability by Rapid Test," Transactions of the Japan ConcreteInstitute 8, 145-152 (1986).
8. S. Nagataki and I. Ujike, "Air Permeability of Concretes Mixed with FlyAsh and Condensed Silica Fume," in Fly Ash, Silica Fume, Slag, andNatural Pozzolans in Concrete V. M. Malhotra, Ed., SP-91 (AmericanConcrete Institute, Detroit, Michigan, 1986), pp. 1049-1068.
9. R. Martialay, "Concrete Air Permeability-Age Effects on Concrete," inConcrete Durability, Vol. 1 SP-100 (American Concrete Institute,Detroit, Michigan, 1987), pp. 335-350.
10. K. Schonlin and H. K. Hilsdorf, "Permeability as a Measure of PotentialDurability of Concrete-Development of a Suitable Test Apparatus," inPermeability of Concrete SP-108 (American Concrete Institute,Detroit, Michigan, 1988), pp. 99-115.
47

11. R. K. Dhir, P. C. Hewlett, and Y. N. Chan, "Near Surface Characteristicsof Concrete: Intrinsic Permeability," Magazine of Concrete Research41 (147), 87-97 (1989).
12. Y. Nojiri and K. Fujii, "Utilization of Cement Concrete as an EvaporatorShell Material," Desalination 19, 45-54 (1976).
13. L. F. Epstein, T. C. Hall Jr., and S. E. Mills, "Preliminary Gas PermeationMeasurements on Plastics for Use as Concrete Containment VesselLiners," Nuclear Engineering and Design 8, 345-359 (1968).
14. Chr. Mayrhofer, W. Korner, and W. Brugger, "Gas Impermeability ofReinforced Concrete Slabs Supported on Four Sides. Part 2," ForeignTechnology Division Wright-Patterson AFB report FTD-ID(RS) T-0085-88 (May 1988).
15. American Concrete Institute Committee 318, Building CodeRequirements for Reinforced Concrete (American Concrete Institute,Detroit, Michigan, 1983).
16. "Standard Test Method for Slump of Portland Cement Concrete,"Annual Book of ASTM Standards, Roberta A. Prieman-Storer, Ed.(American Society for Testing and Materials, Philadelphia,Pennsylvania, 1985), Vol. 4.02, C143-78, pp. 109-112.
17. "Method of Sampling Freshly Mixed Concrete," Annual Book of ASTMStandards, Roberta A. Prieman-Storer, Ed. (American Society forTesting and Materials, Philadelphia, Pennsylvania, 1985), Vol. 4.02,C172-82, pp. 133-135.
18. "Standard Method of Making and Curing Concrete Specimen in theField," Annual Book of ASTM Standards, Roberta A. Prieman-Storer, Ed.(American Society for Testing and Materials, Philadelphia,Pennsylvania, 1985), Vol. 4.02, C31-84, pp. 5-10.
19. "Standard Test Method for Compressive Strength of CylindricalConcrete Specimen," Annual Book of ASTM Standards, Roberta A.Prieman-Storer, Ed. (American Society for Testing and Materials,Philadelphia, Pennsylvania, 1985), Vol. 4.02, C39-84, pp. 24-29.
48

20. "Standard Test Method for Static Modulus of Elasticity and Poisson'sRatio of Concrete in Compression," Annual Book of ASTM Standards,Roberta A. Prieman-Storer, Ed. (American Society for Testing andMaterials, Philadelphia, Pennsylvania, 1985), Vol. 4.02, C469-83, pp.303-307.
21. "Standard Test Method for Splitting Tensile Strength of CylindricalConcrete Specimens," Annual Book of ASTM Standards, Roberta A.Prieman-Storer, Ed. (American Society for Testing and Materials,Philadelphia, Pennsylvania, 1985), Vol. 4.02, C496-85, pp. 335-339.
22. P. Huovinen, "Air-Permeability of Concrete," Nordic Concrete Research1, 1-17 (December 1982).
23. C. R. Farrar, J. G. Bennett, W. E. Dunwoody, and W. E. Baker, "Static LoadCycle Testing of a Low-Aspect-Ratio Six-Inch Wall, TRG-TypeStructure TRG-4-6 (1.0, 0.25)," Los Alamos National Laboratory reportLA-11422-MS, NUREG/CR-5222 (June 1989).
24. C. R. Farrar, J. G. Bennett, W. E. Dunwoody, and W. E. Baker, "Static LoadCycle Testing of a Low-Aspect-Ratio Four-Inch Wall, TRG-TypeStructure TRG-5-4 (1.0, 0.56)," Los Alamos National Laboratory reportLA-11739-MS, NUREG/CR-5487 (November 1990).
25. C. R. Farrar, J. G. Bennett, W. E. Baker, and W. E. Dunwoody, "Static LoadCycle Testing of a Very Low-Aspect-Ratio Six-Inch Wall, TRG-TypeStructure TRG-6-6 (0.27, 0.50)," Los Alamos National Laboratoryreport LA-11796-MS, NUREG/CR-5533 (November 1990).
26. "Minimum Design Loads for Buildings and Other Structures," ANSIA58.1-1982 (American National Standards Institute, Inc., New York,1982).
27. "Guide to the Use of the Wind Load Provisions of ANSI A58.1," KishorC. Mehta, Ed. (Institute for Disaster Research, Texas Tech University,Lubbock, Texas, 1988).
28. R. P. Kennedy, et al., "Design and Evaluation Guidelines for Departmentof Energy Facilities Subjected to Natural Phenomena Hazards,"Lawrence Livermore National Laboratory report UCRL-15910 (June1990).
49