Embed Size (px)
Citation preview
2137Bulletin of the American Meteorological Society
major changes in the amplitude and frequency of warmand cold events on decadal timescales, but the realityand cause of this decadal aperiodicity are not clear(Cane et al. 1995). The decade-scale variance of ENSOmay reduce the accuracy of climate and crop yieldforecasts based in part on conditions in the equatorialPacific (Phillips et al. 1996) and has stimulated inter-
*Tree-Ring Laboratory, University of Arkansas, Fayetteville,Arkansas.+Tree-Ring Lab, Lamont-Doherty Earth Observatory, Palisades,New York.#Climate Impact Group, CSIRO Mordialloc, Victoria, Australia.@Geological Sciences/INSTAAR, University of Colorado, Boul-der, Colorado.&Department of Geology and Environmental Science, StanfordUniversity, Stanford, California.**Scripps Institute of Oceanography, LaJolla, California.
Experimental DendroclimaticReconstruction of theSouthern Oscillation
D. W. Stahle,* R. D. D’Arrigo,+ P. J. Krusic,+ M. K. Cleaveland,* E. R. Cook,+ R. J. Allan,#
J. E. Cole,@ R. B. Dunbar,& M. D. Therrell,* D. A. Gay,* M. D. Moore,**M. A. Stokes,++ B. T. Burns,## J. Villanueva-Diaz,@@ and L. G. Thompson&&
ABSTRACT
Exactly dated tree-ring chronologies from ENSO-sensitive regions in subtropical North America and Indonesia to-gether register the strongest ENSO signal yet detected in tree-ring data worldwide and have been used to reconstruct thewinter Southern Oscillation index (SOI) from 1706 to 1977. This reconstruction explains 53% of the variance in theinstrumental winter SOI during the boreal cool season (December–February) and was verified in the time, space, andfrequency domains by comparisons with independent instrumental SOI and sea surface temperature (SST) data. Thelarge-scale SST anomaly patterns associated with ENSO in the equatorial and North Pacific during the 1879–1977 cali-bration period are reproduced in detail by this reconstruction. Cross-spectral analyses indicate that the reconstructionreproduces over 70% of the instrumental winter SOI variance at periods between 3.5 and 5.6 yr, and over 88% in the4-yr frequency band. Oscillatory modes of variance identified with singular spectrum analysis at ~3.5, 4.0, and 5.8 yr inboth the instrumental and reconstructed series exhibit regimelike behavior over the 272-yr reconstruction. The tree-ringestimates also suggest a statistically significant increase in the interannual variability of winter SOI, more frequent coldevents, and a slightly stronger sea level pressure gradient across the equatorial Pacific from the mid–nineteenth to twen-tieth centuries. Some of the variability in this reconstruction must be associated with background climate influencesaffecting the ENSO teleconnection to subtropical North America and may not arise solely from equatorial ENSO forc-ing. However, there is some limited independent support for the nineteenth to twentieth century changes in tropical Pa-cific climate identified in this reconstruction and, if substantiated, it will have important implications to the low-frequencydynamics of ENSO.
++Laboratory of Tree-Ring Research, The University of Arizona,Tucson, Arizona.##Native Seed SEARCH, Tucson, Arizona.@@INIFAP, San Luis Potosi, Mexico.&& Byrd Polar Research Center, Ohio State University, Columbus,Ohio.Corresponding author address: David Stahle, Tree-Ring Labo-ratory, Ozark Hall 108A, University of Arkansas, Fayetteville, AR72701.E-mail: [email protected] final form 21 May 1998.
1. Introduction
Dramatic differences in the magnitude, persistence,and regional climatic impact of the El Niño–SouthernOscillation (ENSO) have been observed on annual anddecadal timescales during the twentieth century (Allanet al. 1996). Dynamic models of ENSO have simulated
2138 Vol. 79, No. 10, October 1998
est in the long-term behavior of the ENSO system. Theinstrumental meteorological and oceanographicrecords are not long enough to provide multiple real-izations of decadal variability associated with ENSO.However, a number of annually resolved proxies of cli-mate and oceanographic conditions have been discov-ered (e.g., Quinn et al. 1987; Thompson et al. 1984;Kennedy and Brassell 1992; Cole et al. 1993), andwhen found in climate regions influenced by ENSOthese annually resolved proxies may help define thenature of ENSO variability in centuries prior to instru-mental observations. Extended paleoclimatic estimatesof ENSO may also help discriminate between possiblecauses of decadal variability in ENSO (Enfield and Cid1991; Cane et al. 1995).
Ideally, exactly dated and climatically sensitiveproxies from the equatorial Pacific centers of actionof ENSO should be used to reconstruct the core char-acteristics of ENSO, and all remaining annual resolu-tion proxies could then be used to map the spatialanomaly patterns of tropical and extratropical climateassociated with each reconstructed warm and coldevent (e.g., Rasmusson et al. 1995). Unfortunately, thisideal approach is barely possible even for the twenti-eth century due to the poor spatial coverage of instru-mental data, particularly over the oceans, and iscertainly impossible with the currently available net-work of exactly dated annually resolved paleoclimateproxies.
The reconstruction of tropical ENSO variabilityand the associated extratropical climate impact is fur-ther complicated by the fact that climate proxies arenot uniformly accurate in recording their local climateor oceanographic environment. And the sometimesnarrow seasonal response of even the most climate-sensitive proxies may not perfectly coincide with theseasonality of the local ENSO teleconnection. In spiteof these limitations, we do have an excellent, mas-sively replicated array of climate and ENSO-sensitivetree-ring chronologies for subtropical North America,and a recently confirmed and expanded tree-ring chro-nology of teak (Tectona grandis) from Java, Indone-sia. These particular tree-ring data register thestrongest and most stable ENSO signal yet detectedin tree-ring chronologies worldwide. In this paper, weuse these new and improved tree-ring data to developa 272-yr reconstruction of the winter Southern Oscil-lation index (SOI) that reproduces the instrumentalwinter SOI variance with useful skill in the time,space, and frequency domains. We also discuss thestrengths and limitations of this experimental recon-
struction and consider how these paleo-ENSO esti-mates can be improved.
2. The Southern Oscillation index
A single comprehensive index of the Pacificbasinwide air–sea interaction known as ENSO doesnot exist, but a number of reasonable approximationshave been devised from the available meteorologicaland oceanographic measurements. The sea level pres-sure (SLP) records from Tahiti and Darwin, Austra-lia, have been widely used to index the atmosphericpressure gradient across the tropical Pacific basin (e.g.,Wright 1982; Jones 1988). A comprehensive reanaly-sis of the SLP data from Tahiti and Darwin has re-cently been completed, and a revised index of theSouthern Oscillation (SO) has been developed basedon the difference between SLP at Tahiti and Darwinfor each month from 1876 to 1996 [i.e., this is anonsmoothed version of the Troop SO index and isbased on anomalies from the normalized mean differ-ence series in standard deviation units (× 10); seeAllan et al. (1996)]. In this analysis we haveseasonalized three months December–February (DJF)of the Allan et al. (1996) data to construct a winter SOI(see appendix). This index targets the boreal (North-ern Hemisphere) cool season, when warm and coldevents typically mature in the equatorial Pacific, andrepresents the most reasonable seasonal window giventhe differing ENSO influence on the tree-ring dataused in this analysis.
3. The proxy data
Hundreds of long, climatically sensitive tree-ringchronologies are available worldwide, but most are notwell suited for ENSO reconstruction because they areconfined to extratropical regions not strongly influ-enced by ENSO or do not respond to climate duringthe season of strongest ENSO influence. Annual tree-ring chronologies are extremely rare in the Tropicsbecause the vast majority of tropical tree species donot produce anatomically distinctive annual growthrings in the absence of a pronounced winter dormantseason. At present, no long-lived tree species areknown to be useful for dendrochronology in Peru,Ecuador, or on the islands of the eastern or centralPacific. However, a very few tropical species withunequivocally annual growth rings have been identi-
2139Bulletin of the American Meteorological Society
fied in climates with dramatic seasonality in precipi-tation, and some may eventually prove as useful as theJavanese teak for paleoclimatic analyses of ENSO(e.g., Jacoby 1989; Buckley et al. 1995; Stahle et al.1997).
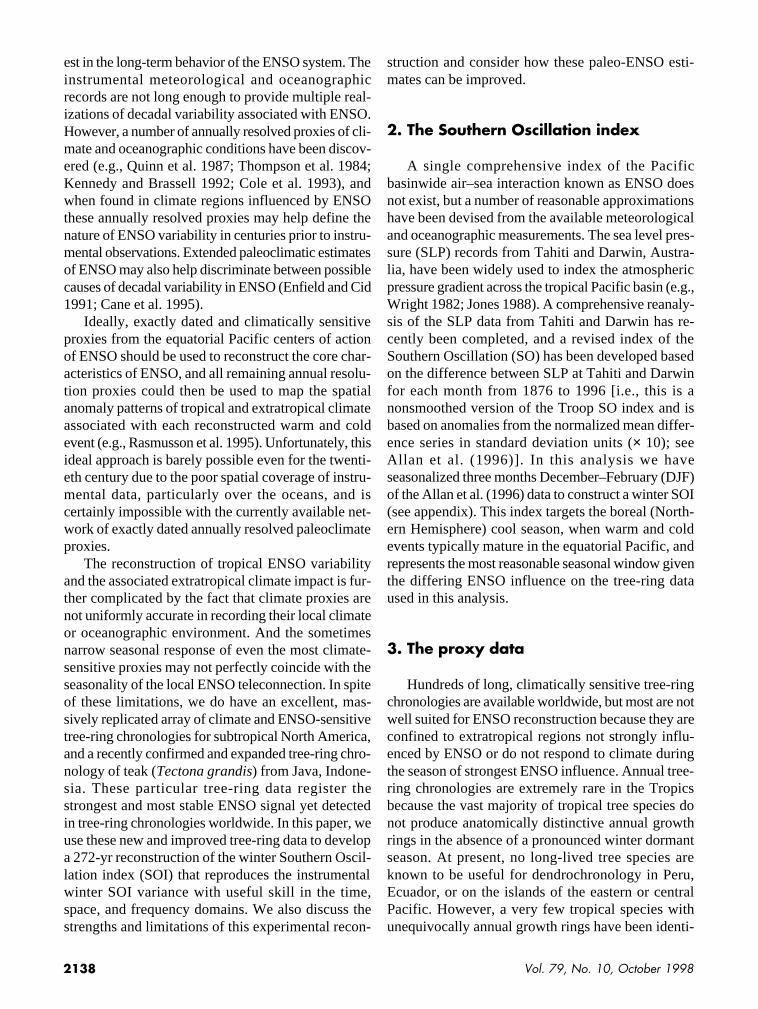
The development of the teak chronology from Java(Fig. 1) is perhaps the most notable success for tropi-cal dendrochronology thus far. Berlage (1931) was thefirst to develop a Javanese teak chronology, and hisnumerical chronology has been partially confirmed withnew teak specimens from Java (D’Arrigo et al. 1994).The Saradan stand includes many trees over 200 yr old,and the derived chronology is well replicated from1700 to 1995. The Saradan teak chronology is mod-estly correlated with the winter SOI for the period1879–1977, both concurrently (r = 0.19; P < 0.10)and following the SOI by two seasons (r = −0.35; P< 0.001).
The huge network of extratropical tree-ring chro-nologies includes many series from the subtropics ofMexico and the southern United States where cool-season climate is influenced by ENSO (Fig. 1). Manyof these excellent chronologies are significantly cor-related with the winter SOI even though the growingseason of the sample trees does not begin until springor early summer. This ENSO teleconnection to treegrowth exists because El Niño (La Niña) events dur-ing the boreal cool season tend to enhance (reduce)winter and early spring precipitation over subtropicalNorth America (Ropelewski and Halpert 1987, 1989;Allan et al. 1996). This precipitation teleconnectionhas a very strong preconditioning effect on subsequenttree growth through the recharge (depletion) of soil
moisture and may have a direct growth effect by en-hancing cool season photosynthesis during moistEl Niño years.
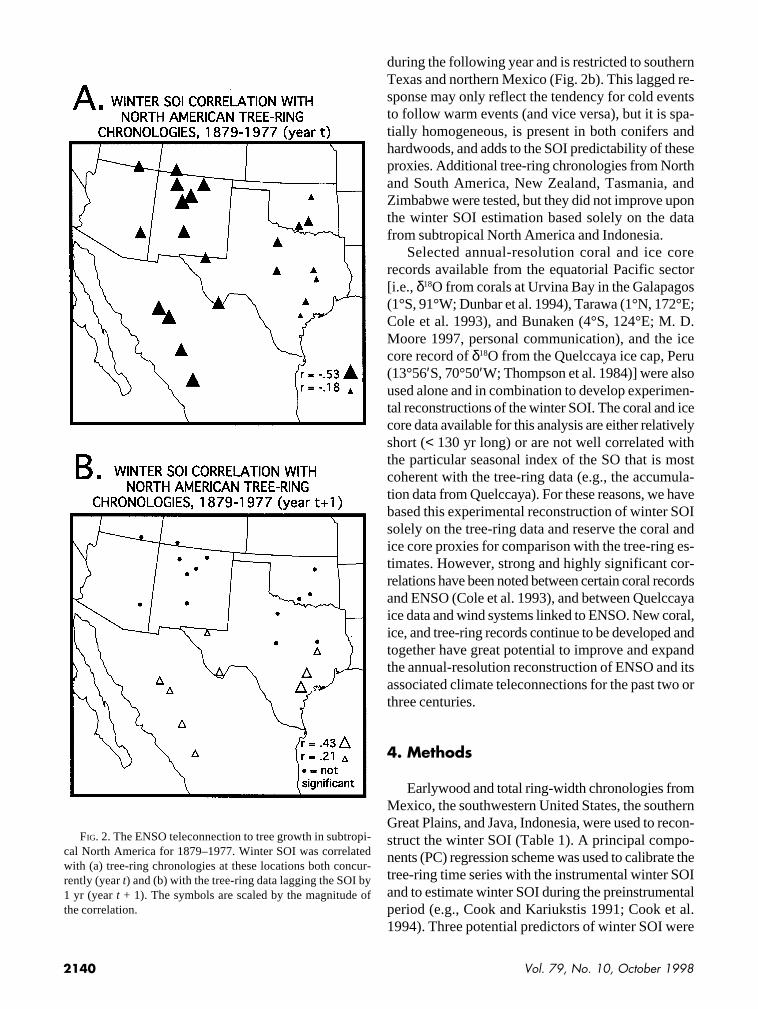
Tree-ring chronologies from subtropical NorthAmerica have previously been used to reconstructENSO indices (Lough and Fritts 1985; Michaelsen1989; D’Arrigo and Jacoby 1991, 1992; Stahle andCleaveland 1993) or SSTs in regions sensitive toENSO (e.g., Douglas 1980), but many new or updatedchronologies have been added for this study. In par-ticular, nine new earlywood-width chronologies ofDouglas fir (Pseudotsuga menziesii), ponderosa pine(Pinus ponderosa), and pinyon pine (P. edulis) fromDurango, Chihuahua, New Mexico, and southwesternColorado were added to maximize the cool-seasonclimate signal in tree growth. These earlywood- (orspringwood) width chronologies are strongly corre-lated with “winter” precipitation (October–March),which is precisely the season of strongest ENSO in-fluence on climate in this region. These nine early-wood chronologies, along with a few total ring-widthchronologies of both ponderosa and pinyon pine fromNew Mexico and Arizona, and a network of nine postoak (Quercus stellata) chronologies from Texas andOklahoma, exhibit the strongest simple correlationswith ENSO indices of any presently available tree-ringchronologies worldwide (Fig. 2a). The ENSOteleconnection to tree growth in this region is consis-tent with the cool-season climate teleconnection andsuggests that ENSO is an important forcing of inter-annual ecological rhythms in subtropical NorthAmerica (e.g., Swetnam and Betancourt 1990). Thetree growth correlation with winter SOI changes sign
FIG. 1. General locations of the tree-ring, coral, and ice varve proxies used for experimental reconstructions of the winter SOI(triangles, circles, and squares, respectively). Several chronologies are represented by the triangles in North America. Regions withprecipitation teleconnections to ENSO warm events are located (shading = wet anomalies; solid outline = dry anomalies; afterRopelewski and Halpert 1987, 1989; Allan et al. 1996).
2140 Vol. 79, No. 10, October 1998
during the following year and is restricted to southernTexas and northern Mexico (Fig. 2b). This lagged re-sponse may only reflect the tendency for cold eventsto follow warm events (and vice versa), but it is spa-tially homogeneous, is present in both conifers andhardwoods, and adds to the SOI predictability of theseproxies. Additional tree-ring chronologies from Northand South America, New Zealand, Tasmania, andZimbabwe were tested, but they did not improve uponthe winter SOI estimation based solely on the datafrom subtropical North America and Indonesia.
Selected annual-resolution coral and ice corerecords available from the equatorial Pacific sector[i.e., δ18O from corals at Urvina Bay in the Galapagos(1°S, 91°W; Dunbar et al. 1994), Tarawa (1°N, 172°E;Cole et al. 1993), and Bunaken (4°S, 124°E; M. D.Moore 1997, personal communication), and the icecore record of δ18O from the Quelccaya ice cap, Peru(13°56′S, 70°50′W; Thompson et al. 1984)] were alsoused alone and in combination to develop experimen-tal reconstructions of the winter SOI. The coral and icecore data available for this analysis are either relativelyshort (< 130 yr long) or are not well correlated withthe particular seasonal index of the SO that is mostcoherent with the tree-ring data (e.g., the accumula-tion data from Quelccaya). For these reasons, we havebased this experimental reconstruction of winter SOIsolely on the tree-ring data and reserve the coral andice core proxies for comparison with the tree-ring es-timates. However, strong and highly significant cor-relations have been noted between certain coral recordsand ENSO (Cole et al. 1993), and between Quelccayaice data and wind systems linked to ENSO. New coral,ice, and tree-ring records continue to be developed andtogether have great potential to improve and expandthe annual-resolution reconstruction of ENSO and itsassociated climate teleconnections for the past two orthree centuries.
4. Methods
Earlywood and total ring-width chronologies fromMexico, the southwestern United States, the southernGreat Plains, and Java, Indonesia, were used to recon-struct the winter SOI (Table 1). A principal compo-nents (PC) regression scheme was used to calibrate thetree-ring time series with the instrumental winter SOIand to estimate winter SOI during the preinstrumentalperiod (e.g., Cook and Kariukstis 1991; Cook et al.1994). Three potential predictors of winter SOI were
FIG. 2. The ENSO teleconnection to tree growth in subtropi-cal North America for 1879–1977. Winter SOI was correlatedwith (a) tree-ring chronologies at these locations both concur-rently (year t) and (b) with the tree-ring data lagging the SOI by1 yr (year t + 1). The symbols are scaled by the magnitude ofthe correlation.
2141Bulletin of the American Meteorological Society
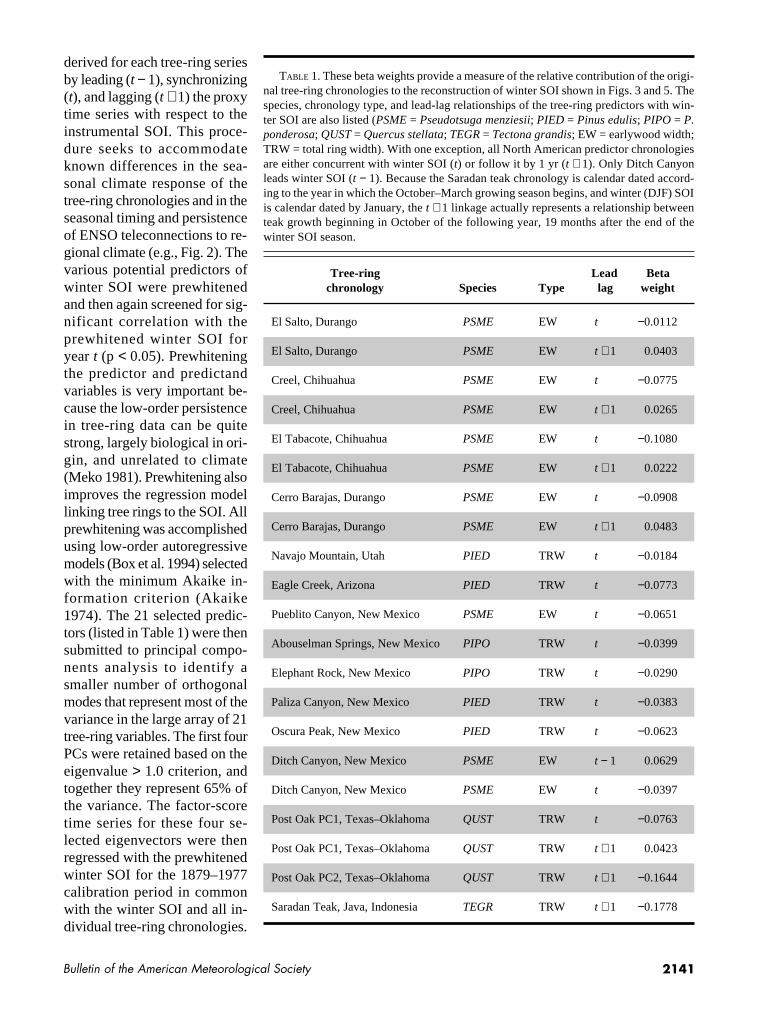
derived for each tree-ring seriesby leading (t − 1), synchronizing(t), and lagging (t + 1) the proxytime series with respect to theinstrumental SOI. This proce-dure seeks to accommodateknown differences in the sea-sonal climate response of thetree-ring chronologies and in theseasonal timing and persistenceof ENSO teleconnections to re-gional climate (e.g., Fig. 2). Thevarious potential predictors ofwinter SOI were prewhitenedand then again screened for sig-nificant correlation with theprewhitened winter SOI foryear t (p < 0.05). Prewhiteningthe predictor and predictandvariables is very important be-cause the low-order persistencein tree-ring data can be quitestrong, largely biological in ori-gin, and unrelated to climate(Meko 1981). Prewhitening alsoimproves the regression modellinking tree rings to the SOI. Allprewhitening was accomplishedusing low-order autoregressivemodels (Box et al. 1994) selectedwith the minimum Akaike in-formation criterion (Akaike1974). The 21 selected predic-tors (listed in Table 1) were thensubmitted to principal compo-nents analysis to identify asmaller number of orthogonalmodes that represent most of thevariance in the large array of 21tree-ring variables. The first fourPCs were retained based on theeigenvalue > 1.0 criterion, andtogether they represent 65% ofthe variance. The factor-scoretime series for these four se-lected eigenvectors were thenregressed with the prewhitenedwinter SOI for the 1879–1977calibration period in commonwith the winter SOI and all in-dividual tree-ring chronologies.
El Salto, Durango PSME EW t −0.0112
El Salto, Durango PSME EW t + 1 0.0403
Creel, Chihuahua PSME EW t −0.0775
Creel, Chihuahua PSME EW t + 1 0.0265
El Tabacote, Chihuahua PSME EW t −0.1080
El Tabacote, Chihuahua PSME EW t + 1 0.0222
Cerro Barajas, Durango PSME EW t −0.0908
Cerro Barajas, Durango PSME EW t + 1 0.0483
Navajo Mountain, Utah PIED TRW t −0.0184
Eagle Creek, Arizona PIED TRW t −0.0773
Pueblito Canyon, New Mexico PSME EW t −0.0651
Abouselman Springs, New Mexico PIPO TRW t −0.0399
Elephant Rock, New Mexico PIPO TRW t −0.0290
Paliza Canyon, New Mexico PIED TRW t −0.0383
Oscura Peak, New Mexico PIED TRW t −0.0623
Ditch Canyon, New Mexico PSME EW t − 1 0.0629
Ditch Canyon, New Mexico PSME EW t −0.0397
Post Oak PC1, Texas–Oklahoma QUST TRW t −0.0763
Post Oak PC1, Texas–Oklahoma QUST TRW t + 1 0.0423
Post Oak PC2, Texas–Oklahoma QUST TRW t + 1 −0.1644
Saradan Teak, Java, Indonesia TEGR TRW t + 1 −0.1778
TABLE 1. These beta weights provide a measure of the relative contribution of the origi-nal tree-ring chronologies to the reconstruction of winter SOI shown in Figs. 3 and 5. Thespecies, chronology type, and lead-lag relationships of the tree-ring predictors with win-ter SOI are also listed (PSME = Pseudotsuga menziesii; PIED = Pinus edulis; PIPO = P.ponderosa; QUST = Quercus stellata; TEGR = Tectona grandis; EW = earlywood width;TRW = total ring width). With one exception, all North American predictor chronologiesare either concurrent with winter SOI (t) or follow it by 1 yr (t + 1). Only Ditch Canyonleads winter SOI (t − 1). Because the Saradan teak chronology is calendar dated accord-ing to the year in which the October–March growing season begins, and winter (DJF) SOIis calendar dated by January, the t + 1 linkage actually represents a relationship betweenteak growth beginning in October of the following year, 19 months after the end of thewinter SOI season.
Tree-ring Lead Betachronology Species Type lag weight
2142 Vol. 79, No. 10, October 1998
The transfer function used to estimate winter SOIwas derived by solving the multiple regression equa-tion for each year from 1706 to 1977, with winter SOIdesignated as the dependent variable and the tree-ringeigenvector amplitude series as the “independent”variables. The autoregressive structure of the instru-mental winter SOI was then added to the white noisetime series of estimated winter SOI to complete thereconstructions [the instrumental winter SOI (1879–1977) was identified as an autoregressive (AR)-2 pro-cess representing 5.5% of the overall time seriesvariance, with t − 1 and t − 2 coefficients of −0.043and −0.233, respectively]. Adding in the AR-2 struc-ture of the instrumental winter SOI assumes that the ARstructure of the 1879–1977 period is representative ofearlier years, which may not be entirely true. However,the resulting reconstruction is much more coherentwith the instrumental SOI in the frequency domainthan would be the case if AR modeling were not usedin conjunction with the PC regression modeling.
A split period scheme was used to validate the tree-ring calibration against independent instrumental win-ter SO indices. The instrumental winter SO indiceswere split into two time series extending from 1879to 1928 and from 1929 to 1977. The tree-ring data werethen calibrated with PC regression (as above) againstthe instrumental SO indices during one subperiod, andthe derived estimates were then compared with actualwinter SOI during the alternate, statistically indepen-dent subperiod.
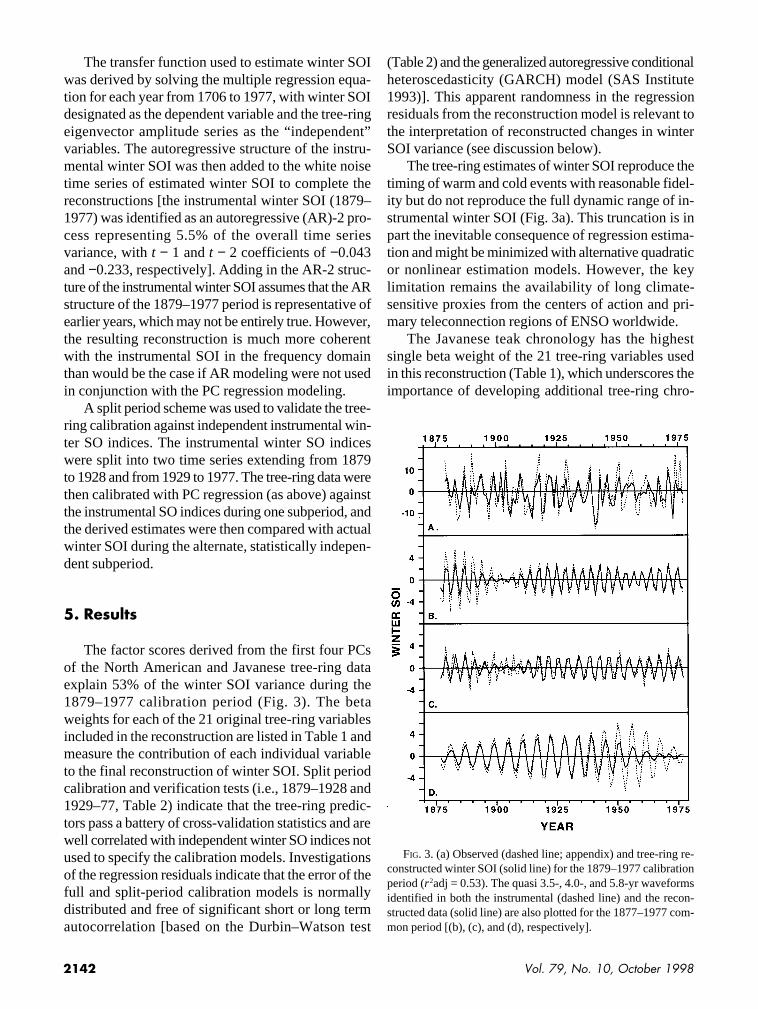
5. Results
The factor scores derived from the first four PCsof the North American and Javanese tree-ring dataexplain 53% of the winter SOI variance during the1879–1977 calibration period (Fig. 3). The betaweights for each of the 21 original tree-ring variablesincluded in the reconstruction are listed in Table 1 andmeasure the contribution of each individual variableto the final reconstruction of winter SOI. Split periodcalibration and verification tests (i.e., 1879–1928 and1929–77, Table 2) indicate that the tree-ring predic-tors pass a battery of cross-validation statistics and arewell correlated with independent winter SO indices notused to specify the calibration models. Investigationsof the regression residuals indicate that the error of thefull and split-period calibration models is normallydistributed and free of significant short or long termautocorrelation [based on the Durbin–Watson test
(Table 2) and the generalized autoregressive conditionalheteroscedasticity (GARCH) model (SAS Institute1993)]. This apparent randomness in the regressionresiduals from the reconstruction model is relevant tothe interpretation of reconstructed changes in winterSOI variance (see discussion below).
The tree-ring estimates of winter SOI reproduce thetiming of warm and cold events with reasonable fidel-ity but do not reproduce the full dynamic range of in-strumental winter SOI (Fig. 3a). This truncation is inpart the inevitable consequence of regression estima-tion and might be minimized with alternative quadraticor nonlinear estimation models. However, the keylimitation remains the availability of long climate-sensitive proxies from the centers of action and pri-mary teleconnection regions of ENSO worldwide.
The Javanese teak chronology has the highestsingle beta weight of the 21 tree-ring variables usedin this reconstruction (Table 1), which underscores theimportance of developing additional tree-ring chro-
FIG. 3. (a) Observed (dashed line; appendix) and tree-ring re-constructed winter SOI (solid line) for the 1879–1977 calibrationperiod (r 2adj = 0.53). The quasi 3.5-, 4.0-, and 5.8-yr waveformsidentified in both the instrumental (dashed line) and the recon-structed data (solid line) are also plotted for the 1877–1977 com-mon period [(b), (c), and (d), respectively].
2143Bulletin of the American Meteorological Society
nologies from the core region of ENSO. Surprisingly,however, experimental reconstructions of winter SOIusing the regional subsets of tree-ring data as predic-tors indicate that the chronologies from subtropicalNorth America are more strongly associated with win-ter SOI than the single teak chronology from Java,even though Java is under the western center of actionof the SO. The Java chronology alone explains 11%of the winter SOI variance from 1879 to 1977, but theregional tree-ring data from Texas and Oklahoma, thesouthwestern United States, and Mexico individuallyexplain 23%, 37%, and 36% of the winter SOI vari-ance, respectively. This may simply reflect differencesin the seasonal ENSO response of the Java series (theteak chronology is more highly correlated with June–December SOI) and the substantial replication of tree-ring proxies across subtropical North America.
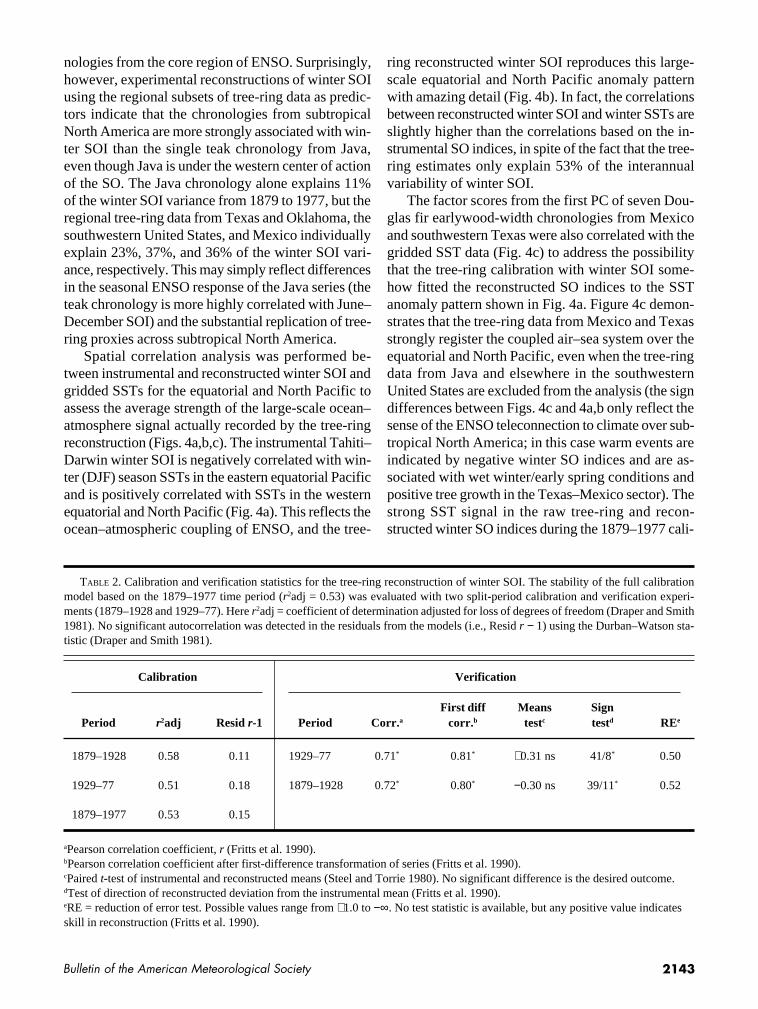
Spatial correlation analysis was performed be-tween instrumental and reconstructed winter SOI andgridded SSTs for the equatorial and North Pacific toassess the average strength of the large-scale ocean–atmosphere signal actually recorded by the tree-ringreconstruction (Figs. 4a,b,c). The instrumental Tahiti–Darwin winter SOI is negatively correlated with win-ter (DJF) season SSTs in the eastern equatorial Pacificand is positively correlated with SSTs in the westernequatorial and North Pacific (Fig. 4a). This reflects theocean–atmospheric coupling of ENSO, and the tree-
ring reconstructed winter SOI reproduces this large-scale equatorial and North Pacific anomaly patternwith amazing detail (Fig. 4b). In fact, the correlationsbetween reconstructed winter SOI and winter SSTs areslightly higher than the correlations based on the in-strumental SO indices, in spite of the fact that the tree-ring estimates only explain 53% of the interannualvariability of winter SOI.
The factor scores from the first PC of seven Dou-glas fir earlywood-width chronologies from Mexicoand southwestern Texas were also correlated with thegridded SST data (Fig. 4c) to address the possibilitythat the tree-ring calibration with winter SOI some-how fitted the reconstructed SO indices to the SSTanomaly pattern shown in Fig. 4a. Figure 4c demon-strates that the tree-ring data from Mexico and Texasstrongly register the coupled air–sea system over theequatorial and North Pacific, even when the tree-ringdata from Java and elsewhere in the southwesternUnited States are excluded from the analysis (the signdifferences between Figs. 4c and 4a,b only reflect thesense of the ENSO teleconnection to climate over sub-tropical North America; in this case warm events areindicated by negative winter SO indices and are as-sociated with wet winter/early spring conditions andpositive tree growth in the Texas–Mexico sector). Thestrong SST signal in the raw tree-ring and recon-structed winter SO indices during the 1879–1977 cali-
aPearson correlation coefficient, r (Fritts et al. 1990).bPearson correlation coefficient after first-difference transformation of series (Fritts et al. 1990).cPaired t-test of instrumental and reconstructed means (Steel and Torrie 1980). No significant difference is the desired outcome.dTest of direction of reconstructed deviation from the instrumental mean (Fritts et al. 1990).eRE = reduction of error test. Possible values range from +1.0 to −∞. No test statistic is available, but any positive value indicatesskill in reconstruction (Fritts et al. 1990).
1879–1928 0.58 0.11 1929–77 0.71* 0.81* +0.31 ns 41/8* 0.50
1929–77 0.51 0.18 1879–1928 0.72* 0.80* −0.30 ns 39/11* 0.52
1879–1977 0.53 0.15
TABLE 2. Calibration and verification statistics for the tree-ring reconstruction of winter SOI. The stability of the full calibrationmodel based on the 1879–1977 time period (r2adj = 0.53) was evaluated with two split-period calibration and verification experi-ments (1879–1928 and 1929–77). Here r2adj = coefficient of determination adjusted for loss of degrees of freedom (Draper and Smith1981). No significant autocorrelation was detected in the residuals from the models (i.e., Resid r − 1) using the Durban–Watson sta-tistic (Draper and Smith 1981).
Calibration Verification
First diff Means SignPeriod r2adj Resid r-1 Period Corr.a corr.b testc testd REe

2144 Vol. 79, No. 10, October 1998
bration period indicates that thegreat air–sea interactions ofENSO over the equatorial andNorth Pacific are a dominantmode in the interannual variabil-ity of tree growth across sub-tropical North America andIndonesia. These results alsosuggest that the tree-ring dataprovide a reasonable proxy ofthe ENSO teleconnection toNorth America, if not of the coreENSO phenomenon itself (thisuncertainty is examined in thediscussion below). We assume,and the cross-validation experi-ments leave little reason todoubt (Table 2), that the tree-ring data are reasonable proxiesof the winter SOI in the prein-strumental period as well.
Experimental calibrationsbetween winter SOI and annu-ally banded coral and ice coredata indicate that the coral datahave real potential to improve thetree-ring reconstruction of ENSO.The Tarawa and Bunaken dataalone explain 41% and 23% ofthe winter SOI variance, respec-tively (although during slightlydifferent calibration periods),even though winter (DJF) maynot be the ideal season for theENSO influence on these prox-ies. Nevertheless, calibrationmodels for both coral sites canbe verified against independentwinter SO indices.
The Urvina Bay coral seriesis strongly linked with the win-ter SOI in the recent portion ofthe instrumental period (i.e.,r 2adj = 0.41 for the 1929–77 pe-riod). However, the winter SOIlinkage disappears during theearlier subperiod (1879–1928),which might reflect dating un-certainties that may be im-proved with recently developedcoral data from the region. The
FIG. 4. Correlations between gridded SSTs (Kaplan et al. 1998) seasonalized to DJF andthe instrumental (a) and tree-ring reconstructed (b) winter SOI for 1879–1977. The SSTsare also correlated with the factor scores on the first PC of earlywood tree growth in Mexicoand southwestern Texas (c).
2145Bulletin of the American Meteorological Society
Quelccaya ice core alone could not be successfullycalibrated with the winter SOI, which again must notbe the ideal season because there is a strong link be-tween δ18O at Quelccaya and the easterly wind com-ponent at the 500-mb level, which is stronglymodulated by SSTs in the eastern equatorial Pacific(e.g., Michaelsen and Thompson 1992).
The highest winter SOI calibration and verificationstatistics in these multiproxy experiments were ob-tained using the tree-ring predictors from subtropicalNorth America and Java, along with coral predictorsfrom Tarawa and Bunaken (r2adj = 0.62 for 1894–1977). The Tarawa and Bunaken records are only 99and 131 yr long, respectively, at present, but these ex-periments leave no doubt that improved estimates ofpast ENSO variability will be possible if longer coralseries can be developed in the equatorial Pacific.
6. Analysis
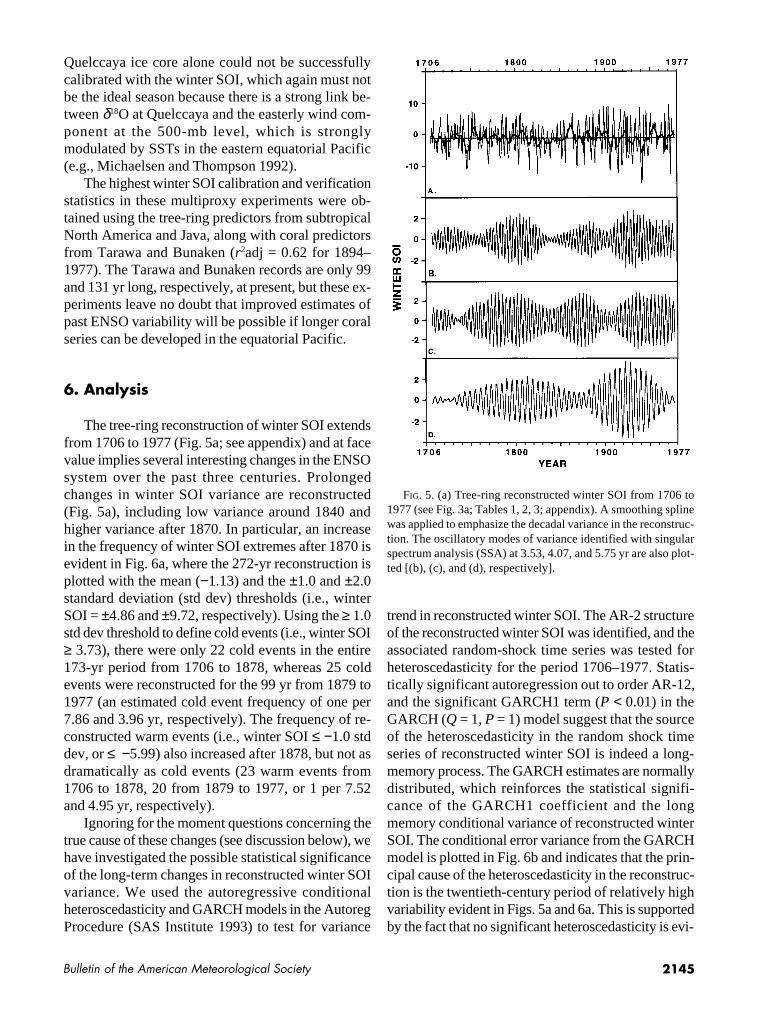
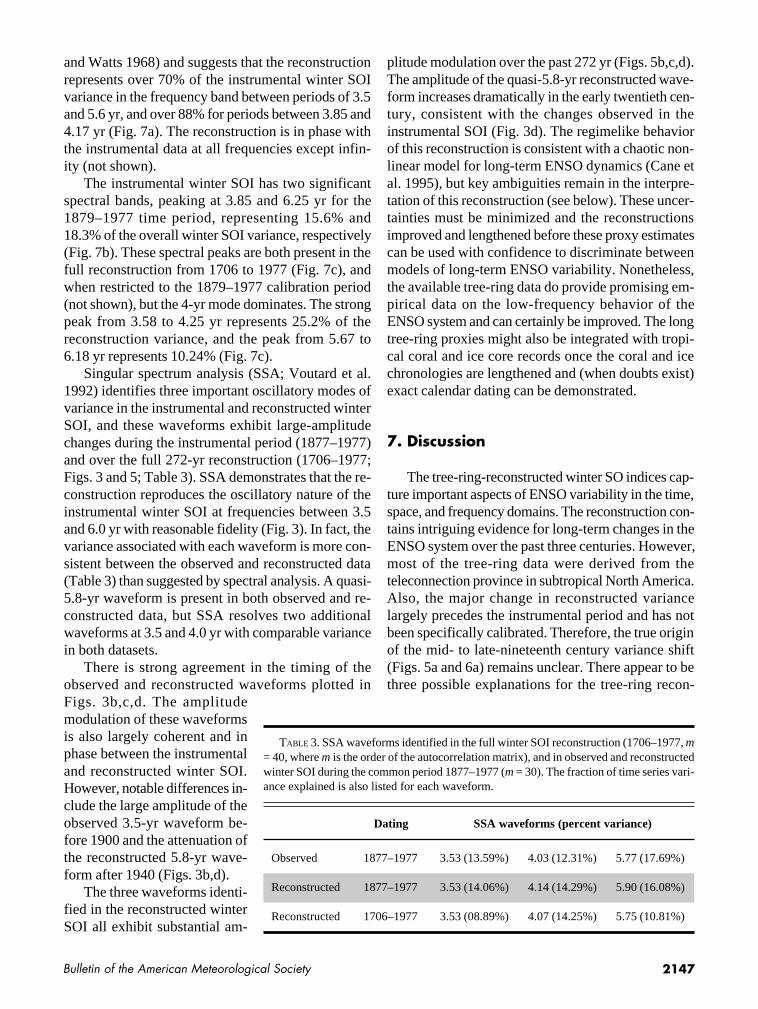
The tree-ring reconstruction of winter SOI extendsfrom 1706 to 1977 (Fig. 5a; see appendix) and at facevalue implies several interesting changes in the ENSOsystem over the past three centuries. Prolongedchanges in winter SOI variance are reconstructed(Fig. 5a), including low variance around 1840 andhigher variance after 1870. In particular, an increasein the frequency of winter SOI extremes after 1870 isevident in Fig. 6a, where the 272-yr reconstruction isplotted with the mean (−1.13) and the ±1.0 and ±2.0standard deviation (std dev) thresholds (i.e., winterSOI = ±4.86 and ±9.72, respectively). Using the ≥ 1.0std dev threshold to define cold events (i.e., winter SOI≥ 3.73), there were only 22 cold events in the entire173-yr period from 1706 to 1878, whereas 25 coldevents were reconstructed for the 99 yr from 1879 to1977 (an estimated cold event frequency of one per7.86 and 3.96 yr, respectively). The frequency of re-constructed warm events (i.e., winter SOI ≤ −1.0 stddev, or ≤ −5.99) also increased after 1878, but not asdramatically as cold events (23 warm events from1706 to 1878, 20 from 1879 to 1977, or 1 per 7.52and 4.95 yr, respectively).
Ignoring for the moment questions concerning thetrue cause of these changes (see discussion below), wehave investigated the possible statistical significanceof the long-term changes in reconstructed winter SOIvariance. We used the autoregressive conditionalheteroscedasticity and GARCH models in the AutoregProcedure (SAS Institute 1993) to test for variance
trend in reconstructed winter SOI. The AR-2 structureof the reconstructed winter SOI was identified, and theassociated random-shock time series was tested forheteroscedasticity for the period 1706–1977. Statis-tically significant autoregression out to order AR-12,and the significant GARCH1 term (P < 0.01) in theGARCH (Q = 1, P = 1) model suggest that the sourceof the heteroscedasticity in the random shock timeseries of reconstructed winter SOI is indeed a long-memory process. The GARCH estimates are normallydistributed, which reinforces the statistical signifi-cance of the GARCH1 coefficient and the longmemory conditional variance of reconstructed winterSOI. The conditional error variance from the GARCHmodel is plotted in Fig. 6b and indicates that the prin-cipal cause of the heteroscedasticity in the reconstruc-tion is the twentieth-century period of relatively highvariability evident in Figs. 5a and 6a. This is supportedby the fact that no significant heteroscedasticity is evi-
FIG. 5. (a) Tree-ring reconstructed winter SOI from 1706 to1977 (see Fig. 3a; Tables 1, 2, 3; appendix). A smoothing splinewas applied to emphasize the decadal variance in the reconstruc-tion. The oscillatory modes of variance identified with singularspectrum analysis (SSA) at 3.53, 4.07, and 5.75 yr are also plot-ted [(b), (c), and (d), respectively].
2146 Vol. 79, No. 10, October 1998
dent when the reconstruction is tested just from 1706to 1900.
The reconstruction also indicates a very smallincrease in the mean of winter SOI from the pre-instrumental to instrumental period (i.e., 1706–1878mean = −1.23, 1879–1977 mean = −0.97). If real, thiswould suggest that the zonal pressure gradient acrossthe equatorial Pacific has strengthened very slightlyduring the late nineteenth and twentieth centuries,which might reflect the reconstructed increase in thefrequency of cold events after 1878.
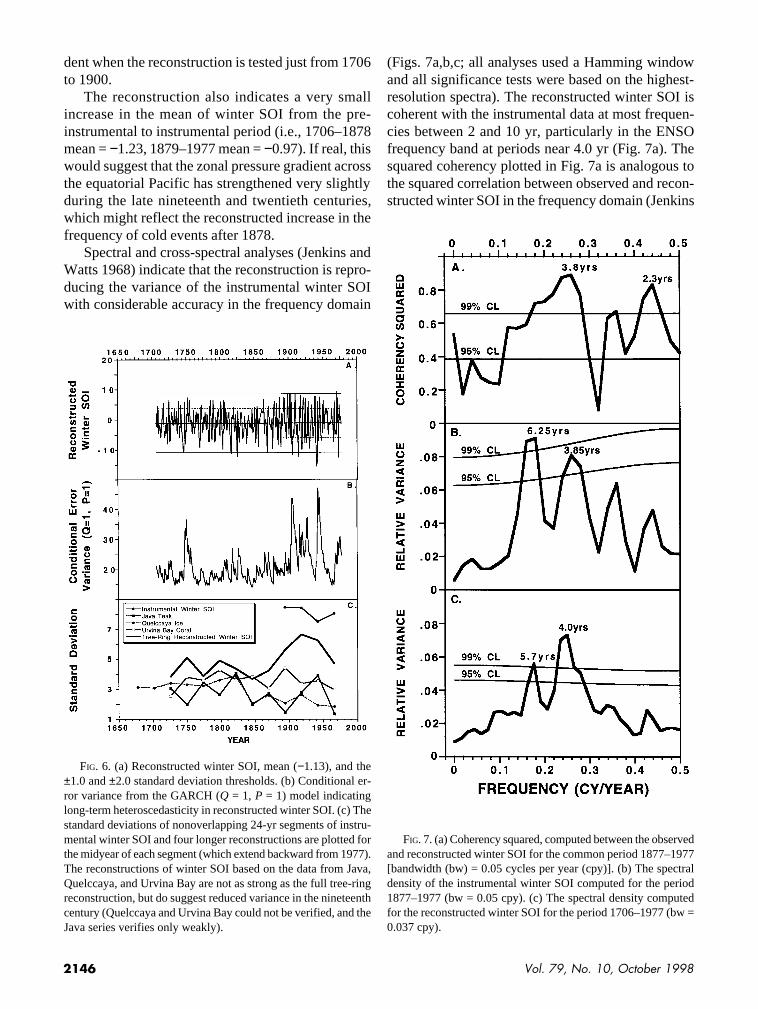
Spectral and cross-spectral analyses (Jenkins andWatts 1968) indicate that the reconstruction is repro-ducing the variance of the instrumental winter SOIwith considerable accuracy in the frequency domain
(Figs. 7a,b,c; all analyses used a Hamming windowand all significance tests were based on the highest-resolution spectra). The reconstructed winter SOI iscoherent with the instrumental data at most frequen-cies between 2 and 10 yr, particularly in the ENSOfrequency band at periods near 4.0 yr (Fig. 7a). Thesquared coherency plotted in Fig. 7a is analogous tothe squared correlation between observed and recon-structed winter SOI in the frequency domain (Jenkins
FIG. 6. (a) Reconstructed winter SOI, mean (−1.13), and the±1.0 and ±2.0 standard deviation thresholds. (b) Conditional er-ror variance from the GARCH (Q = 1, P = 1) model indicatinglong-term heteroscedasticity in reconstructed winter SOI. (c) Thestandard deviations of nonoverlapping 24-yr segments of instru-mental winter SOI and four longer reconstructions are plotted forthe midyear of each segment (which extend backward from 1977).The reconstructions of winter SOI based on the data from Java,Quelccaya, and Urvina Bay are not as strong as the full tree-ringreconstruction, but do suggest reduced variance in the nineteenthcentury (Quelccaya and Urvina Bay could not be verified, and theJava series verifies only weakly).
FIG. 7. (a) Coherency squared, computed between the observedand reconstructed winter SOI for the common period 1877–1977[bandwidth (bw) = 0.05 cycles per year (cpy)]. (b) The spectraldensity of the instrumental winter SOI computed for the period1877–1977 (bw = 0.05 cpy). (c) The spectral density computedfor the reconstructed winter SOI for the period 1706–1977 (bw =0.037 cpy).
2147Bulletin of the American Meteorological Society
and Watts 1968) and suggests that the reconstructionrepresents over 70% of the instrumental winter SOIvariance in the frequency band between periods of 3.5and 5.6 yr, and over 88% for periods between 3.85 and4.17 yr (Fig. 7a). The reconstruction is in phase withthe instrumental data at all frequencies except infin-ity (not shown).
The instrumental winter SOI has two significantspectral bands, peaking at 3.85 and 6.25 yr for the1879–1977 time period, representing 15.6% and18.3% of the overall winter SOI variance, respectively(Fig. 7b). These spectral peaks are both present in thefull reconstruction from 1706 to 1977 (Fig. 7c), andwhen restricted to the 1879–1977 calibration period(not shown), but the 4-yr mode dominates. The strongpeak from 3.58 to 4.25 yr represents 25.2% of thereconstruction variance, and the peak from 5.67 to6.18 yr represents 10.24% (Fig. 7c).
Singular spectrum analysis (SSA; Voutard et al.1992) identifies three important oscillatory modes ofvariance in the instrumental and reconstructed winterSOI, and these waveforms exhibit large-amplitudechanges during the instrumental period (1877–1977)and over the full 272-yr reconstruction (1706–1977;Figs. 3 and 5; Table 3). SSA demonstrates that the re-construction reproduces the oscillatory nature of theinstrumental winter SOI at frequencies between 3.5and 6.0 yr with reasonable fidelity (Fig. 3). In fact, thevariance associated with each waveform is more con-sistent between the observed and reconstructed data(Table 3) than suggested by spectral analysis. A quasi-5.8-yr waveform is present in both observed and re-constructed data, but SSA resolves two additionalwaveforms at 3.5 and 4.0 yr with comparable variancein both datasets.
There is strong agreement in the timing of theobserved and reconstructed waveforms plotted inFigs. 3b,c,d. The amplitudemodulation of these waveformsis also largely coherent and inphase between the instrumentaland reconstructed winter SOI.However, notable differences in-clude the large amplitude of theobserved 3.5-yr waveform be-fore 1900 and the attenuation ofthe reconstructed 5.8-yr wave-form after 1940 (Figs. 3b,d).
The three waveforms identi-fied in the reconstructed winterSOI all exhibit substantial am-
plitude modulation over the past 272 yr (Figs. 5b,c,d).The amplitude of the quasi-5.8-yr reconstructed wave-form increases dramatically in the early twentieth cen-tury, consistent with the changes observed in theinstrumental SOI (Fig. 3d). The regimelike behaviorof this reconstruction is consistent with a chaotic non-linear model for long-term ENSO dynamics (Cane etal. 1995), but key ambiguities remain in the interpre-tation of this reconstruction (see below). These uncer-tainties must be minimized and the reconstructionsimproved and lengthened before these proxy estimatescan be used with confidence to discriminate betweenmodels of long-term ENSO variability. Nonetheless,the available tree-ring data do provide promising em-pirical data on the low-frequency behavior of theENSO system and can certainly be improved. The longtree-ring proxies might also be integrated with tropi-cal coral and ice core records once the coral and icechronologies are lengthened and (when doubts exist)exact calendar dating can be demonstrated.
7. Discussion
The tree-ring-reconstructed winter SO indices cap-ture important aspects of ENSO variability in the time,space, and frequency domains. The reconstruction con-tains intriguing evidence for long-term changes in theENSO system over the past three centuries. However,most of the tree-ring data were derived from theteleconnection province in subtropical North America.Also, the major change in reconstructed variancelargely precedes the instrumental period and has notbeen specifically calibrated. Therefore, the true originof the mid- to late-nineteenth century variance shift(Figs. 5a and 6a) remains unclear. There appear to bethree possible explanations for the tree-ring recon-
Observed 1877–1977 3.53 (13.59%) 4.03 (12.31%) 5.77 (17.69%)
Reconstructed 1877–1977 3.53 (14.06%) 4.14 (14.29%) 5.90 (16.08%)
Reconstructed 1706–1977 3.53 (08.89%) 4.07 (14.25%) 5.75 (10.81%)
TABLE 3. SSA waveforms identified in the full winter SOI reconstruction (1706–1977, m= 40, where m is the order of the autocorrelation matrix), and in observed and reconstructedwinter SOI during the common period 1877–1977 (m = 30). The fraction of time series vari-ance explained is also listed for each waveform.
Dating SSA waveforms (percent variance)
2148 Vol. 79, No. 10, October 1998
structed increase in winter SOI variance after 1870 (orsome combination of the three).
1) The tree-ring proxies could be systematicallybiased prior to the calibration period. The reconstruc-tion model relies heavily (though not exclusively;Table 1) on the tree-growth response in subtropicalNorth America to wet conditions during El Niño yearsand dry conditions during La Niña years. However,this model does not uniquely fingerprint ENSO ex-tremes because other circulation patterns can bringdrought or wetness to the Texas–Mexico region. Forexample, the reconstruction indicates El Niño condi-tions during 1908 (−5.62), 1927 (−6.53), and 1930(−5.26) when the actual winter SOI was 0.38, 2.58, and7.18, respectively (Fig. 3a; see appendix). Conse-quently, the reconstructed changes in winter SOI vari-ance might reflect changes in the degree to which theavailable tree-ring data uniquely fingerprint ENSOforcing. However, this potential flaw is not stronglyevident during the calibration period from 1879 to1977 when the residuals from the regression modellinking winter SOI to tree growth have a random nor-mal distribution.
Another possible source of proxy bias could arisefrom (undocumented) changes within the forest standssampled for this study, which could have increased thevariability, climatic sensitivity, and ENSO responseof the sample trees after 1870. Anthropogenic impactssuch as logging, grazing, or air pollution are obvioussuspects. However, over 600 individual trees from 22different forest stands in the United States, Mexico,and Java were utilized for this reconstruction. Most ofthese stands are quite remote and relatively undis-turbed. It is highly unlikely that these conjectured for-est changes would all operate in the same direction toincrease variability of the resultant chronologies.
The coincidence of the variance shift near 1870with the calibration period (1879–1977) also raisessuspicion about the reconstruction, but a linear mul-tiple regression model was used to calibrate the fourPC factor scores of tree growth with the winter SOI.This linear transfer function will not introducenonstationarities in variance that are not in the rela-tive weighting of the four predictor time series. All ofthe regional tree-ring data from North America andJava exhibit an increase in variance from the nine-teenth to twentieth century (not shown).
2) The strength of the ENSO teleconnection to sub-tropical North America where most of the tree-ringpredictors are located could have increased after 1870,due to changes in the background climate and not
ENSO. Teleconnection strength is certainly known tohave wavered on decadal timescales for many areasinfluenced by ENSO (Allan et al. 1996), and this mayreflect interference by midlatitude circulations that arenot directly coupled with the energetics of the ENSOphenomenon itself. However, analyses of the ENSOinfluence on tree-ring reconstructed summer droughtconditions indicate that the Texas–New Mexico sec-tor retains the strongest and most stable ENSO signalfor any portion of the continental United States dur-ing the instrumental period (Cole and Cook 1997). Wealso observe strong consistency of the ENSO signalin the Mexican earlywood-width chronologies duringsubperiods of the calibration period. This ENSOteleconnection to subtropical North America duringwinter reflects a strong dynamical link betweenanomalous convection in the central and eastern Pa-cific via the enhanced subtropical jet (e.g., Barnett1981). Individual cloud surges originating along theITCZ near Fanning Island in the central Pacific havebeen tracked across northern Mexico and into Floridaon this vigorous low-latitude flow during warm events(Douglas and Englehart 1981). Nevertheless, theENSO teleconnection to subtropical North America isnot perfectly stable, and some of the variability in thetree-ring reconstruction of winter SOI certainly mustreflect changes in the background climate over NorthAmerica, particularly at frequencies above or belowthe highly coherent period of 4.0 yr.
3) The reconstructed increase in winter SOI vari-ance after 1870 could reflect a true change in the ENSOsystem itself over the equatorial Pacific and conse-quently its teleconnected influence to climate oversubtropical North America. There is some independentevidence for a mid- to late-nineteenth century shift inthe interannual variability of climate over the tropicalPacific. These records are far from complete or un-equivocal, but they do offer limited support for the re-constructed changes in the nineteenth century, andsuggest that these changes may not have been the solefunction of teleconnection strength to North America.
First, Rasmusson et al. (1995) identify century-scale changes in the intensity of the ENSO cycle inselected instrumental SST and SLP data from theTropics, with high variance in the late-nineteenth andearly twentieth centuries, and lower variance by 1930.The standard deviation of nonoverlapping 24-yr seg-ments of the instrumental winter SOI parallels thesetrends (Fig. 6b).
Second, the reconstructed winter SOI and itsGARCH model of conditional error variance are plot-
2149Bulletin of the American Meteorological Society
ted (Figs. 6a,b) along with the standard deviations for24-yr segments of the reconstruction and three addi-tional winter SOI reconstructions based only on theJava teak chronology, the Quelccaya ice core, and theUrvina Bay coral (Fig. 6c). These latter three proxiesdo not individually explain large fractions of winterSOI variance, but all were recovered from the equato-rial Pacific sector, all contain at least a weak ENSOsignal, and all exhibit a degree of reduced variance inthe mid–nineteenth century (Fig. 6c).
Third, Enfield and Cid (1991) identified a de-creased frequency of strong ENSO events in the nine-teenth century, based on analyses of historical recordscompiled by Quinn et al. (1987). The longer recurrenceinterval for strong events in the mid–nineteenth cen-tury in the Quinn et al. (1987) record parallels the simi-lar shift noted in the Urvina Bay coral (Dunbar et al.1994). Enfield and Cid hypothesize that the recurrenceinterval for ENSO events may fluctuate between 3 and4 yr in possible response to solar forcing of the quasi-biennial oscillation of stratospheric winds. The rela-tively low variance of tree-ring reconstructed winterSOI (Figs. 5a and 6a) during much of the nineteenthcentury is consistent with the historical and coral evi-dence for longer return intervals between strongevents, and the SSA resolution of the quasi-3.5- and4.0-yr waveforms in both the instrumental and recon-structed winter SOI (Table 3) must reflect the tendencyfor recurrence intervals to fluctuate between 3 and 4 yr.
Fourth, a recent tree-ring reconstruction of the sum-mer Trans Polar Index of midlatitude circulation overthe Southern Ocean (Villalba et al. 1997) contains astrong ENSO-band frequency peak and is coherentwith the instrumental SOI at wavelengths around 3.4–3.6 yr for the interval 1866–1984. The amplitudes ofthe 3–4-yr waveforms derived from these data werealso substantially reduced during the nineteenth cen-tury (Villalba et al. 1997).
8. Conclusions
These multiproxy comparisons, though far fromfinal, tentatively suggest that the envelope of ENSOvariance, and not just the regional teleconnection tosubtropical North America, may have increased fromthe nineteenth to twentieth century. The reconstructionalso indicates a very slight increase in the zonal pres-sure gradient across the equatorial Pacific during theperiod 1879–1977 (i.e., more positive winter SO in-dices and more frequent cold events, compared with
the 1706–1878 time period), which would be consis-tent with the observed decrease in SSTs in the easternequatorial Pacific during the twentieth century (Caneet al. 1997). If these reconstructed nineteenth to twen-tieth century changes in reconstructed winter SOI aresubstantiated by further studies, they will have impor-tant implications to the long-term dynamics of ENSOand its associated climate teleconnections.
Our experiments suggest that the development oflonger coral records from the tropical Pacific and ad-ditional tree-ring chronologies from the western tropi-cal Pacific should help to substantially improve on thistree-ring reconstruction of the SO. The voluminousmultilingual historical archives also have tremendouspotential for reconstructing past ENSO activity. Thearchival chronology of past ENSO events compiledby Quinn et al. (1987) has been criticized, especiallythe degree to which historical citations for conditionsin the coastal zone of Peru and Ecuador represent fullycoupled basinwide ENSO anomalies (e.g., Rasmussonet al. 1995). Indeed, we find only limited agreementbetween the tree-ring reconstructed winter SOI(Fig. 5a) and the Quinn et al. (1987) chronology ofwarm events [i.e., 28 of 40 strong to very strong warmevents identified by Quinn et al. (1987) for the period1706–1977 were reconstructed as negative winter SOindices, and the reconstructed mean SOI for these40 yr was −2.93]. Nevertheless, historical referencesto environmental conditions in the western equatorialPacific and the global Tropics remain an extremelypromising, exactly dated, and surprisingly underuti-lized source of information on past ENSO extremes.
The sparse network of exactly dated, annual-resolution ENSO proxies now available is reminiscentof the circumstances surrounding Sir Gilbert Walker’sinvestigations of the SO early this century. Walker didnot enjoy the globally representative SST and sea levelpressure fields, nor the tropical Pacific products ofTropical Ocean Global Atmosphere/Thermal Array-ing the Ocean (TOGA/TAO) or the Ocean Topogra-phy Experiment (TOPEX/Poseidon). But he did usewhat climatological data were available to index theSO, including such widespread data as Samoa pres-sure, Charleston, South Carolina, pressure, Java rain-fall, and much more (Allan et al. 1996) to describewhat is now recognized as the atmospheric componentof the most important cause of interannual climaticvariability on earth. The network of ENSO-sensitiveproxies is in its infancy. It is not ideally distributed andwill have to be improved with further research. Nev-ertheless, the available tree-ring data from subtropi-
2150 Vol. 79, No. 10, October 1998
cal North America and Java have a demonstrable tem-poral and spatial signal of ENSO, and the derived re-construction is particularly strong in the 4-yr frequencyband. The aperiodic regimelike behavior evident in thereconstructed quasi-4-yr waveform of winter SOI hasimportant implications for the low-frequency dynam-ics of ENSO and strongly justifies further developmentof annual paleoclimatic proxies of the ENSO system.
Acknowledgments. We thank Professor James E. Dunn,David M. Meko, Rachel Krusic, Armando Rodriquez, WilburSalinas, Gene Paull, Gordon C. Jacoby, Malcolm K. Hughes, RexAdams, Peter Z. Fule, Thomas P. Harlan, Thomas H. Naylor (de-ceased), three anonomous reviewers for helpful suggestions, theInstituto Nacional de Investigaciones Forestales y Agropecuarias(S.L.P., Mexico), and the Indonesian Institute of Sciences (LIPI).This research was supported by grants from the National ScienceFoundation (Grants ATM-9528148 and ATM-9705676) and theNational Oceanic and Atmospheric Administration (GrantNA56GPO217). RJA was supported under the CSIRO ClimateChange Research Program, funded partially by the AustralianCommonwealth Department of Environment, Sport, and Terri-tories, and the State Governments of Northern Territory,Queensland, and Western Australia. This is Lamont-DohertyEarth Observatory contribution number 5852.
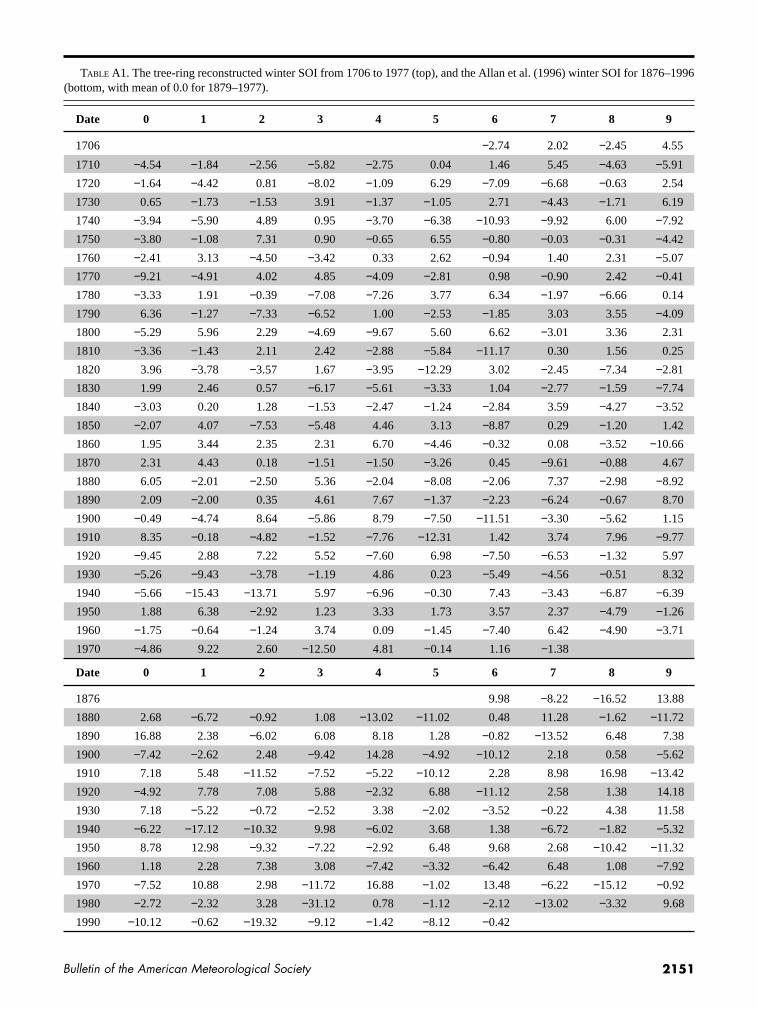
Appendix: Reconstructed and observedwinter SOI (Appendix appears as a tableon the adjacent page)
References
Akaike, H., 1974: A new look at the statistical model identifica-tion. IEEE Trans. Auto. Control, AC-19, 716–723.
Allan, R. J., J. Lindesay, and D. Parker, 1996: El Niño/SouthernOscillation & Climatic Variability. CSIRO Publishing,408 pp.
Barnett, T. P., 1981: Statistical prediction of North American airtemperatures from Pacific predictors. Mon. Wea. Rev., 109,1021–1041.
Berlage, H. P., 1931: On the relationship between thickness of treerings of Djati (teak) trees and rainfall on Java (in Dutch).Tectona, 24, 939–953.
Box, G. E. P., G. M. Jenkins, and G. C. Reinsel, 1994: Time Se-ries Analysis, Forecasting and Control. Prentice Hall, 575 pp.
Buckley, B. M., M. Barbetti, M. Watanasak, R. D’Arrigo,S. Boonchirdchoo, and S. Sarutanon, 1995: Dendrochronologi-cal investigations in Thailand. IAWA J., 16, 393–409.
Cane, M. A., R. G. Fairbanks, and G. T. Shen, 1993: Recent vari-ability in the Southern Oscillation: Isotopic results from aTarawa atoll coral. Science, 260, 1790–1793.
——, S. E. Zebiak, and Y. Xue, 1995: Model studies of the long-term behavior of ENSO. Natural Climate Variability on De-cade-to-Century Time Scales, Climate Research Committee,Eds., National Academy Press, 442–457.
——, A. C. Clement, A. Kaplan, Y. Kushnir, D. Pozdnyakov,R. Seager, S.E. Zebiak, and R. Murtugudde, 1997: Twenti-eth-century sea surface temperature trends. Science, 275,957–960.
Cole, J. E., and E. R. Cook, 1997: The coupling between ENSOand US drought: How stable is it over the past century? Proc.AGU Fall Meeting, San Francisco, CA, Amer. Geophys. Union.
Cook, E. R., and L. Kairiukstis, 1991: Methods of Dendrochro-nology: Applications in the Environmental Sciences. Kluwer,163–217.
——, K. R. Briffa, and P. D. Jones, 1994: Spatial regression meth-ods in dendroclimatology: A review and comparison of twotechniques. Int. J. Climatol., 14, 379–402.
D’Arrigo, R. D., and G. C. Jacoby, 1991: A thousand year recordof northwestern New Mexico winter precipitation recon-structed from tree rings and its relation to El Niño and theSouthern Oscillation. Holocene, 1/2, 95–101.
——, and ——, 1992: A tree-ring reconstruction of New Mexicowinter precipitation and its relation to El Niño/Southern Os-cillation events. El Niño: Historical and Paleoclimatic Aspectsof the Southern Oscillation, V. Markgraf and H. Diaz, Eds.,Cambridge University Press, 243–257.
——, ——, and P. J. Krusic, 1994: Progress in dendroclimaticstudies in Indonesia. Terr. Atmos. Oceanic Sci., 5, 349–363.
Douglas, A. V., 1980: Geophysical estimates of sea-surface tem-peratures off western North America since 1671. CaliforniaCooperative Oceanic Fisheries Investigations Rep. 21, 112 pp.
——, and P. J. Englehart, 1981: On a statistical relationship be-tween autumn rainfall in the central equatorial Pacific and sub-sequent winter precipitation in Florida. Mon. Wea. Rev., 109,2377–2382.
Draper, N. R., and H. Smith, 1981: Applied Regression Analysis.2nd ed. John Wiley and Sons, 709 pp.
Dunbar, R. B., G. M. Wellington, M. W. Colgan, and P. W. Glynn,1994: Eastern Pacific sea surface temperature since 1600 A.D.:The δ18O record of climate variability in Galapagos corals.Paleooceanography, 9, 291–315.
Enfield, D. B., and L. Cid, 1991: Low-frequency changes inEl Niño–Southern Oscillation. J. Climate, 4, 1137–1146.
Fritts, H. C., J. Guiot, and G. A. Gordon, 1990: Verification. Meth-ods of Dendrochronology: Applications in the Environmen-tal Sciences, E.R. Cook and L.A. Kariukstis, Eds., Kluwer,178–185.
Jacoby, G. C., 1989: Overview of tree-ring analysis in tropical re-gions. IAWA Bull., 10, 103–108.
Jenkins, G. M., and D. G. Watts, 1968: Spectral Analysis and ItsApplications. Holden-Day, 525 pp.
Jones, P. D., 1988: The influence of ENSO on global tempera-tures. Climate Monitor, 17, 80–89.
Kaplan, A., M. Cane, Y. Kushnir, A. Clement, M. Blumenthal, andB. Rajagopalan, 1998: Analyses of global sea surface tempera-ture 1856–1991. J. Geophys. Res., 103, 18 567–18 589.
Kennedy, J. A., and S. C. Brassell, 1992: Molecular records oftwentieth-century El Niño events in laminated sediments fromthe Santa Barbara basin. Nature, 357, 62–64.
Lough, J. M., and H. C. Fritts, 1985: The Southern Oscillation andtree rings: 1600–1961. J. Climate Appl. Meteor., 24, 952–966.
Meko, D. M., 1981: Applications of Box–Jenkins methods of timeseries analysis to the reconstruction of drought from tree rings.Ph.D. dissertation, University of Arizona, 149 pp.
2151Bulletin of the American Meteorological Society
1706 −2.74 2.02 −2.45 4.55
1710 −4.54 −1.84 −2.56 −5.82 −2.75 0.04 1.46 5.45 −4.63 −5.91
1720 −1.64 −4.42 0.81 −8.02 −1.09 6.29 −7.09 −6.68 −0.63 2.54
1730 0.65 −1.73 −1.53 3.91 −1.37 −1.05 2.71 −4.43 −1.71 6.19
1740 −3.94 −5.90 4.89 0.95 −3.70 −6.38 −10.93 −9.92 6.00 −7.92
1750 −3.80 −1.08 7.31 0.90 −0.65 6.55 −0.80 −0.03 −0.31 −4.42
1760 −2.41 3.13 −4.50 −3.42 0.33 2.62 −0.94 1.40 2.31 −5.07
1770 −9.21 −4.91 4.02 4.85 −4.09 −2.81 0.98 −0.90 2.42 −0.41
1780 −3.33 1.91 −0.39 −7.08 −7.26 3.77 6.34 −1.97 −6.66 0.14
1790 6.36 −1.27 −7.33 −6.52 1.00 −2.53 −1.85 3.03 3.55 −4.09
1800 −5.29 5.96 2.29 −4.69 −9.67 5.60 6.62 −3.01 3.36 2.31
1810 −3.36 −1.43 2.11 2.42 −2.88 −5.84 −11.17 0.30 1.56 0.25
1820 3.96 −3.78 −3.57 1.67 −3.95 −12.29 3.02 −2.45 −7.34 −2.81
1830 1.99 2.46 0.57 −6.17 −5.61 −3.33 1.04 −2.77 −1.59 −7.74
1840 −3.03 0.20 1.28 −1.53 −2.47 −1.24 −2.84 3.59 −4.27 −3.52
1850 −2.07 4.07 −7.53 −5.48 4.46 3.13 −8.87 0.29 −1.20 1.42
1860 1.95 3.44 2.35 2.31 6.70 −4.46 −0.32 0.08 −3.52 −10.66
1870 2.31 4.43 0.18 −1.51 −1.50 −3.26 0.45 −9.61 −0.88 4.67
1880 6.05 −2.01 −2.50 5.36 −2.04 −8.08 −2.06 7.37 −2.98 −8.92
1890 2.09 −2.00 0.35 4.61 7.67 −1.37 −2.23 −6.24 −0.67 8.70
1900 −0.49 −4.74 8.64 −5.86 8.79 −7.50 −11.51 −3.30 −5.62 1.15
1910 8.35 −0.18 −4.82 −1.52 −7.76 −12.31 1.42 3.74 7.96 −9.77
1920 −9.45 2.88 7.22 5.52 −7.60 6.98 −7.50 −6.53 −1.32 5.97
1930 −5.26 −9.43 −3.78 −1.19 4.86 0.23 −5.49 −4.56 −0.51 8.32
1940 −5.66 −15.43 −13.71 5.97 −6.96 −0.30 7.43 −3.43 −6.87 −6.39
1950 1.88 6.38 −2.92 1.23 3.33 1.73 3.57 2.37 −4.79 −1.26
1960 −1.75 −0.64 −1.24 3.74 0.09 −1.45 −7.40 6.42 −4.90 −3.71
1970 −4.86 9.22 2.60 −12.50 4.81 −0.14 1.16 −1.38
TABLE A1. The tree-ring reconstructed winter SOI from 1706 to 1977 (top), and the Allan et al. (1996) winter SOI for 1876–1996(bottom, with mean of 0.0 for 1879–1977).
Date 0 1 2 3 4 5 6 7 8 9
1876 9.98 −8.22 −16.52 13.88
1880 2.68 −6.72 −0.92 1.08 −13.02 −11.02 0.48 11.28 −1.62 −11.72
1890 16.88 2.38 −6.02 6.08 8.18 1.28 −0.82 −13.52 6.48 7.38
1900 −7.42 −2.62 2.48 −9.42 14.28 −4.92 −10.12 2.18 0.58 −5.62
1910 7.18 5.48 −11.52 −7.52 −5.22 −10.12 2.28 8.98 16.98 −13.42
1920 −4.92 7.78 7.08 5.88 −2.32 6.88 −11.12 2.58 1.38 14.18
1930 7.18 −5.22 −0.72 −2.52 3.38 −2.02 −3.52 −0.22 4.38 11.58
1940 −6.22 −17.12 −10.32 9.98 −6.02 3.68 1.38 −6.72 −1.82 −5.32
1950 8.78 12.98 −9.32 −7.22 −2.92 6.48 9.68 2.68 −10.42 −11.32
1960 1.18 2.28 7.38 3.08 −7.42 −3.32 −6.42 6.48 1.08 −7.92
1970 −7.52 10.88 2.98 −11.72 16.88 −1.02 13.48 −6.22 −15.12 −0.92
1980 −2.72 −2.32 3.28 −31.12 0.78 −1.12 −2.12 −13.02 −3.32 9.68
1990 −10.12 −0.62 −19.32 −9.12 −1.42 −8.12 −0.42
Date 0 1 2 3 4 5 6 7 8 9
2152 Vol. 79, No. 10, October 1998
Michaelsen, J., 1989: Long period fluctuations in El Niño am-plitude and frequency reconstructed from tree rings. Aspectsof Climate Variability in the Pacific and the Western Ameri-cas, Geophysical Monograph, No. 55, Amer. Geophys.Union, 69–74.
——, and L. G. Thompson, 1992: A comparison of proxy recordsof El Niño/Southern Oscillation. El Niño, Historical andPaleoclimatic Aspects of the Southern Oscillation, H. F. Diazand V. Markgraf, Eds., Cambridge University Press, 323–348.
Phillips, J. G., C. Rosenzweig, and M. Cane, 1996: Exploring thepotential for using ENSO forecasts in the U.S. Corn Belt.Drought Network News, 8, 6–10.
Quinn, W. H., V. T. Neal, and S. E. Antunez de Mayolo, 1987:El Niño occurrences over the past four and a half centuries. J.Geophys. Res., 92 (C13), 14 449–14 461.
Rasmusson, E. M., X. Wang, and C. F. Ropelewski, 1995: Secu-lar variability of the ENSO cycle. Natural Climate Variabilityon Decade-to-Century Time Scales, Climate Research Com-mittee, Eds., National Academy Press, 458–469.
Ropelewski, C. F., and M. S. Halpert, 1987: Global and regionalscale precipitation patterns associated with the El Niño/South-ern Oscillation. Mon. Wea. Rev., 115, 1606–1626.
——, and ——, 1989: Precipitation patterns associated with thehigh phase of the Southern Oscillation. J. Climate, 1, 172–182.
SAS Institute Inc., 1993: SAS/ETS User’s Guide, Version 6. 2ded. SAS Institute Inc., 890 pp.
Stahle, D. W., and M. K. Cleaveland, 1993: Southern Oscillationextremes reconstructed from tree-rings of the Sierra Madre Oc-cidental and southern Great Plains. J. Climate, 6, 129–140.
——, ——, G. A. Haynes, J. Klimowicz, P. Mushove,P. Ngwenya, and S. E. Nicholson, 1997: Development of arainfall sensitive tree-ring chronology in Zimbabwe. Preprints,Eighth Symp. on Global Change Studies, Long Beach, CA,Amer. Meteor. Soc., 205–211.
Steel, R. G. D., and J. H. Torrie, 1980: Principles and Proceduresof Statistics: A Biometrical Approach. 2d ed. McGraw-Hill,633 pp.
Swetnam, T. W., and J. L. Betancourt, 1990: Fire–Southern Os-cillation relations in the southwestern United States. Science,249, 1017–1020.
Thompson, L. G., E. Mosley-Thompson, and B. M. Arnao, 1984:El Niño/Southern Oscillation events recorded in the stratigraphyof the tropical Quelccaya ice cap, Peru. Science, 226, 50–53.
Villalba, R., E. R. Cook, R. D. D’Arrigo, G. C. Jacoby, P. D.Jones, M. J. Salinger, and J. Palmer, 1997: Sea level pressurevariability around Antarctica since A.D. 1750 inferred fromsubantarctic tree-ring records. Climate Dyn., 13, 375–390.
Voutard, R., P. Yiou, and M. Ghil, 1992: Singular spectrum analy-sis: A toolkit for short noisy chaotic time series. Physica D,58, 95–126.
Wright, P. B., 1982: Homogenized long-period Southern Oscil-lation indices. Int. J. Climatol., 9, 33–54.