Embed Size (px)
Citation preview

ww.sciencedirect.com
i n t e rn a t i o n a l j o u r n a l o f h y d r o g e n en e r g y 3 9 ( 2 0 1 4 ) 1 4 5 8 8e1 4 5 9 5
Available online at w
ScienceDirect
journal homepage: www.elsevier .com/locate/he
Experimental design as a tool to study the reactionparameters in hydrogen production fromphotoinduced reforming of glycerol over CdSphotocatalyst
Samantha A.L. Bastos a, Paula A.L. Lopes a, F�abio N. Santos b,Luciana Almeida Silva a,c,*
a Instituto de Quımica, Universidade Federal da Bahia, Campus de Ondina, Salvador 40170-290, BA, Brazilb ThoMSon Mass Spectrometry Laboratory, Instituto de Quımica, Universidade de Campinas, 13084-971 Campinas,
SP, Brazilc Instituto Nacional de Ciencia e Tecnologia, INCT, de Energia e Ambiente, Universidade Federal da Bahia,
40170-290 Salvador, BA, Brazil
a r t i c l e i n f o
Article history:
Received 28 March 2014
Accepted 14 July 2014
Available online 7 August 2014
Keywords:
Experimental design
CdS
Hydrogen
Photoinduced reforming
Seawater
* Corresponding author. Instituto de Quımicþ55 71 3283 6881.
E-mail address: [email protected] (L.A. Silva).http://dx.doi.org/10.1016/j.ijhydene.2014.07.00360-3199/Copyright © 2014, Hydrogen Energ
a b s t r a c t
The aim of this study was to set the reaction conditions of the photoinduced reforming of
glycerol aqueous solution over Pt/hex-CdS under visible light irradiation for enhancement
of hydrogen production by using a fractional factorial experimental design followed by a
BoxeBehnken design. The parameters assessed were irradiation time, mass of photo-
catalyst, concentration of glycerol, pH and electrolyte concentration (NaCl). The pre-
liminary two-level fractional factorial design (25�1) showed that all of the investigated
factors have significant effect in hydrogen production, being pH the most important
parameter. The three factors BoxeBehnken design showed maximum response for
hydrogen production in pH 4.0, 55% glycerol and 1.5 mol L�1 NaCl. The amount of hydrogen
obtained under these conditions was 270% higher than our previous result, using the same
photocatalyst and electron donor. In the ideal pH, >CdSH2þand >CdOH species are pre-
dominant before irradiation, indicating that such species play an important role in the
primary steps of the photoelectrochemical mechanism, which served as the basis for
proposing a mechanism for hydrogen generation as well as glycerol photooxidation. Based
on the surface response [NaCl] � [glycerol], a solution with salinity equivalent to approx-
imately the natural seawater was tested and the result for hydrogen production was
comparable to the best condition; besides, under this condition, the solubility of CdS in
aqueous solution is reduced.
Copyright © 2014, Hydrogen Energy Publications, LLC. Published by Elsevier Ltd. All rights
reserved.
a, Universidade Federal da Bahia, Campus de Ondina, Salvador 40170-290, BA, Brazil. Tel.:
73y Publications, LLC. Published by Elsevier Ltd. All rights reserved.

i n t e r n a t i o n a l j o u r n a l o f h y d r o g e n en e r g y 3 9 ( 2 0 1 4 ) 1 4 5 8 8e1 4 5 9 5 14589
Introduction
Renewable hydrogen can be produced in an efficient process
via the photocatalytic reforming of biomass components and
derivatives in ambient conditions. The photoinduced
reforming process combines the water splitting and oxidation
reactions of organic compounds under non-aerated condi-
tions in a photocatalytic cell [1e8]. Most of the systems
developed until now use Pt/TiO2 as the photocatalyst under
UV light irradiation, which is inefficient to drive the photoin-
duced reforming under sunlight irradiation, because the
incoming solar energy spectrumaccounts only about 3% of UV
light against approximately 43% of visible light.
Several studies have assessed the different reaction pa-
rameters that can influence the efficiency of the photoinduced
reforming of biomass derivatives in an attempt to find a highly
efficient system for hydrogen production [6e13]. The reaction
parameters most frequently evaluated are pH, mass of the
photocatalyst, type and concentration of co-catalyst, the
presence and concentration of electrolytes and type and
concentration of the biomass derivative. However, in all sys-
tems evaluated optimization of the reaction conditions are
usually carried out by a traditional univariate approach, in
which each factor is studied separately. This procedure does
not consider the interactions among the factors that can limit
the performance of the process. In this case, a multivariate
experimental design strategy is recommended because it al-
lows for simultaneous variation of all evaluated factors,
making it possible to distinguish interactions among them
that would not be detectable by the classical univariate
experimental design [14e16]. Besides, the multivariate pro-
cedure reduces considerably, since only two levels of each
factor are investigated, the number of required experiments
without loss of information about the system and it is
considered a good strategy to screen themore relevant factors
for a high efficiency of the reaction.
To perform the multivariate optimization, either a full
factorial design or a fractional factorial design in two levels
can be employed. In a full factorial design the number of ex-
periments is 2K þ C, where K is the number of variables and C
is the number of replicates at the central point. In this pro-
cedure, the effects of all the factors and their interactions can
be obtained, since all experiments are performed. However, in
cases in which the number of variables that affect the
chemical system is greater than four, it is recommended a
fractional factorial design in order to reduce the number of
experiments without loss of information about the effects of
all factors. In a fractional factorial design the number of ex-
periments required is 2K�P þ C, where P indicates how frac-
tionated the experimental design is. Some interactions among
the factors, for example, interactions among three or four
factors are not estimated in this case, since a half (2K�1) or a
quarter (2K�2) of the experiments in the full factorial design
are performed. After the screening of relevant variables one
can apply an experimental design with different level values,
according to the tendencies of each factor that resulted in an
enhancement in hydrogen production. Another alternative is
to apply a response surface methodology, such as Central
Compound Design (CCD), BoxeBehnken design or Doehlert, to
find the critical conditions, maximum andminimumpoints of
the response (in this case hydrogen production) in the
experimental domain studied [15].
Recently, we evaluated binary (Pt/hex-CdS) and ternary
(Pt/CdS/TiO2 and Pt/TiO2/hex-CdS) hybrid photocatalysts in
photoinduced reforming of glycerol under visible light irra-
diation (l > 418 nm) [17]. All of the hybrid materials demon-
strated photocatalytic activity with respect to hydrogen gas
production. The systems with CdS/aqueous solution interfa-
cial contact showed higher activity, with relative order of
reactivity to the hybrid photocatalysts: Pt/hex-CdS > Pt/CdS/
TiO2 > Pt/TiO2/CdS. Those results suggest that the hydrogen
production mechanism can be strongly influenced by hy-
drolytic surface reactions on CdS. The functional groups
developed on CdS surface, such as hydroxyl (on the cadmium
site) and thiol (on the sulfur site), are very susceptible to
variations on the solution conditions. Thus, the aim of this
study was to set the reactional conditions for hydrogen pro-
duction enhancement from photoinduced reforming of
glycerol aqueous solution over Pt/hex-CdS under visible light
irradiation using both factorial fractional and BoxeBehnken
designs. The parameters evaluated were irradiation time,
mass of photocatalyst, concentration of glycerol, pH and
electrolyte concentration (NaCl). Since NaCl is a major
component of natural seawater, the concentration of this
electrolyte was inserted as a factor on the experimental
design in order to evaluate the viability of the use of natural
seawater for producing hydrogen. Each factor and their in-
teractions were evaluated employing a fractional factorial
design and BoxeBehnken design to establish the best reac-
tion conditions with respect of hydrogen production. In this
work, we also evaluated CdS stability under reaction
conditions.
Experimental
Photocatalyst preparation
Hexagonal CdS (named hex-CdS) was prepared according to a
well established procedure in literature by heat-treating
commercial-grade CdS (Aldrich, yellow powders) at 700 �Cunder a nitrogen flow for one hour [17].
Photocatalytic reactions
A high-pressure 500 W HgeXe arc lamp was used as the light
source for the photocatalytic reactions. The collimated light
beam was passed through an IR filter, a focusing lens and a
418 nm cutoff filter before reaching the photocatalytic cell,
which was air cooled to maintain a constant temperature.
Before each experiment, the photocatalytic cell was purged
with argon for 30 min to eliminate O2. The photocatalytic cell
(total volume ¼ 180 mL) was equipped with a flat window and
argon gas inlet/outlet tubes, which serve to collect and
transfer gaseous products to the analytical system.
Hydrogen gas evolution was measured by gas chromatog-
raphy SHIMADZU (GC2014) with thermal conductivity detec-
tion (TCD) and CO and CO2 were measured simultaneously in
ionization flame detection (FID) with methanator. Because He

Table 2 e Factor levels of the first fractional factorialdesign 2(5¡1).
Parameter Level (�1) Level (0) Level (þ1)
Irradiation time (h) 3.0 5.0 7.0
Mass of CdS (G) 60 90 120
Glycerol concentration (v/v%) 30 50 70
pH 4.0 7.0 10.0
NaCl concentration (mol L�1) 0.1 0.55 1.0
i n t e rn a t i o n a l j o u r n a l o f h y d r o g e n en e r g y 3 9 ( 2 0 1 4 ) 1 4 5 8 8e1 4 5 9 514590
and H2 have similar conductivity values, argon was used as a
carrier gas.
An inductively coupled plasma optical emission spec-
trometer (ICP OES) (Optima 8300, Perkin Elmer, Inc., Massa-
chussets, USA) equipped with a cyclonic nebulizer chamber
(Perkin Elmer, Inc., Massachussets, USA) and concentric
nebulizer (Perkin Elmer, Inc., Massachussets, USA) was
employed for Cd determination in the liquid effluents. The
operating conditions are summarized in Table 1. The emission
line for the analysis by ICP OES was the main emission line of
Cd (228,802 nm). To obtain the analytical curve, a high-purity
grade 1 g L�1 stock solution of Cd (Accu Standard) was suc-
cessively diluted with a 55% glycerol aqueous solution at pH 4
and 1 mol L�1 NaCl, previously diluted 50 times, to give rise
standard solutions in the concentration ranging of
0.1e20 mg L�1. Samples were prepared by dilution of 200 mL of
each effluent solution in 10 mL of water.
In the photolysis experiment, the photocatalyst was
dispersed in an aqueous solution (total volume ¼ 60 mL)
containing an appropriate concentration of glycerol and NaCl,
with pH adjusted by the addition of NaOH or HCl solution.
Metallic platinum was deposited in situ on the photocatalyst
surface by the photodecomposition of PtCl62� with addition of
40 mL of 8% H2PtCl6.6H2O before pH adjustment. Aliquots of
1 mL of the gas phase were injected in the GC system in in-
tervals of one hour. In order to ensure the accuracy of the
determination and quantification of the hydrogen produced
during the photoinduced reforming reaction, a standard
mixture of 5%H2, 2%CO2 and 500 ppmCOdiluted in argonwas
injected before each experiment.
Experimental design
A fractional factorial design 2(5�1) (Table 2 in Section 3) was
done within the Statistica software in order to evaluate the
factors irradiation time, mass of photocatalyst, concentration
of glycerol, pH and electrolyte concentration (NaCl) in two
levels. A BoxeBenhken design was also done aiming the more
significant factors, such as concentration of glycerol, pH and
electrolyte concentration (NaCl), in three levels (Table 4 in
Section 3).
Point of zero charge
The zero point of charge of hydrous CdS under different
concentrations of NaCl was determined by the solid addition
method [18,19]. For each concentration of NaCl (0.1; 0.5; 1.0
and 1.5 mol L�1) a series of twelve flasks containing 10 mL of
NaCl solution had the pH adjusted by adding hydrochloric acid
or sodium hydroxide solutions to give rise pH varying of 1e12.
After adjusted the initial pH of the solutions, 0.040 g of hex-
Table 1 e Instrumental conditions of the ICP OES.
Parameter Value
RF incident power 1.5 kW
Plasma argon flow rate 12 L min�1
Auxiliary argon flow rate 0.8 L min�1
Nebulizer argon flow rate 0.7 L min�1
Sample injecting flow rate 1.0 L min�1
CdS was added to each flask. The suspensions were then
manually shaken, allowed to equilibrate for 24 h, and the pH
values of the supernatant were measured. The difference
between the initial and final pH value (DpH) was plotted
against initial pHs. The point of intersection of the resulting
null pH corresponds to the zero point of charge, pHZPC.
Results and discussion
The first fractional factorial design 2(5�1) in two levels con-
structed for the five factors selected for study (Table 2) resul-
ted in a matrix with sixteen experiments and three central
points (total 19 experiments) with the amount of hydrogen
produced in the photoinduced reforming reaction as the
response (Table 3). The levels were established based on our
previouswork [17] that evaluated the photocatalytic activity of
Pt/hex-CdS under the following conditions: 60 mg of photo-
catalyst dispersed in an aqueous solution (total
volume ¼ 60 mL) containing 30% glycerol and 40 mL of 8%
H2PtCl6.6H2O, with pH adjusted to 11 by the addition of a
NaOH solution without NaCl addition.
The Pareto's chart generated from Statistica software (Fig. 1)
shows that all of the investigated factors have significant ef-
fect in hydrogen production, considering 95% confidence
(p < 0.05). The factors pH and irradiation time have negative
effect, exerting more influence in level (�1). The factors glyc-
erol concentration, mass of CdS and NaCl concentration have
positive effect, influencing more in level (þ1). The larger
amounts of hydrogenwere obtained from experiments 6 and 7
(Table 3), of which the three factors with most strong effects
are located in most influent levels. The mass of CdS and
irradiation time factors showed minor effects as compared to
the others, but they also contributed for an increase of
hydrogen production in experiment 7 (Table 3).
The interaction effects depends on their levels, as seen in
Table 3 comparing experiments 5 and 8, in which the amounts
of hydrogen produced are very similar, with mass of CdS in
level (�1) in experiment 5 and irradiation time in level (þ1) in
experiment 8. This is an evidence that mass of CdS and irra-
diation time factors have similar effects in hydrogen produc-
tion, however these effects are opposite. Additionally, in
experiments 5 and 8, with NaCl concentration in level (�1), in
experiments 1 and 4, with glycerol concentration in level (�1),
and experiments 13 and 16, with pH in level (þ1), the amounts
of hydrogen decreased in this order and were proportional to
the increase in effects of the factors. It is worth to note that an
interaction two to two was observed among all factors eval-
uated as showed in the first order interactions in Pareto's chart(Fig. 2).

Table 3 e Experiments matrix and results obtained of the 2(5¡1) fractional factorial design.
Experiments Irradiation time (h) CdS (mg) Glycerol (v/v%) pH NaCl (mol L�1) H2 (mmol)
1 �1 �1 �1 �1 þ1 11.85
2 þ1 �1 �1 �1 �1 2.91
3 �1 þ1 �1 �1 �1 5.64
4 þ1 þ1 �1 �1 þ1 9.21
5 �1 �1 þ1 �1 �1 19.22
6 þ1 �1 þ1 �1 þ1 36.83
7 �1 þ1 þ1 �1 þ1 48.14
8 þ1 þ1 þ1 �1 �1 18.22
9 �1 �1 �1 þ1 �1 2.36
10 þ1 �1 �1 þ1 þ1 7.87
11 �1 þ1 �1 þ1 þ1 8.51
12 þ1 þ1 �1 þ1 �1 5.52
13 �1 �1 þ1 þ1 þ1 3.59
14 þ1 �1 þ1 þ1 �1 0.00
15 �1 þ1 þ1 þ1 �1 8.61
16 þ1 þ1 þ1 þ1 þ1 0.01
17 0 0 0 0 0 0.02
18 0 0 0 0 0 0.01
19 0 0 0 0 0 0.01
2233.27
-3179.12
7389.01
9391.70
-13439.70
p=0,05
Standardized Effect Estimate (Absolute Value)
(2) CdS (mg)
(1) Irradiation time (h)
(5) [NaCl] Mol L-1
(3) [Glycerol] %
(4) pH
Fig. 1 e Pareto's chart of the factors effects.
-182.06
-903.54
931.82
-1046.13
1329.82
2233.27
2500.73
-2518.95
-3179.12
-5645.24
-6576.91
7389.01
9391.70
-12194.70
-13439.70
p=0,05
Standardized Effect Estimate (Absolute Value)
2by42by51by41by52by3
(2) CdS (mg)3by51by3
(1) Irradiation time (h)1by24by5
(5) [NaCl] Mol L-1
(3) [Glycerol] %3by4
(4) pH
Fig. 2 e Pareto's chart of the first order interactions.
i n t e r n a t i o n a l j o u r n a l o f h y d r o g e n en e r g y 3 9 ( 2 0 1 4 ) 1 4 5 8 8e1 4 5 9 5 14591
The levels of the factors in experiment 7 represent the
optimal condition in the experimental domain studied.
However, the curvature parameter showed relevant and
negative effect, indicating that there is an inflection point
(maximum) in the experimental range investigated. There-
fore, it is possible an enhancement of the hydrogen amount
produced from experiment 7, fixing the less significant fac-
tors (irradiation time and mass of CdS) and modifying the
levels of the factors following the tendency observed in Par-
eto's chart.
The response surface method is a strategy frequently
used to obtain the maximum response condition (curve in-
flection). In the present system, a BoxeBehnken design was
applied with three of the more significant factors and three
replications in the central point. The factors and levels of
the BoxeBehnken design are described in Table 4 and the
matrix of the experiments with respective results is shown
in Table 5.
From the analysis of the surface response of the experi-
mental design (Fig. 3) the bestmodel that wasmore adjustable
to the experimental data was one with linear and quadratic
factors (terms) and an interaction two by two. The response
surface enables us to conclude that the estimated critical
point is as follows: pH 3.6, 84% glycerol and 0.6 mol L�1 NaCl.
However, such conditions correspond to theminimal point, as
seen in the response surface, where regions with high con-
centrations of glycerol represent low hydrogen production
(Fig. 3(a) and (b)). The results in Table 5 reveal that experiment
11 produced the highest amount of hydrogen; thus, pH 4, 55%
glycerol and 1.5 mol L�1 NaCl was established as the best
Table 4 e Factors and levels investigated in the 33
BoxeBehnken experimental design.
Factors Level (�1) Level (0) Level (þ1)
Glycerol concentration (v/v%) 55 70 85
pH 2.0 4.0 6.0
NaCl concentration (mol L�1) 0.5 1.0 1.5
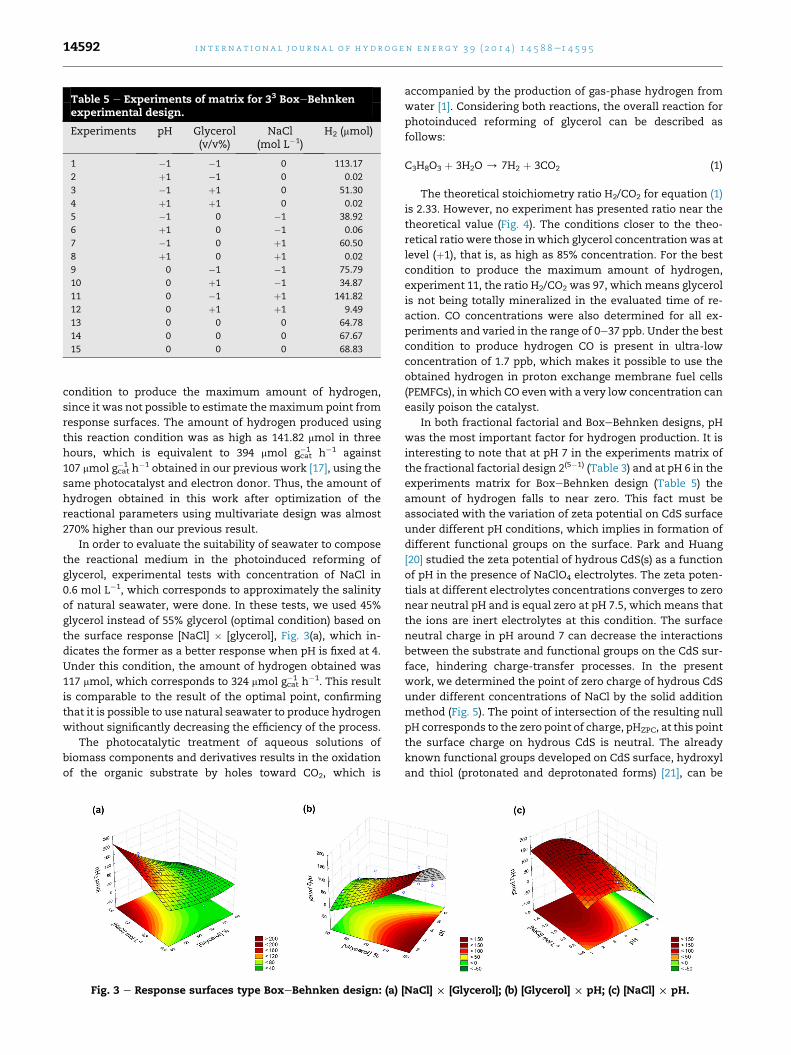
Table 5 e Experiments of matrix for 33 BoxeBehnkenexperimental design.
Experiments pH Glycerol(v/v%)
NaCl(mol L�1)
H2 (mmol)
1 �1 �1 0 113.17
2 þ1 �1 0 0.02
3 �1 þ1 0 51.30
4 þ1 þ1 0 0.02
5 �1 0 �1 38.92
6 þ1 0 �1 0.06
7 �1 0 þ1 60.50
8 þ1 0 þ1 0.02
9 0 �1 �1 75.79
10 0 þ1 �1 34.87
11 0 �1 þ1 141.82
12 0 þ1 þ1 9.49
13 0 0 0 64.78
14 0 0 0 67.67
15 0 0 0 68.83
i n t e rn a t i o n a l j o u r n a l o f h y d r o g e n en e r g y 3 9 ( 2 0 1 4 ) 1 4 5 8 8e1 4 5 9 514592
condition to produce the maximum amount of hydrogen,
since it was not possible to estimate themaximumpoint from
response surfaces. The amount of hydrogen produced using
this reaction condition was as high as 141.82 mmol in three
hours, which is equivalent to 394 mmol gcat�1 h�1 against
107 mmol gcat�1 h�1 obtained in our previous work [17], using the
same photocatalyst and electron donor. Thus, the amount of
hydrogen obtained in this work after optimization of the
reactional parameters using multivariate design was almost
270% higher than our previous result.
In order to evaluate the suitability of seawater to compose
the reactional medium in the photoinduced reforming of
glycerol, experimental tests with concentration of NaCl in
0.6 mol L�1, which corresponds to approximately the salinity
of natural seawater, were done. In these tests, we used 45%
glycerol instead of 55% glycerol (optimal condition) based on
the surface response [NaCl] � [glycerol], Fig. 3(a), which in-
dicates the former as a better response when pH is fixed at 4.
Under this condition, the amount of hydrogen obtained was
117 mmol, which corresponds to 324 mmol gcat�1 h�1. This result
is comparable to the result of the optimal point, confirming
that it is possible to use natural seawater to produce hydrogen
without significantly decreasing the efficiency of the process.
The photocatalytic treatment of aqueous solutions of
biomass components and derivatives results in the oxidation
of the organic substrate by holes toward CO2, which is
Fig. 3 e Response surfaces type BoxeBehnken design: (a)
accompanied by the production of gas-phase hydrogen from
water [1]. Considering both reactions, the overall reaction for
photoinduced reforming of glycerol can be described as
follows:
C3H8O3 þ 3H2O / 7H2 þ 3CO2 (1)
The theoretical stoichiometry ratio H2/CO2 for equation (1)
is 2.33. However, no experiment has presented ratio near the
theoretical value (Fig. 4). The conditions closer to the theo-
retical ratio were those in which glycerol concentrationwas at
level (þ1), that is, as high as 85% concentration. For the best
condition to produce the maximum amount of hydrogen,
experiment 11, the ratio H2/CO2 was 97, which means glycerol
is not being totally mineralized in the evaluated time of re-
action. CO concentrations were also determined for all ex-
periments and varied in the range of 0e37 ppb. Under the best
condition to produce hydrogen CO is present in ultra-low
concentration of 1.7 ppb, which makes it possible to use the
obtained hydrogen in proton exchange membrane fuel cells
(PEMFCs), in which CO evenwith a very low concentration can
easily poison the catalyst.
In both fractional factorial and BoxeBehnken designs, pH
was the most important factor for hydrogen production. It is
interesting to note that at pH 7 in the experiments matrix of
the fractional factorial design 2(5�1) (Table 3) and at pH 6 in the
experiments matrix for BoxeBehnken design (Table 5) the
amount of hydrogen falls to near zero. This fact must be
associated with the variation of zeta potential on CdS surface
under different pH conditions, which implies in formation of
different functional groups on the surface. Park and Huang
[20] studied the zeta potential of hydrous CdS(s) as a function
of pH in the presence of NaClO4 electrolytes. The zeta poten-
tials at different electrolytes concentrations converges to zero
near neutral pH and is equal zero at pH 7.5, which means that
the ions are inert electrolytes at this condition. The surface
neutral charge in pH around 7 can decrease the interactions
between the substrate and functional groups on the CdS sur-
face, hindering charge-transfer processes. In the present
work, we determined the point of zero charge of hydrous CdS
under different concentrations of NaCl by the solid addition
method (Fig. 5). The point of intersection of the resulting null
pH corresponds to the zero point of charge, pHZPC, at this point
the surface charge on hydrous CdS is neutral. The already
known functional groups developed on CdS surface, hydroxyl
and thiol (protonated and deprotonated forms) [21], can be
[NaCl] £ [Glycerol]; (b) [Glycerol] £ pH; (c) [NaCl] £ pH.

Fig. 4 e Ratios of H2/CO2 and amount of CO produced in each experiment of BoxeBehnken experimental design.
i n t e r n a t i o n a l j o u r n a l o f h y d r o g e n en e r g y 3 9 ( 2 0 1 4 ) 1 4 5 8 8e1 4 5 9 5 14593
identified in some regions of the curves in Fig. 5. For suspen-
sion without the addition of NaCl the pHZPC is 6.4, which
means that the functional groups on surface are >CdSH and
>CdOH. Fig. 5 shows that, in general, the pHZPC progressively
increases as increases the NaCl concentration, varying from
6.2 to 8.4. At lower pH, the protonated functional groups are
predominant, >CdSH2þ (pH 4.1e4.3), more acid group, and
>CdOH2þ (pH 5.8e7.7); while at higher pH are present the
deprotonated forms, >CdS� (pH 7.3e7.7) and >CdO� (pH
8.9e9.9). The equilibrium among the different forms of func-
tional groups on hydrous CdS can be expressed as follows:
>CdSHþ2%>CdSH þ Hþ (2)
>CdSH%>CdS�þHþ (3)
Fig. 5 e Functional groups and zero point of charge of
hydrous CdS in presence of different concentrations of
NaCl: (a) >CdSH2þ and >CdOH; (b) >CdOH2
þ and >CdSH; (c)
>CdS¡ and >CdOH; (d) >CdO¡ and >CdS¡; (e) pHZPC.
>CdOHþ2%>CdOHþHþ (4)
>CdOH%>CdO�þHþ (5)
As can be seen in Fig. 4, at strong acid conditions, there is
no considerable difference between initial and final pH
(DpH z 0), indicating that there is no considerable surface
charge on hydrous CdS. However, at pH around 4, a large DpH
was observed and increases with increasing NaCl concentra-
tion and it becomes maximum at 1.5 mol L�1. The progressive
increasing in positive charge surface on hydrous CdS suggests
that the presence of electrolytes favors the surface proton-
ation and chloride ions are not efficiently adsorbed under high
NaCl concentration. However, the effect at high pH is oppo-
site, the negative charge decreases as increases NaCl con-
centration, suggesting that sodium ions are efficiently
adsorbed under these conditions.
The optimal experimental conditions found using multi-
variate design established pH 4 as the ideal pH for the
maximum hydrogen production. According to surface chem-
ical study of hydrous CdS the predominant species at pH 4,
before irradiation, are > CdSH2þand >CdOH, indicating that
such species play an important role in the primary steps of the
photoelectrochemical mechanism. Under irradiation,
>CdSH2þand >CdOH sites can combine with photogenerated
electron-hole pair according to reactions (6) and (8), yielding
trapped electron and hole, >CdSH and >CdOHþ, which are
involved in generation of reactive radicals, reactions (7) and
(10). Additionally, in the present work, the hydrogen produc-
tion is lower at high pH and is higher at low pH, indicating that
oxidation mechanism of the electron donor does not take
place via dissociation in aqueous solution, probably, because
of the low acidity of glycerol (pKa ¼ 14.2). A possible mecha-
nism for glycerol photooxidation is an initiation at surface-
trapped holes, >CdSHþ and >CdOHþ, via primary carbon to
yield glyceraldehydes [17], equations (7)e(9). A proposed

i n t e rn a t i o n a l j o u r n a l o f h y d r o g e n en e r g y 3 9 ( 2 0 1 4 ) 1 4 5 8 8e1 4 5 9 514594
mechanism compatible with this discussion is presented
below:
>CdSHþ2 ���!
e�>CdSHþ $H (6)
>CdSH���!hþ>CdSHþ
���������������!H2COHCHOHCH2OH>CdSHþ
2
þH2COHCHOH$CHOH(7)
>CdOH���!hþ>CdOHþ
���������������!H2COHCHOHCH2OH>CdOHþ
2
þH2COHCHOH$CHOH(8)
2 H2COHCHOH$CHOH / H2COHCHOHCHO þ H2 (9)
>CdOHþ2 ���!
eþ>CdOHþ $H (10)
2$H/H2 (11)
The generated hydrogen radicals, equations (6) and (10),
can combine at platinum nanoparticles photodeposited on
CdS surface to produce molecular hydrogen, equation (11).
The active sites, >CdSH2þ and >CdOH, are then regenerated
in reactions (7) and (10). However, it is well known that CdS
is prone to photocorrosion in aqueous environments by the
photogenerated holes [22,23]. In order to evaluate the cad-
mium leaching three selected samples of liquid phase were
submitted to cadmium analysis by ICP-OES. Such samples
were the liquid effluents from experiments 1 and 11 of the
BoxeBehnken experimental design with higher hydrogen
production, samples A and B, respectively, and the experi-
ment with seawater simulation, sample C. The results
shown in Table 6 reveal high cadmium leaching, mainly in
lower pH condition. Meanwhile, one can also see a clear
tendency in an increase of CdS stability by adjustment of
pH, salinity and glycerol concentration because it reduces
the solubility of CdS in aqueous solution. This tendency
confirms the results obtained from the first fractional
factorial design that revealed the electrolyte and glycerol
ratio in the mixture influences the amount of CdS required
for higher production of hydrogen. The association of the
results obtained in this study with alternatives that have
been proposed to improve the resistance to CdS photo-
corrosion, such as the replacement of some cadmium atoms
by zinc atoms in the crystal structure [11,22,23], may result
in a highly efficient system regarding production of renew-
able hydrogen and with the desired stability at the reaction
conditions.
Table 6 e Results of cadmium leachinganalysis from liquid effluents of selectedsamples. A: Experiment 1 (BoxeBehnkenexperimental design); B: Experiment 11(BoxeBehnken experimental design); andC: Experiment with Seawater simulation.
Sample Leached Cd (%)
A 10.3 ± 0.2
B 5.24 ± 0.01
C 3.8 ± 6.1 � 10�3
Conclusions
Our results demonstrated that the experimental design is a
powerful tool to evaluate the influence of each reaction
parameter and their interactions in the photoinduced
reforming of glycerol over hex-CdS photocatalyst. With this
study it was possible to set the ideal conditions for enhance-
ment of hydrogen production without any structure,
morphology or composition modification in the photocatalyst
as well as confirm the positive effect of electrolytes addition
for producing hydrogen and the viability for using natural
seawater in photoinduced reforming of a biomass derivative.
Additionally, our results open up perspectives to increase CdS
stability in hydrous environments by adjustment of pH,
salinity and glycerol concentration to reduce the solubility of
CdS in aqueous solution.
Acknowledgments
The authors acknowledge the Brazilian research funding
agencies Conselho Nacional de Desenvolvimento Cientıfico e
Tecnol�ogico (CNPq) and Fundac~ao de Amparo �a Pesquisa do
Estado da Bahia (FAPESB), grant number APP0046/2011, for
financial support.
r e f e r e n c e s
[1] Melo MO, Silva LA. Photocatalytic production of hydrogen: aninnovative use for biomass derivatives. J Braz Chem Soc2011;22:1399e406.
[2] Kondarides DI, Daskalaki VM, Patsoura A, Verykios XE.Hydrogen production by photo-induced reforming ofbiomass components and derivatives at ambient conditions.Catal Lett 2008;122:26e32.
[3] Wu GP, Chen T, Zhou GH, Zong X, Li C. H2 production withlow CO selectivity from photocatalytic reforming of glucoseon metal/TiO2 catalysts. Sci China Ser B-Chem2008;51:97e100.
[4] Daskalaki VM, Kondarides DI. Efficient production ofhydrogen by photo-induced reforming of glycerol at ambientconditions. Catal Today 2009;144:75e80.
[5] Panagiotopoulou P, Karamerou EE, Kondarides DI. Kineticsand mechanism of glycerol photo-oxidation and photo-reforming reactions in aqueous TiO2 and Pt/TiO2
suspensions. Catal Today 2013;209:91e8.[6] Strataki N, Bekiari V, Kondarides DI, Lianos P. Hydrogen
production by photocatalytic alcohol reforming employinghighly efficient nanocrystalline titania films. Appl Catal B2007;77:184e9.
[7] Fu X, Wang X, Leung DYC, Xue W, Ding Z, Huang H, et al.Photocatalytic reforming of glucose over La doped alkalitantalate photocatalysts for H2 production. Catal Commun2010;12:184e7.
[8] Fu X, Long J, Wang X, Leung DYC, Ding Z, Wu L, et al.Photocatalytic reforming of biomass: a systematic study ofhydrogen evolution from glucose solution. Int J HydrogenEnergy 2008;33:6484e91.
[9] Badawy MI, Ghaly MY, Ali MEM. Photocatalytic hydrogenproduction over nanostructured mesoporous titania fromolive mill wastewater. Desalination 2011;267:250e5.
i n t e r n a t i o n a l j o u r n a l o f h y d r o g e n en e r g y 3 9 ( 2 0 1 4 ) 1 4 5 8 8e1 4 5 9 5 14595
[10] Li Y, He F, Peng S, Gao D, Lu G, Li. Effects of electrolyte NaClon photocatalytic hydrogen evolution in the presence ofelectron donors over Pt/TiO2. J Mol Catal A Chem2011;341:71e6.
[11] Li Y, Gao D, Peng S, Lu G, Li S. Photocatalytic hydrogenevolution over Pt/Cd0.5Zn0.5S from saltwater using glucose aselectron donor: an investigation of the influence ofelectrolyte NaCl. Int J Hydrogen Energy 2011;36:4291e7.
[12] Luo N, Jiang Z, Shi H, Cao F, Xiao T, Edwards PP.Photocatalytic conversion of oxygenated hydrocarbons tohydrogen over heteroatom-doped TiO2 catalysis. Int JHydrogen Energy 2009;34:125e9.
[13] Michael Bowker. Sustainable hydrogen production by theapplication of ambient temperature photocatalysis. GreenChem 2011;13:2235e46.
[14] Lopes WA, da Rocha GO, Pereira PAP, Oliveira FS,Carvalho LS, Bahia NC, et al. Multivariate optimization of aGCeMS method for determination of sixteen prioritypolycyclic aromatic hydrocarbons in environmentalsamples. J Sep Sci 2008;31:1787e96.
[15] Ferreira SLC, Bruns RE, da Silva EGP, dos Santos WNL,Quintella CM, David JM, et al. Statistical designs andresponse surface techniques for the optimization ofchromatographic systems. J Chromatogr A 2007;1158:2e14.
[16] de Arag~ao NM, Veloso MCC, Bispo MS, Ferreira SLC, deAndrade JB. Multivariate optimisation of the experimentalconditions for determination of three methylxanthines by
reversed-phase high-performance liquid chromatography.Talanta 2005;67:1007e13.
[17] Melo MO, Silva LA. Visible light-induced hydrogenproduction from glycerol aqueous solution on hybridPteCdSeTiO2 photocatalysts. J Photochem Photobio A Chem2011;226:36e41.
[18] Maia DLS, Pepe I, Ferreira da Silva A, Silva LA. Visible-light-driven photocatalytic hydrogen production over dye-sensitized b-BiTaO4. J Photochem Photobio A Chem2012;243:61e4.
[19] Vieira AP, Santana SAA, Bezerra CWB, Silva HAS, Chaves JAP,de Melo JCP, et al. Kinetics and thermodynamics of textiledye adsorption from aqueous solutions using babassucoconut mesocarp. J Hazard. Mater 2009;166:1272e8.
[20] Park SW, Huang CP. The surface acidity of hydrous CdS(s). JColloid Interface Sci 1987;117:431e41.
[21] Silva LA, Ryu SY, Choi J, Choi W, Hoffmann MR.Photocatalytic hydrogen production with visible light overPt-interlinked hybrid composites of cubic-phase andhexagonal-phase CdS. J Phys Chem C 2008;112:12069e73.
[22] Chen J, Sh Lin, Yan G, Yang L, Chen X. Preparation and itsphotocatalysis of Cd1�xZnxS nanosized solid solution withPAMAM as a template. Catal Commun 2008;9:65e9.
[23] Lyubina TP, Markovskaya DV, Kozlova EA, Parmon VN.Photocatalytic hydrogen evolution from aqueous solutions ofglycerol under visible light irradiation. Int J Hydrogen Energy2013;38:14172e9.