Embed Size (px)
Citation preview
1
The design of animal
experiments
Michael FW Festing c/o Understanding Animal Research, 25 Shaftsbury
Av. London, UK.
2
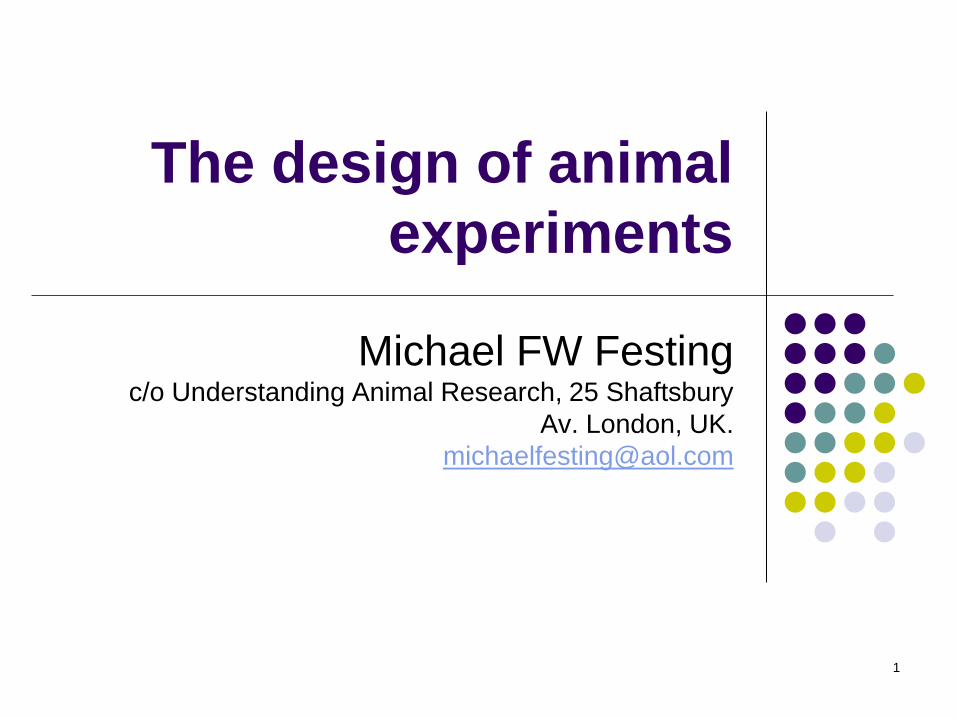
Replacement
e.g. in-vitro methods, less sentient animals Refinement
e.g. anaesthesia and analgesia, environmental
enrichment Reduction
Research strategy
Controlling variability
Experimental design and statistics
Principles of Humane Experimental
Technique
(Russell and Burch 1959)
3
A well designed experiment
Absence of bias Experimental unit, randomisation, blinding
High power Low noise (uniform material, blocking, covariance)
High signal (sensitive subjects, high dose)
Large sample size
Wide range of applicability Replicate over other factors (e.g. sex, strain): factorial
designs
Simplicity
Amenable to a statistical analysis
4
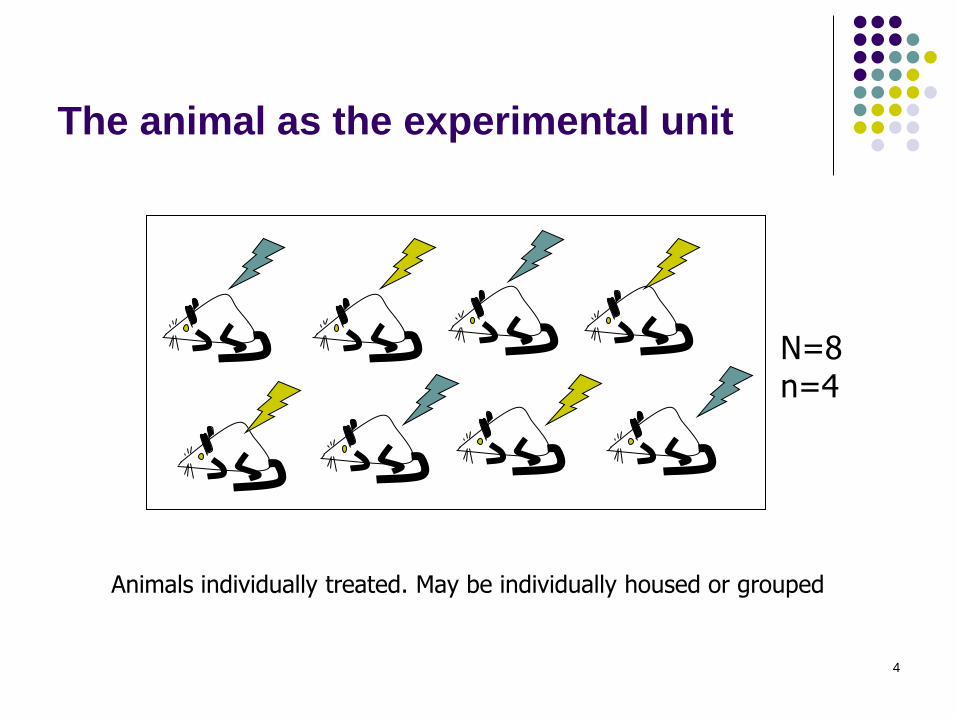
The animal as the experimental unit
Animals individually treated. May be individually housed or grouped
N=8 n=4
5
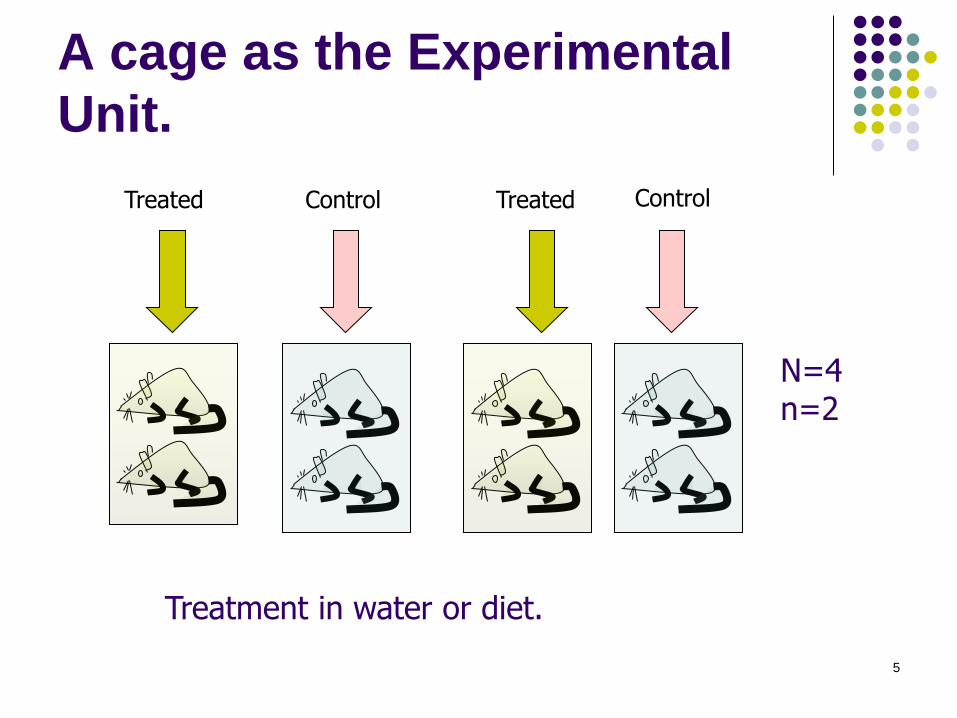
A cage as the Experimental
Unit.
Treatment in water or diet.
N=4 n=2
Treated Treated Control Control
6
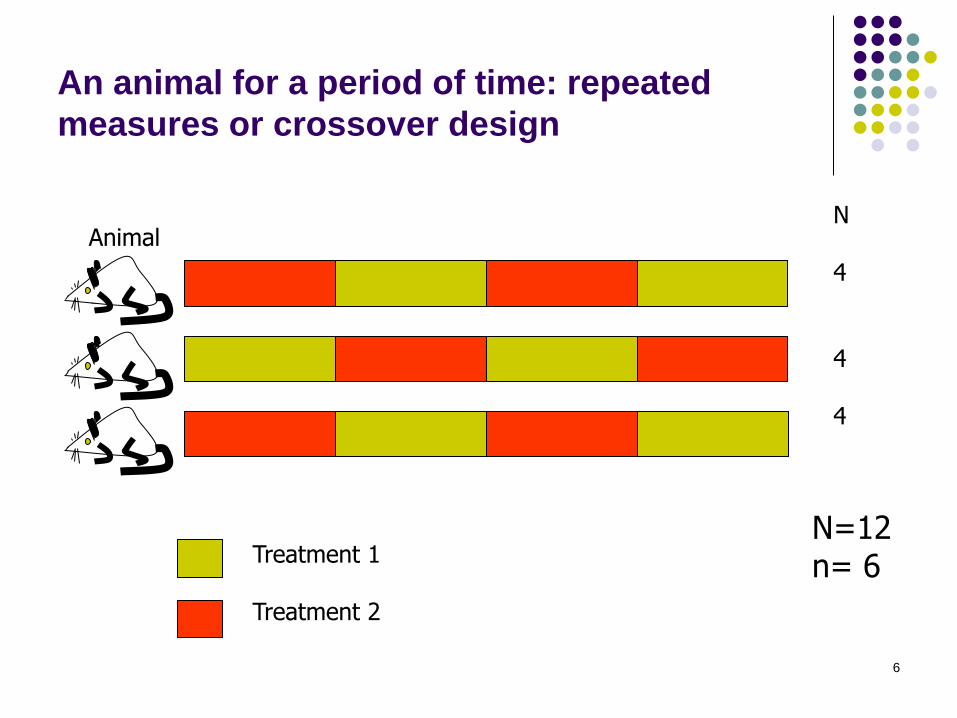
An animal for a period of time: repeated
measures or crossover design
Animal 1 2 3
Treatment 1 Treatment 2
N 4 4 4
N=12 n= 6
7
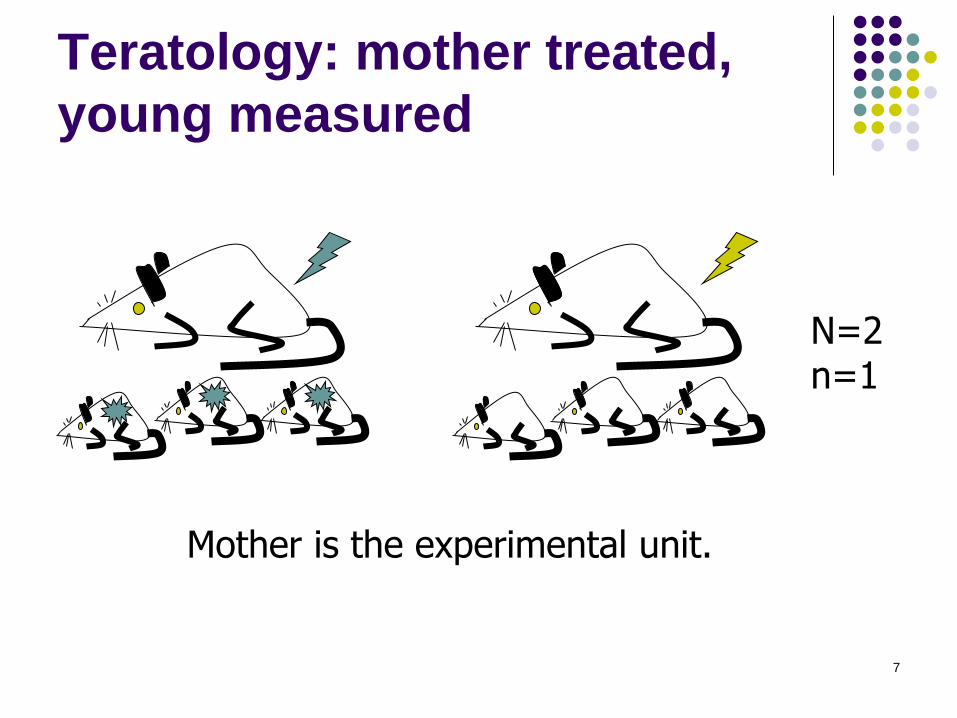
Teratology: mother treated,
young measured
Mother is the experimental unit.
N=2 n=1
8
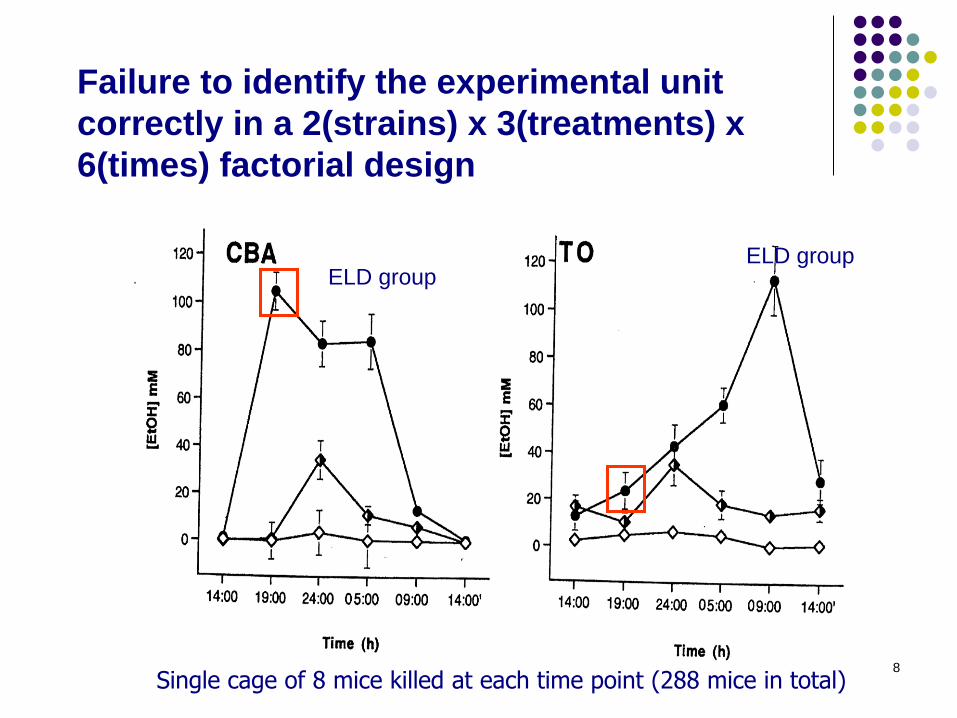
Failure to identify the experimental unit
correctly in a 2(strains) x 3(treatments) x
6(times) factorial design
ELD group ELD group
Single cage of 8 mice killed at each time point (288 mice in total)
9
Experimental units must be
randomised to treatments
Physical: numbers on cards. Shuffle and take
one
Tables of random numbers in most text
books
Use computer. e.g. EXCEL or a statistical
package such as MINITAB
10
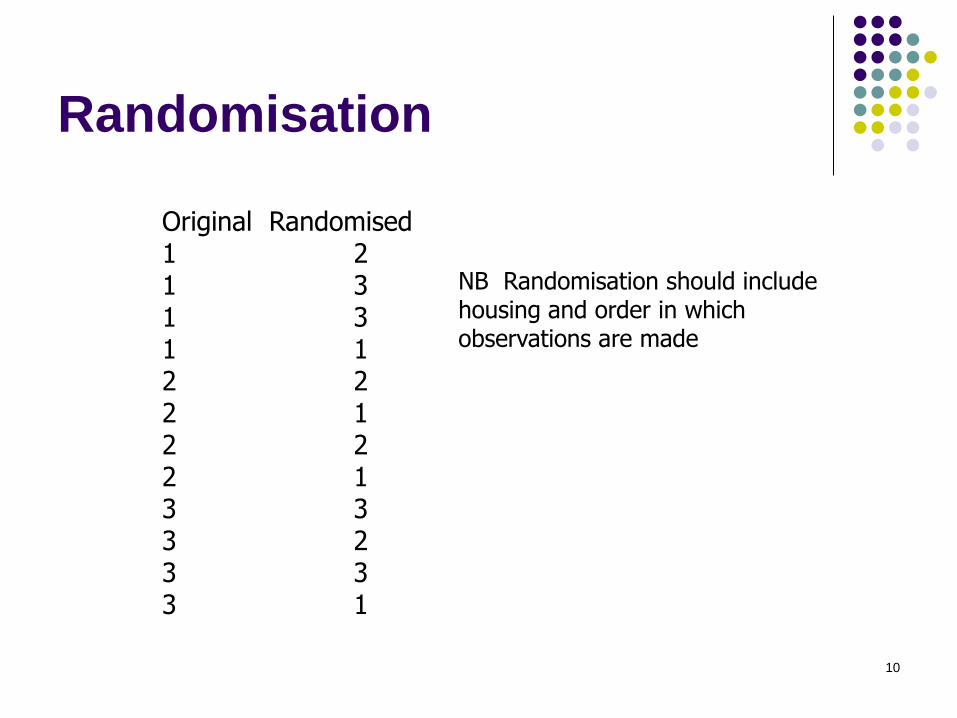
Randomisation
Original Randomised 1 2 1 3 1 3 1 1 2 2 2 1 2 2 2 1 3 3 3 2 3 3 3 1
NB Randomisation should include housing and order in which observations are made
11
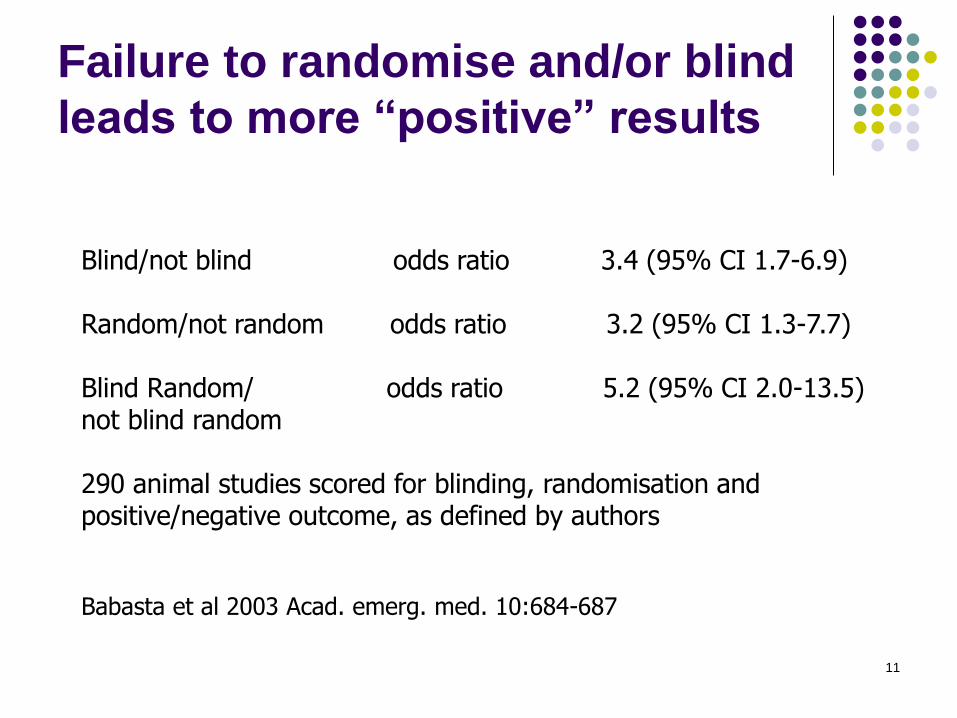
Failure to randomise and/or blind
leads to more “positive” results
Blind/not blind odds ratio 3.4 (95% CI 1.7-6.9) Random/not random odds ratio 3.2 (95% CI 1.3-7.7) Blind Random/ odds ratio 5.2 (95% CI 2.0-13.5) not blind random 290 animal studies scored for blinding, randomisation and positive/negative outcome, as defined by authors Babasta et al 2003 Acad. emerg. med. 10:684-687
12
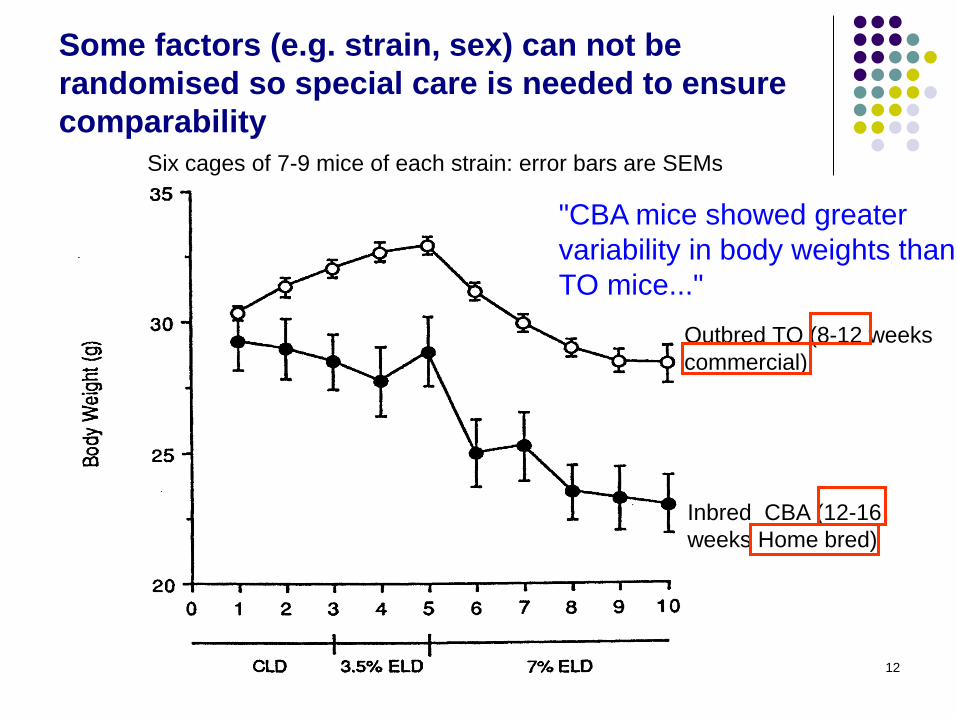
Some factors (e.g. strain, sex) can not be
randomised so special care is needed to ensure
comparability
Outbred TO (8-12 weeks
commercial)
Inbred CBA (12-16
weeks Home bred)
Six cages of 7-9 mice of each strain: error bars are SEMs
"CBA mice showed greater
variability in body weights than
TO mice..."
13
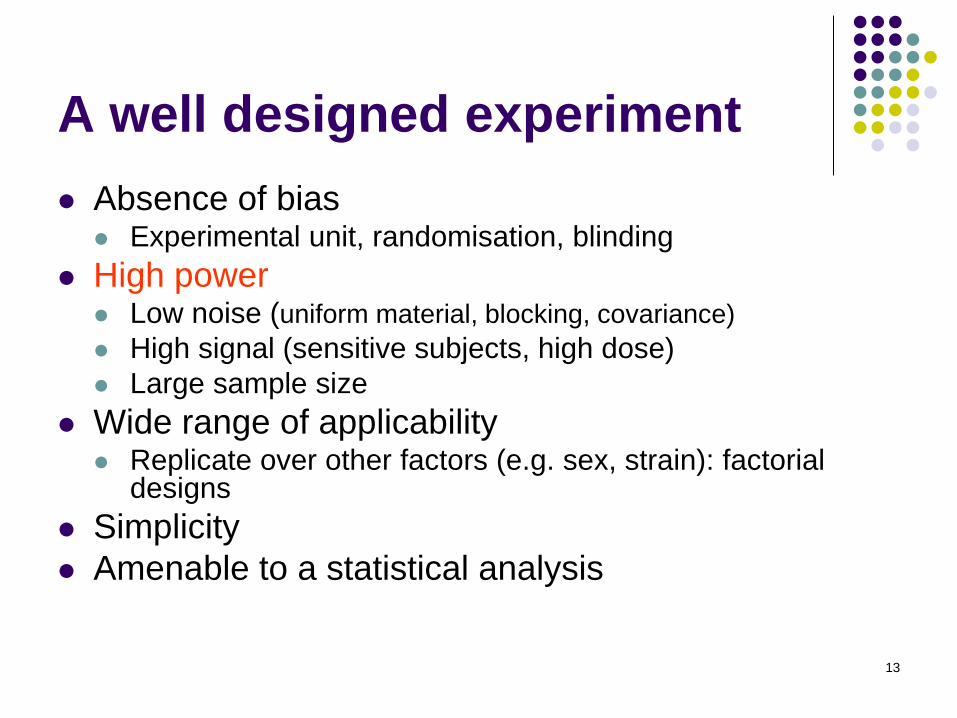
A well designed experiment
Absence of bias Experimental unit, randomisation, blinding
High power Low noise (uniform material, blocking, covariance)
High signal (sensitive subjects, high dose)
Large sample size
Wide range of applicability Replicate over other factors (e.g. sex, strain): factorial
designs
Simplicity
Amenable to a statistical analysis
14
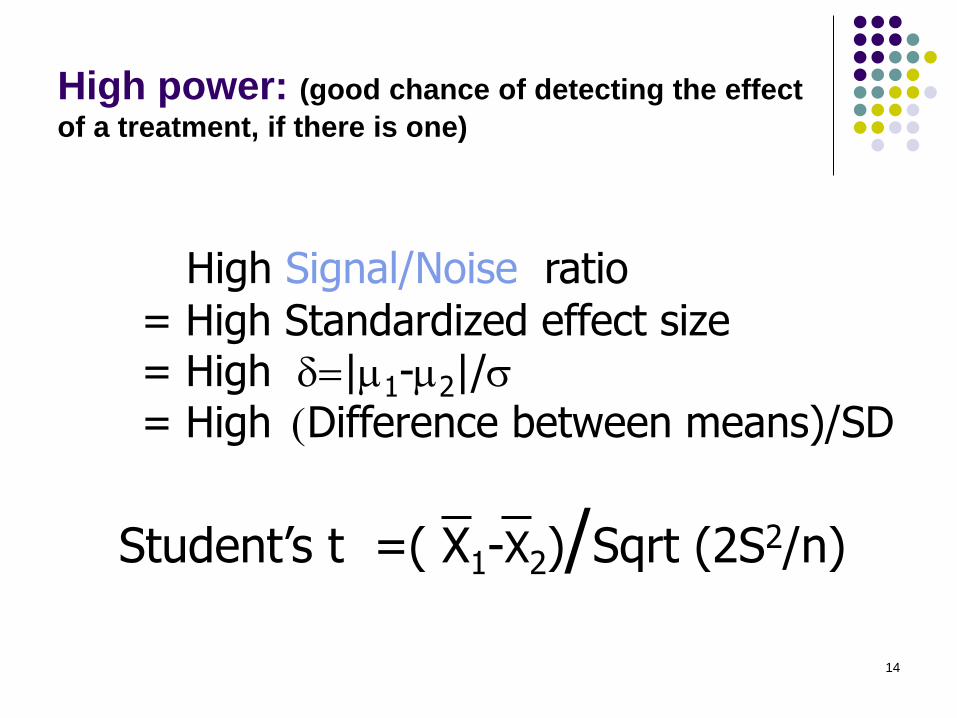
High power: (good chance of detecting the effect
of a treatment, if there is one)
High Signal/Noise ratio
= High Standardized effect size = High d=|m1-m2|/s
= High (Difference between means)/SD
Student’s t =( X1-X2)/Sqrt (2S2/n)
15
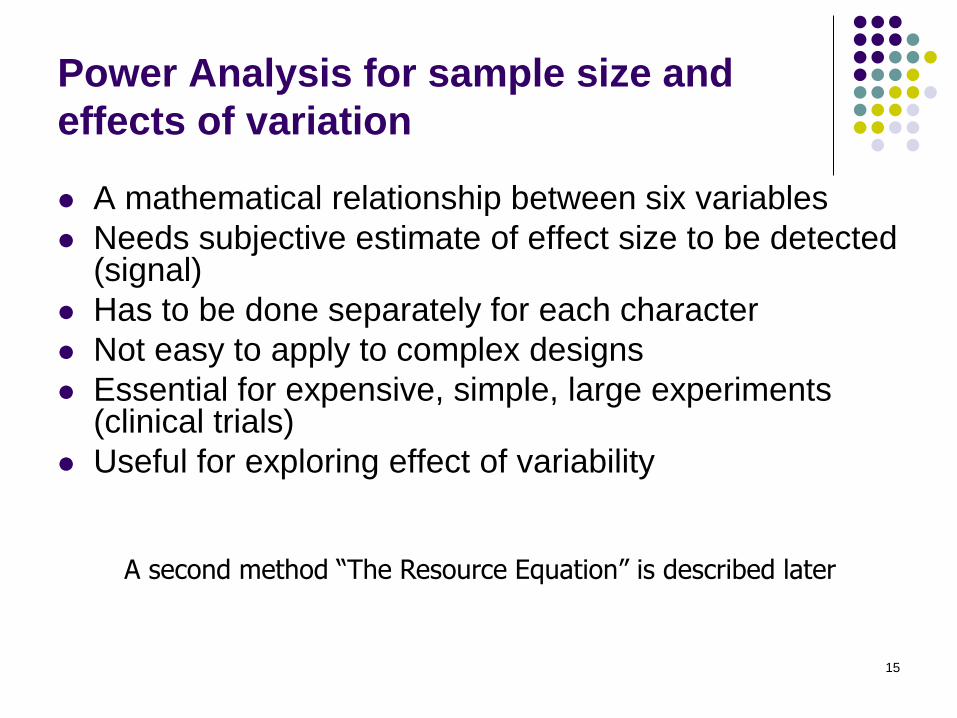
Power Analysis for sample size and
effects of variation
A mathematical relationship between six variables
Needs subjective estimate of effect size to be detected (signal)
Has to be done separately for each character
Not easy to apply to complex designs
Essential for expensive, simple, large experiments (clinical trials)
Useful for exploring effect of variability
A second method “The Resource Equation” is described later
16
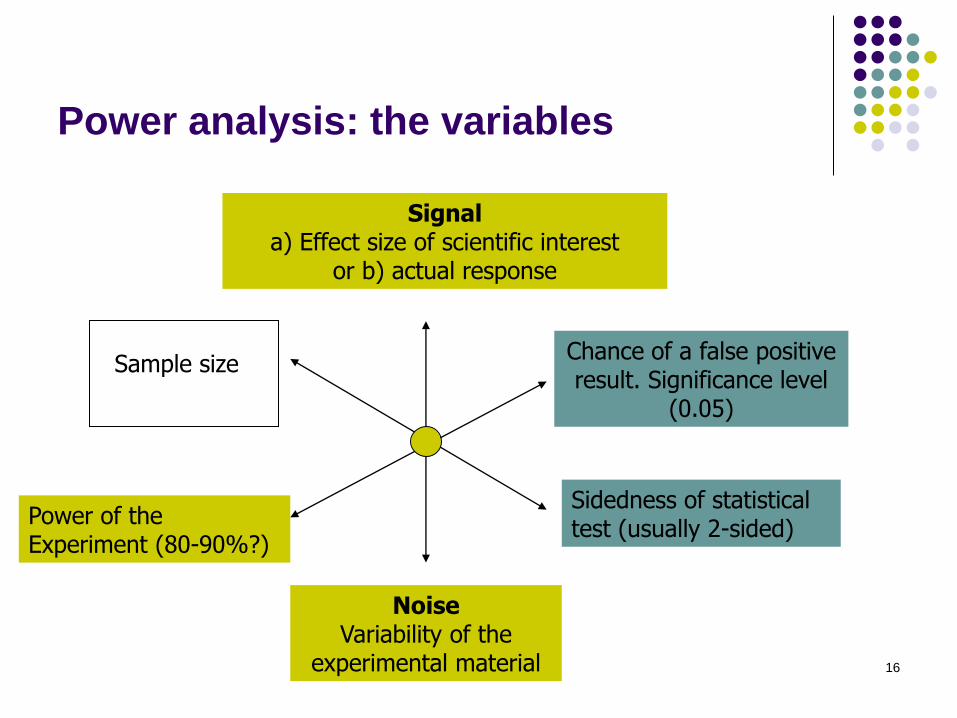
Power analysis: the variables
Sample size
Signal a) Effect size of scientific interest
or b) actual response
Chance of a false positive result. Significance level
(0.05)
Sidedness of statistical test (usually 2-sided)
Power of the Experiment (80-90%?)
Noise Variability of the
experimental material
17
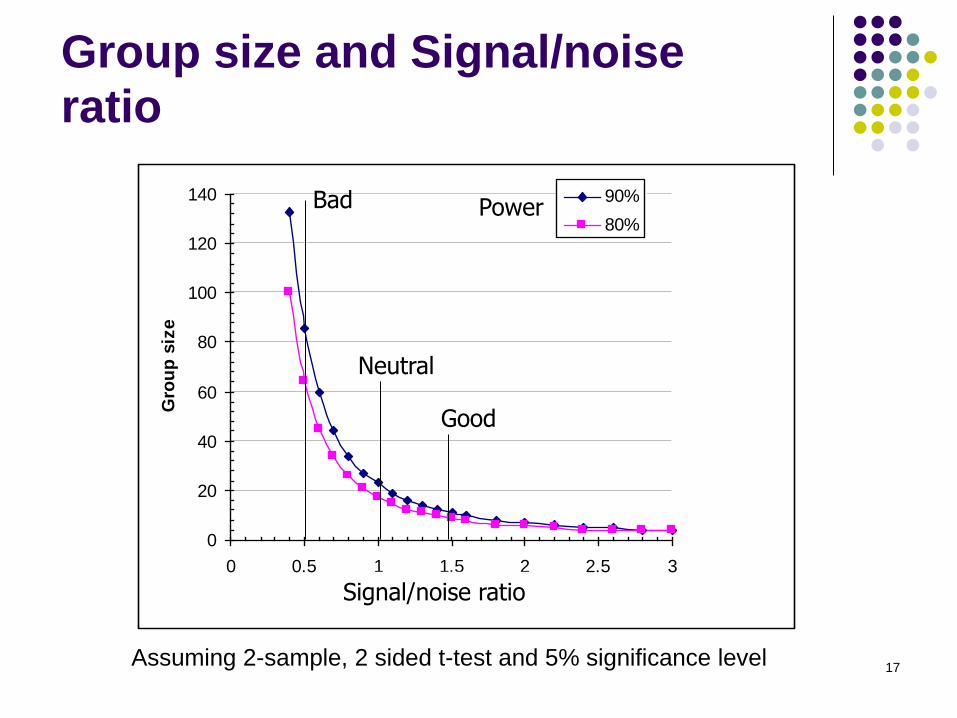
Group size and Signal/noise
ratio
0
20
40
60
80
100
120
140
0 0.5 1 1.5 2 2.5 3
Effect size (Std. Devs.)
Gro
up
siz
e
90%
80%
Assuming 2-sample, 2 sided t-test and 5% significance level
Signal/noise ratio
Power
Neutral
Bad
Good
18
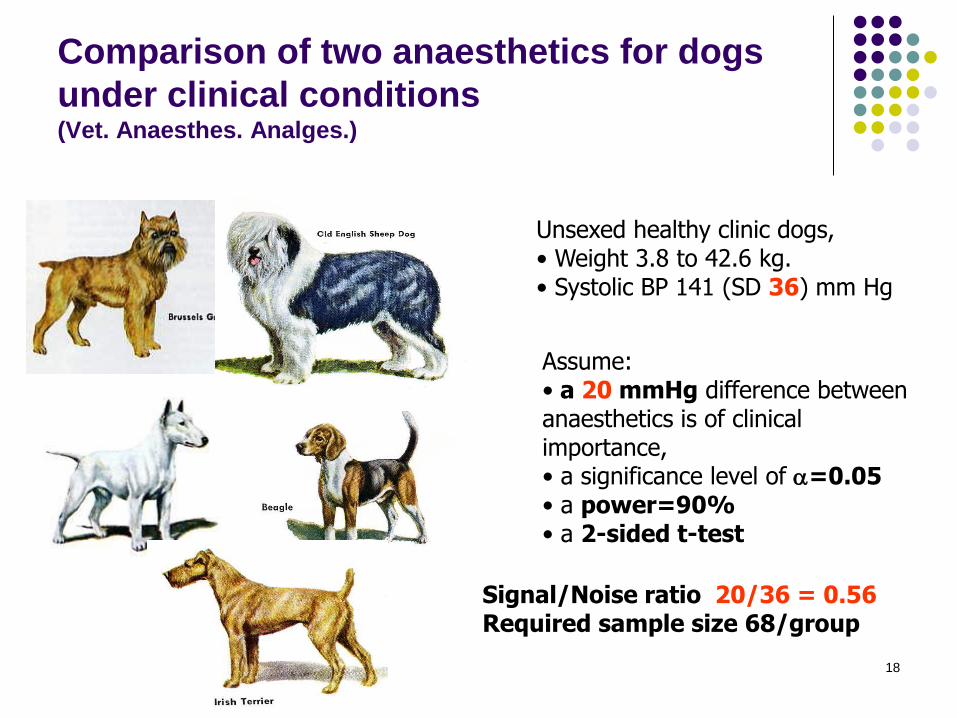
Comparison of two anaesthetics for dogs
under clinical conditions (Vet. Anaesthes. Analges.)
Unsexed healthy clinic dogs, • Weight 3.8 to 42.6 kg. • Systolic BP 141 (SD 36) mm Hg
Assume: • a 20 mmHg difference between anaesthetics is of clinical importance, • a significance level of a=0.05 • a power=90% • a 2-sided t-test
Signal/Noise ratio 20/36 = 0.56 Required sample size 68/group
19
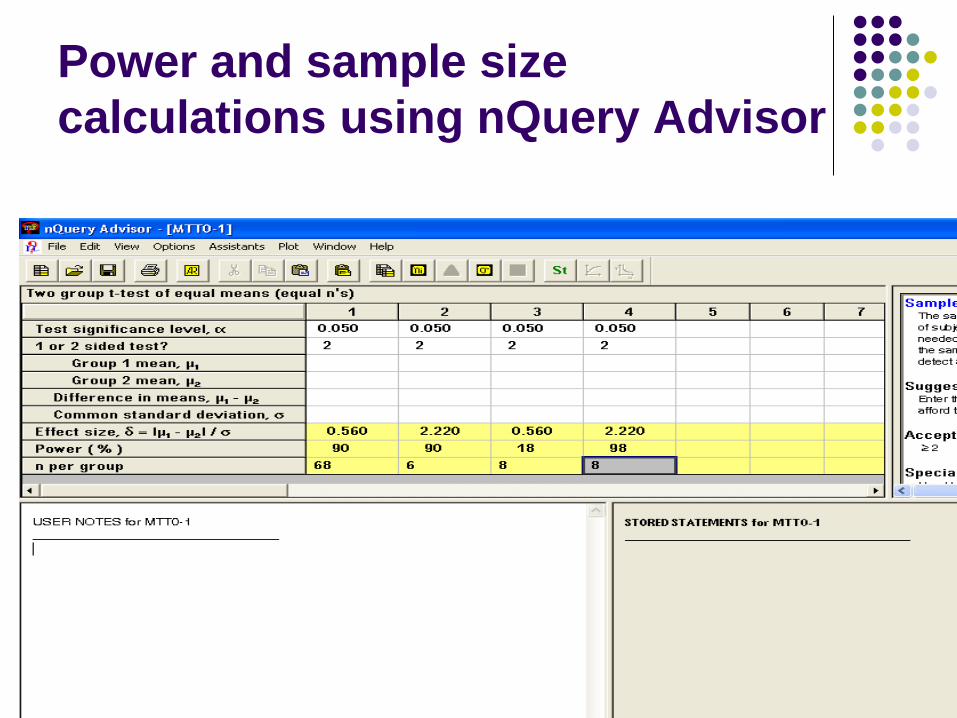
Power and sample size
calculations using nQuery Advisor
20
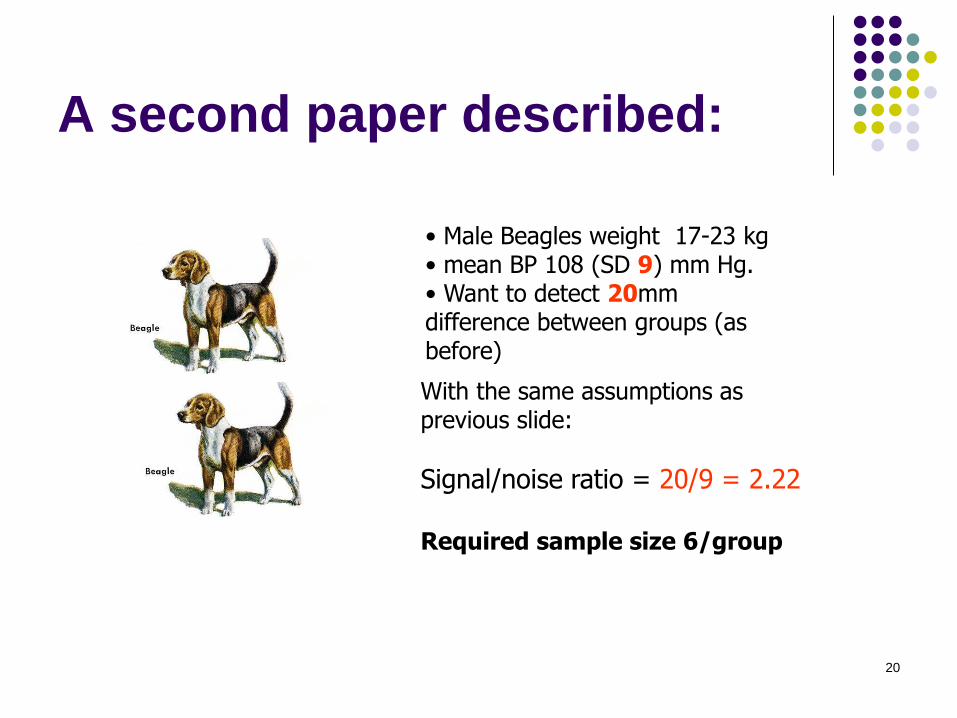
A second paper described:
• Male Beagles weight 17-23 kg • mean BP 108 (SD 9) mm Hg. • Want to detect 20mm difference between groups (as before)
With the same assumptions as previous slide:
Signal/noise ratio = 20/9 = 2.22 Required sample size 6/group
21
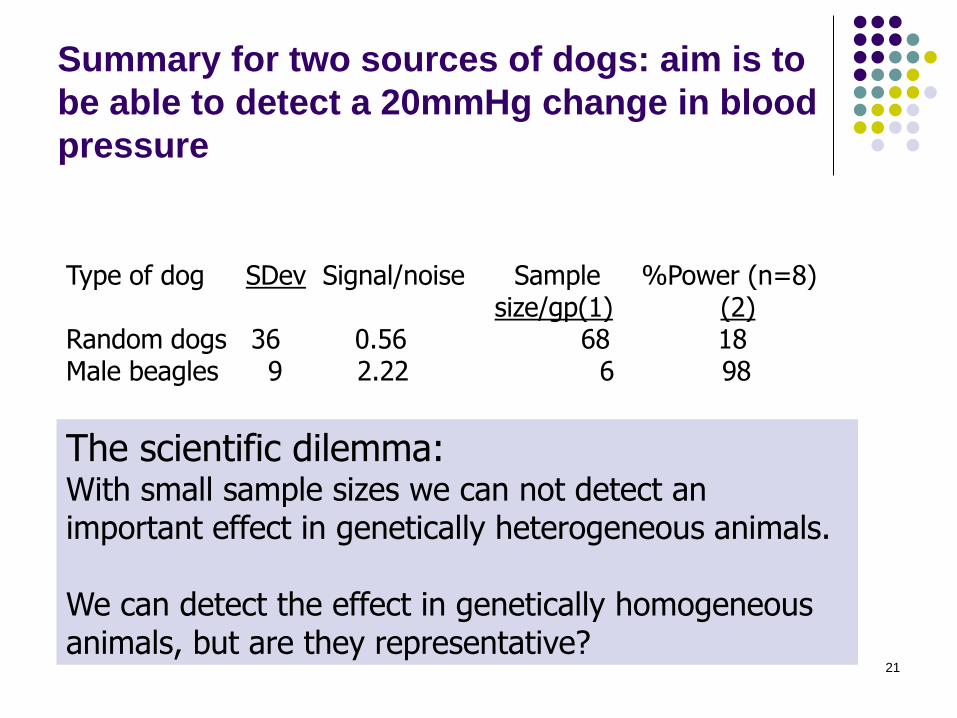
Summary for two sources of dogs: aim is to
be able to detect a 20mmHg change in blood
pressure
Type of dog SDev Signal/noise Sample %Power (n=8) size/gp(1) (2)
Random dogs 36 0.56 68 18 Male beagles 9 2.22 6 98 (1) Sample size: 90% power (2) Power, Sample size 8/group
Assumes a=5%, 2-sided t-test and effect size 20mmHg
The scientific dilemma: With small sample sizes we can not detect an important effect in genetically heterogeneous animals. We can detect the effect in genetically homogeneous animals, but are they representative?
22
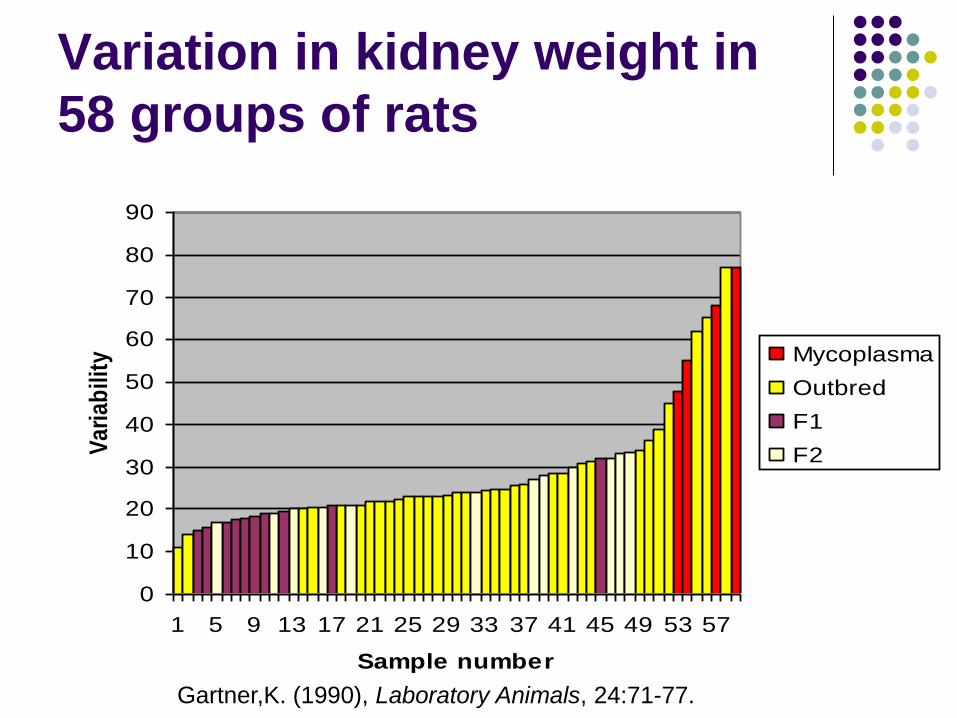
Variation in kidney weight in
58 groups of rats
0
10
20
30
40
50
60
70
80
90
1 5 9 13 17 21 25 29 33 37 41 45 49 53 57
Sample number
Va
ria
bil
ity Mycoplasma
Outbred
F1
F2
Gartner,K. (1990), Laboratory Animals, 24:71-77.
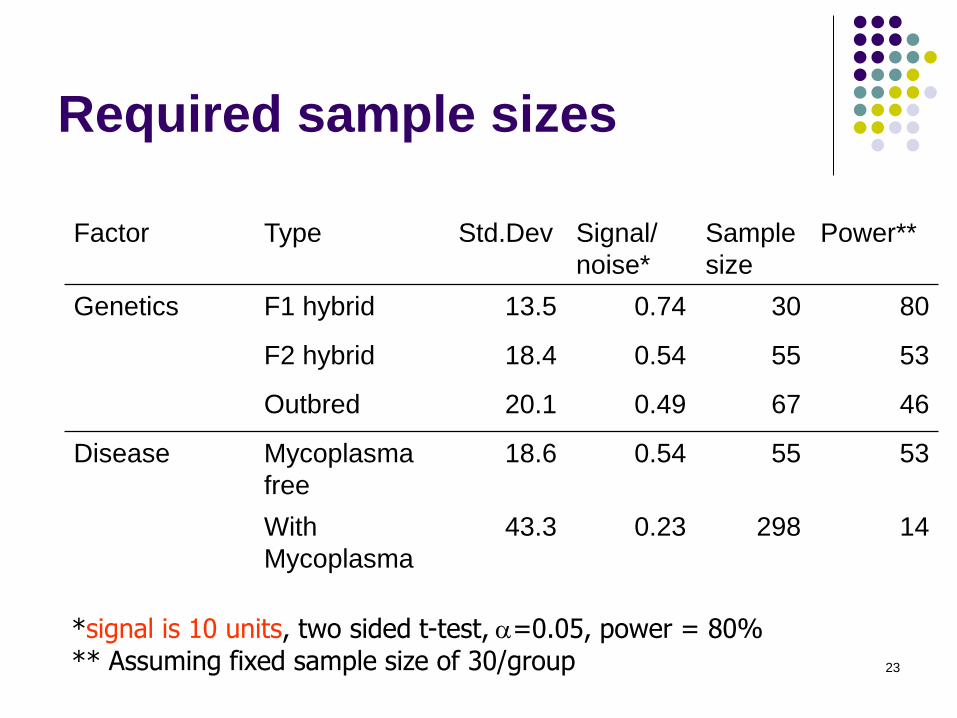
23
Required sample sizes
Factor Type Std.Dev Signal/
noise*
Sample
size
Power**
Genetics F1 hybrid 13.5 0.74 30 80
F2 hybrid 18.4 0.54 55 53
Outbred 20.1 0.49 67 46
Disease Mycoplasma
free
18.6 0.54 55 53
With
Mycoplasma
43.3 0.23 298 14
*signal is 10 units, two sided t-test, a=0.05, power = 80% ** Assuming fixed sample size of 30/group
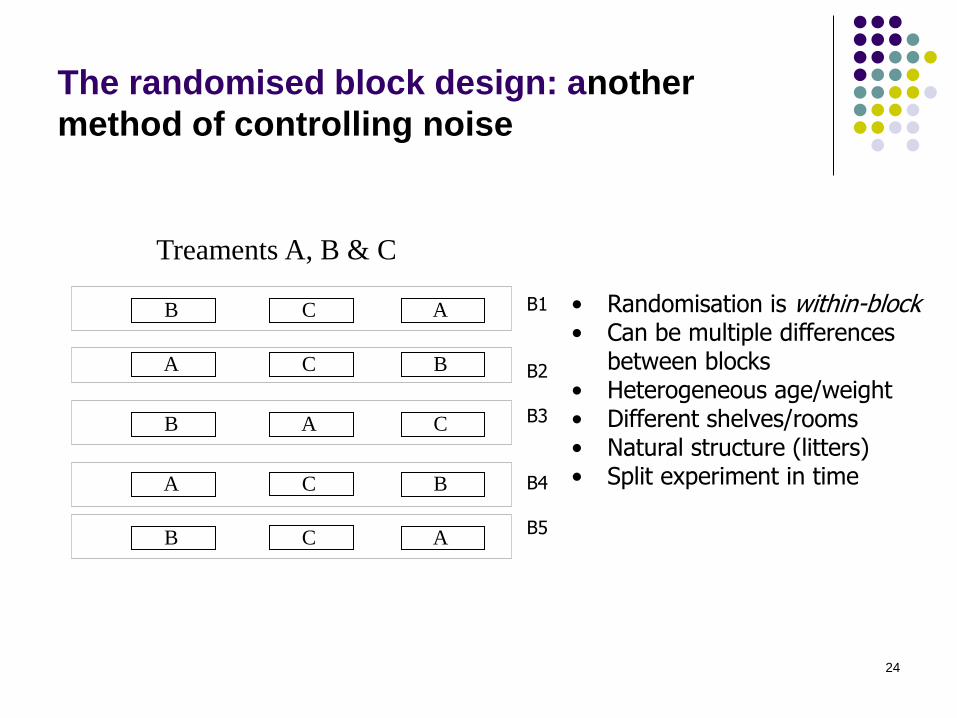
24
The randomised block design: another
method of controlling noise
B C A
A C B
B A C
A C B
B C A B1 B2 B3 B4 B5
Treaments A, B & C
• Randomisation is within-block • Can be multiple differences
between blocks • Heterogeneous age/weight • Different shelves/rooms • Natural structure (litters) • Split experiment in time
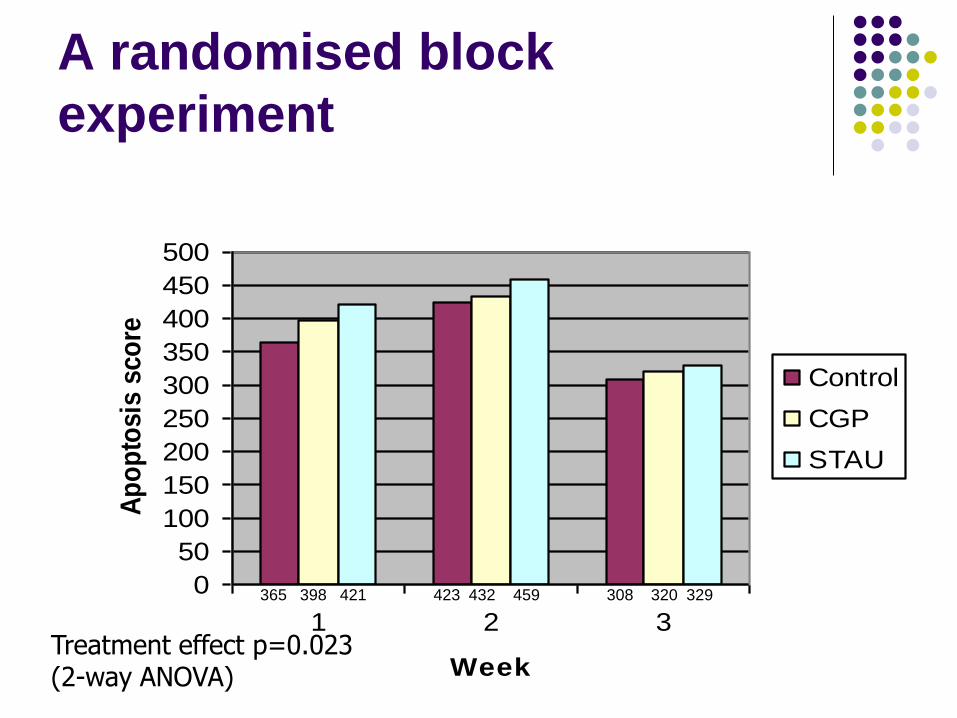
25
A randomised block
experiment
0
50
100
150
200
250
300
350
400
450
500
1 2 3
Week
Ap
op
tosis
sco
re
Control
CGP
STAU
365 398 421 423 432 459 308 320 329
Treatment effect p=0.023 (2-way ANOVA)
26
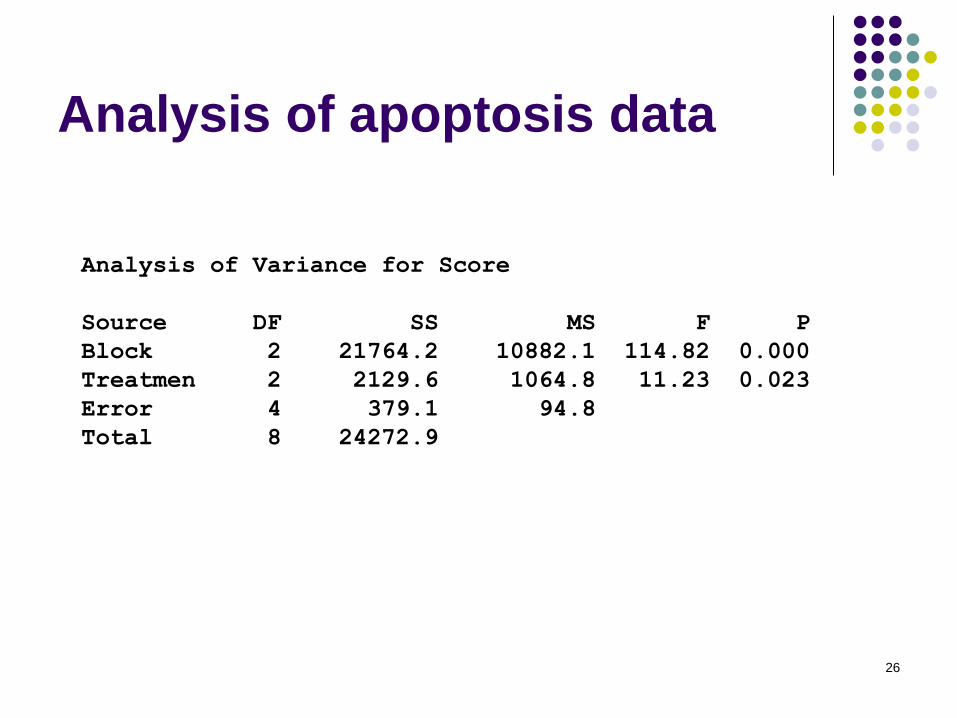
Analysis of apoptosis data
Analysis of Variance for Score
Source DF SS MS F P
Block 2 21764.2 10882.1 114.82 0.000
Treatmen 2 2129.6 1064.8 11.23 0.023
Error 4 379.1 94.8
Total 8 24272.9
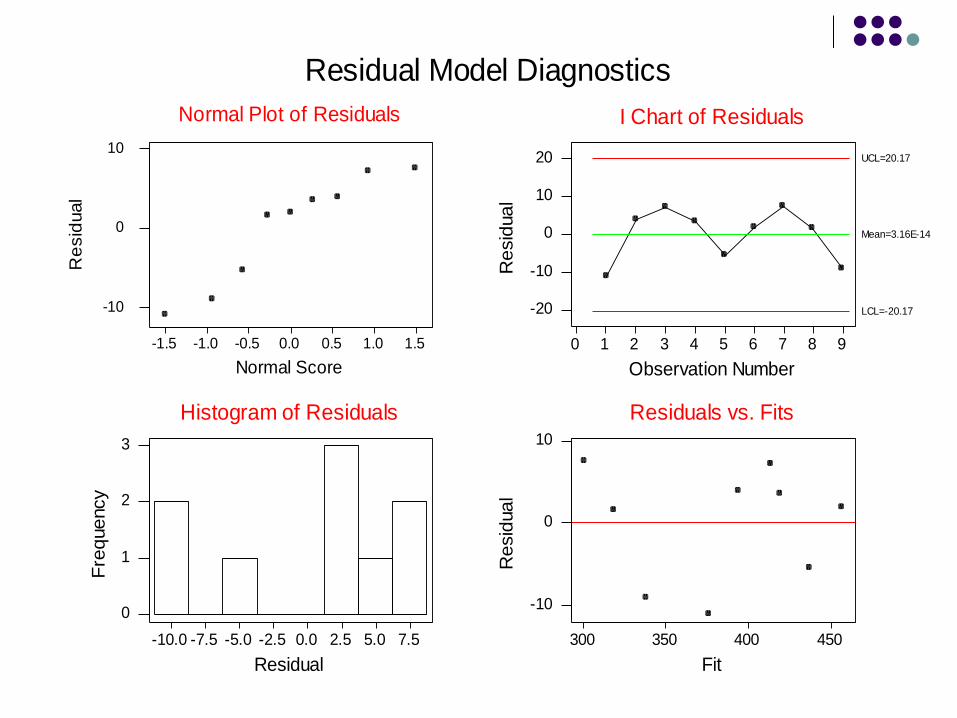
27
-10.0 -7.5 -5.0 -2.5 0.0 2.5 5.0 7.5
0
1
2
3
Residual
Fre
quency
Histogram of Residuals
0 1 2 3 4 5 6 7 8 9
-20
-10
0
10
20
Observation Number
Resid
ual
I Chart of Residuals
Mean=3.16E-14
UCL=20.17
LCL=-20.17
300 350 400 450
-10
0
10
Fit
Resid
ual
Residuals vs. Fits
-1.5 -1.0 -0.5 0.0 0.5 1.0 1.5
-10
0
10
Normal Plot of Residuals
Normal Score
Re
sid
ual
Residual Model Diagnostics
28
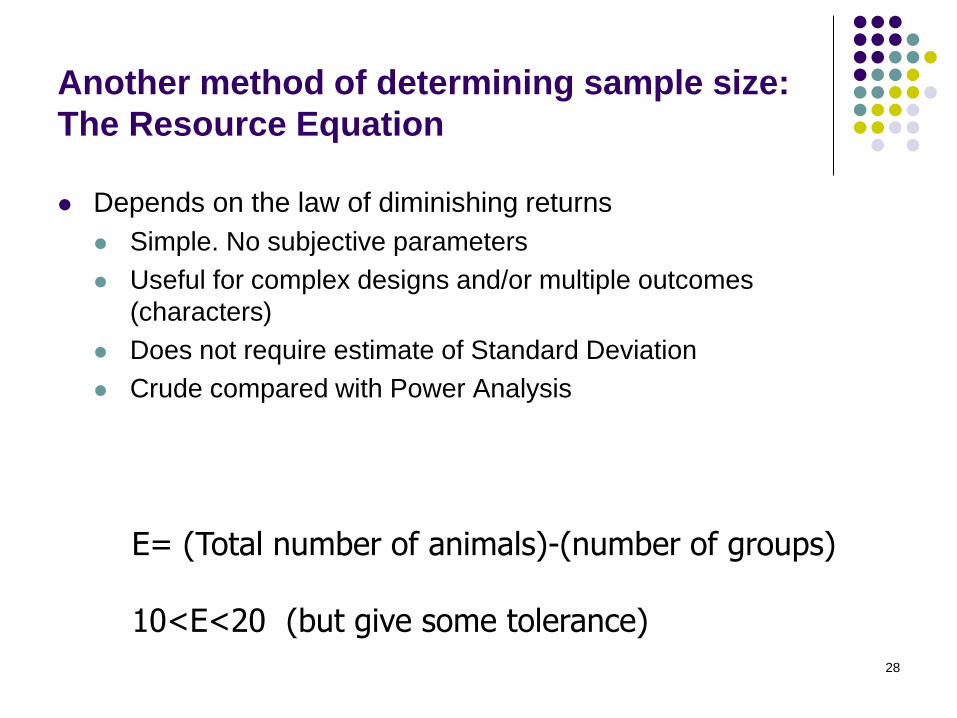
Another method of determining sample size:
The Resource Equation
Depends on the law of diminishing returns
Simple. No subjective parameters
Useful for complex designs and/or multiple outcomes
(characters)
Does not require estimate of Standard Deviation
Crude compared with Power Analysis
E= (Total number of animals)-(number of groups) 10<E<20 (but give some tolerance)
29
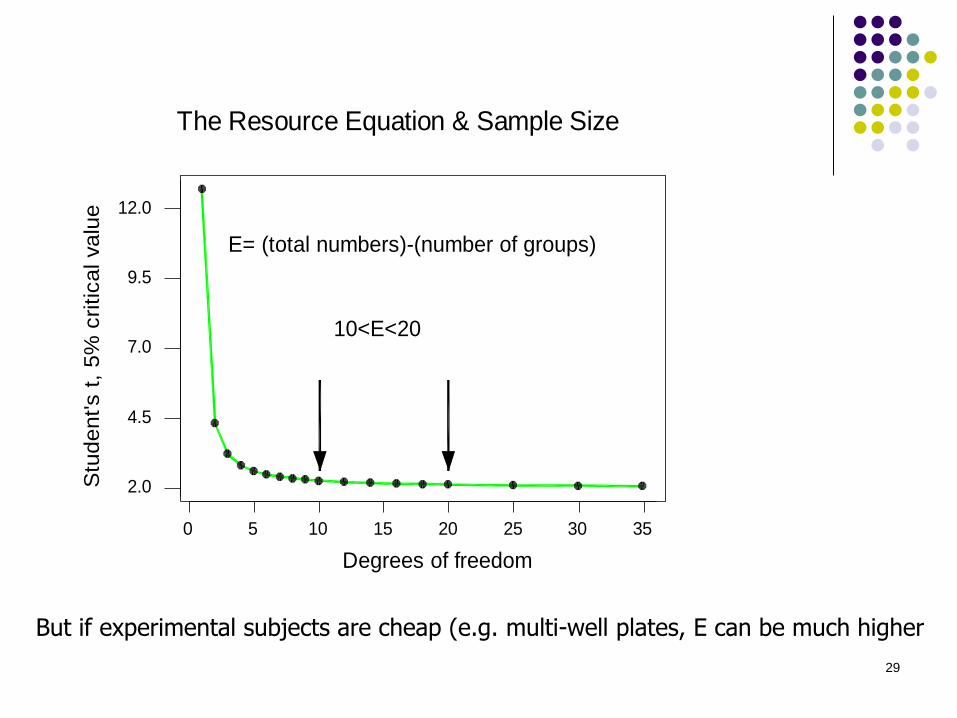
0 5 10 15 20 25 30 35
2.0
4.5
7.0
9.5
12.0
Degrees of freedom
Stu
den
t's t
, 5
% c
ritica
l valu
e
E= (total numbers)-(number of groups)
10<E<20
The Resource Equation & Sample Size
But if experimental subjects are cheap (e.g. multi-well plates, E can be much higher
30
A well designed experiment
Absence of bias Experimental unit, randomisation, blinding
High power Low noise (uniform material, blocking, covariance)
High signal (sensitive subjects, high dose)
Large sample size
Wide range of applicability Replicate over other factors to (e.g. sex, strain) to increase
generality: factorial designs
Simplicity
Amenable to a statistical analysis
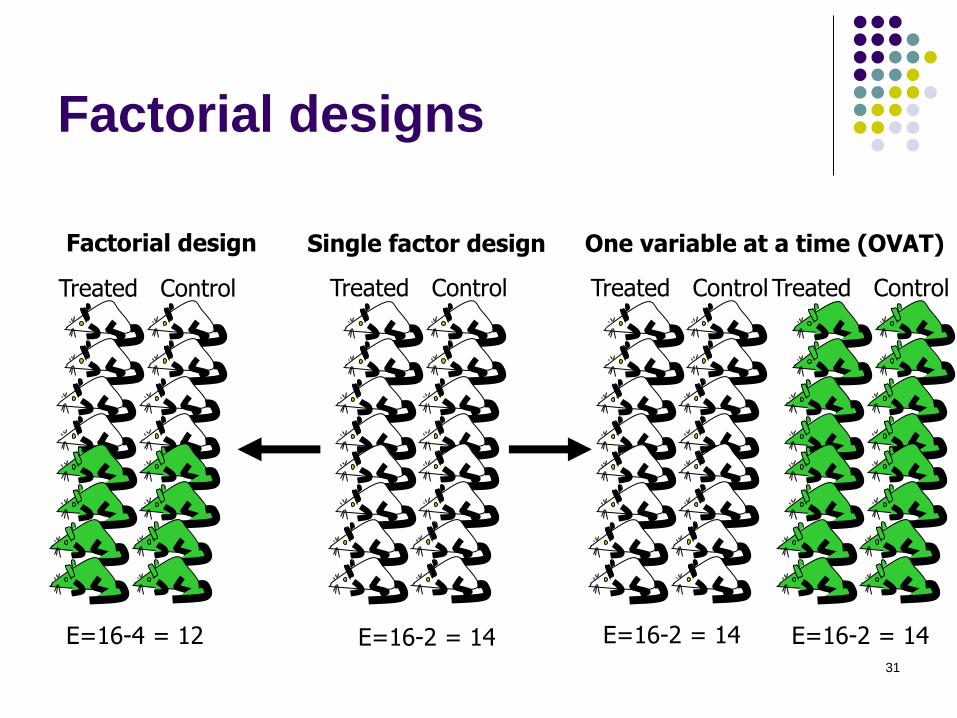
31
Factorial designs
Single factor design
Treated Control
E=16-2 = 14
One variable at a time (OVAT)
Treated Control Treated Control
E=16-2 = 14 E=16-2 = 14
Factorial design
Treated Control
E=16-4 = 12
32
Factorial designs
(By using a factorial design)”.... an experimental investigation, at the same time as it is made more comprehensive, may also be made more efficient if by more efficient we mean that more knowledge and a higher degree of precision are obtainable by the same number of observations.” R.A. Fisher, 1960
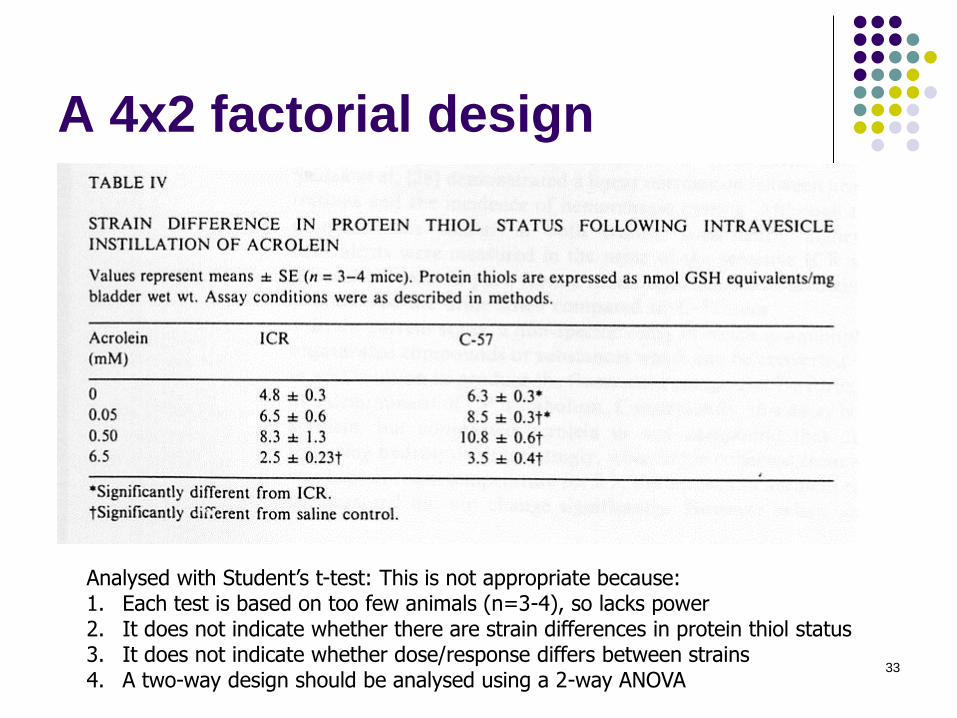
33
A 4x2 factorial design
Analysed with Student’s t-test: This is not appropriate because: 1. Each test is based on too few animals (n=3-4), so lacks power 2. It does not indicate whether there are strain differences in protein thiol status 3. It does not indicate whether dose/response differs between strains 4. A two-way design should be analysed using a 2-way ANOVA
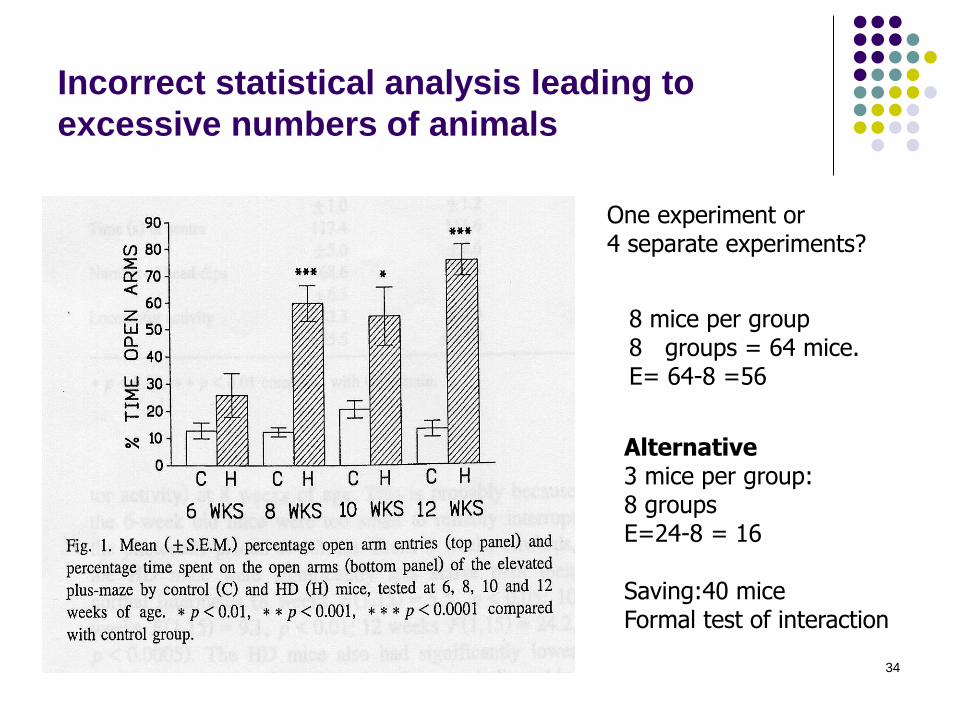
34
Incorrect statistical analysis leading to
excessive numbers of animals
8 mice per group 8 groups = 64 mice. E= 64-8 =56
Alternative 3 mice per group: 8 groups E=24-8 = 16 Saving:40 mice Formal test of interaction
One experiment or 4 separate experiments?
35
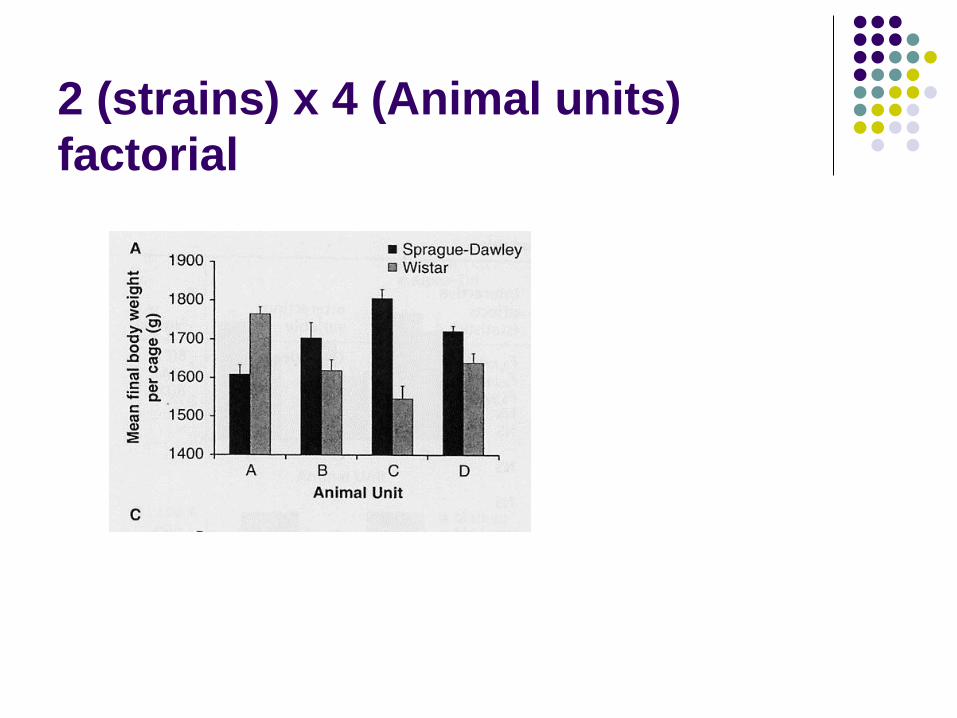
2 (strains) x 4 (Animal units)
factorial
36
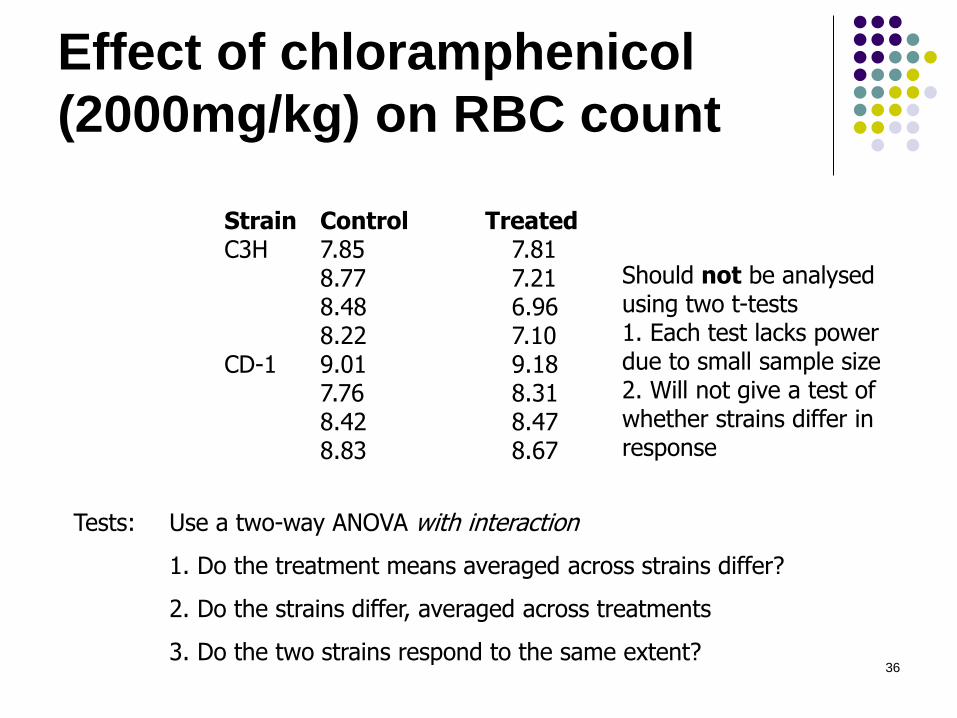
Effect of chloramphenicol
(2000mg/kg) on RBC count
Strain Control Treated C3H 7.85 7.81 8.77 7.21 8.48 6.96 8.22 7.10 CD-1 9.01 9.18 7.76 8.31 8.42 8.47 8.83 8.67
Tests: Use a two-way ANOVA with interaction
1. Do the treatment means averaged across strains differ?
2. Do the strains differ, averaged across treatments
3. Do the two strains respond to the same extent?
Should not be analysed using two t-tests 1. Each test lacks power due to small sample size 2. Will not give a test of whether strains differ in response
37
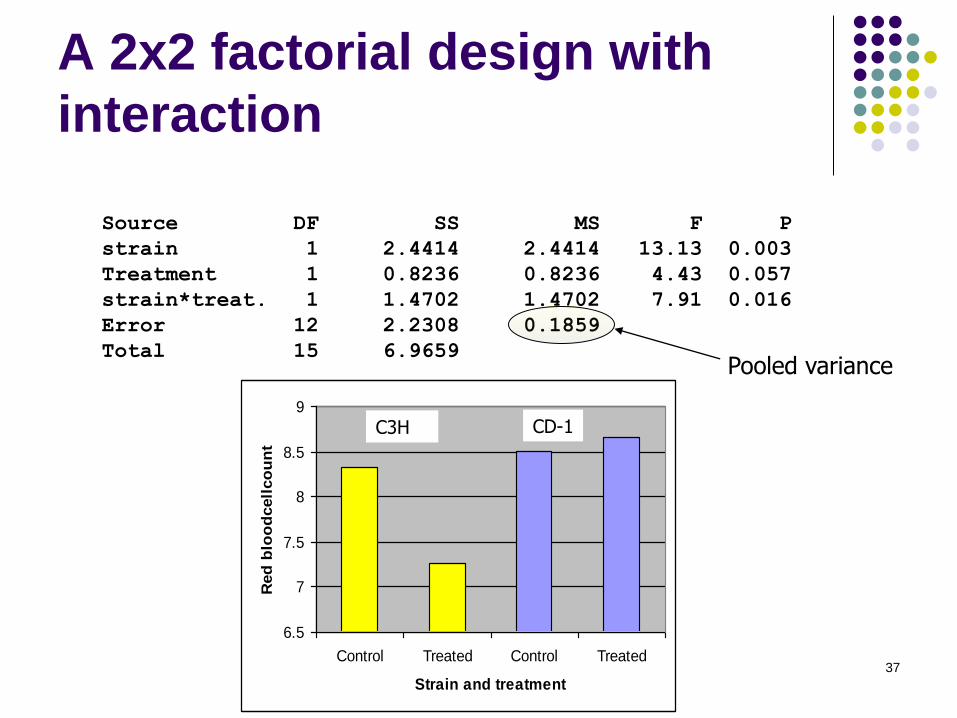
A 2x2 factorial design with
interaction
Source DF SS MS F P
strain 1 2.4414 2.4414 13.13 0.003
Treatment 1 0.8236 0.8236 4.43 0.057
strain*treat. 1 1.4702 1.4702 7.91 0.016
Error 12 2.2308 0.1859
Total 15 6.9659
6.5
7
7.5
8
8.5
9
Control Treated Control Treated
Strain and treatment
Red
blo
od
cell
co
un
t
C3H CD-1
Pooled variance
38
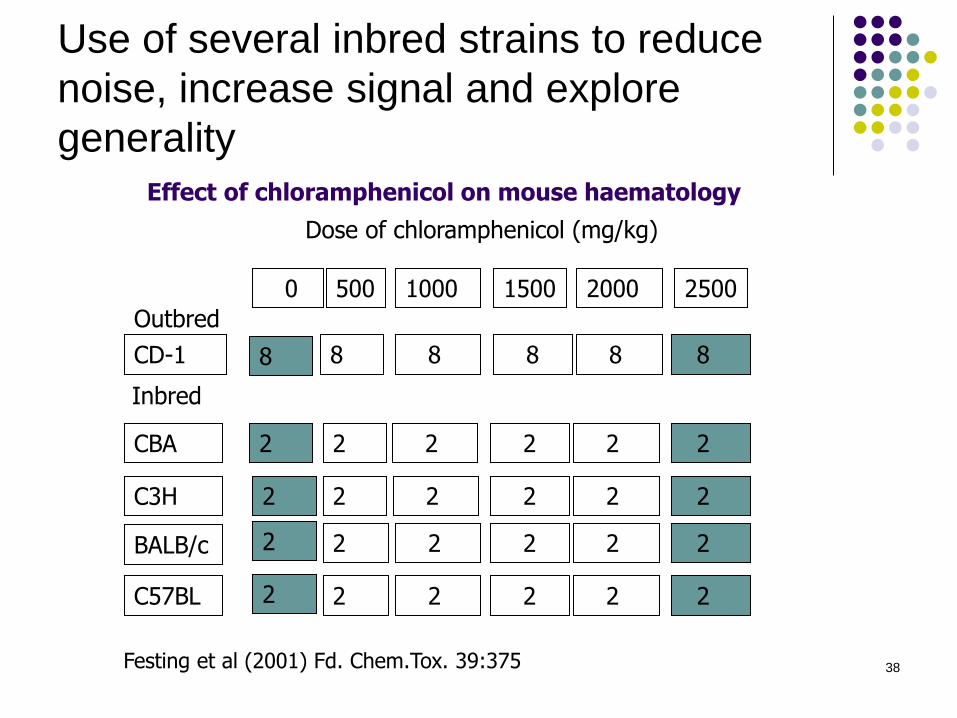
Use of several inbred strains to reduce
noise, increase signal and explore
generality
500 1000 1500 2000 2500
CD-1 8 8 8 8 8 8
CBA 2 2 2 2 2
C3H 2 2 2 2 2
BALB/c 2 2 2 2 2
C57BL 2 2 2 2 2
2
2
2
2
Inbred
0
Outbred
Dose of chloramphenicol (mg/kg)
Festing et al (2001) Fd. Chem.Tox. 39:375
Effect of chloramphenicol on mouse haematology
39
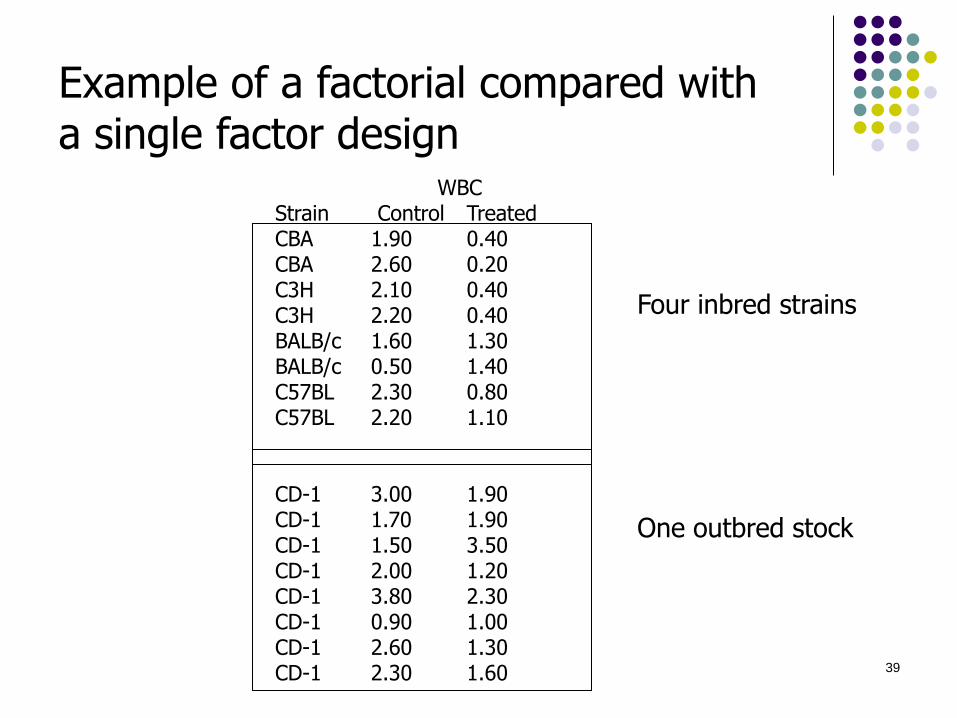
WBC Strain Control Treated CBA 1.90 0.40 CBA 2.60 0.20 C3H 2.10 0.40 C3H 2.20 0.40 BALB/c 1.60 1.30 BALB/c 0.50 1.40 C57BL 2.30 0.80 C57BL 2.20 1.10 CD-1 3.00 1.90 CD-1 1.70 1.90 CD-1 1.50 3.50 CD-1 2.00 1.20 CD-1 3.80 2.30 CD-1 0.90 1.00 CD-1 2.60 1.30 CD-1 2.30 1.60
Example of a factorial compared with a single factor design
Four inbred strains One outbred stock
40
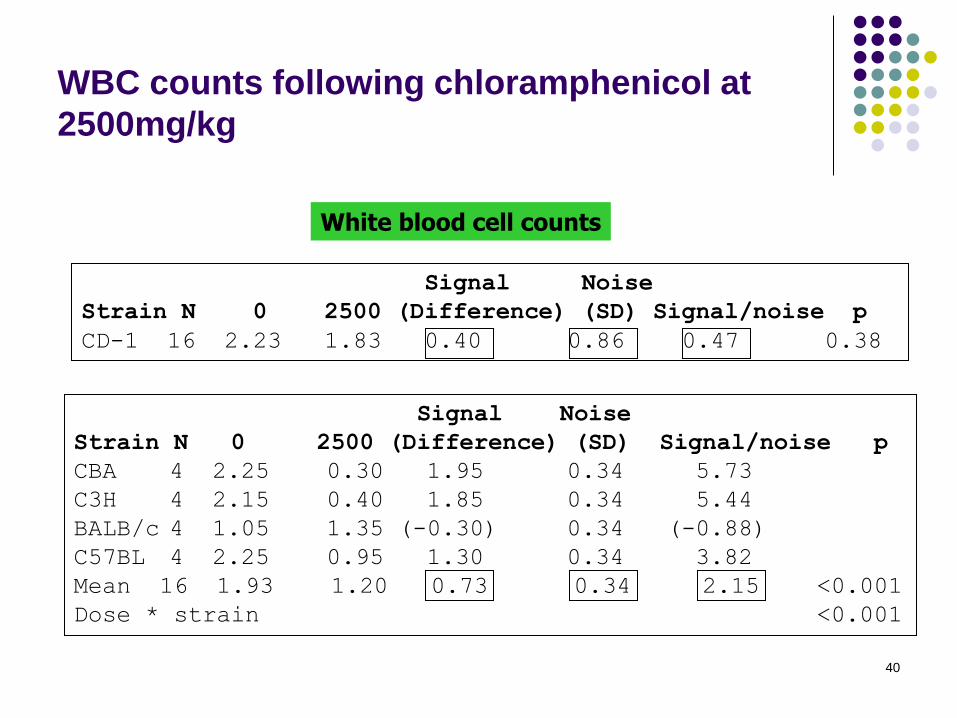
Signal Noise
Strain N 0 2500 (Difference) (SD) Signal/noise p
CBA 4 2.25 0.30 1.95 0.34 5.73
C3H 4 2.15 0.40 1.85 0.34 5.44
BALB/c 4 1.05 1.35 (-0.30) 0.34 (-0.88)
C57BL 4 2.25 0.95 1.30 0.34 3.82
Mean 16 1.93 1.20 0.73 0.34 2.15 <0.001
Dose * strain <0.001
WBC counts following chloramphenicol at
2500mg/kg
Signal Noise
Strain N 0 2500 (Difference) (SD) Signal/noise p
CD-1 16 2.23 1.83 0.40 0.86 0.47 0.38
White blood cell counts
41
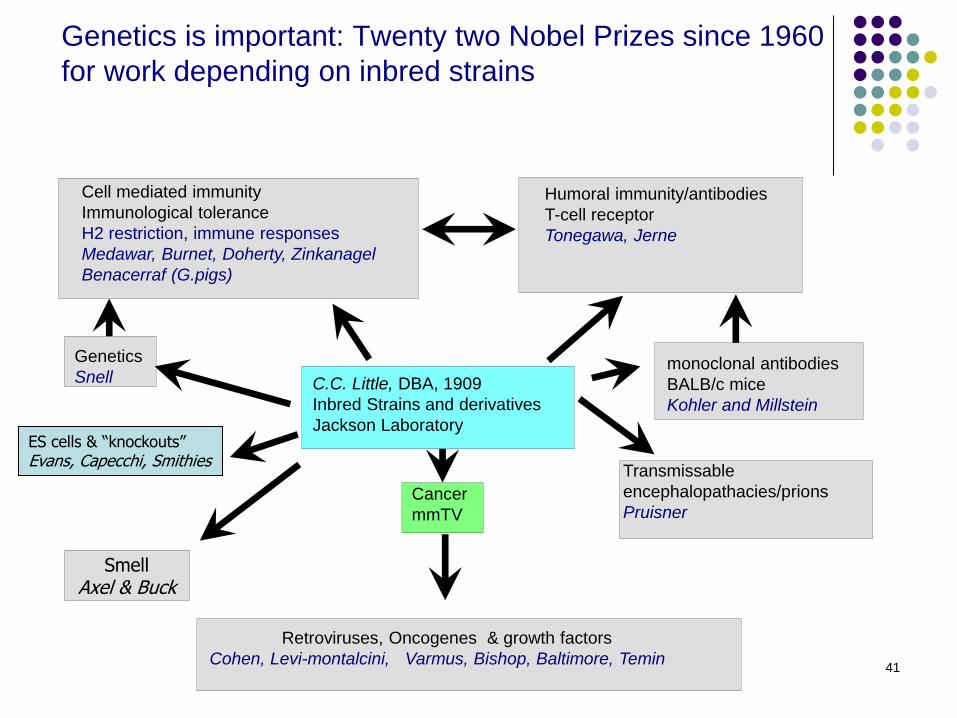
Genetics is important: Twenty two Nobel Prizes since 1960
for work depending on inbred strains
Cancer
mmTV
Transmissable
encephalopathacies/prions
Pruisner
Retroviruses, Oncogenes & growth factors
Cohen, Levi-montalcini, Varmus, Bishop, Baltimore, Temin
Humoral immunity/antibodies
T-cell receptor
Tonegawa, Jerne
Cell mediated immunity
Immunological tolerance
H2 restriction, immune responses
Medawar, Burnet, Doherty, Zinkanagel
Benacerraf (G.pigs)
Genetics
Snell C.C. Little, DBA, 1909
Inbred Strains and derivatives
Jackson Laboratory
monoclonal antibodies
BALB/c mice
Kohler and Millstein
Smell Axel & Buck
ES cells & “knockouts” Evans, Capecchi, Smithies
42
18th Annual Short Course on Experimental
Models of Human Cancer
August 21-30, 2009
Bar Harbor, ME
courses.jax.org
43
Conclusions
Five requirements for a good design Unbiased (randomisation, blinding)
Powerful (signal/noise ratio: control variability)
Wide range of applicability (factorial designs, common but frequently analysed incorrectly)
Simple
Amenable to statistical analysis
Mistakes in design and analysis are common
Better training in experimental design would improve the quality of research, save money, time and animals

44

45