Embed Size (px)
Citation preview

Lecture 3: Experimental design: randomization,
replication and design control

This lecture will cover
• Blocks• Experimental units (replicates)• Pseudoreplication• Degrees of freedom• Control
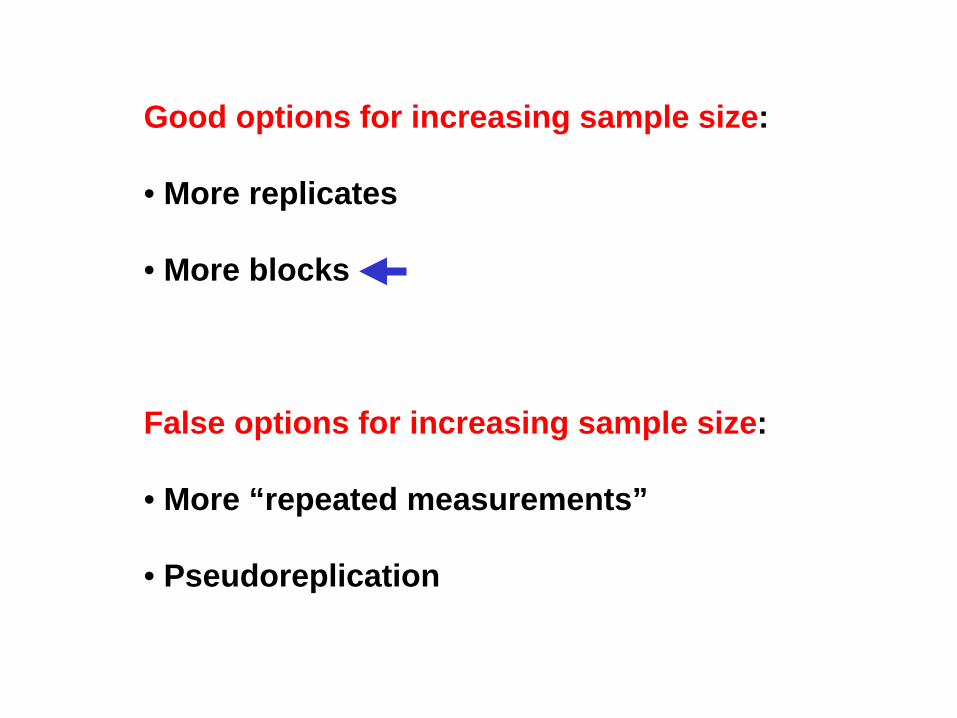
Good options for increasing sample size:
• More replicates
• More blocks
False options for increasing sample size:
• More “repeated measurements”
• Pseudoreplication
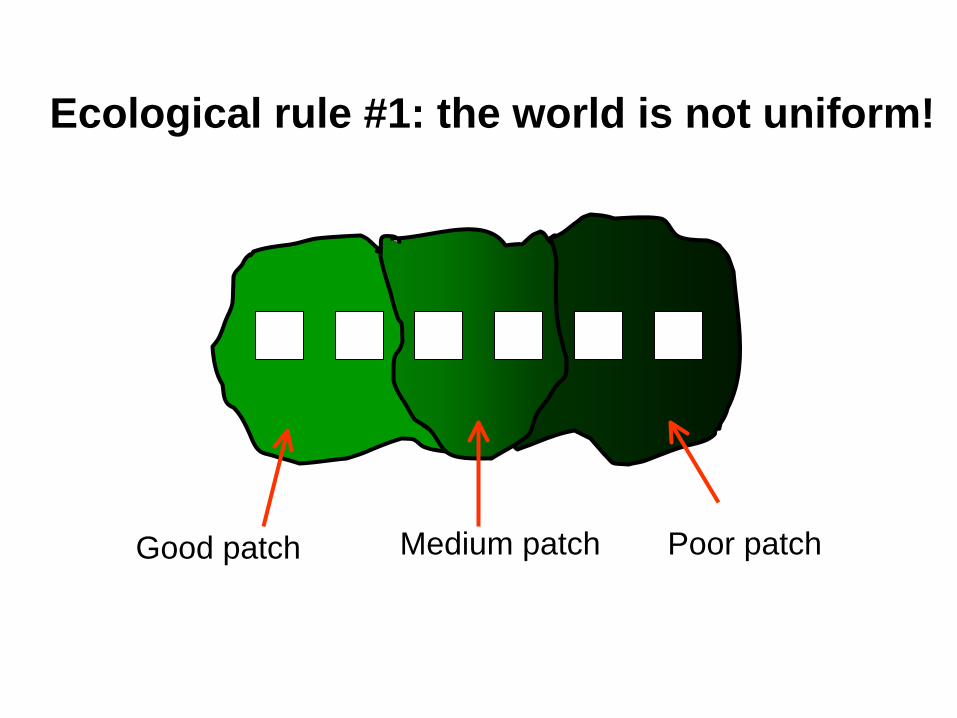
Ecological rule #1: the world is not uniform!
Good patch Medium patch Poor patch
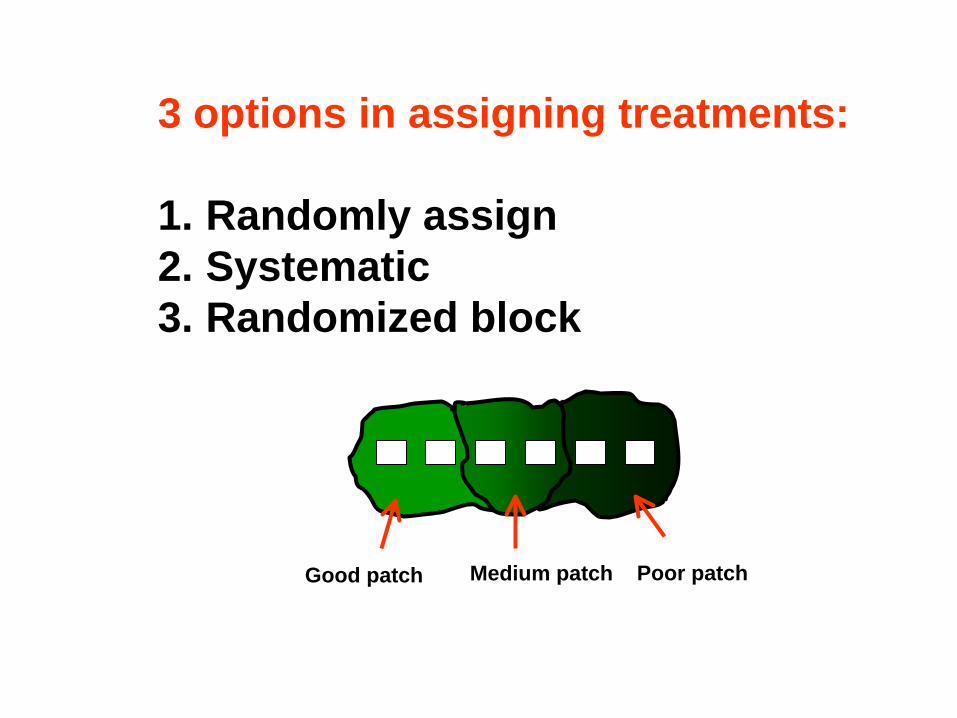
3 options in assigning treatments:
1. Randomly assign2. Systematic3. Randomized block
Good patch Medium patch Poor patch

1. Randomly assign
Good patch Medium patch Poor patch
Pros?
Cons?
Statistically robust
With small n, chance of all in a bad patch
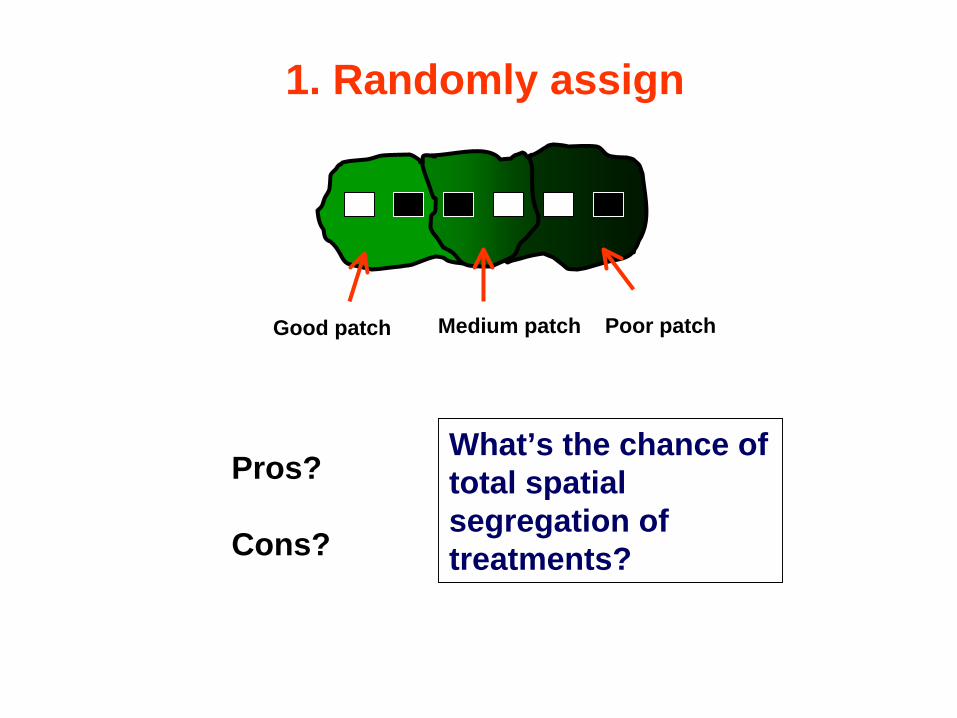
1. Randomly assign
Good patch Medium patch Poor patch
Pros?
Cons?
What’s the chance of total spatial segregation of treatments?

2. Systematic
Good patch Medium patch Poor patch
Pros?
Cons?
No clumping possible
Violates random assumption of statistics…but is this so bad?

3. Randomized block
Good patch Medium patch Poor patchBLOCK A BLOCK B BLOCK C

3. Randomized block
BLOCK A BLOCK B BLOCK CNote:1. Do not have to know if patches
differ in quality2. Must have all treatment
combinations represented in each block
3. If WANT to test treatment x block interaction, need replication within blocks

Good options for increasing sample size:
• More replicates
• More blocks
False options for increasing sample size:
• More “repeated measurements”
• Pseudoreplication
Experimental unit
Scale at which independent applications of the same treatment occur
Also called “replicate”, represented by “n” in statistics
Experimental unit
Example: Effect of fertilization on caterpillar growth

Experimental unit ?
+ F - F + F - F
n=2
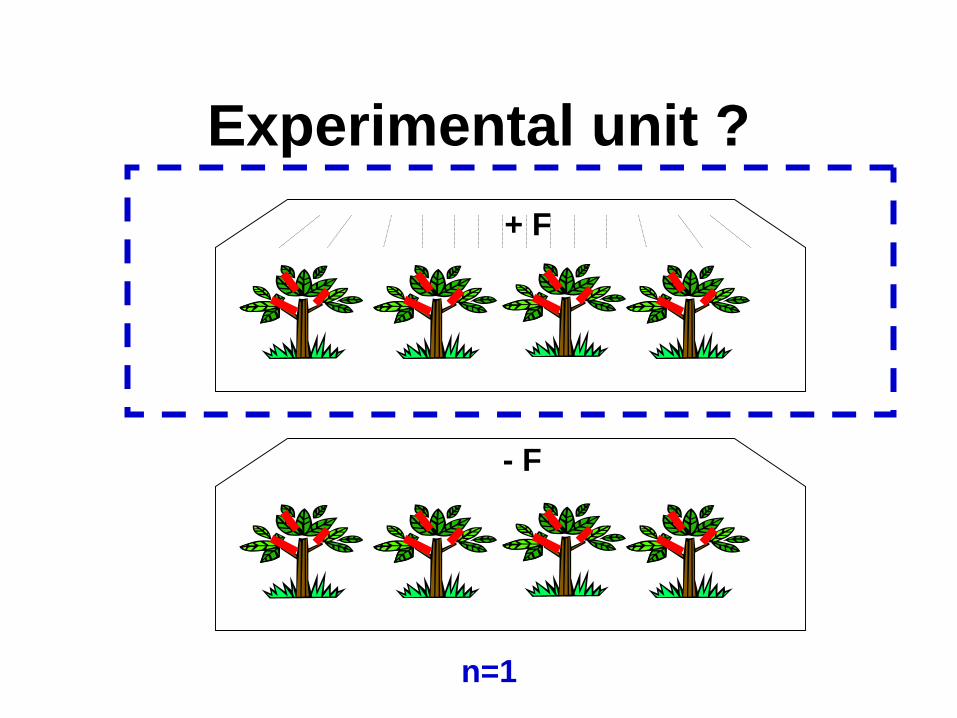
Experimental unit ?
- F
+ F
n=1
Pseudoreplication
Misidentifying the scale of the experimental unit;
Assuming there are more experimental units (replicates, “n”) than there actually are
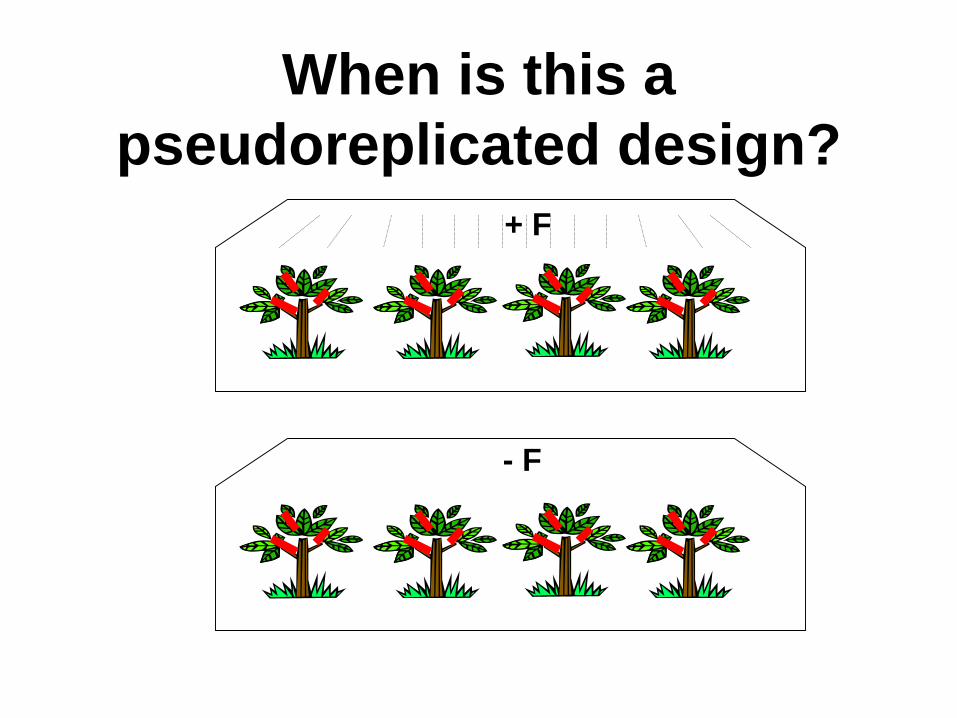
When is this a pseudoreplicated design?
- F
+ F

Example 1.
Hypothesis: Insect abundance is higher in shallow lakes

Example 1.
Experiment:
Sample insect abundance every 100 m along the shoreline of a shallow and a deep lake
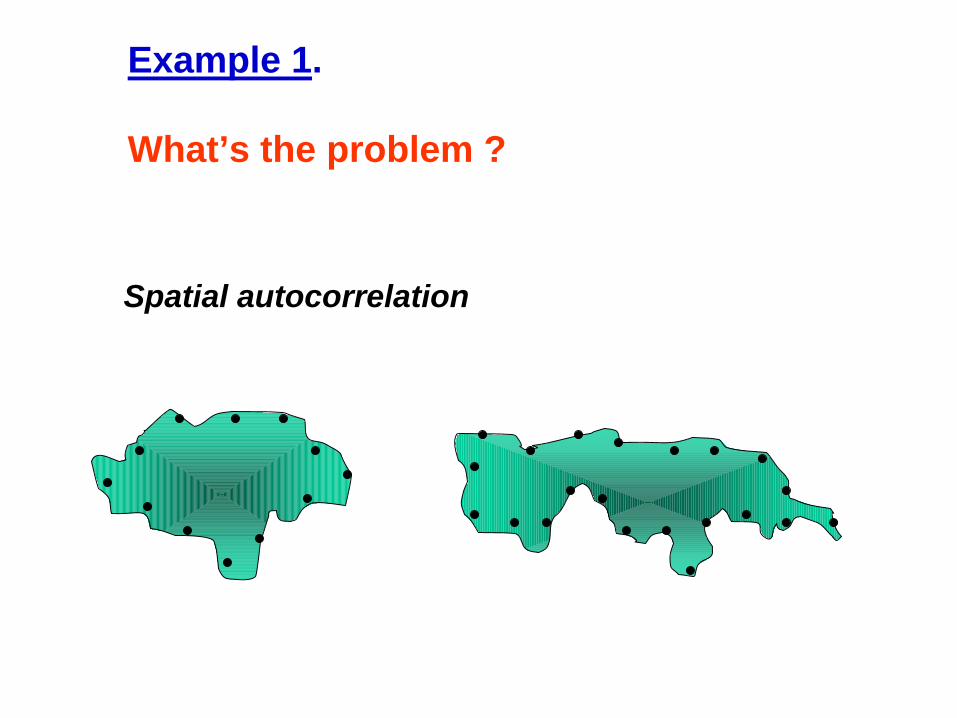
Example 1.
What’s the problem ?
Spatial autocorrelation

Example 2.
Hypothesis: Two species of plants have different growth rates

Example 2.
Experiment:
• Mark 10 individuals of sp. A and 10 of sp. B in a field.
• Follow growth rate over time
If the researcher declares n=10, could this still be pseudoreplicated?

Example 2.
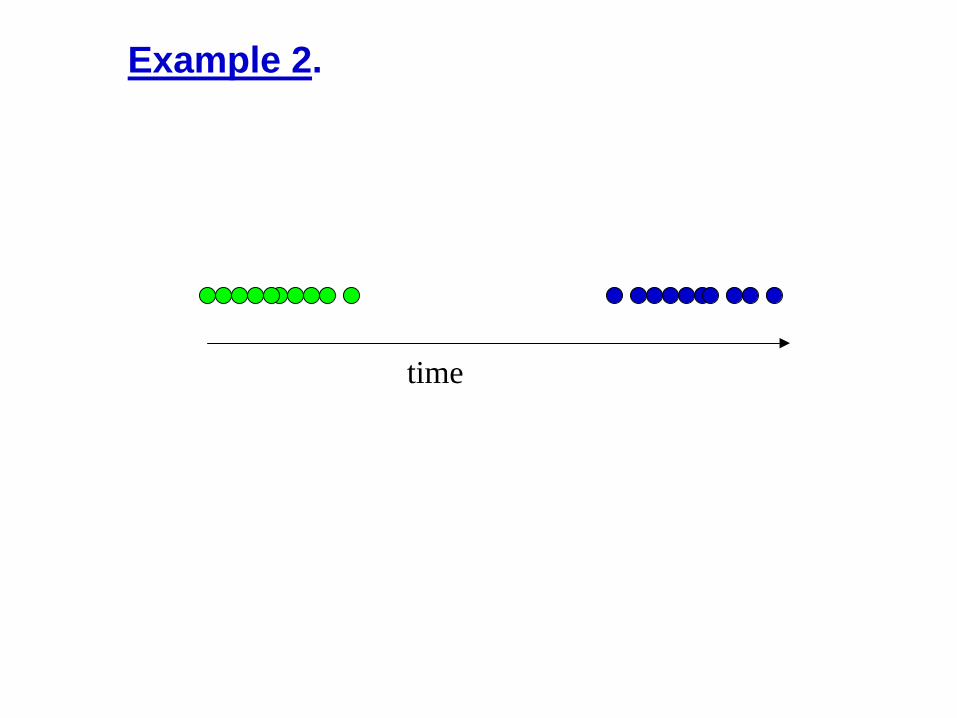
Example 2.
time
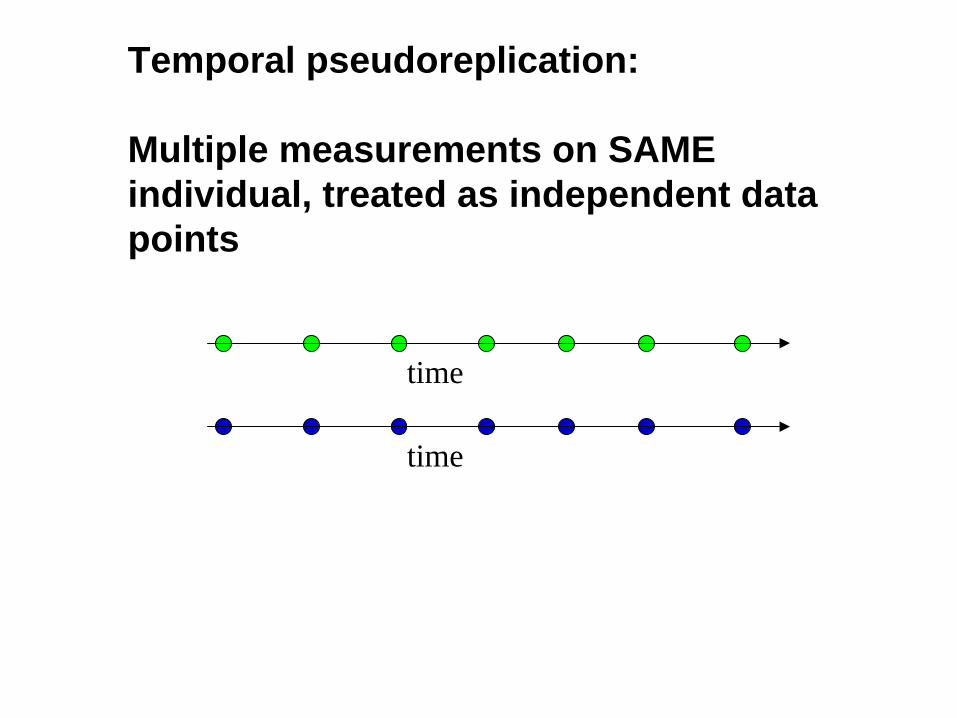
Temporal pseudoreplication:
Multiple measurements on SAME individual, treated as independent data points
time
time
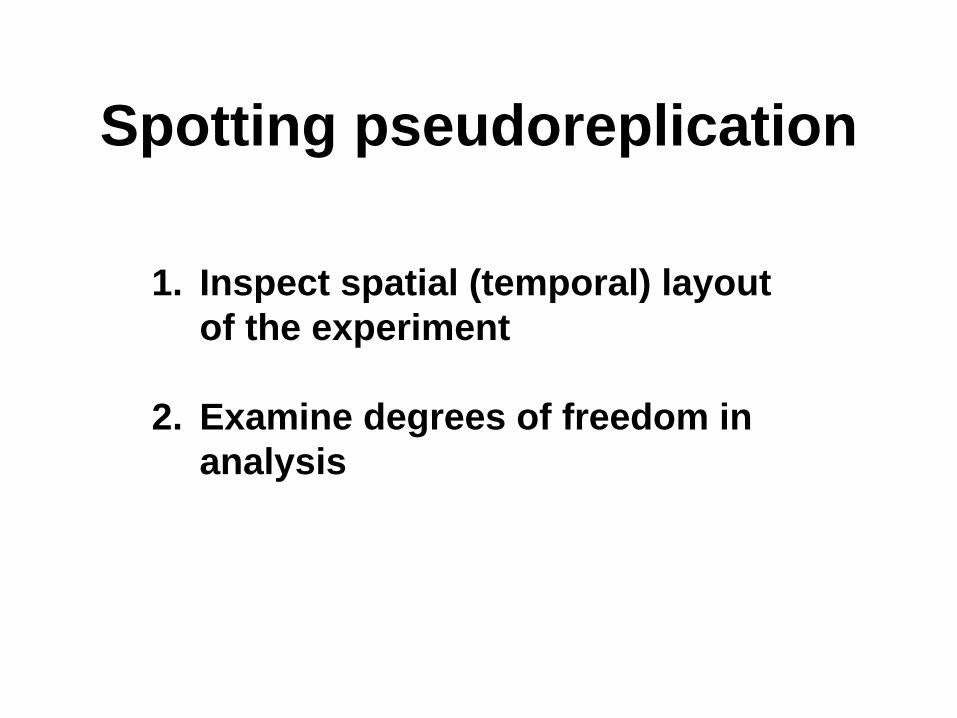
Spotting pseudoreplication
1. Inspect spatial (temporal) layout of the experiment
2. Examine degrees of freedom in analysis

Degrees of freedom (df)
Number of independent terms used to estimate the parameter
= Total number of datapoints –number of parameters estimated from data

Example: VarianceIf we have 3 data points with a mean value of 10, what’s the df for the variance estimate?
Independent term method: Can the first data point be any number?
Can the second data point be any number?
Can the third data point be any number?
Yes, say 8
Yes, say 12
No – as mean is fixed !
Variance is Σ
(y – mean)2 / (n-1)
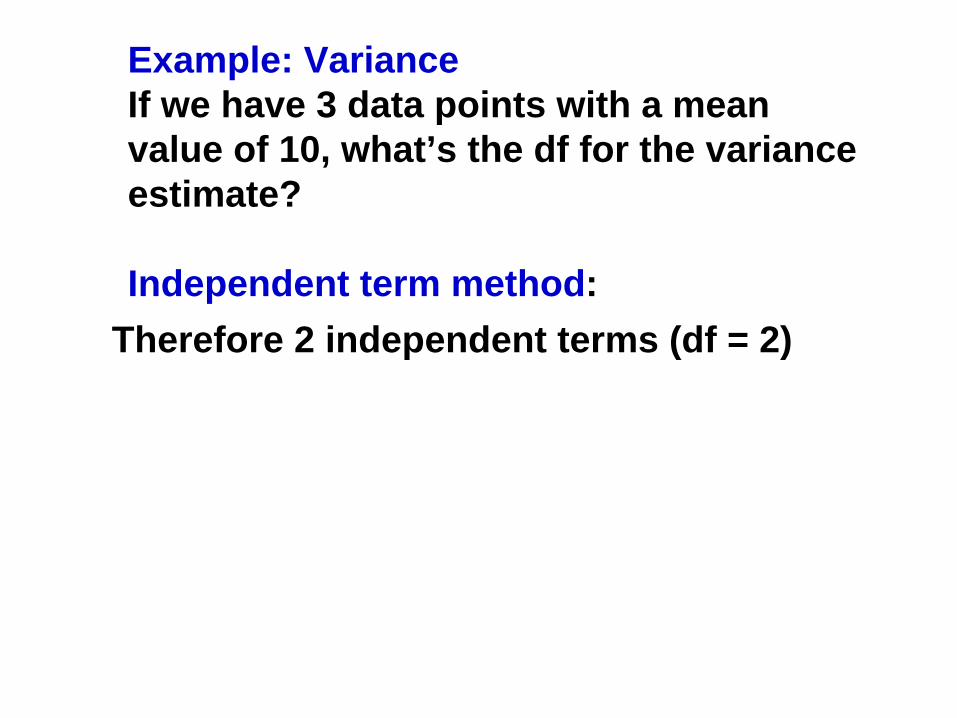
Example: VarianceIf we have 3 data points with a mean value of 10, what’s the df for the variance estimate?
Independent term method: Therefore 2 independent terms (df = 2)
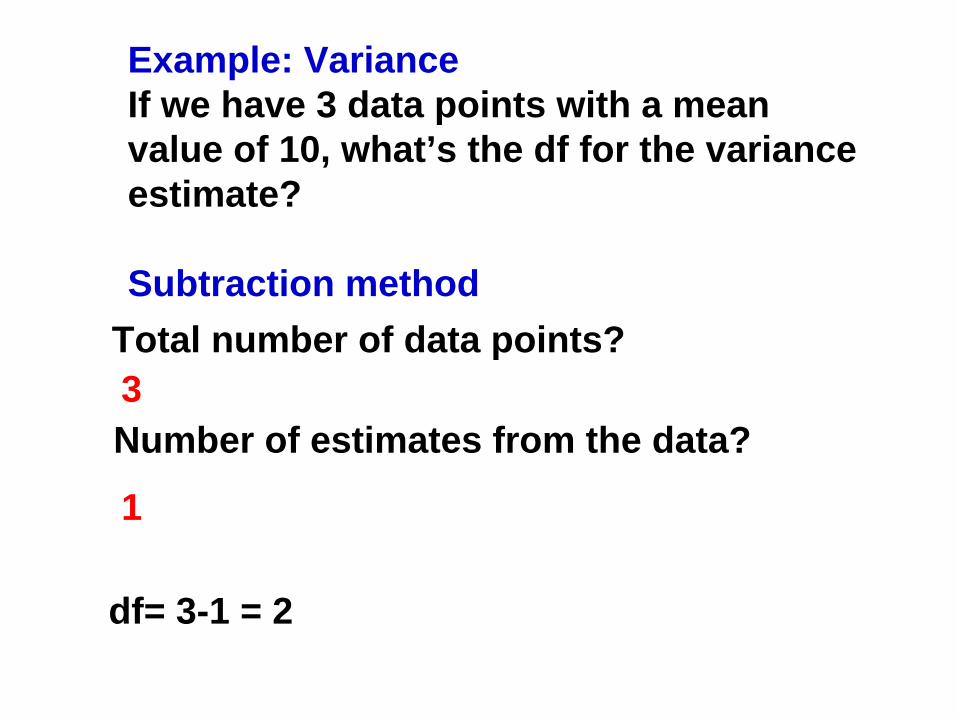
Example: VarianceIf we have 3 data points with a mean value of 10, what’s the df for the variance estimate?
Subtraction methodTotal number of data points?
Number of estimates from the data?
df= 3-1 = 2
3
1
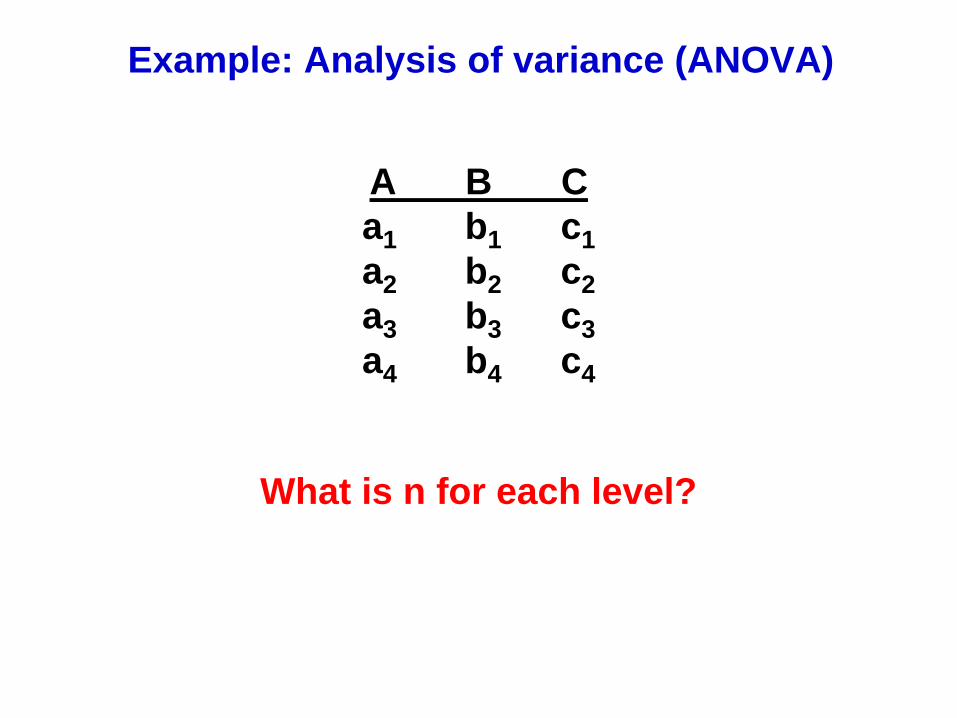
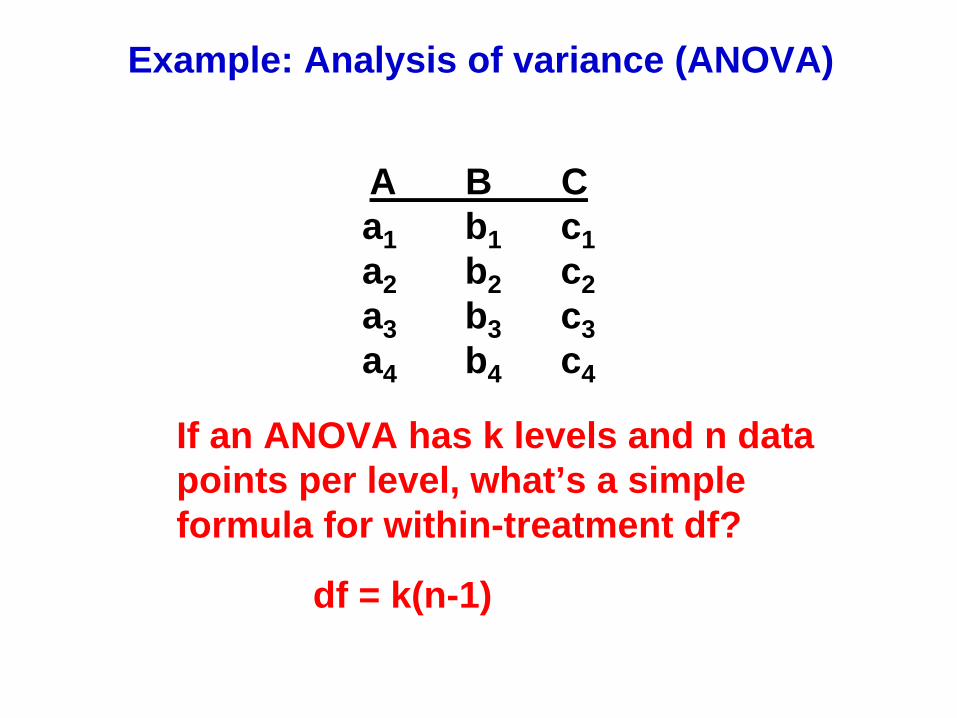
Example: Analysis of variance (ANOVA)
A B C a1 b1 c1a2 b2 c2a3 b3 c3a4 b4 c4
What is n for each level?
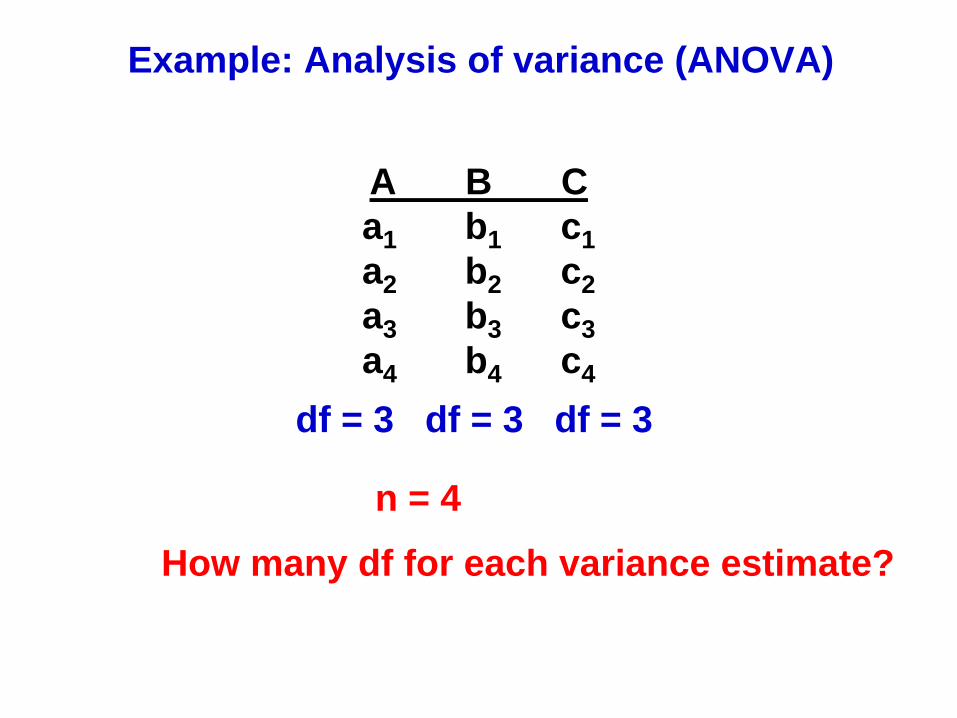
Example: Analysis of variance (ANOVA)
A B C a1 b1 c1a2 b2 c2a3 b3 c3a4 b4 c4
n = 4
How many df for each variance estimate?
df = 3 df = 3 df = 3

Example: Analysis of variance (ANOVA)
A B C a1 b1 c1a2 b2 c2a3 b3 c3a4 b4 c4
What’s the within-treatment df for an ANOVA?
Within-treatment df = 3 + 3 + 3 = 9
df = 3 df = 3 df = 3
Example: Analysis of variance (ANOVA)
A B C a1 b1 c1a2 b2 c2a3 b3 c3a4 b4 c4
If an ANOVA has k levels and n data points per level, what’s a simple formula for within-treatment df?
df = k(n-1)
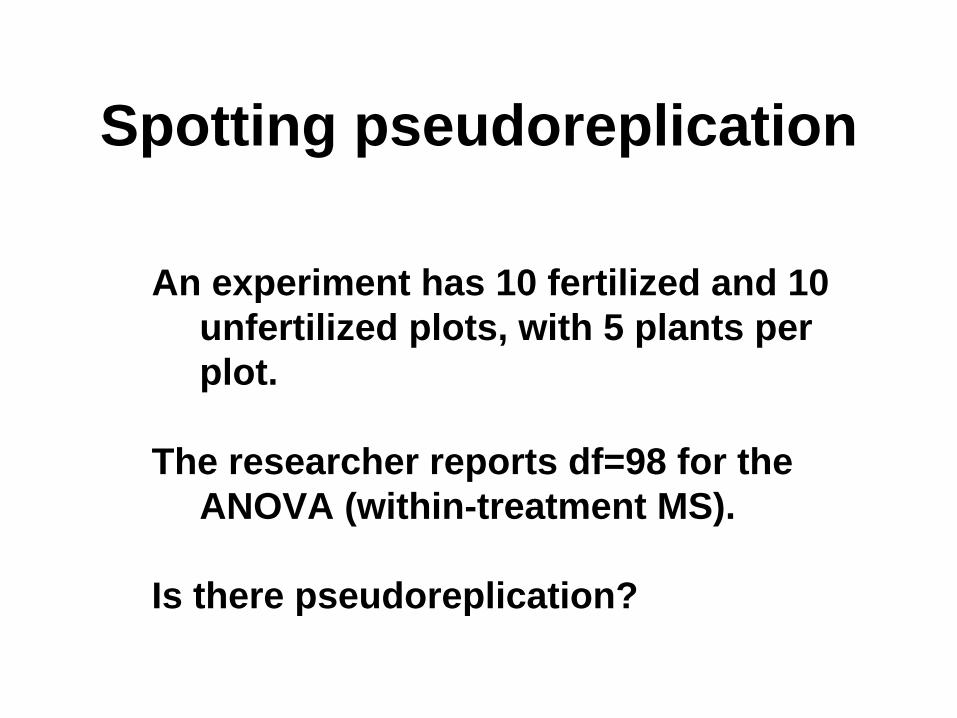
Spotting pseudoreplication
An experiment has 10 fertilized and 10 unfertilized plots, with 5 plants per plot.
The researcher reports df=98 for the ANOVA (within-treatment MS).
Is there pseudoreplication?

Spotting pseudoreplication
An experiment has 10 fertilized and 10 unfertilized plots, with 5 plants per plot.
The researcher reports df=98 for the ANOVA.
Yes! As k=2, n=10, then df = 2(10-1) = 18
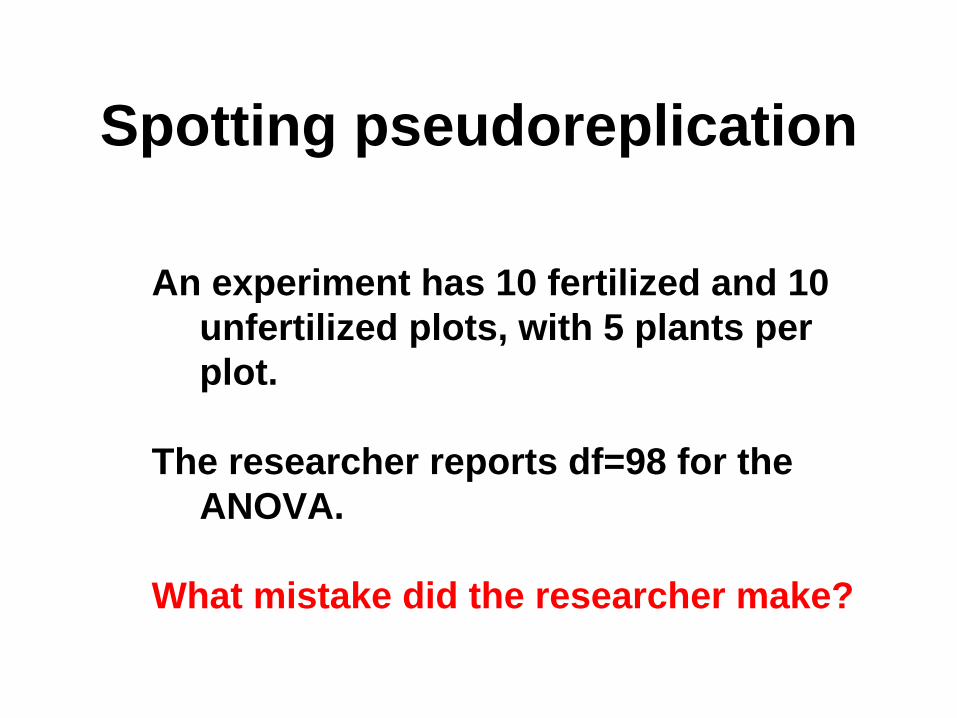
Spotting pseudoreplication
An experiment has 10 fertilized and 10 unfertilized plots, with 5 plants per plot.
The researcher reports df=98 for the ANOVA.
What mistake did the researcher make?

Spotting pseudoreplication
An experiment has 10 fertilized and 10 unfertilized plots, with 5 plants per plot.
The researcher reports df=98 for the ANOVA.
Assumed n=50: 2(50-1)=98

Use of a Control – every ecological field experiment must have a control
Control: experimental unit in the experiment without the treatment
Severs as the baseline to compare the effect/s of the treatment against temporal changes and procedural effects
Before(After Green 1979, in Krebs 1999)
After
Control
Impact

Exposure and head bumps (F2, 196 = 63.21 p<0.001)
control
sham
Treatment Experimental Chamber
Camera
Senevirantne & Jones 2009 Animal Behaviour (in press)

How to analyze a blocked design in JMP (Method 1)
1. Basic stats> Oneway.2. Add response variable, treatment
(“grouping”) and block.3. Click OK

How to analyze a blocked design in JMP (Method 2)
1. Open fit model tab. Enter y-variable.2. Add treatment, block and –if desired-
treatment x block to “effects”.3. Click on block in effects box and
change attributes to random.4. Change Method option to EMS (not
REML)