Embed Size (px)
Citation preview
Experimental Determination of Line Strengths for Selected Carbon Monoxide and Carbon Dioxide Absorption Lines at Temperatures between 295 and 1250 K
P A T R I C K J . M E D V E C Z * and K E N N E T H M . N I C H O L S Rhinelander Paper Co., 515 W. Davenport St., Rhinelander, Wisconsin 54501 (P.J.M.); and Weyerhaeuser Technology Center, Tacoma, Washington 98477 (K.M.N.)
Fourier transform infrared absorption spectroscopy has been used for the determination of the line strengths of 41 CO and CO2 absorption lines at temperatures between 295 and 1250 K. The CO vibrational- rotational lines were from the P branch of the fundamental absorption band (2150-1950 cm -I) while the CO2 vibrational-rotational lines were from the far wing of the R branch of the v3 fundamental band (2395- 2380 cm-I). The intensities of the lines were measured from absorption spectra recorded in a high-temperature gas cell containing known con- centrations of CO/CO2/N2 gas mixtures at atmospheric pressure. Ab- sorption spectra were recorded through the cell with the use of a mod- erate-resolution Fourier transform infrared spectrometer. The absorption spectra were mathematically corrected for distortions resulting from the finite resolution of the spectrometer and for peak overlap. Line strength measurements were made from the corrected peaks by using the Bou- guer-Lambert law and assuming a Lorenztian line profile. The experi- mentally obtained line strengths were evaluated (1) by statistical cal- culations, (2) by consideration of the validity of the Bouguer-Lambert assumption for these data, (3) by comparison with existing room-tem- perature and high-temperature data, and (4) by comparison with theo- retical calculations. For CO, the statistical analysis suggests that the reported values have an uncertainty of ±10-12%, which is similar to the observed discrepancies with other reported values at room temper- ature. At high temperatures, the difference between these data and pre- viously reported data and theoretical predictions is less than 10%. For CO2, the statistical uncertainty associated with the line strength calcu- lations is less than 5%, which is also the approximate level of agreement with existing room-temperature data. For lines with m indicies of 65- 89, at high temperatures, the values reported in this work agree within 5 to 10% of theoretical calculations. Index Headings: Infrared; FT-IR; CO; CO2; Absorption spectra; Line strengths.
I N T R O D U C T I O N
The determinat ion o f gas concentrat ions from absorp- tion spectra requires knowledge o f the line strengths o f the i nd iv idua l v i b r a t i o n a l - r o t a t i o n a l lines. T h e l ine strength o f an absorpt ion peak is a fundamental param- eter o f the line and, at room temperature, has been studied thoroughly for many CO and CO2 lines. However , line strengths are strongly temperature dependent. The tem- perature dependence o f these values has received little experimental evaluation. For the accurate determinat ion o f gas concentrat ions at temperatures greater than 300 K, knowledge o f the temperature dependence o f these values is essential.
For CO, a l imited amount o f experimental data has
Received 18 April 1994; accepted 16 August 1994. * Author to whom correspondence should be sent.
been presented by Sell I and Hanson. 2 Sell measured the line strength o f the P(6) line o f CO in the temperature range o f 575 to 775 K. Hanson reported values for the temperature dependence o f the P(1 l) CO line at temper- atures between 300 and 3500 K. For CO2, no experi- mental data are available which describe the temperature dependence o f the line strengths for lines on the outer wing o f the R branch o f the v3 fundamental band. The lack o f experimental data, for both CO and CO2, requires a reliance upon theoretical predictions o f the temperature dependence o f these values for concentrat ion measure- ments. Theoretical descriptions o f the temperature de- p e n d e n c e o f v i b r a t i o n a l - r o t a t i o n a l a b s o r p t i o n l ines abound in the literature. TM
In this paper, experimental data describing the tem- perature dependence o f 22 CO and 19 CO2 lines are pre- sented. The accuracy o f the data is evaluated by consid- ering the statistical variabili ty among replicates and by error analysis calculations. The data are also evaluated by comparisons with existing experimental line strength data as well as theoretical calculations which predict the temperature dependence o f these values. The presenta- t ion o f these data will be preceded by a br ief review of theory and a description o f the data collection procedures. Details regarding the spectrometer, optical configuration, high-temperature gas cell, and numerical peak height cor- rection methodology have been presented elsewhere? -7
T H E O R Y
The absorpt ion o f infrared radiation by a gas for a single vibrat ional-rotat ional absorpt ion line is given by the Bou- guer -Lamber t expression,
T(v) = e -°e)cL. (1)
This relationship equates the transmittance, T(v), o f a single vibrat ional-rotat ional line with the negative ex- ponential product o f a, the absorpt ion coefficient in units o f 1/(conc. • cm); C, the gas concentration; and L, the path- length o f the cell (cm). The relationship between trans- mittance, T(v), and absorbance, A(v), is given by Eq. 2:8
A(v) = - l o g T(v). (2)
Substi tution o f Eq. 2 into Eq. 1 yields
a(v). C. L A ( 0 - (3)
ln(10)
The absorpt ion coefficient, a(v), is dependent upon the condit ions o f the experiment, most important ly the total
"1442 Volume 48, Number 11, 1994 0003-7028/94/4811-144252.00/0 APPLIED SPECTROSCOPY © 1994 Society for Applied Spectroscopy
pressure of the gas. This dependence is a result of the mechanism controlling the broadening of the vibrational- rotational line. Gross et al. have given a description of the assumed profiles for various conditions. 9 At one at- mosphere pressure (the condition for the experiments re- ported in this study), collision broadening determines the vibrational-rotational line profile, and, therefore, a Lo- rentzian line shape is assumed:
S(m)'q,(m) or(t1) = [Tr'((~ -- Uo) 2 q- v(m)2)]" (4)
Here, S(m) is the line strength (cm -z atm- ') , v(m) is the half-width of the line (cm-l), 1, is the frequency, and ~'0 is the frequency of the line center. The index of the line is denoted by m, where m is equal to -Y" for a P branch line and J" + 1 for an R branch line. Substitution of the expression for the absorption coefficient given in Eq. 4 into the absorption intensity relationship given in Eq. 3 yields
v(m)" L. S(m) . C A(u) = [~"(0' - u0) 2 + 3'(m)2)'ln(10)]" (5)
Solving Eq. 5 for the peak maximum (substitution of v0 for v) and rearrangement yields an expression for the line strength:
A(uo)'lr"y(m)" ln(10) S(m) = L . C (6)
The use of Eq. 6 for the calculation of line strengths for an absorption line requires experimental information (gas concentration and pathlength), line half-widths, and ac- curate absorption peak maxima. Significant effort has been made to correct the experimentally obtained absorption peak maxima for distortions resulting from the finite res- olution of the spectrometer? -7 The necessity for these corrections has been made apparent by Anderson and Griffiths. s,l° For CO, the model presented by Hartman et al.l' has been used for the calculation of line half-widths, and the model by Rosenmann et al. '2 has been used for CO2 half-width calculations.
In addition to calculations of line strengths based upon experimentally obtained absorption spectra, theoretical predictions of the temperature dependence of these values can also be made. For CO transitions from the ground state to the first vibrationally excited state, the line strength of a single vibrational-rotational line is given b y 3A3
u';J ' &.;AT) = S'b(T °)
[hc ] exp - 3') T ° g ~ E 0 ' ,
T Vb(T °) Q(T)
[ 1 ,7, A description of the terms used in this equation is given in Table I. With a knowledge of the individual parameters described in Table I, Eq. 7 permits a direct calculation of the temperature dependence of the line intensities. Similarly, the temperature dependence of CO2 lines is dependent upon the same parameters and can also be described by Eq. 7.
T A B L E I. Description of terms in Eq. 7.
Term Description
T
¢;j , Sv.~ (73
Sb'(TD
Ip
Pb (T*) E(v, J) Q(T)
hc [1 - exp(-~)]
m
F
Gas temperature (K) Reference temperature (K) Line strength for (v', J' ~ v", J") transition
(1/(arm cm2)) Band strength (1/(atm cm-2)) for vibrational
transition 1 ,-- 0 at reference temperature
Frequency of vib-rot transition (cm-') Effective band center (cm ') Energy of initial state Partition function at T Correction for induced emission
m = -J" for P branch lines m = J" + 1 for R branch lines Herman-Wallis correction for vib-rot interac-
tion
EXPERIMENTAL
The gas cell and optics used for these experiments have been previously described? ,7 Briefly, the cylindrical cell (inside diameter, 3.875 in.; inside length, 3.75 in.) was constructed of stainless steel and had 1.0-in.-diameter sapphire windows. Inlet and outlet stainless steel tubes were put into the cell to allow a continuous stream of gas to flow through the cell. The inlet tube included a coil, 72-in. long, wound on the inside of the gas cell to preheat the gas to the cell temperature. A flow of gas continuously exited the cell through the outlet tube. The cell was heated by placing it inside an electric tube furnace which was controlled by a temperature controller. The internal pres- sure of the cell was continuously monitored with the use of a pressure transducer located on the gas outlet tube.
Because of the high temperatures of the furnace, the gas cell and furnace were located a short distance away from the interferometer. The infrared beam was brought to the gas cell through a series of mirrors (Optibus Com- ponents from Laser Precision Analytical). After passing through the gas cell, the infrared beam was recollected and focused onto a wide-band 0.25-mm mercury-cad- mium-telluride (MCT) detector.
All the gas samples consisted of mixtures of CO, CO2, and N2. A total volumetric flow rate of 1 L/min was continuously passed through the cell. The gases were re- search-grade CO and CO2 (minimum purities of 99.997% and 99.998%, respectively) and prepurified N2 (minimum purity 99.998%). The volumetric flow rates of individual CO, COz, and N2 streams were measured by either mass flow meters or rotameters. Corrections to the mass flow meter readings were made for temperature, pressure, and gas species. No corrections were required for the rota- meters, which were operated under the same conditions as for their calibration. The accuracy of all the meters was validated by comparisons with dry gas test meters. After being measured, the gases were combined and mixed in the tubing between their respective metering devices and the gas cell. After the gas exited the gas cell, its com- position was rechecked with an NDIR CO/CO2 gas an- alyzer.
The absorption spectra recorded were all collected with a Laser Precision Analytical Model RFX-75 FT-IR spec- trometer, operating at a nominal instrument resolution
APPLIED SPECTROSCOPY 1443
TABLE II. Results of line strength calculations for 22 CO absorption lines recorded at temperatures between 295 and 1225 K. Calculated values of S(m) are in units of l /(atm cm2).
Line S(m) S (m) S(m) S(m) S(m) S(m) S(m) S(m) (m) 295K 353K 535K 720K 936K 1 0 3 4 K l 1 4 4 K 1 2 2 6 K
- 3 5 0.111 0.183 0.210 0.209 0.236 - 3 4 0.154 0.215 0.235 0.266 0.225 -31 0.140 0.307 0.378 0.397 0.374 0.372 - 3 0 0.178 0.333 0.428 0.432 0.437 0.376 - 2 9 0.248 0.431 0.496 0.488 0.482 0.468 - 2 8 0.306 0.520 0.571 0.556 0.533 0.522 - 2 7 0.130 0.402 0.635 0.647 0.629 0.594 0.541 - 2 6 0.185 0.491 0.735 0.731 0.679 0.640 0.582 - 2 5 0.154 0.303 0.656 0.905 0.826 0.773 0.705 0.673 - 2 3 0.346 0.539 0.986 1.182 1.022 0.916 0.829 0.752 - 2 2 0.493 0.779 1.197 1.312 1.119 1.014 0.875 0.759 -21 0.704 1.010 1.420 1.503 1.219 1.094 0.947 0.860 - 1 5 4.113 4.069 3.301 2.598 1.680 1.413 1.179 1.003 - 1 4 5.031 4.856 3.629 2.719 1.728 1.442 1.202 0.994 - 1 3 6.196 5.794 3.874 2.800 1.728 1.437 1.176 0.982 - 1 2 7.347 6.552 4.085 2.864 1.741 1.427 1.155 0.966 -11 8.472 7.155 4.275 2.854 1.712 1.387 1.109"0.926
- 9 10.364 8.500 4.373 2.814 1.581 1.283 1.025 0.834 - 8 11.241 8.567 4.267 2.626 1.511 1.207 0.928 0.771 - 7 11.367 8.378 4.088 2.510 1.391 1.106 0.878 0.724 - 6 11.013 8.198 3.787 2.306 1.271 1.001 0.780 0.653 - 5 10.522 7.538 3.425 2.021 1.096 0.875 0.661 0.546
of 0.25 cm -~. Between 100 and 500 scans were coadded to obtain a single well-resolved spectrum. Triangular apodization with 15 x zero-filling was used to obtain the final spectrum.
RESULTS AND DISCUSSION
For these experiments 52 spectra were recorded from C O / C O 2 / N 2 gas samples at eight different temperatures in the high-temperature gas cell. Ten spectra were re- corded at room temperature (296 K) and six each at fur- nace set point temperatures of 373, 573, 773, 973, 1073,
TABLE III. Standard deviations (SD) and relative percent standard deviation for the replicated line strengths calculated at temperatures of 295, 720, and 1226 K.
Rela- Line SD rive SD Relative SD Relative (m) 295 K % SD 720 K % SD 1225 K % SD
- 3 5 0.011 9.11 0.044 18.49 - 3 4 0.017 11.21 0.011 4.70 -31 0.014 4.49 0.022 5.89 - 3 0 0.018 5.35 0.021 5.57 - 2 9 0.022 5.02 0.033 7.03 - 2 8 0.021 4.12 0.051 9.74 - 2 7 0.056 8.75 0.040 7.41 - 2 6 0.017 2.37 0.024 4.20 - 2 5 0.010 6.41 0.037 4.13 0.045 6.72 - 2 3 0.023 6.70 0.083 6.99 0.042 5.63 - 2 2 0.015 3.12 0.073 5.56 0.032 4.24 -21 0.041 5.81 0.094 6.22 0.046 5.34 - 1 5 0.217 5.28 0.105 4.04 0.059 5.91 - 1 4 0.231 4.59 0.115 4.22 0.029 2.88 - 1 3 0.410 6.61 0.164 5.85 0.044 4.52 - 1 2 0.431 5.86 0.171 5.97 0.031 3.22 - 11 0.482 5.68 0.098 3.43 0.047 5.04
- 9 0.656 6.33 0.177 6.27 0.045 5.41 - 8 0.691 6.14 0.137 5.21 0.028 3.65 - 7 0.762 6.71 0.091 3.61 0.027 3.74 - 6 0.500 4.54 0.111 4.81 0.038 5.89 - 5 0.689 6.27 0.106 5.24 0.031 5.60
TABLE IV. Results of error analysis calculations for the determination of line strengths. Calculations were performed for the CO m = - 1 5 line.
Calculated Calculated Relative % Temp. line strength standard standard
(K) (1/arm cm 2) deviation deviation
298 4.23 0.51 12.1 348 4.35 0.52 11.8 534 3.37 0.39 11.5 719 2.56 0.29 11.5 936 1.71 0.20 11.5
1038 1.41 0.16 11.6 1173 1.22 0.14 11.6 1199 1.05 0.04 11.5
1173, and 1273 K. All the spectra recorded for this work were of high quality, displaying excellent signal-to-noise ratios.
With a knowledge of the gas composition, a Pascal program described previously 5,7 was run on each of the 52 spectra, resulting in the determination of both the gas temperatures and the line strengths. The method of gas temperature determination has already been described: The determination of line strengths was based upon Eq. 6. The results of these calculations are presented in Tables II through IX, with the primary line strength data being given in Tables II and VI. Included in these two tables are the line strengths averaged for all spectra recorded at each furnace temperature. The temperatures reported at the top of these two tables are the averaged temperatures calculated from the spectra.
Evaluation of the accuracy and precision of the line strengths is accomplished in the following four ways: (1) by consideration of the variation among samples and a calculation of the standard deviation based upon error analysis calculations; (2) by evaluation of the Bouguer- Lambert relationship for these data; (3) by comparison with existing room-temperature and high-temperature measurements; and (4) by comparison with theoretical predictions. In the following two sections, the line strength data in Tables II and VI will be evaluated by using these four criteria, first for CO and then for CO2.
CO Absorption Lines. The temperature-dependent line strengths, calculated from the CO P branch of the 52 spectra described above, are presented in Table II. It was not possible to calculate line strengths from some lines, at the lowest three temperatures, because the peak inten-
TABLE V. Comparison of experimental room-temperature CO line strengths with values presented in the literature.
Line S(m) from S(m) from S(m) from (m) this work Ref. 4 Ref. 15
- 5 10.522 8.980 - 6 11.013 9.618 - 7 11.367 9.832 - 8 11.241 9.664 8.44 - 9 10.361 9.178 9.49
- 11 8.472 7.561 7.23 - 12 7.347 6.586 6.44 - 1 3 6.196 5.592 - 1 4 5.031 4.633 - 1 5 4.113 3.749 -21 0.704 0.660 - 2 2 0.493 0.459 - 2 3 0.346 0.313 - 2 5 0.154 0.136
1444 Volume 48, Number 11, 1994
TABLE VI. Results of line strength calculations for 19 CO2 absorption lines recorded at temperatures between 295 and 1250 K. Calculated values of S(m) are in units of 1/(atm cm2).
Line S(m) S (m) S (m) S(m) S(m) S(m) S(rn) S(m) (m) 295K 353K 535K 720K 9 3 6 K 1 0 3 4 K l 1 4 4 K 1 2 2 6 K
53 2.776 4.426 6.695 5.936 4.056 3.513 2.996 2.462 55 1.919 3.246 5.692 5.505 3.694 3.293 2.900 2.444 57 1.284 2.321 4.497 4.515 3.356 3.047 2.723 2.281 59 0.854 1.678 3.555 3.845 2.979 2.734 2.478 2.111 61 0.560 1.187 2.835 3.176 2.496 2.287 2.098 1.812 63 0.367 0.832 2.251 2.679 2.119 1.865 1.604 1.303 65 0.228 0.576 1.734 2.290 1.882 1.696 1.464 1.194 67 0.145 0.395 1.363 1.856 1.655 1.504 1.333 1.092 69 0.246 1.072 1.568 1.463 1.346 1.198 0.999 71 0.175 0.832 1.314 1.278 1.208 1.095 0.915 73 0.623 1.085 1.106 1.063 0.987 0.838 75 0.476 0.892 0.969 0.951 0.882 0.752 77 0.326 0.707 0.692 0.702 0.684 0.593 79 0.196 0.465 0.596 0.612 0.598 0.530 81 0.142 0.372 0.494 0.515 0.522 0.477 83 0.101 0.293 0.419 0.455 0.452 0.411 85 0.231 0.348 0.381 0.399 0.367 87 0.183 0.303 0.336 0.350 0.329 89 0.142 0.243 0.280 0.303 0.287
sities were too low. Other line strengths have been ex- cluded at all temperatures for lines with rn indices of - 1, -2, -3, -4, -10, -16, -17, -18, -19, -20, -24, - 32, and - 33. These lines were not fully resolved from either ~3C isotopic CO lines or hot-band CO lines.
A first measure of the precision of these line strengths is simply a calculation of the standard deviation of all calculated values at each temperature. These values, along with the calculated relative percent standard deviations [relative percent standard deviation (SD) = 100 x SD/ average line strength], are provided in Table III at three furnace temperatures. In general, the standard deviations of these values are low, equaling between 3 and 6% of the average value for most lines at all three temperatures. Furthermore, there appears to be no significant depen- dence of the relative percent standard deviations on m or the gas temperature.
TABLE VII. Standard deviation (SD) and relative percent standard deviation for the replicated CO2 line strengths calculated at temperatures of 295, 720, and 1226 K.
Line SD Relative SD Relative SD Relative (m) 295 K % SD 720 K % SD 1226 K % SD
53 0.071 2.57 0.809 13.63 0.387 15.73 55 0.052 2.72 0.879 15.97 0.341 13.94 57 0.029 2.25 0.590 13.08 0.380 16.67 59 0.027 3.12 0.373 9.71 0.339 16.05 61 0.021 3.77 0.256 8.07 0.228 12.59 63 0.021 5.61 0.206 7.69 0.092 7.05 65 0.006 2.62 0.142 6.20 0.073 6.08 67 0.005 3.65 0.121 6.49 0.064 5.88 69 0.077 4.89 0.061 6.11 71 0.057 4.37 0.045 4.92 73 0.048 4.41 0.043 5.09 75 0.030 3.40 0.039 5.24 77 0.081 11.51 0.027 4.60 79 0.013 2.71 0.027 5.03 81 0.008 2.21 0.021 4.35 83 0.011 3.67 0.018 4.47 85 0.010 4.29 0.016 4.36 87 0.007 3.65 0.017 5.05 89 0.006 4.37 0.014 4.74
TABLE VIII. Results of error analysis calculations for the determi- nation of standard deviations associated with the calculation of CO2 line strengths.
Calculated line Calculated Relative %
Line Temp. strength standard standard (m) (K) (1/atm cm 2) deviation deviation
61 298 0.529 0.026 4.86 71 348 0.177 0.008 4.64 71 534 0.809 0.043 5.23 71 719 1.275 0.060 4.72 71 936 1.193 0.053 4.42 71 1038 1.162 0.051 4.34 71 1173 1.072 0.044 4.07 71 1199 0.883 0.035 4.02
The individual factors which contribute to the vari- ability of these results can be evaluated in two ways-- first, by plots of peak height vs. concentration, the Bou- guer-Lambert relationship; and second, by error analysis. The Bouguer-Lambert relationship requires a linear re- lationship between peak height and concentration. If ei- ther the peak height or concentration values are signifi- cantly in error, the result will appear as deviations from linearity in these plots. Corrected peak heights vs. CO concentration plots are given in Figs. 1-3 for furnace temperatures of 295, 720, and 1225 K.
All the data plotted in these figures display a high degree oflineafity. Furthermore, there appear to be no significant deviations from this trend at higher temperatures or at different values of m. The linearity of these plots also suggests that gas concentrations have been measured ac- curately and that the peak height corrections have been performed correctly. Accurate knowledge of each of these factors is critical to line strength calculations, since each is either directly (peak height) or inversely (concentration) proportional to the line strength.
A more direct determination of the precision of the calculated line strengths can be obtained from a standard error analysis based upon consideration of the standard deviations of all the components used in Eq. 6 for the calculation of line strengths. Such an error analysis pro- vides an estimate of the relative magnitude of variation that each individual source contributes to the total vari- ation. The error analysis was determined for one CO line of each spectrum at each temperature level by
TABLE IX. Comparison of experimental room-temperature COs line strengths with values presented in the literature (line strength units, 1/(atm cm2)).
S(m) S(m) S(m) S(m) S(rn) S(m) Line from from from from from from (m) this work Ref. 17 Ref. 18 Ref. 19 Ref. 20 Ref. 21
53 2.776 2.775 2.50 2.579 - - 3.049 55 1.919 - - - - 1.791 - - 1.936 57 1.284 1.278 1.17 1.229 -- 1.407 59 0.854 0.796 0.769 0.832 -- 0.827 61 0.560 0.554 0.510 0.552 -- 0.615 63 0.367 0.353 -- 0.361 0.352 0.382 65 0.228 0.224 0.211 0.233 0.228 0.237 67 0.145 0.140 0.132 0.147 0.144 0.157
APPLIED SPECTROSCOPY 1445
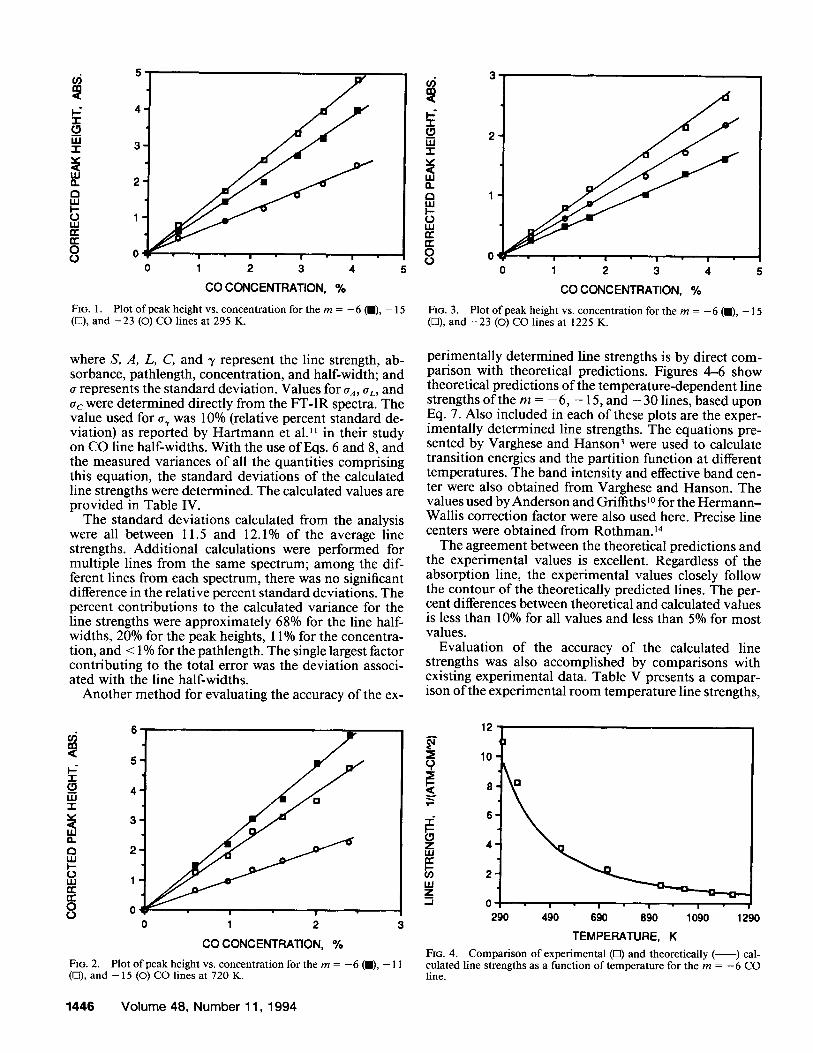
FIG. 1.
I
0 1 2 3 4 5
CO CONCENTRATION, %
"1 = I l I I
0 1 2 3 4 5
CO CONCENTRATION, %
Plot of peak height vs. concentration for the m = - 6 (11), - 15 (D), and - 2 3 (O) CO lines at 295 K.
where S, A, L, C, and 3' represent the line strength, ab- sorbance, pathlength, concentration, and half-width; and ~r represents the standard deviation. Values for aA, aL, and crc were determined directly from the FT-IR spectra. The value used for a, was 10% (relative percent standard de- viation) as reported by Hartmann et al. ~ in their study on CO line half-widths. With the use ofEqs. 6 and 8, and the measured variances of all the quantities comprising this equation, the standard deviations of the calculated line strengths were determined. The calculated values are provided in Table IV.
The standard deviations calculated from the analysis were all between 11.5 and 12.1% of the average line strengths. Additional calculations were performed for multiple lines from the same spectrum; among the dif- ferent lines from each spectrum, there was no significant difference in the relative percent standard deviations. The percent contributions to the calculated variance for the line strengths were approximately 68% for the line half- widths, 20% for the peak heights, 11% for the concentra- tion, and < 1% for the pathlength. The single largest factor contributing to the total error was the deviation associ- ated with the line half-widths.
Another method for evaluating the accuracy of the ex-
I _o uJ
111 o. 0 w I - O w 0C OC o
Fzo. 2.
6
5 -
4 -
3 -
2 -
1
0 I i 0 1 2
CO CONCENTRATION, %
Plot of peak height vs. concentration for the m = - 6 (11), - 11 (O), and - 1 5 (O) CO lines at 720 K.
3
8 2
0 1
o O
05 5
_o ILl
3 " ,
D w
0 1 - w
0 0: o
Fio. 3. Plot of peak height vs. concentration for the m = - 6 (11), - 15 ([2), and - 2 3 (O) CO lines at 1225 K.
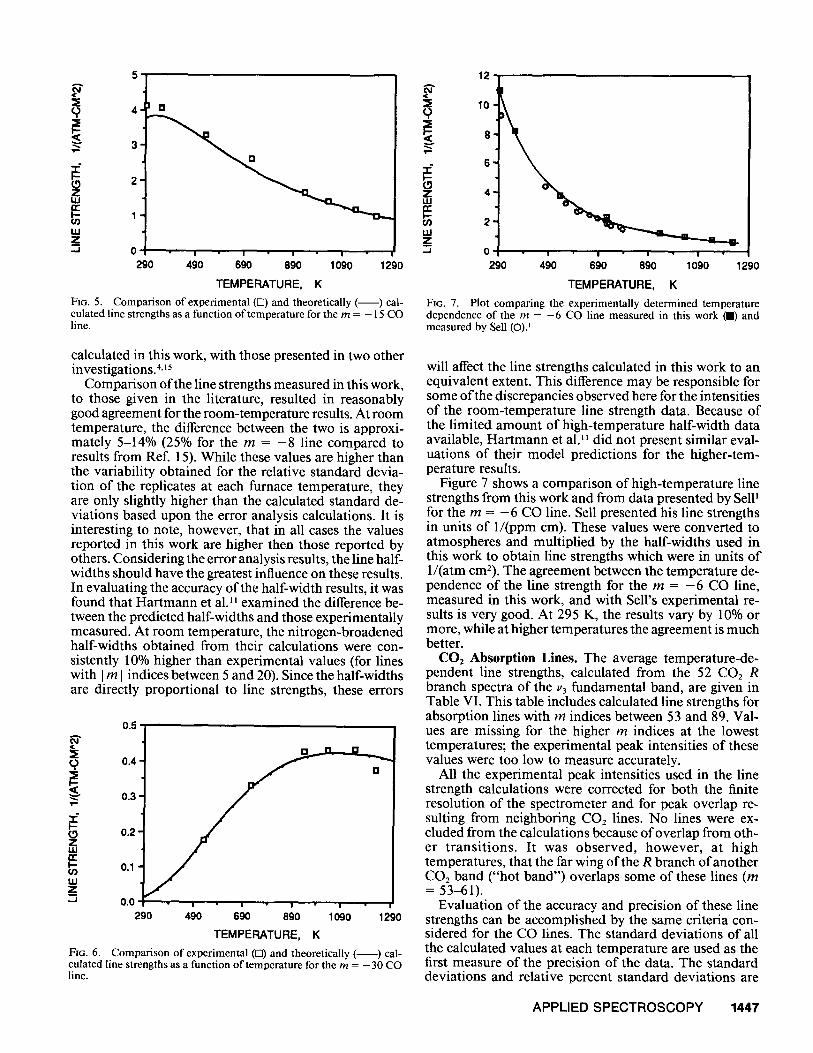
perimentally determined line strengths is by direct com- parison with theoretical predictions. Figures 4-6 show theoretical predictions of the temperature-dependent line strengths of the m = - 6 , - 15, and - 3 0 lines, based upon Eq. 7. Also included in each of these plots are the exper- imentally determined line strengths. The equations pre- sented by Varghese and Hanson 3 were used to calculate transition energies and the partition function at different temperatures. The band intensity and effective band cen- ter were also obtained from Varghese and Hanson. The values used by Anderson and Grifliths ~° for the Hermann- Wallis correction factor were also used here. Precise line centers were obtained from Rothman. TM
The agreement between the theoretical predictions and the experimental values is excellent. Regardless of the absorption line, the experimental values closely follow the contour of the theoretically predicted lines. The per- cent differences between theoretical and calculated values is less than 10% for all values and less than 5% for most values.
Evaluation of the accuracy of the calculated line strengths was also accomplished by comparisons with existing experimental data. Table V presents a compar- ison of the experimental room temperature line strengths,
12
z 4 ¸
2 -
0 ! ! i
290 490 690 890 1090 1290
TEMPERATURE, K FIG. 4. Comparison of experimental ([3) and theoretically ( ) cal- culated line strengths as a function of temperature for the m = -6 CO line.
1446 Volume 48, Number 11, 1994
1
0 I I !
290 490 690 890 1090 1290
TEMPERATURE, K
FIG. 5. Comparison of experimental ([]) and theoretically ( ) cal- culated line strengths as a function of temperature for the m = - 15 CO line.
12
6
0
290 490 690 890 1090 1290
TEMPERATURE, K FiG. 7. Plot comparing the experimentally determined temperature dependence of the rn = - 6 CO line measured in this work (11) and measured by Sell (O).'
calculated in this work, with those presented in two other investigations .4,15
Comparison of the line strengths measured in this work, to those given in the literature, resulted in reasonably good agreement for the room-temperature results. At room temperature, the difference between the two is approxi- mately 5-14% (25% for the m = - 8 line compared to results from Ref. 15). While these values are higher than the variability obtained for the relative standard devia- tion of the replicates at each furnace temperature, they are only slightly higher than the calculated standard de- viations based upon the error analysis calculations. It is interesting to note, however, that in all cases the values reported in this work are higher then those reported by others. Considering the error analysis results, the line half- widths should have the greatest influence on these results. In evaluating the accuracy of the half-width results, it was found that Hartmann et al. ~' examined the difference be- tween the predicted half-widths and those experimentally measured. At room temperature, the nitrogen-broadened half-widths obtained from their calculations were con- sistently 10% higher than experimental values (for lines with I m I indices between 5 and 20). Since the half-widths are directly proportional to line strengths, these errors
0.5
0.4 '
~- 0.3'
(9 0.2 Z tM
w z "J 0.0 , , ! I
290 490 690 890 1090 1290
TEMPERATURE, K FZG. 6. Comparison of experimental (E2) and theoretically ( ) cal- culated line strengths as a function of temperature for the m = -30 CO line.
will affect the line strengths calculated in this work to an equivalent extent. This difference may be responsible for some of the discrepancies observed here for the intensities of the room-temperature line strength data. Because of the limited amount of high-temperature half-width data available, Hartmann et al.~l did not present similar eval- uations of their model predictions for the higher-tem- perature results.
Figure 7 shows a comparison of high-temperature line strengths from this work and from data presented by Sell ~ for the rn = - 6 CO line. Sell presented his line strengths in units of 1/(ppm cm). These values were converted to atmospheres and multiplied by the half-widths used in this work to obtain line strengths which were in units of 1/(arm cm2). The agreement between the temperature de- pendence of the line strength for the m = - 6 CO line, measured in this work, and with Sell's experimental re- sults is very good. At 295 K, the results vary by 10% or more, while at higher temperatures the agreement is much better.
CO2 Absorption Lines. The average temperature-de- pendent line strengths, calculated from the 52 CO2 R branch spectra of the ~3 fundamental band, are given in Table VI. This table includes calculated line strengths for absorption lines with m indices between 53 and 89. Val- ues are missing for the higher m indices at the lowest temperatures; the experimental peak intensities of these values were too low to measure accurately.
All the experimental peak intensities used in the line strength calculations were corrected for both the finite resolution of the spectrometer and for peak overlap re- sulting from neighboring CO2 lines. No lines were ex- cluded from the calculations because of overlap from oth- er transitions. It was observed, however, at high temperatures, that the far wing of the R branch of another CO2 band ("hot band") overlaps some of these lines (m = 53-61).
Evaluation of the accuracy and precision of these line strengths can be accomplished by the same criteria con- sidered for the CO lines. The standard deviations of all the calculated values at each temperature are used as the first measure of the precision of the data. The standard deviations and relative percent standard deviations are
APPLIED SPECTROSCOPY 1447
-I-
UJ "1"
W
r~ IJJ I - O I.U
O o
FIG. 8. (ll), 57 (O), and 63 (©) lines at 296 K.
20 2 t 0
1.0
,t 0.5 =o 2
0.0 8 0 0.0 0.5 1.0 1.5 2.0 0 1 2 3 4
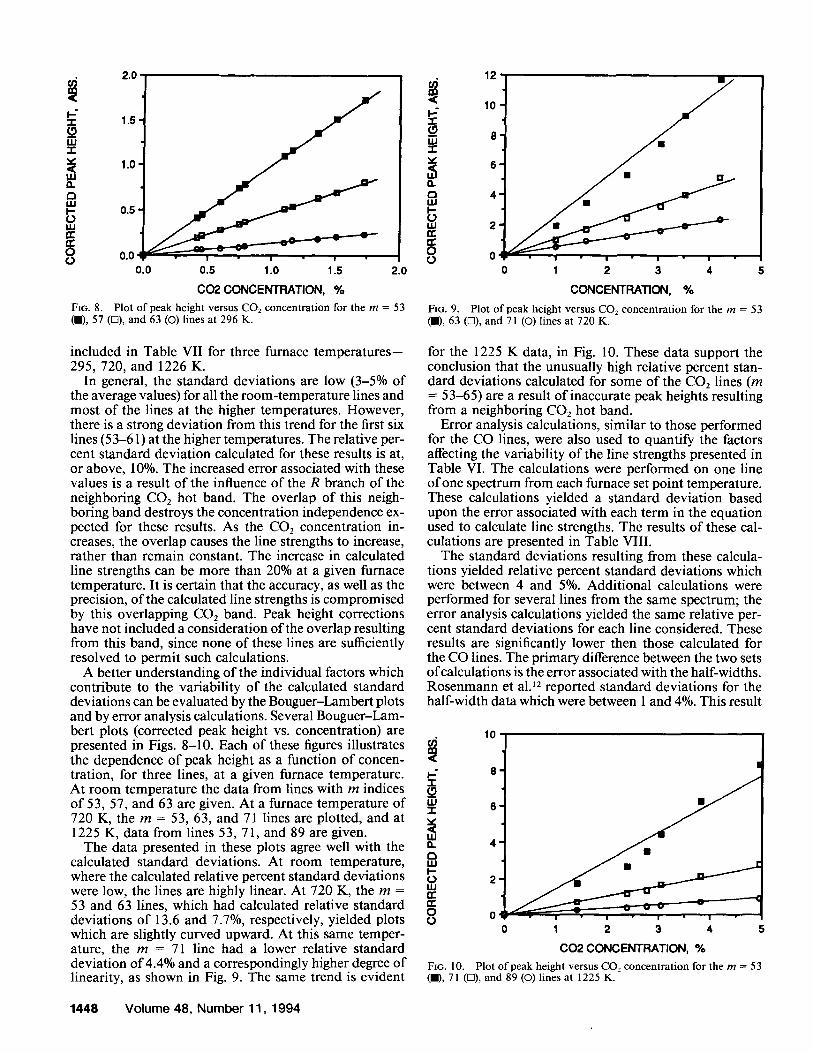
CO2 CONCENTRATION, % CONCENTRATION, % Plot of peak height versus CO2 concentration for the m = 53 Fro. 9. Plot o f peak height versus CO2 concentra t ion for the m = 53
(11), 63 (D), and 71 (©) lines at 720 K.
included in Table VII for three furnace temperatures-- 295, 720, and 1226 K.
In general, the standard deviations are low (3-5% of the average values) for all the room-temperature lines and most of the lines at the higher temperatures. However, there is a strong deviation from this trend for the first six lines (53-61) at the higher temperatures. The relative per- cent standard deviation calculated for these results is at, or above, 10%. The increased error associated with these values is a result of the influence of the R branch of the neighboring CO2 hot band. The overlap of this neigh- boring band destroys the concentration independence ex- pected for these results. As the CO2 concentration in- creases, the overlap causes the line strengths to increase, rather than remain constant. The increase in calculated line strengths can be more than 20% at a given furnace temperature. It is certain that the accuracy, as well as the precision, of the calculated line strengths is compromised by this overlapping CO2 band. Peak height corrections have not included a consideration of the overlap resulting from this band, since none of these lines are sufficiently resolved to permit such calculations.
A better understanding of the individual factors which contribute to the variability of the calculated standard deviations can be evaluated by the Bouguer-Lambert plots and by error analysis calculations. Several Bouguer-Lam- bert plots (corrected peak height vs. concentration) are presented in Figs. 8-10. Each of these figures illustrates the dependence of peak height as a function of concen- tration, for three lines, at a given furnace temperature. At room temperature the data from lines with m indices of 53, 57, and 63 are given. At a furnace temperature of 720 K, the m = 53, 63, and 71 lines are plotted, and at 1225 K, data from lines 53, 71, and 89 are given.
The data presented in these plots agree well with the calculated standard deviations. At room temperature, where the calculated relative percent standard deviations were low, the lines are highly linear. At 720 K, the m = 53 and 63 lines, which had calculated relative standard deviations of 13.6 and 7.7%, respectively, yielded plots which are slightly curved upward. At this same temper- ature, the m = 71 line had a lower relative standard deviation of 4.4% and a correspondingly higher degree of linearity, as shown in Fig. 9. The same trend is evident
for the 1225 K data, in Fig. 10. These data support the conclusion that the unusually high relative percent stan- dard deviations calculated for some of the CO2 lines (m = 53-65) are a result of inaccurate peak heights resulting from a neighboring CO2 hot band.
Error analysis calculations, similar to those performed for the CO lines, were also used to quantify the factors affecting the variability of the line strengths presented in Table VI. The calculations were performed on one line of one spectrum from each furnace set point temperature. These calculations yielded a standard deviation based upon the error associated with each term in the equation used to calculate line strengths. The results of these cal- culations are presented in Table VIII.
The standard deviations resulting from these calcula- tions yielded relative percent standard deviations which were between 4 and 5%. Additional calculations were performed for several lines from the same spectrum; the error analysis calculations yielded the same relative per- cent standard deviations for each line considered. These results are significantly lower then those calculated for the CO lines. The primary difference between the two sets of calculations is the error associated with the half-widths. Rosenmann et al. 12 reported standard deviations for the half-width data which were between 1 and 4%. This result
o I.u
O W I--- 0 u.I
t~ o o
FIG. 10.
i 0 I 2 3 4 5
CO2 CONCENTRATION, %
Plot of peak height versus CO2 concentration for the m = 53 (11), 71 (D), and 89 (©) lines at 1225 K.
1448 Volume 48, Number 11, 1994
~ " 7.0-
6.0-
~. 5.0-
4.0-
3.0'
2.0'
1.0 290
} {
I I I I
490 690 890 1090 1290
TEMPERATURE, K
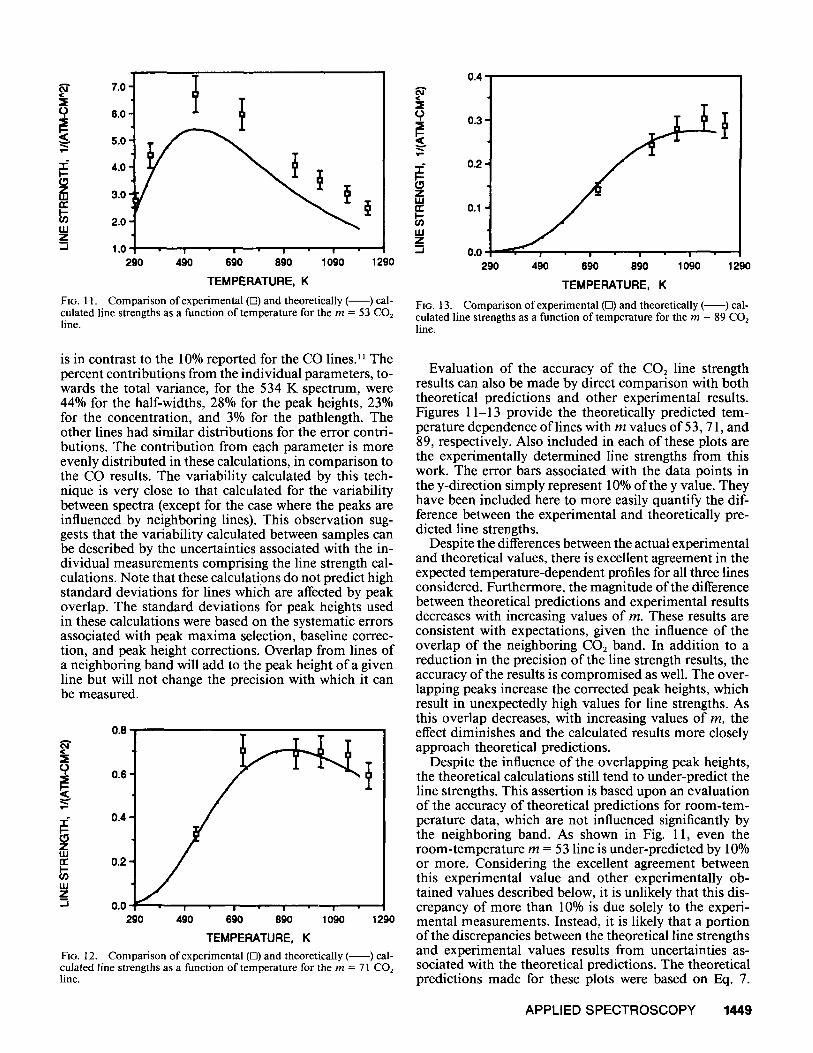
FIG. 11. Comparison of experimental ([~) and theoretically ( ) cal- culated line strengths as a function of temperature for the m = 53 CO2 line.
is in contrast to the 10% reported for the CO lines. 11 The percent contributions from the individual parameters, to- wards the total variance, for the 534 K spectrum, were 44% for the half-widths, 28% for the peak heights, 23% for the concentration, and 3% for the pathlength. The other lines had similar distributions for the error contri- butions. The contribution from each parameter is more evenly distributed in these calculations, in comparison to the CO results. The variability calculated by this tech- nique is very close to that calculated for the variability between spectra (except for the case where the peaks are influenced by neighboring lines). This observation sug- gests that the variability calculated between samples can be described by the uncertainties associated with the in- dividual measurements comprising the line strength cal- culations. Note that these calculations do not predict high standard deviations for lines which are affected by peak overlap. The standard deviations for peak heights used in these calculations were based on the systematic errors associated with peak maxima selection, baseline correc- tion, and peak height corrections. Overlap from lines of a neighboring band will add to the peak height of a given line but will not change the precision with which it can be measured.
0.8 A
o, }
O~ 0.4,
0.2,
0.0 | I I
290 490 690 890 1090 1290
TEMPERATURE, K
Fzo. 12. Comparison of experimental (D) and theoretically ( ) cal- culated line strengths as a function of temperature for the m = 71 COs line.
0.4
o.3 }
0.2
0.1
0.0 , , !
290 490 690 890 1090 1290
TEMPERATURE, K
F[o. 13. Comparison of experimental (D) and theoretically ( ) cal- culated line strengths as a function of temperature for the m = 89 CO2 line.
Evaluation of the accuracy of the C O 2 line strength results can also be made by direct comparison with both theoretical predictions and other experimental results. Figures 11-13 provide the theoretically predicted tem- perature dependence of lines with m values of 53, ? l, and 89, respectively. Also included in each of these plots are the experimentally determined line strengths from this work. The error bars associated with the data points in the y-direction simply represent 10% of the y value. They have been included here to more easily quantify the dif- ference between the experimental and theoretically pre- dicted line strengths.
Despite the differences between the actual experimental and theoretical values, there is excellent agreement in the expected temperature-dependent profiles for all three lines considered. Furthermore, the magnitude of the difference between theoretical predictions and experimental results decreases with increasing values of m. These results are consistent with expectations, given the influence of the overlap of the neighboring CO2 band. In addition to a reduction in the precision of the line strength results, the accuracy of the results is compromised as well. The over- lapping peaks increase the corrected peak heights, which result in unexpectedly high values for line strengths. As this overlap decreases, with increasing values of m, the effect diminishes and the calculated results more closely approach theoretical predictions.
Despite the influence of the overlapping peak heights, the theoretical calculations still tend to under-predict the line strengths. This assertion is based upon an evaluation of the accuracy of theoretical predictions for room-tem- perature data, which are not influenced significantly by the neighboring band. As shown in Fig. 1 l, even the room-temperature m = 53 line is under-predicted by 10% or more. Considering the excellent agreement between this experimental value and other experimentally ob- tained values described below, it is unlikely that this dis- crepancy of more than 10% is due solely to the experi- mental measurements. Instead, it is likely that a portion of the discrepancies between the theoretical line strengths and experimental values results from uncertainties as- sociated with the theoretical predictions. The theoretical predictions made for these plots were based on Eq. 7.
APPLIED S P E C T R O S C O P Y 1449
Data required for the calculations were taken f rom a num- ber o f sources; part i t ion functions were obta ined f rom Gray and Selvidge,16 band strength and band center data were obta ined f rom Devi et al., ~7 and line centers and energies were obta ined f rom Ro thman . ~4 Unfortunately, uncertainty levels have not been prov ided with these data which would permi t error analysis calculations.
One final me thod o f evaluating the accuracy o f the exper imenta l results is to make direct compar i sons with previously repor ted exper imenta l data. There have been several reports o f the line strengths o f these CO: lines at r o o m tempera ture , a l though there have been no experi- menta l data found that describe their t empera ture de- pendence. R o o m - t e m p e r a t u r e exper imenta l results f rom the literature, as well as the data f rom this work, are presented in Table IX.
The agreement between the room- t empera tu r e line strength results f rom this work and those presented pre- viously in the l i terature is very good. An average line strength was calculated for each line f rom the li terature values, and the percent differences between that average value and the results f rom this work were calculated. The percent differences were found to be 1.8, 2.9, 1.0, 5.6, 0.4, 0.5, and 0.6% for lines 53-67, respectively. Unfor - tunately, no h igh- tempera ture data have been found in order to make similar compar isons . The excellent agree- men t between the room- t empera tu r e exper imenta l results o f this work c o m p a r e d to those presented by others pro- vides confidence in the methodologies used to calculate line strengths f rom the absorpt ion spectra.
C O N C L U S I O N
Exper imenta l line strength data have been presented for 22 CO lines in the t empera ture range between 295 and 1225 K. On the basis o f error analysis calculations, these values have calculated relative percent s tandard de- via t ions o f 11-12%. At r o o m temperature , the line in- tensities measured here are approx imate ly 10ol 5% higher than those previously reported. At higher temperatures , the difference between the values reported here and the- oretical predict ions is less than 10%. The values repor ted here for the m = - 6 line and those previously reported are again 10-15% higher at r o o m tempera ture , with the difference decreasing at higher temperatures .
For CO2, the line strengths o f 19 absorpt ion lines have been reported. At r o o m temperature , the agreement be- tween these values and those previously repor ted in the l i terature is very good (approximate ly 5%). At higher t em- peratures the agreement with these values and theoretical predict ions is within 10% for lines with m indices greater than 65. At tempera tures greater than 300 K, line strength
data for lines with m indices between 53 and 65 are sig- nificantly dis torted by peak over lap f rom a neighboring CO2 hot band.
The exper imenta l line strength results presented in this work provide an unders tanding o f the absorpt ion behav- ior o f over 40 CO and CO2 vibra t ional - rota t ional ab- sorpt ion lines. These values have been used for the de- terminat ion of gas concentrations at temperatures between 295 and 1250 K in a pure gas env i ronmen t 6 and in a combus t ion env i ronment . 7
ACKNOWLEDGMENTS The authors gratefully acknowledge the fmancial support oblained from
the U.S. Department of Energy under Grant DE-ACO2-83CE40637 and also that obtained from the Institute of Paper Science and Tech- nology and its member companies. Portions of this work were used by Patrick J. Medvecz as partial fulfillment of the requirements for the Ph.D. degree at the Institute of Paper Science and Technology.
1. J. A. Sell, J. Quant. Spectrosc. Radiat. Transfer 23, 595 (1980). 2. R. K. Hanson, Proc. SPIE-Int. Soc. Opt. Eng. 438 (Tunable Diode
Laser Dev. Spectrosc. Apl.), 75 (1983). 3. P. L. Varghese and R. K. Hanson, J. Quant. Spectrosc. Radiat.
Transfer 24, 479 (1980). 4. C. Chackefian, Jr., G. Guelachvili, and R. H. Tipping, J. Quant.
Spectrosc. Radiat. Transfer 30, 107 (1983). 5. P. J. Medvecz, K. M. Nichols, D. T. Clay, and R. Atalla, Appl.
Spectrosc. 45, 1350 (1991 ). 6. P.J. Medvecz and K. M. Nichols, Appl. Spectrosc. 46, 1887 (1992). 7. P. J. Medvecz, Ph.D. Dissertation, The Institute of Paper Science
and Technology, Atlanta, Georgia (1991). 8. R. J. Anderson and P. R. Grittiths, Anal. Chem. 47, 2339 (1975). 9. L. A. Gross, P. R. Gritfiths, and J. N.-P. Sun, "Temperature Mea-
surement by Infrared Spectrometry", in Infrared Methods for Gas- eous Measurements, J. Wormhoudt, Ed. (Marcel Dekker, New York, 1985), Chap. 3.
10. R. J. Anderson and P. R. Griffiths, J. Quant. Spectrosc. Radiat. Transfer 17, 393 (1977).
11. J. M. Hartmann, L. Rosenmann, M. Y. Perrin, and J. Taine, Appl. Opt. 27, 3063 (1988).
12. L. Rosenmann, J. M. Hartmann, M. Y. Perrin, and J. Taine, Appl. Opt. 27, 3902 (1988).
13. G. Herzberg, Molecular Spectra and Molecular Structure." Spectra ofDiatornicMolecules (D. Van Nostrand Company, Princeton, New Jersey, 1945).
14. L. S. Rothman, Appl. Opt. 20, 791 (1981). 15. P. Varanasi and S. Sarangi, J. Quant. Spectrosc. Radiat. Transfer
15, 473 (1975). 16. L. D. Gray and J. E. Selvidge, J. Quant. Spectrosc. Radiat. Transfer
5, 291 (1965). 17. V. Malathy Devi, B. Ffidovich, G. D. Jones, and D. G. Snyder, J.
Mol. Spectrosc. 105, 61 (1984). 18. C. Cousin, R. Le Doucen, J. P. Houdeau, C. Boulet, and A. Henry,
Appl. Opt. 25, 2434 (1986), 19. J. W. C. Johns, J. Mol. Spectrosc. 125, 442 (1987). 20. J. W. C. Johns, J. Mol. Spectrosc. 134, 433 (1989). 21. B. Fridovich, W. C. Braun, G. R. Smith, and E. E. Champion, J.
Mol. Spectrosc. 81, 248 (1980).
1450 Volume 48, Number 11, 1994


![Detecting Carbon Monoxide Poisoning Detecting Carbon ...2].pdf · Detecting Carbon Monoxide Poisoning Detecting Carbon Monoxide Poisoning. Detecting Carbon Monoxide Poisoning C arbon](https://img.pdfslide.net/doc/110x75/5f551747b859172cd56bb119/detecting-carbon-monoxide-poisoning-detecting-carbon-2pdf-detecting-carbon.jpg)