Embed Size (px)
Citation preview

Experimental determination of the radiation doselimit for cryocooled protein crystalsRobin Leslie Owen*, Enrique Rudino-Pinera†, and Elspeth F. Garman*‡
*Laboratory of Molecular Biophysics, Department of Biochemistry, Oxford University, South Parks Road, Oxford OX1 3QU, United Kingdom;and †Instituto de Biotecnologia, Universidad Nacional Autonoma De Mexico, Cuernavaca, Morelos, C.P. 62271, Mexico
Communicated by Douglas C. Rees, California Institute of Technology, Pasadena, CA, February 6, 2006 (received for review November 9, 2005)
Radiation damage to cryocooled protein crystals during x-raystructure determination has become an inherent part of macro-molecular diffraction data collection at third-generation synchro-trons. Generally, radiation damage is an undesirable component ofthe experiment and can result in erroneous structural detail in thefinal model. The characterization of radiation damage thus hasbecome an important area for structural biologists. The calculateddose limit of 2 � 107 Gy for the diffracting power of cryocooledprotein crystals to drop by half has been experimentally evaluatedat a third-generation synchrotron source. Successive data sets werecollected from four holoferritin and three apoferritin crystals. Theabsorbed dose for each crystal was calculated by using the pro-gram RADDOSE after measurement of the incident photon flux anddetermination of the elemental crystal composition by micro-particle-induced x-ray emission. Degradation in diffraction qualityand specific structural changes induced by synchrotron radiationthen could be compared directly with absorbed dose for differentdose�dose rate regimes: a 10% lifetime decrease for a 10-fold doserate increase was observed. Remarkable agreement both betweendifferent crystals of the same type and between apoferritin andholoferritin was observed for the dose required to reduce thediffracted intensity by half (D1/2). From these measurements, adose limit of D1/2 � 4.3 (�0.3) �107 Gy was obtained. However, byconsidering other data quality indicators, an intensity reduction toIln2 � ln2 � I0, corresponding to an absorbed dose of 3.0 � 107 Gy,is recommended as an appropriate dose limit for typical macro-molecular crystallography experiments.
experimental dose limit � macromolecular cryocrystallography �radiation damage
The problem of radiation damage suffered by protein crystalsduring x-ray structure determination has plagued crystallog-
raphers since the early days of the field (1), when often severalcrystals were required to obtain a complete room temperaturedata set. The introduction of macromolecular crystallographycryocooling techniques in the 1990s reduced the rate of radiationdamage to the extent that researchers could largely disregard itand could normally obtain all of the required data from a singlecrystal (2–4). However, with the advent of third-generationsynchrotrons and the provision of undulator fed beamlines, theobservation of radiation damage has become commonplace,manifested as a reduction in diffracting power and a loss ofhigh-resolution reflections even at cryotemperatures of �100 K.In addition, the incident x-rays induce specific structural changesin the protein in a well defined sequence, some amino acids beingmore susceptible than others (5–7). This phenomenon canchange the biological information inferred from an x-ray struc-ture, the active sites of enzymes and metalloproteins beingparticularly affected (8).
Although it is possible to make use of this damage, for examplefor radiation damage-induced phasing (RIP) (9), in the majorityof cases radiation damage is an unwelcome part of data collec-tion (10). Thus, quantification of the exposure time availablebefore the effects of damage become too detrimental wouldallow the experimenter to design optimal data collection strat-
egies. The aim of the present work is to define an experimentaldose limit for macromolecular crystallography after which fur-ther data collection would be unproductive.
By using observations of the rate of radiation damage duringelectron diffraction experiments, and assuming that electronsand x-rays are similarly damaging to the order that gives rise todiffraction in protein crystals, Henderson proposed a dose limitof 2 � 107 Gy (Gy � J�kg�1) for cryocooled (77 K) proteincrystals, at which the diffracted intensity would be halved (11).The investigation reported here has experimentally determinedthis dose limit by measuring the reduction in the diffractingpower of crystals as a function of dose, as well as changes inelectron density and global-diffraction quality indicators such asRmeas (12) and Wilson B values. For these experiments, the twocrystal species apoferritin and holoferritin were chosen, becauseapoferritin has a typical protein crystal composition, whereasholoferritin is at the upper limit of metal content for a protein,having �2,000 iron atoms for every 4,176 aa: a ratio of almost1:2. The large iron content of holoferritin almost doubles thenumber of photons being absorbed compared with apoferritinfor the same incident photon flux. These two systems werechosen to establish whether or not a dose limit is independent ofthe heavy atom content of crystal species, while keeping all otherexperimental parameters constant. Results from the study ofthree apoferritin and four holoferritin crystals are presented.
ResultsThe effect of radiation damage was investigated by monitoringa number of parameters as a function of the absorbed dose. Thediffracting power of the crystals, as assessed by summing thescaled intensities of all of the reflections in the data set, ITot, bothover all resolution ranges and also in the outermost resolutionshell (taken as 4 Å to the limit of diffraction), and the Rmeas andWilson B values. Crystal mosaicity and unit cell volume also wereexamined (data not shown). From this data analysis, the effectsof radiation damage can clearly be seen as a function of thecumulative dose at the midpoint of the data set (DCM) for allseven crystals studied (see Tables 2–4, which are published assupporting information on the PNAS web site). To calculate thiscumulative dose, the beam and crystal were characterized asdetailed below.
The beam profile on ID14-4 has been determined to be atop-hat shape (13), and the photon flux was calibrated by usinga photodiode. Different attenuations were used in the experi-ments to allow investigation of possible dose rate effects, the fluxbeing varied from 0.3 � 1011 to 3.9 � 1011 photons per s (valuesshown in Fig. 1), always with a 100 � 100-�m beam as calibratedby using a yttrium�aluminum garnet (YAG) screen viewed by anon axis camera.
Conflict of interest statement: No conflicts declared.
Abbreviation: microPIXE, micro-particle-induced x-ray emission.
‡To whom correspondence should be addressed at: Laboratory of Molecular Biophysics,Department of Biochemistry, Oxford University, Rex Richards Building, South Parks Road,Oxford OX1 3QU, United Kingdom. E-mail: [email protected].
© 2006 by The National Academy of Sciences of the USA
4912–4917 � PNAS � March 28, 2006 � vol. 103 � no. 13 www.pnas.org�cgi�doi�10.1073�pnas.0600973103
Dow
nloa
ded
by g
uest
on
June
28,
202
0

After the collection of micro-particle-induced x-ray emis-sion (microPIXE) elemental maps (Fig. 2), the stoichiometricratios of sulfur, cadmium, and iron were measured by collect-ing point spectra on both apoferritin and holoferritin liquidprotein samples and apoferritin and holoferritin crystals. Noiron was detected in any of the apoferritin samples; the lowestdetectable limit was 0.07 iron atoms per monomer. Knowledgeof the sulfur content (two cysteines and three methionines) offerritin allowed the number of iron and cadmium atoms permonomer to be calculated, starting with the iron to sulfur ratiopresent in the commercial holoferritin protein. From this ratio,the cadmium and additional sulfur per monomer in the crystals(from the crystallization buffer) could be quantified. For theapoferritin crystals, the cadmium to solvent sulfur ratio fromthe holoferritin crystal was used, but to obtain the number ofeach species per monomer (Table 1), the values were scaled totake into account the volume of the inner 24-mer ferritin shellnormally occupied by the iron. The iron content of holofer-ritin, measured to be 1,750 and 1,766 atoms per 24-mer,respectively, for the two batches of protein used, is remarkablyconsistent and compares favorably with previous work thatreported an average of 2,000 iron atoms per 24-mer for horsespleen ferritin (14).
To make a direct comparison with the calculated Hendersondose limit of 2 � 107 Gy, at which diffraction intensity ispredicted to be halved (D1/2), data set quality was initiallyassessed in terms of a reduction of the diffracting power of thecrystals. As reflections measured in successive data sets arecollected over the same region of reciprocal space, ITot provides
a convenient method of quantifying the intensity reduction. Ialso can be measured over different resolution ranges, allowingthe effect of radiation damage on low- and high-resolutionreflections to be differentiated. The summed intensity of thereflections, ITot, was normalized to 1.0 for the first data set (i.e.,I�Tot � ID�I0), to allow easy comparison between differentcrystals. The decay of I�Tot with dose was fitted with a linearfunction for all seven crystals, giving correlation coefficients ofnot less than 95%. The rate of decay was observed to beremarkably consistent, not only for the four holoferritin (Fig. 3)and three apoferritin (Fig. 4) crystals, but for all seven crystals.The average D1/2 is 4.3 (�0.3) �107 Gy, where the error takesaccount of the variance of the individual measurements and theerrors associated with the dose calculation.
The overall error is dominated by the uncertainties associatedwith the computation of the absorbed dose. The experimentalparameters affecting this calculation can be divided into threecomponents.
The first of these components relates to the photodiodecalibration. This calibration depends on both an accurate knowl-edge of the silicon diode thickness, so that the energy loss in itcan be properly calculated, and also on the calibration, whichcorrelates the in-line diode readings with the current observedin the calibrated diode. Both these errors are small (�3%)compared with the second source of error: the uncertainty in themicroPIXE elemental composition determination. The error onstoichiometric ratios determined by this method is known frommeasurements on standards and is typically �15% (15). In thiscase, different points measured on the same crystal gave resultswith a standard error of 7% (changing the iron content inRADDOSE by 7% changes the absorption coefficient of the crystalby 4%).
The third component of error is due to the rotation of thecrystal in the beam; if the crystal is bigger than the x-ray beam,new, previously unirradiated material is brought into the beamresulting in a larger irradiated volume and thus a lower absorbeddose. Currently, RADDOSE does not account for this effect. In ourcase, the small rotation range required to obtain complete data
Fig. 1. Bar chart showing the incident photons per second and the absorbeddose per second for the four holoferritin and three apoferritin crystals studied.The difference in the relative size of the photons per second bar comparedwith the dose per second bar for the two crystal types highlights the necessityof taking careful account of the crystal composition when calculating theabsorbed dose.
Fig. 2. Elemental areal concentration microPIXE maps (500 � 500 �m) obtained by scanning a 1-�m-diameter proton beam in x and y across a holoferritin crystal(holo1): sulfur (Left), iron (Center), and cadmium (Right) distributions. The iron is localized in the protein crystal, whereas because of the presence of ammoniumsulfate in the solvent, the sulfur is more spread out.
Table 1. Results of the microPIXE elemental compositiondeterminations on apoferritin and holoferritin crystals
Element
No. of atoms per monomer(per 24-mer)
Holoferritin Apoferritin
Sulfur (protein) 5 (120) 5 (120)Sulfur (solvent) 120.7 (2,897) 154.7 (3,713)Cadmium 8.9 (213.6) 11.3 (271)Iron batch 1 72.9 (1,750) �0.07 (�1.7)Iron batch 2 73.6 (1,766) �0.07 (�1.7)
Owen et al. PNAS � March 28, 2006 � vol. 103 � no. 13 � 4913
BIO
PHYS
ICS
Dow
nloa
ded
by g
uest
on
June
28,
202
0

results in a correspondingly small irradiated volume correction,depending on the crystal shape and initial orientation (�5%here). Hence, the cumulative doses were not corrected for thiseffect.
An additional correction associated with the physics of theenergy loss calculation carried out in RADDOSE is necessary. Theprogram currently does not take into account that for heavierelements, atoms excited by a K-shell photoelectron emission candecay by fluorescence as opposed to the Auger effect. Depend-ing on their energy, these fluorescent x-rays may have a highprobability of escaping from the sample. The overall energydeposited in the crystal is thereby reduced, thus lowering theabsorbed dose.
For elements with Z � 20, the probability of fluorescence is�10%, so the concomitant energy loss can be neglected. How-ever, for the iron in the holoferritin crystals, 34% of K-shellexcitations produce fluorescent x-rays, �80% of which canescape from a 200-�m-thick crystal. Thus, for the holoferritincrystals, this effect reduces the effective photoelectric cross
section of the iron atoms, and our doses have been correspond-ingly corrected.
Although there is good agreement between our results for D1/2from the seven crystals investigated, it should be noted that themean D1/2 obtained for the apoferritin crystals [4.8 (�0.2) �107
Gy] is systematically higher than that observed for holoferritincrystals [4.0 (�0.2) �107 Gy]. This difference is not thought tobe due to temperature rises in the crystals: by using the lumpedmodel described by Kuzay et al. (16), RADDOSE predicts atemperature rise of �5 K for holoferritin at the highest dose rateused. Previous measurements using a white beam of flux densityof 2 � 1015 photons per s�mm2 found no evidence of beamheating in a 100 K crystal sample (17). Two effects may beresponsible for the measured dose limit difference: first, theuncertainty in the holoferritin dose calculation, which is greaterbecause of the large iron content, and second, the dose is aparameter that takes only the deposited energy into account butnone of the possible chemical processes.
The different values of D1/2 can be compared to investigate anydependence on the dose rate. We find that for both apoferritinand holoferritin, the higher the dose rate, the lower the resultingD1/2. For apoferritin, a 10-fold increase in the dose rate (0.4 �104 to 4.0 � 104 Gy�s) gives a 10% reduction in D1/2 (5.1 � 107
to 4.6 � 107 Gy, respectively). For holoferritin, two crystals weremeasured at dose rates �1.6 � 104 Gy�s and two �5 � 104 Gy�s,giving means for D1/2 of 4.2 � 107 and 3.7 � 107 Gy, respectively,showing a 10% reduction in D1/2 for a 3-fold increase in dose rate.
The R values for all resolution ranges [Rmeas(all)], for thehighest-resolution shell [Rmeas(hr)], and the Wilson B values allincreased with dose as expected (Tables 2–4). The rise inRmeas(all) is initially slow for doses up to �3 � 107 Gy but thenrises steeply in the high-dose region (�3 � 107Gy). Rmeas(hr)rises faster than Rmeas(all) because of the faster rate of decay ofhigher-resolution reflections. The Wilson B values also increase,as the intensities of the higher-resolution data fall, and theintensity distribution as a function of resolution is thus modified.The mosaicity did not show consistent behavior between crys-tals, with some values decreasing and others increasing slowlywith dose.
The unit cell volumes of all of the holoferritin and apoferritincrystals increased linearly with dose in the low-dose region(�3.0 � 107 Gy), albeit at different rates even between crystalsof the same type, in agreement with previous observations (18,19). In the high-dose region, changes in the unit cell volume (�V)become nonlinear and unpredictable, as reported in ref. 20.Because of the variability between crystals, and the nonlinearbehavior of �V in the high-dose region, this parameter was notused in establishing a dose limit.
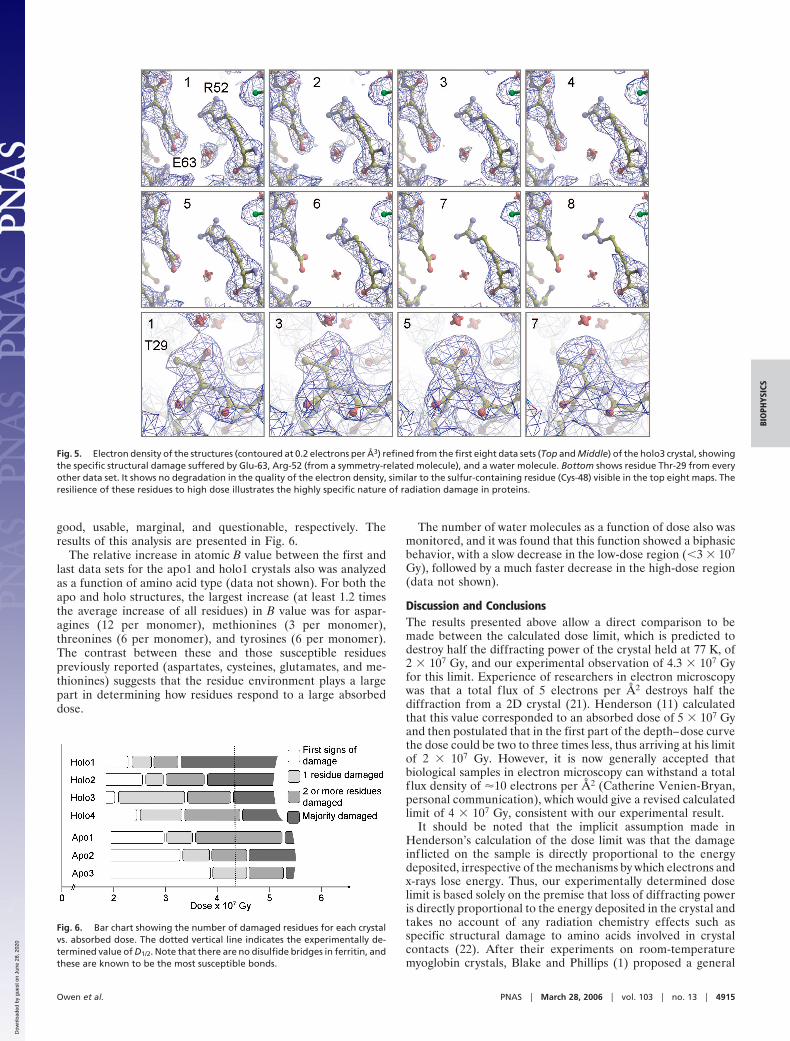
Refined models were assessed both in terms of the changes inelectron density and also by the Debye–Waller parameters (Bvalues), which quantify the static and dynamic disorder in acrystal. Inspection of the 2Fo � Fc electron-density maps allowedthe structure from each data set to be grouped according to thedegree of damage. The most susceptible residues�sites are asfollows: disulfide bridges (not present in ferritin), aspartates,glutamates, tyrosines, and methionines (5–7). Fig. 5 shows thegradual loss of density around a glutamate and arginine from aneighboring monomer and also illustrates a ‘‘control’’ residue: athreonine that retains its definition as a function of dose. Thisexample highlights the effect of local environment, becausearginines are not generally considered susceptible residues, buthere the damage appears to be affected by the proximity of theamorphous iron and the glutamate. The electron density ob-tained from the individual data sets was classified as follows: firstsigns of damage (no ‘‘lost’’ side-chain atoms, but general reduc-tion in atom definition), one residue damaged, two or threeresidues damaged, and lastly, the majority of susceptible residuesdamaged. These categories were used to identify data sets as
Fig. 3. Graph showing the total diffracting power of four different holo-ferritin crystals as a function of absorbed dose. The sum of the intensities of allreflections, j, ¥Ij have been normalized to the intensity of the first data set [I0]for each crystal, giving ¥Tot � ID�I0 .The results show clear agreement betweenthe dose required to reduce the diffracting intensity by half (D1/2) for each ofthe crystals.
Fig. 4. Graph showing the total normalized diffracting power, I�Tot, of threedifferent apoferritin crystals as a function of absorbed dose. The results showboth agreement between the dose required to reduce the diffracting intensityby half (D1/2) for the different crystals and also for the values of D1/2 obtainedfor holoferritin.
4914 � www.pnas.org�cgi�doi�10.1073�pnas.0600973103 Owen et al.
Dow
nloa
ded
by g
uest
on
June
28,
202
0
good, usable, marginal, and questionable, respectively. Theresults of this analysis are presented in Fig. 6.
The relative increase in atomic B value between the first andlast data sets for the apo1 and holo1 crystals also was analyzedas a function of amino acid type (data not shown). For both theapo and holo structures, the largest increase (at least 1.2 timesthe average increase of all residues) in B value was for aspar-agines (12 per monomer), methionines (3 per monomer),threonines (6 per monomer), and tyrosines (6 per monomer).The contrast between these and those susceptible residuespreviously reported (aspartates, cysteines, glutamates, and me-thionines) suggests that the residue environment plays a largepart in determining how residues respond to a large absorbeddose.
The number of water molecules as a function of dose also wasmonitored, and it was found that this function showed a biphasicbehavior, with a slow decrease in the low-dose region (�3 � 107
Gy), followed by a much faster decrease in the high-dose region(data not shown).
Discussion and ConclusionsThe results presented above allow a direct comparison to bemade between the calculated dose limit, which is predicted todestroy half the diffracting power of the crystal held at 77 K, of2 � 107 Gy, and our experimental observation of 4.3 � 107 Gyfor this limit. Experience of researchers in electron microscopywas that a total f lux of 5 electrons per Å2 destroys half thediffraction from a 2D crystal (21). Henderson (11) calculatedthat this value corresponded to an absorbed dose of 5 � 107 Gyand then postulated that in the first part of the depth–dose curvethe dose could be two to three times less, thus arriving at his limitof 2 � 107 Gy. However, it is now generally accepted thatbiological samples in electron microscopy can withstand a totalf lux density of �10 electrons per Å2 (Catherine Venien-Bryan,personal communication), which would give a revised calculatedlimit of 4 � 107 Gy, consistent with our experimental result.
It should be noted that the implicit assumption made inHenderson’s calculation of the dose limit was that the damageinflicted on the sample is directly proportional to the energydeposited, irrespective of the mechanisms by which electrons andx-rays lose energy. Thus, our experimentally determined doselimit is based solely on the premise that loss of diffracting poweris directly proportional to the energy deposited in the crystal andtakes no account of any radiation chemistry effects such asspecific structural damage to amino acids involved in crystalcontacts (22). After their experiments on room-temperaturemyoglobin crystals, Blake and Phillips (1) proposed a general
Fig. 5. Electron density of the structures (contoured at 0.2 electrons per Å3) refined from the first eight data sets (Top and Middle) of the holo3 crystal, showingthe specific structural damage suffered by Glu-63, Arg-52 (from a symmetry-related molecule), and a water molecule. Bottom shows residue Thr-29 from everyother data set. It shows no degradation in the quality of the electron density, similar to the sulfur-containing residue (Cys-48) visible in the top eight maps. Theresilience of these residues to high dose illustrates the highly specific nature of radiation damage in proteins.
Fig. 6. Bar chart showing the number of damaged residues for each crystalvs. absorbed dose. The dotted vertical line indicates the experimentally de-termined value of D1/2. Note that there are no disulfide bridges in ferritin, andthese are known to be the most susceptible bonds.
Owen et al. PNAS � March 28, 2006 � vol. 103 � no. 13 � 4915
BIO
PHYS
ICS
Dow
nloa
ded
by g
uest
on
June
28,
202
0

decay model, later generalized by Hendrickson (23), whereby theunchanged fraction of the crystal (A1) decreased linearly withdose, and the severely disordered part (A2) changed exponen-tially as a function of resolution. This model results in anintensity decrease obeying the relationship
It�I0 � A1t � A2t exp(�B2�sin2���2),
where B2 is a measure of the disorder, � is the x-ray wavelength,and � is the Bragg angle. For crystals held at cryotemperatures,a linear model of damage rate with dose (i.e., the linear decay oftotal diffracted intensity) also has been found to be appropriate(e.g., refs. 20 and 24), and this postulate is confirmed in our caseby the high-correlation coefficients of linear fits to the intensity–dose plots presented in Figs. 3 and 4.
However, an experimental dose limit should not be calculatedsolely in terms of an overall reduction in diffracting power.Although loss of intensity provides an easily measured metric, ofmore importance is the point at which the quality of the databecomes unacceptable because biological information is lost.Accordingly, diffraction data also have been assessed in terms ofchanges in the high-resolution diffraction limit, Rmeas, Wilson Bvalues, and the number of damaged residues (Fig. 6).
The time at which data collection should be stopped, or thedecision on when the data quality becomes unacceptable, is asubjective process that is largely governed by consideration of thepurpose for which the data are being collected. This subjectiveapproach becomes problematic when trying to set a globalexperimental dose limit. Limits must be set on changes in theparameters to determine a specific point when the data becomes‘‘usable,’’ ‘‘marginal,’’ or ‘‘questionable.’’ One of the most wide-spread statistical indicators of diffraction quality is the R value;Rmeas offers a quantity that assesses the data quality indepen-dently of data redundancy. Here, overall Rmeas values of �10%,10–15%, 15–20%, and �20% were deemed to indicate good,usable, marginal, and questionable data, respectively. Theselimits should be lowered if, for example, obtaining phases fromsulfur single-wavelength anomalous dispersion data are the aimof the experiment.
If different resolution shells are chosen, D1/2 changes: forinstance, for holo1, the resolution shell of 2.6–2.5 Å gives D1/2 of2.1 � 107 Gy compared with 3.6 � 107 Gy over all resolution bins.Conversely, for the 20.0–10.0 Å shell, D1/2 is 20.0 � 107 Gy (datanot shown). Thus, if collection of high-resolution data is theexperimental objective, the tolerable dose will be significantlyreduced. This finding concurs with the Blake and Phillips modeloutlined above, which predicts that the rate of intensity decay isresolution dependent (term in A2) and has been confirmedpreviously at cryotemperatures in a study of the intensity decayof a hen egg white lysozyme crystal (20).
In addition to the data-reduction statistics discussed above,inspection of the electron density provides the final test ofwhether the quality of the data obtained is acceptable for thepurposes of the experiment. From analysis of the electrondensity in terms of the number of damaged residues, and fromthe other data quality indicators, we conclude that by the timeD1/2 has been reached, the integrity of the biological informationwill be compromised. The implication of this observation is thata lower dose limit could usefully be defined, and from the resultspresented above, we suggest that an upper limit of 3 � 107 Gyis an appropriate value. Figs. 3 and 4 can be used to convert thisdose to an easily monitored on-line metric, i.e., a reduction indiffracting power to an intensity of Iln2 � I0 � ln2, giving Iln2 �0.7 � I0. It should be noted that this is an upper dose limit andthat some crystals may decay much faster because of the varyingsusceptibility of crystal contacts (22) and protein-specific fea-tures that have been shown to affect how a protein crystal
behaves under cryoconditions, such as solvent content anddistribution (25).
For apoferritin and holoferritin, Dln2 corresponds to theabsorption of 107 photons per unit cell (i.e., 27 photons per24-mer sphere). The rate at which these photons are absorbedhas a measurable effect on the rate of damage, with higher ratesgiving slightly reduced lifetimes. This observation has implica-tions for optimization of data collection practice at third-generation synchrotron beamlines. It is possible that this dose�dose-rate effect, which has been reported (26), is because of thehigher density of tracks, which both lowers the probability ofelectron-hole recombination and increases the likelihood ofmultiple oxidations or reductions (Bill Bernhard, personalcommunication).
In conclusion, an experimental dose limit has been measuredfor seven crystals of two different species with very differentelemental composition: one a typical protein and the otherhaving a particularly high metal content. Our dose calculationshave allowed us to compare these crystal types directly and topropose an experimental limit based on both the data collectionstatistics and the quality of the electron density maps. The meandose required to reduce the diffracting power by half was 4.3 �107 (�0.3) Gy, but an experimental upper dose limit of Dln2 �3.0 � 107 Gy is proposed, corresponding to the dose that givesIln2. Above this dose, the biological information extracted fromthe macromolecular structure is likely to be compromised, andfurther data collection would be unproductive.
MethodsMaterials. Ferritin is an iron storage protein of monomeric mass19.8 kDa (174 aa), occurring in a spherical 24-mer conformation.This spherical shell, of internal diameter 78 Å, contains avariable number of iron(III) atoms, from 0 in the case ofapoferritin to 4,500 (holoferritin) (27). Equine spleen apoferritinand holoferritin were purchased from Sigma and diluted to 20mg�ml with 0.1 M NaCl. Cubic crystals of both apoferritin andholoferritin, of size �200 �m and space group F432 (a � b � c �181 Å), were grown from identical conditions by using a wellsolution of 0.6 M (NH4)2SO4 and 10 mM CdSO4. Crystals werecryoprotected by replacing 40% of the water in the well solutionwith glycerol and soaking for up to 30 min.
Data Collection and Processing. Crystals were loop-mounted andflash-cooled in a 100 K dry nitrogen stream. Sequential com-plete data sets [up to 12 at doses of between 1 and 4 MGy (holo3)per data set] were collected from each crystal on beamlineID14-EH4 at the European Synchrotron Radiation Facility(Grenoble, France) at beam energies of 13.2 keV (1 eV �1.602 � 10�19 J) (0.939 Å) and 12.7 keV (0.976 Å). Typically,each data set consisted of 30° of data taken starting at anoscillation angle determined by the STRATEGY option of MOSFLM(28); these parameters were kept constant for each sequentialdata set. Between each data set, crystals were exposed tocontrolled periods of unattenuated beam (inflicting doses ofbetween 2 and 10 MGy). Normally, in macromolecular crystal-lography, crystals would be discarded well before the diffractionintensity is reduced by a factor of 2. However, as the calculateddose limit has been defined in terms of a halving of thediffracting power, in our experiments crystals were exposed tothe beam until this criterion had been well exceeded. Data wereprocessed by using MOSFLM and SCALA (29). After x-ray datacollection, the crystals were allowed to warm up to roomtemperature and then mounted onto 2-�m-thick mylar mi-croPIXE sample holders directly from the cryoloop.
Flux Calibration. The integrated intensities recorded by the inter-nal beamline diode in the header of each image were convertedinto the number of incident photons as follows. A Keithley
4916 � www.pnas.org�cgi�doi�10.1073�pnas.0600973103 Owen et al.
Dow
nloa
ded
by g
uest
on
June
28,
202
0

picoammeter was used to record the induced current in acalibrated silicon PIN photodiode (S3204-09; Hamamatsu Pho-tonics, Hamamatsu City, Japan) positioned at the crystal posi-tion with a range of beam attenuators in place. These currentsthen were converted into photon fluxes by considering theenergy deposited within the silicon diode and thus could bedirectly related to the corresponding internal beamline diodereadings. This calibration was carried out for each experimentalrun, so that any drifts could be monitored. To account forvariations in the beam current during the course of the exper-iment, measured total intensities for each data set were normal-ized by using the ratio of the total f lux for the first data set tothe flux for that data set.
MicroPIXE. Knowledge of the atomic composition of a proteincrystal is essential if the absorbed dose is to be accuratelycalculated. The microPIXE technique allows stoichiometricratios of atoms (with Z � 10) in protein samples to be measuredby means of the detection of characteristic x-ray emission spectra(15). This emission is induced by using a highly focused (1-�mdiameter) 2.5 MeV proton beam which can be scanned in x andy across the dried sample held in vacuum. Initially, a coarse scan(500 � 500 �m) was collected to determine the position of theprotein sample, and then several point spectra were recordedacross the sample. Detection of Rutherford backscattered pro-tons allows the sample thickness and matrix composition to beaccurately determined. Concentrations of all of the elements ofinterest in the protein sample were then extracted from the x-rayspectrum by using the sulfur concentration, known from thenumber of methionines and cysteines per monomer, as aninternal calibration.
Because sulfur and cadmium were present in the crystalliza-tion conditions, the sulfur and cadmium content of both thecommercially purchased protein solutions and the crystals usedfor data collection, in addition to the iron content, was quantifiedfor both apoferritin and holoferritin.
Dose Calculations. The dose absorbed by a crystal in an x-ray beamis a function of the beam characteristics (energy, profile, f lux,size) and of the crystal properties (composition, size, irradiatedvolume). The program RADDOSE (30) (program available fromE.F.G. upon request) uses all these parameters to calculate theabsorption coefficient of the sample, defining the average com-position of an amino acid as 5C � 1.35N � 1.5O � 8H. It thusobtains a value for the absorbed dose by summing the energy lostby the x-ray beam by means of photoelectric and Comptoninteractions in the sample. The absorption coefficients of apo-ferritin and holoferritin crystals at 13.2-keV incident x-rayenergy were calculated to be 0.67 and 1.43 mm�1, respectively.
Structure Refinement and Analysis. Structure refinement, startingwith Protein Data Bank ID code 1IER (2.26-Å resolution; Rvalue � 0.187) (31) was carried out against each data set by usingrigid-body minimization, followed by restrained refinement inREFMAC (32). Models were refined to the resolution limit of thefirst data set (see Tables 2–4) typically to R values � 0.20 andRfree values � 0.25, and with satisfactory rms deviations fromideal bond lengths and bond angles (data not shown). Thesevalues necessarily deteriorated as the absorbed dose increased,and concomitantly the data quality decreased.
2Fo � Fc electron density maps were viewed and overlaid inCOOT (33). Changes in the electron density, specific structuraldamage to particular residues, and increasing B values inducedby irradiation could then be observed and analyzed as a functionof absorbed dose.
We thank Bill Bernhard, Norman Charnley, Geoff Grime, and AndrewLeslie for useful discussions; Martin Noble and Raimond Ravelli forvaluable comments on the manuscript; Sean McSweeney,Raimond Ravelli, Robert Southworth-Davies, and Martin Weik for helpwith data collection; the Surrey Ion Beam Centre for microPIXEfacilities; and the European Synchrotron Radiation Facility for beamtime. R.L.O. is supported by a Biotechnology and Biological SciencesResearch Council studentship. E.R.-P. was supported by the Programade Apoyos para la Superacion del Personal Academico, UniversidadNacional Autonoma de Mexico.
1. Blake, C. & Phillips, D. C. (1962) in Proceedings of the Symposium on theBiological Effects of Ionizing Radiation at the Molecular Level (InternationalAtomic Energy Agency, Vienna), pp. 183–191.
2. Haas, D. & Rossmann, M. G. (1970) Acta Crystallogr. B 26, 998–1004.3. Garman, E. F. & Schneider, T. R. (1997) J. Appl. Cryst. 27, 211–237.4. Rodgers, D. W. (1997) Methods Enzymol. 276, 183–202.5. Burmeister, W. P. (2000) Acta Crystallogr. D 56, 328–341.6. Ravelli, R. B. & McSweeney, S. M. (2000) Struct. Folding Des. 8, 315–328.7. Weik, M., Ravelli, R. B., Kryger, G., McSweeney, S., Raves, M. L., Harel, M.,
Gros, P., Silman, I., Kroon, J. & Sussman, J. L. (2000) Proc. Natl. Acad. Sci.USA 97, 623–628.
8. Carugo, O. & Carugo, K. D. (2005) Trends Biochem. Sci. 30, 213–219.9. Ravelli, R. B., Leiros, H. K., Pan, B., Caffrey, M. & McSweeney, S. (2003)
Struct. Folding Des. 11, 217–224.10. Garman, E. & Owen, R. L. (2006) Acta Crystallogr. D 62, 32–47.11. Henderson, R. (1990) Proc. R. Soc. London Ser. B 241, 6–8.12. Diederichs, K. & Karplus, P. A. (1997) Nat. Struct. Biol. 4, 269–275.13. Artz, S., Beteva, A., Cipriani, F., Delageniere, S., Felisaz, F., Forstner, G.,
Gordon, E., Launer, L., Lavault, B., Leonard, G., et al. (2005) Prog. Biophys.Mol. Biol. 89, 124–152.
14. Chasteen, N. D. & Harrison, P. M. (1999) J. Struct. Biol. 126, 182–194.15. Garman, E. F. & Grime, G. W. (2005) Prog. Biophys. Mol. Biol. 89, 173–205.16. Kuzay, T. M., Kazmierczak, M. & Hsieh, B. J. (2001) Acta Crystallogr. D 57,
69–81.17. Gonzalez, A. & Nave, C. (1994) Acta Crystallogr. D 50, 874–877.18. Ravelli, R. B., Theveneau, P., McSweeney, S. & Caffrey, M. (2002) J.
Synchrotron Radiat. 9, 355–360.
19. Murray, J. & Garman, E. (2002) J. Synchrotron Radiat. 9, 347–354.20. Teng, T.-Y. & Moffat, K. (2000) J. Synchrotron Radiat. 7, 313–317.21. Chiu, W., Downing, K. H., Dubochet, J., Glaeser, R., Heide, R. M., Knapek,
E., Kopf, D. A., Lamvik, M. K., Lepault, J., Robertson, J. D., et al. (1986) J.Microsc. 141, 385–391.
22. Murray, J. W., Rudino-Pinera, E., Owen, R. L., Grininger, M., Ravelli, R. B.& Garman, E. F. (2005) J. Synchrotron Radiat. 12, 268–275.
23. Hendrickson, W. A. (1976) J. Mol. Biol. 106, 889–893.24. Diederichs, K., McSweeney, S. & Ravelli, R. B. (2003) Acta Crystallogr. D 59,
903–909.25. Weik, M., Kryger, G., Schreurs, A. M. M., Bouma, B., Silman, I., Sussman, J. L.,
Gros, P. & Kroon, J. (2001) Acta Crystallogr. D 57, 566–573.26. Leiros, H.-K. S., McSweeney, S. & Smalas, A. O. (2001) Acta Crystallogr. D 57,
488–497.27. Ford, G. C., Harrison, P. M., Rice, D. W., Smith, J. M. A., Treffry, A., White,
J. L. & J. Yariv, J. (1984) Philos. Trans. R. Soc. London Ser. B 304, 551–565.28. Leslie, A. G. W. (1999) Acta Crystallogr. D 55, 1696–1702.29. Evans, P. (1993) in CCP4 Study Weekend, eds. Sawyer, L., Isaacs, N. & Bailey,
S. (CCP4, Daresbury, U.K.), Vol. DL�SCI�R34, pp. 114–122.30. Murray, J. W., Garman, E. F. & Ravelli, R. B. G. (2004) J. Appl. Cryst. 37,
513–522.31. Granier, T., Gallois, B., Dautant, A., Langlois D’Estaintot, B. & Precigoux, G.
(1997) Acta Crystallogr. D 53, 580–587.32. Vagin, A. A., Steiner, R. A., Lebedev, A. A., Potterton, L., McNicholas, P.,
Long, F. & Murshudov, G. N. (2004) Acta Crystallogr. D 60, 2184–2195.33. Emsley, P. & Cowtan, K. (2004) Acta Crystallogr. D 60, 2126–2132.
Owen et al. PNAS � March 28, 2006 � vol. 103 � no. 13 � 4917
BIO
PHYS
ICS
Dow
nloa
ded
by g
uest
on
June
28,
202
0