Embed Size (px)
Citation preview

EXPERIMENTAL DETERMINATION OF TTT DIAGRAM FOR ALLOY 718PLUS®
Dheepa Srinivasan1, Leah Underwood Lawless2, Eric A. Ott2 1GE Energy, GE India Technology Center, EPIP Phase-2, Whitefield Road, Bangalore – 560066, India
2GE Aviation, One Neumann Way, Cincinnati OH 45215-1988, USA
Keywords: Allvac® 718Plus®, TTT curve, CCT curve, ’ precipitates, phase
Abstract
The phase evolution of Allvac® alloy 718Plus® has been
determined experimentally via construction of time-temperature-
transformation (TTT) and continuous-cooling-transformation
(CCT) curves based on identifying the various phases, their sizes
and volume fractions along with distributions as they evolved
during thermal treatment. The solution temperature range of inter-
and intra-granular phases and of have been characterized via
detailed microstructural investigations. The phase solvus of
alloy 718Plus determined by dissolution during isothermal hold
for 0.1 hours ranges between 1010-1071C, with clear distinctions
between solutioning of grain boundary and complete
solutioning. The temperature where the intergranular or grain
boundary particles dissolve after 0.1 hours in the investigated
material is 1015C. At this temperature, grain growth occurs
owing to a lack of pinning by grain boundary phase particles.
However, it is only at 1065C, that a complete dissolution of all
particles has been observed. The nose of the TTT curve for
occurs at about 843C for start (25 % transformation) and end of
transformation (100% transformation). The temperature ranges at
which precipitation hardening (704-788C), coarsening (843C)
and over aging (898C) take place in the alloy have been located
by correlating the TTT and the time-temperature-hardness (TTH)
curves. This investigation provides a solid basis for practical
processing of the alloy, to be used as a candidate material for
700C applications.
Allvac and 718Plus are registered trademarks of ATI Properties,
Inc.
Introduction
Alloy 718Plus is based on the well-known and extensively used
alloy 718 where half of the Fe is replaced by Co, 1% W is added,
the Al and Ti levels are increased. The chemistry of 718Plus®
was developed by ATI Allvac® [1]. Various efforts [2-6], have
contributed to developing these chemistry modifications as well as
process enhancements to achieve a temperature enhancement of
about 55C, while retaining the beneficial workability and
weldability attributes of alloy 718. The advantage of improved
temperature capability over alloy 718 and relative ease of
processing and welding is expected to offer a reduced cost
material option compared to some other Ni base superalloys, such
as Waspaloy, Rene’41, and alloy 720, that function up to a
working temperature of about 700C.
Alloy 718, is a Ni-Cr-Fe based alloy with Nb (4.75 –5.5 wt%) as
the major hardening element. The main strengthening phase in
this alloy is a metastable Ni3(Nb,Ti,Al)-phase, gamma double
prime () [7-8]. The equilibrium counterpart in these Nb rich
alloys is an orthorhombic Ni3Nb phase, delta ( phase [7-8].
Delta pins grain boundaries which in turn contributes to Hall-
Petch strengthening of the material. In a typical phase sequence in
alloy 718, the coherent strengthening precipitates transform to
incoherent phase and ’ phase because ” becomes
thermodynamically unstable at high temperatures. Most other Ni-
based superalloys are (-Ni3Al) strengthened without or ”
and have a higher temperature capability than 718. Alloys with
strengthening, typically have rapid precipitate nucleation and
slow growth and coarsening kinetics which promotes high
temperature stability at the expense of processing ease. The
718Plus alloy differs from both 718 and other Ni-based alloys in
that it combines the strengthening effects of and precipitates.
Both alloys consist of a typical face centered cubic phase matrix
and orthorhombic phase.
A number of studies have been carried out to establish heat
treatment approaches, measure alloy capabilities, and characterize
typical structure and properties [2-6]; however, only limited
assessment of the phase evolution during heat treatment has been
performed and reported. In available published reports, TTT
diagrams have been generated using thermodynamic calculations
with limited experimental validation. Therefore, this study was
focused on obtaining a detailed experimental understanding of
alloy 718Plus transformation behavior.
Experimental Procedure
Materials and Heat Treatments
The composition of the alloy 718Plus material used in this study
is compared to that of a typical 718 alloy in Table I. The alloy was
supplied by ATI Allvac® as a 254 mm diameter billet and was
subsequently ring rolled and fully heat treated. The heat treatment
performed was a solution treatment at 982C for 2 hours, followed
by oil quenching, and subsequent aging at 787C for 8 h with a
furnace cool to 704C, followed by 8 h hold at 704C, before
finally being air cooled.
Table I. Measured composition (wt%) of 718Plus compared to
nominal 718 [6]
Alloy* Cr Mo W Co Fe Nb Ti Al
718Plus 17.87 2.68 1.12 9.2 9.59 5.55 0.83 1.39
718 18.1 2.9 - - 18 5.4 1 0.45
* Balance Ni
Generally, the following material conditions were used for
assessments in this study:
Fully heat treated (solutioned and two step aged)
material for baseline microstructure analysis.
Re-solutioned samples given several different controlled
cooling rates to assess the effect of cooling rate from the
solution temperature on gamma prime evolution.
Fully heat treated material re-solutioned in a gradient
furnace over a 8711093C temperature range for
various solutioning times to understand gamma prime
759

and delta solvus temperatures. Delta solvus
determination was made from the standpoint of phase
dissolution.
Resolutioned material aged in a gradient furnace over a
704-899C temperature range for various times to
define the aging TTT and TTH behavior.
Bulk Material Characterization
Phase imaging and evaluation was performed using a JEOL®
2011 FASTEM TEM, operated at 200 KV. Electron transparent
samples were electrolytically thinned from ground 100 m thick
discs that were 3 mm in diameter. The polishing solution for TEM
samples comprised methanol and perchloric acid, in the ratio
80:20, and polishing was performed at -45 to -35C, 4-5 V and 25
milli-amps current. Owing to the structural similarities between
the matrix (fcc-), and the precipitates, for sizes as well as
fractions, TEM images have been obtained using dark field using
superlattice reflections to discern precipitate size and
morphologies. Assessment of volume fractions were made with
the assumption of a spherical precipitate morphology,
measurements of projected area from TEM micrographs and
experiments to determine TEM foil thickness in the regions
analyzed. This calculation is believed to be accurate given the
morphology observed. In general, each average reported size
includes 50-60particle measurements.
Preliminary phase identification was carried out using XRD
(Philips, CuK). Grain size as well as delta phase precipitation
was monitored using a JSM 640 FESEM on etched samples.
Walkers reagent was used to swab etch the metallographically
prepared samples to reveal the grain boundaries and the
precipitates. In general 30-40 grains and 30-40 delta particles
were measured for determination of average sizes. At all the time-
temperature combinations, hardness measurements were carried
out using a Vickers microhardness tester, at a load of 100g, on
polished surfaces of the aged specimens. An average of 10
hardness readings were calculated for each condition. Hardness
measurements were performed at various other locations, and
hence temperatures along the gradient bar to map temperatures at
which peak hardening occurred. In parallel, independent phase
identification was performed by extraction of individual phases
per the methods outlined in the next section.
Phase Extraction Analysis
The phase extraction in this study involved electrochemical
separation of carbides, delta particles and the phase from the
matrix, either individually or as a combination of phases. Bulk
material samples with a baseline fully heat treated structure were
used. Two solutions were prepared in order to preferentially
reveal different phases. Solutions were either 4% H3PO4 or 4%
HCl in water. An electrolytic cell was used with each of the
solutions to dissolve the matrix phase of the alloy at ~4V for 2-4
hours. The baseline sample was weighed before and after
electrolytic dissolution to determine the total weight of sample.
The fine solid residue was separated from the solution by multiple
centrifuge and decanting steps using deionized water and later
methanol. After each centrifuge run, the clear liquid was decanted
from the sample and additional deionized water or methanol were
added. After removal of all of the electrolyte solution from
samples, and performing a final decanting step using methanol, all
remaining extract sample material was poured into several pre-
weighed watch glass plates and dried to evaporate the remaining
methanol. Dried materials weights were used to determine weight
fraction of extract compared to the total weight of the sample
which had been dissolved and materials were analyzed by SEM
and XRD characterize phase morphology, chemistry and crystal
structure.
Results
Fully heat treated microstructure
(a)
(b)
(c)
Figure 1. SEM and TEM micrographs of fully heat treated
718Plus (982C for 2 h, oil quenching, aging at 787C for 8 h,
furnace cool to 704C, 8 h hold at 704C, air cooled alloy
showing (a) overall grain structure, (b) typical phase
morphology, and (c) fine scale structure.
[001]
500nm
100nm
10m
760

Figure 2. Typical phase in alloy 718 for comparison.
The fully heat treated (solutioned and two step aged)
microstructure of the 718Plus alloy was characterized by SEM
and TEM to establish typical phases and morphologies in the
structure. The SEM micrograph in Fig. 1(a) shows the overall
grain size and delta phase precipitation in the heat treated alloy.
The average grain size of the 718Plus material studied was
between 30-40 m, corresponding to ASTM 5-7. The
precipitates shown in Figure 1(b) in the 718Plus alloy are needle-
like, between 3-4 m in length, with a large fraction present along
the grain boundaries. In addition to , the (Ni-) matrix contains
homogeneously nucleated precipitates of in 718Plus as shown
in Fig. 1(c). A comparison between fine scale precipitates in
718Plus to that of the typical precipitates in alloy 718 can be
seen comparing Figure 1(c) with Figure 2. Insets in Fig. 1c and 2
are selected area diffraction patterns (SADP’s) with the beam
along [001] orientation, that differentiate one precipitate phase
from the other. While appears spherical, the precipitates
appear as discs with a distinct elliptical morphology, as shown in
the dark field images taken using a (100) type reflection and (1 ½
0) to distinguish between the two types of precipitates. The
phase with an L12 structure is characterized by appearance of
superlattice reflections of the type {100} and {110}. The phase
with a DO22 structure has additional superlattice reflections of the
type {1 ½ 0}, that give it a unique identity different from the
phase.
Phase identification
Extraction of second phases in the fully heat treated 718Plus alloy
was performed in order to more carefully examine their
morphology, chemistry and crystal structure in the baseline fully
heat treated microstructure. Extractions made using the HCl
solution were expected to consist of and carbide phases while
the extract from H3PO4 solution was expected to consist primarily
of . The bulk extracted material weight measurements compared
to the original sample weight suggested that the alloy consisted of
0.8% by weight of and carbides and about 20% by weight of .
(a)
(b)
(c)
Figure 3. SEM micrograph of extracted phases from baseline
718Plus fully heat treated sample at (a) low magnification, (b)
high magnification, and including a (c) EDX spectrum.
SEM examination of the extracted residues was performed.
Figure 3 shows a low magnification and higher magnification
view of the phase extracts from the HCl solution sample targeting
and carbide phases along with an SEM EDS chemistry of the
bulk extracted material. Figure 4 similarly shows SEM of the
H3PO4 solution extract residue which was targeted to contain only
, but based on the micrographs also appears to contain . The
is present as very fine particles consistent with the TEM
examination of the baseline bulk sample. Semiquantitative
chemistry results based on SEM energy dispersive spectroscopy
measurements (EDS) are also shown in Table 2.
X-ray diffraction (XRD) of samples including a bulk baseline
fully heat treated material, and the extract residue from the HCl
and H3PO4 solutions was used to assess the phases present in the
718Plus microstructure. Results are shown in Figure 5. The bulk
100 nm100 nm
[001]
2m
20m
100nm
761

alloy XRD pattern confirms that the alloy is predominantly and
phases. Extractions from the HCl solution confirm XRD peaks
consistent with and MC type carbides. This extraction sample
was mainly the orthorhombic NbNi3 phase. The lattice parameters
are calculated as 5.1165, 4.2206, 4.5327 (technique error estimate
of ~0.0005Å). The NbNi3 crystallites are somewhat anisotropic as
there is texturing seen in the [0,l,0] direction. The abnormal
intensity in the (0,2,0) reflection is shown in the pattern. There
also appears to be a small amount of NbC-FCC carbide, with
lattice parameter of ~4.441Å. Extractions from the H3PO4
solution confirm peaks consistent with a significant amount of
phase along with a mixture of and carbides similar to that
seen in the extracted sample. Other extractions and EDS
assessments of carbides also support the presence of NbC type
particles in that predominantly Nb is evident in the EDS.
(a)
(b)
Figure 4 SEM micrographs of extracted phases from baseline
718Plus fully heat treated sample showing (a) and some
residual , and (b) a high magnification view of the very fine .
Table 2. Semiquantitative EDS chemistry of baseline extracts.
Element and carbides (Atom %) (Atom %)
Al - 4.2
Ti 5.15 4.5
Cr 1.62 2
Fe 1.99 3.2
Co 0.70 2.4
Ni 71.85 69.3
Nb 18.69 10.2
(a)
(b)
(c)
Figure 5. XRD of (a) bulk 718Plus baseline sample, (b) extracted
residue from HCl solution, and (c) extracted residue from the
H3PO4 solution.
2m
0.2m
762

(a)
(b)
(c)
(d)
Figure 6. SEM micrographs after annealing 0.1h at several
temperatures to investigate dissolution at (a) 1066C, (b)
1052C, (c) 1016C, and (d) 1012C. Arrows denote phase.
Delta Phase Solution Temperature
The solution temperature range of inter- and intra-granular
phases and of were characterized via detailed microstructural
investigations. The phase solvus of alloy 718Plus was
determined after isothermal hold for 0.1 hours ranges between
954-1093C. Selected micrographs at critical temperatures are
shown in Figure 6. The temperature where the intergranular or
grain boundary particles dissolve in the investigated material is
about 1015C. At this temperature, grain growth occurs owing to
lack of pinning grain boundary phase particles. However, it is
only at 1065C, that a complete dissolution of all particles has
been observed.
(a)
(b)
Figure 7. TEM micrographs showing transition between (a)
presence of phase at 899C for 0.1 h and (b) absence of phase
due to dissolutioning at 954C for 0.1 h.
Gamma Prime Solution Temperature
The gamma prime solvus has been assessed by TEM. Analysis of
precipitates was performed between 704C and 982C.
Precipitates exist at temperatures at and below 899C but not at
temperatures at or above 954C as shown in Figure 7. The insert
in Fig. 7a shows a dark field image of fine precipitates in the
10m
10m
10m
10m
100nm 100nm
200nm
763

matrix after 0.1 h. The solvus lies in the 899C-954C range;
finer granularity of assessment was not performed in the current
effort. Vickers hardnesses as a function of annealing temperature
shown in Figure 8 also support solutioning of the precipitates in
this temperature range.
Figure 8. Variation of hardness with temperature for alloy
718Plus. Note – above 899C, the alloy was subject to 0.1, 0.5
and 2 h dwell times. Between 843-721C the alloy is aged for 0.1,
1 and 10 h.
(a) (b)
(c) (d)
Figure 9. Dark field TEM images revealing precipitation as a
function of increasing cooling rates of (a) 2.2, (b) 17, (c) 74, and
(d) 220 C/min.
Cooling Rate Effects on Phase Precipitation
Evaluation of the cooling rate effects on precipitation size and
volume fraction for the phase was also performed. The
precipitates display vast differences in both size and volume
fraction as a function of cooling rate, as illustrated in the dark
field TEM images Figure 9 a-d. Figure 10 shows plots of the
sizes and volume fractions at different cooling rates. It can be
seen from Figure 10 that while the size decreases with increases
in the cooling rate, the volume fraction of reaches a peak value
at 17C/min quench rate. Oil quenching from a 954C solution
temperature results in complete suppression of precipitation as
shown in the preceding section on solution temperature. Also,
interpolation of size in Figure 10 suggests that a size equal to
the baseline fully aged material can result from cooling rates of
approximately 30C/min. In this condition, however, slightly
more than half of the maximum 20 volume percent has
precipitated.
Figure 10. Average precipitate size and volume fraction of
718Plus as a function of cooling rate from the solution
temperature.
Figure 11. Percentage transformation versus time for different
transformation temperatures.
200nm 50nm
50nm 50nm
764

Figure 12. Gamma prime sizes and volume fractions at 721C, 788C, 843C and 899C, for times of 0.1, 1 and 10 h between 721C and
843C, and 0.1, 0.5 and 2 h at 899C. Legend denotes size in nm and volume fraction (%).
100nm 100nm 100nm
100nm
100nm 100nm 100nm
100nm 100nm 100nm
100nm 50nm
765
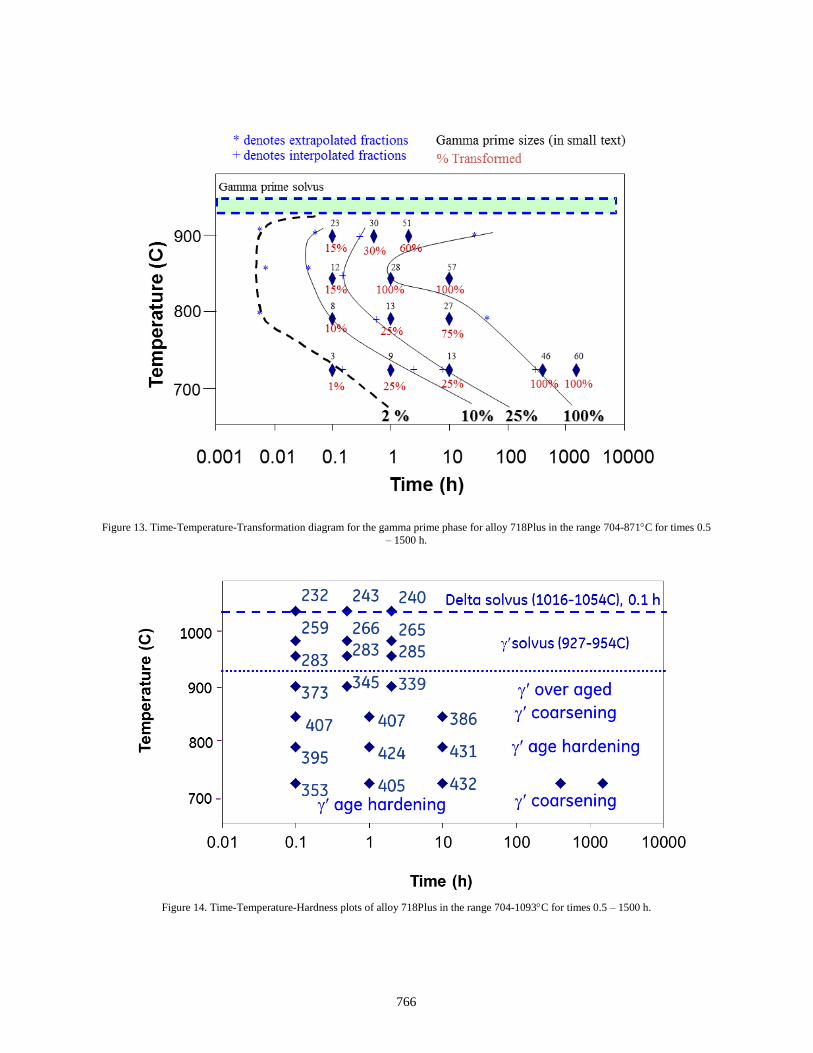
Figure 13. Time-Temperature-Transformation diagram for the gamma prime phase for alloy 718Plus in the range 704-871C for times 0.5
– 1500 h.
Figure 14. Time-Temperature-Hardness plots of alloy 718Plus in the range 704-1093C for times 0.5 – 1500 h.
766

Figure 15. CCT curves for compared to experimental cooling curves with % transformed labeled for each.
Size and volume fraction of versus time and temperature
The isothermal transformation (TTT) diagram was determined by
measuring the volume fractions of the as a function of time at a
particular temperature. Temperatures ranging between 704C,
and 898C with aging times of 0.1, 1 and 10 hours, followed by
oil quench were used to examine the evolution of the phase
using TEM. A plot of the volume fraction of phase as a function
of time for the range of temperatures evaluated is given in Figure
11. Figure 12(a-l) is a comprehensive representation of the
evolution of sizes and volume fractions over the range of
temperatures and times at which these particles were visible.
Discussion
Development of TTT Curves
Time-temperature-transformation (TTT) curves for
precipitation were developed using the data collected on size
and volume fraction. The progress of an isothermal phase
transformation can be easily represented by plotting the fraction
transformed (Vf) as a function of time and temperature. Figure 13
is a plot of the time temperature transformation, with
representative sizes (in small font) and volume fractions of the
transformed product, at each time-temperature location.
Subsequently, contours were constructed to develop the TTT
diagram. The nose of the TTT curve for , occurs at about 843C
for start (25 % transformation) and end of transformation (100%
transformation). The temperature ranges at which precipitation
hardening 704-788C, coarsening 843C and over aging 898C
take place in the alloy have been located, by comparing the TTT
and the TTH data. Results are shown in Figure 14.
Development of CCT Curves
The cooling rate curves were used in combination with the TTT
curves in order to estimate the CCT behavior. Comparison of
results of continuous cooling and isothermal transformation
suggest that transformation kinetics on cooling depart somewhat
from the isothermal TTT behavior. Due to the limited cooling
rate data, an initial CCT diagram was constructed by shifting TTT
C-curves to longer or shorter times to be consistent with the
cooling rate experimental results as shown in Figure 15. It has
been assumed that the temperature at which the nose of the C-
curves occurs is not affected by isothermal vs. continuous cooling.
Conclusions
1. Characterization of the fully solution and age heat treated Alloy
718Plus material confirmed the presence of , and MC-type
carbides using TEM of bulk samples and electrolytic extractions
followed by SEM and XRD analysis.
2. The main strengthening phase in alloy 718Plus has been found
to be , throughout the temperature-time ranges used in this
study. This is different from alloy 718 which is primarily
strengthened by the phase. Apart from , there is the phase
which precipitates both within the grains as well as along the
767

grain boundaries. It is the pinning action of these particles that
control the grain size in the alloy.
3. The solvus temperature has been determined to be in the
range of 954 – 899C. The inter granular solvus temperature
ranges between 1010-1015C for times at temperature of 0.1
hours for situations where delta phase is already present and being
dissolved with thermal treatment.
4. The nose of the TTT curve for precipitation lies at 843C and
an experimental TTT diagram was constructed for the phase for
718Plus.
5. Assessment of the cooling rate behavior of the phase was
characterized. Comparison of continuous cooling transformation
kinetics to that of isothermal transformation led to the
development of a CCT diagram estimate.
Acknowledgements
This research was performed under funding from GE Aviation.
The authors would like to acknowledge the technical efforts and
assistance of T. Vishwanath, and T. Shalini of Materials Research
Laboratory, GE India Technology Centre in Bangalore, Ed
Raymond and Rob Fecke of GE Aviation, Cincinnati, and
Michael Gigliotti and Will Heward of the GE Global Research
Center, Niskayuna, NY.
References
1. W.D. Cao, US patent NO. 6,730,254 B2, 2004.
2. W.D. Cao and R.L. Kennedy, Superalloy 2004, Eds. K.A.
Green, T.M. Pollock, H. Harada, T.E. Howson, R.C. Reed, J.J.
Schira and S. Walston., TMS, 2004, 91-99.
3. W.D. Cao, Superalloys 718, 625, 706 and derivatives 2005,
Eds. E.A. Loria, TMS, 2005, 165-178.
4. X. Xie, G. Wang, J. Dong, C. Xu, W.D. Cao and R. Kennedy,
Superalloys 718, 625, 706 and derivatives 2005, Eds. E.A. Loria,
TMS, 2005, 179-191.
5. X. Xie, C. Xu, G. Wang, J. Dong, W.D. Cao and R. Kennedy,
Superalloys 718, 625, 706 and derivatives 2005, Eds. E.A. Loria,
TMS, 2005, 193-202.
6. W.D. Cao and R.L. Kennedy, Acta Metallurgica Sinica, vol. 18,
No. 1, pp.39-46, Feb 2005.
7. D. F. Paulonis, J.M. Oblak, D.S. Duvall, Trans. ASM., vol. 62,
p.611, 1969.
8. M. Sundararaman, P. Mukhopadhyay, S. Banerjee, Met. Trans.
A, vol. 19, 1988, p.453.
768