Embed Size (px)
Citation preview

PNNL-19103
Experimental Evaluation of Electric Power Grid Visualization Tools in the EIOC
FL GreitzerPM Dauenhauer TG Wierks
December 2009
ii
DISCLAIMER
This report was prepared as an account of work sponsored by an agency of the United States Government. Neither the United States Government nor any agency thereof, nor Battelle Memorial Institute, nor any of their employees, makes any warranty, express or implied, or assumes any legal liability or responsibility for the accuracy, completeness, or usefulness of any information, apparatus, product, or process disclosed, or represents that its use would not infringe privately owned rights. Reference herein to any specific commercial product, process, or service by trade name, trademark, manufacturer, or otherwise does not necessarily constitute or imply its endorsement, recommendation, or favoring by the United States Government or any agency thereof, or Battelle Memorial Institute. The views and opinions of authors expressed herein do not necessarily state or reflect those of the United States Government or any agency thereof.
PACIFIC NORTHWEST NATIONAL LABORATORY operated by BATTELLE
for the UNITED STATES DEPARTMENT OF ENERGY
under Contract DE-AC05-76RL01830
Printed in the United States of America
Available to DOE and DOE contractors from the Office of Scientific and Technical Information,
P.O. Box 62, Oak Ridge, TN 37831-0062; ph: (865) 576-8401 fax: (865) 576-5728
email: [email protected]
Available to the public from the National Technical Information Service, U.S. Department of Commerce, 5285 Port Royal Rd., Springfield, VA 22161
ph: (800) 553-6847 fax: (703) 605-6900
email: [email protected] online ordering: http://www.ntis.gov/ordering.htm

PNNL-19103
Experimental Evaluation of Electric Power Grid Visualization Tools in the EIOC FL Greitzer* R Podmore** PM Dauenhauer** AC Dalton*TG Wierks** IncSys**Pacific Northwest National Laboratory* December 2009 Prepared for the U.S. Department of Energy under Contract DE-AC05-76RL01830 Pacific Northwest National Laboratory Richland, Washington 99352

iii
Acknowledgment
We gratefully acknowledge the support and input provided by Kevin Schneider and the Principal Investigators and their research teams involved in the development of the visualization methods and analytic tools examined in this study: Zhenyu (Henry) Huang, Yousu Chen, and Ning Zhou. We also acknowledge the assistance by Kristy Huston in coordinating the use of the PNNL EIOC. We also thank Art Moore of Grant County PUD and Ray Stolz of Portland General Electric for reviewing the operator screen videos and debriefing transcripts and completing the operator performance evaluations.

iv
THIS PAGE INTENTIONALLY LEFT BLANK
v
Contents Executive Summary .................................................................................................................................... vii
1. Introduction ........................................................................................................................................... 1
2. Theory ................................................................................................................................................... 4
3. Scenario Analysis .................................................................................................................................. 7
4. Method ................................................................................................................................................ 12
5. Results ................................................................................................................................................. 15
6. Conclusions and Recommendations ................................................................................................... 26
7. References ........................................................................................................................................... 31
Appendix A: Performance Evaluation Form ........................................................................................... A-1

vi
THIS PAGE INTENTIONALLY LEFT BLANK
vii
Executive Summary
Despite advances in technology, power system operators must assimilate overwhelming amounts of data to keep the electric utility grid operating. Analyses of recent blackouts have demonstrated the need to enhance the operator’s ability to understand the state of the system and anticipate possible problems. To confront this escalation of complexity, new paradigms, tools, and visualizations are needed to enhance and improve operations. The research community is hard at work developing new tools and visualizations to relieve the information processing burdens on decision makers, but the Department of Energy (DOE) and power grid utility stakeholders rightly demand that proposed solutions be evaluated to demonstrate their utility before deploying even more displays and visualizations that may have the unwanted potential of increasing the operator’s workload.
The Pacific Northwest National Laboratory (PNNL) has an ongoing research program aimed at developing advanced analyses and visualizations to enhance operator situation awareness and decision making in normal and emergency power grid operations. Acknowledging the need for validation studies, PNNL has initiatied a human factors test and evaluation program within its Electricity Infrastructure Operations Center (EIOC) to initially conduct appropriate validation studies using internally-developed visualization tools, and eventually to make this test bed available for test and evaluation of tools, visualizations, and training approaches developed by outside R&D teams and vendors on behalf of the DOE or electric power industry.
The present study follows an initial human factors evaluation of four visualization tools; the focus of the present study was on an empirical evaluation of two of the four tools: Graphical Contingency Analysis, and Phasor State Estimator. The evaluation was conducted within specific experimental studies designed to measure the impact on decision making performance.
The basis of the experimental approach is the Operator Decision Model (ODM), which the authors have adapted from current models of naturalistic decision making. The model describes decision making by articulating several cognitive processing stages, conceptualized using mediating variables such as mental models. The first stage is situation assessment, where mental models and cues from the environment are used to build an accurate story that describes the situation. The next stage is the determination of which action to take in order to positively affect the situation. Mental simulations, based on mental models, help predict the outcome of different actions and point towards an optimal decision. Finally, the new situation is assessed and a determination is made as to whether the situation is resolved or if the pattern needs repeating.
Two experiments were conducted, each with an experimental and a control group. In the first experiment, the experimental group was provided access to one of the visualization tools, the Graphic Contingency Analysis (GCA) tool, while in the other experiment the experimental group used the Phasor State Estimator (PSE) tool. In both cases, the control group made decisions without the aid of any visualization tools. The objective of the experiments was to compare performance of an experimental group and a control group to, determine if the visualization tools trigger appropriate mental models needed by system operators to understand the state of the system in real time, and promote effective and timely actions. The same seven subjects—all power system professionals—participated in each of the two experiments.
With regard to the experiment with the PSE, the statistical analysis results showed that, in terms of the correlations between performance variables and the variables identified in the ODM, the correlation coefficients were higher for the group that used the Phasor State Estimator tool than the control group.
viii
The same conclusion, however, cannot be drawn for the Graphical Contingency Analysis experiment. The correlation coefficients between ODM variables and performance variables were not significantly higher than those of the control group. This could be explained by the experimental group participants’ lack of training with this tool. Operators were not using a Graphical Contingency Analysis tool and therefore might not be familiar with how to use the tool and how to utilize the results produced from the tool. Therefore, it may be beneficial to repeat the study in the future and provide more training for the GCA tool, which may lead to more pronounced differences in performance between the GCA-user group and the control group. Comparison of performance of the control group with the experimental group did not show any significant differences in the overall performance between the two groups. This can be partly explained by the small number of participants in this study. Another possible explanation for non-significant results can be the lack of training in the tools. Operators that were exposed to the tools were not familiar with the tools to fully utilize their functionality to enhance their decision making under uncertainty.
Both experiments showed that the variables that are part of the ODM are strongly correlated to each other, which provides considerable positive evidence for the validity of the ODM. Specifically, if people correctly identify the system state, more cues will be discovered, a correct story of the system state can be made, and a more effective action script can be developed.
However, due to the small sample size and the non-probability sampling design used in the study, it should be noted that the findings produced here have limited generalizability. Therefore, caution should be taken when interpreting these results. We recommend replicating this study with a larger sample to provide further evidence for the experiment and have greater generalizability of the results.
A summary of recommendations is as follows:
• We have demonstrated a a performance evaluation method that complements current practice that conducts post-scenario interviews, by analyzing and monitoring the operator’s use of requisite mental models and associated mediating variables. It is recommended that future experiments both (a) provide more effective training/preparation for raters and (b) incorporate additional objective performance measures.
• Experiment results suggest that the Phasor State Estimator had a positive effect on situation recognition and cue discovery performance. Lack of strong statistical significance leads to the recommendation to repeat this experiment with a larger sample to confirm the positive correlations between the different variables in the Operator Decision Model as well as the suggested improvement in performance.
• For the Graphical Contingency Analysis Experiment, no significant effect of the GCA tool was obtained. We interpreted this in terms of a lack of training and incompatible mindset of operators who encounter contingency analysis problems in a training situation. A replication of this study is needed, with a proper focus on training, to enable a more robust test of the impact of the GCA tool on performance.
• The GCA tool has potential to alleviate operator workload by automating the action alternative analysis process to indicate which of many possible control actions should be most effective. To be most useful, this automated support must be fast—the best way to dramtically improve the speed of contingency analysis is to implement the program on a parallel processor system.
• Specific recommendations for improving the GCA tool include: o Make voltage problems and line overloads appear in different colors. o Display megawatts and powerflow direction.

ix
o The tool should not open up with all contingencies selected, but rather with only current conditions displayed.
o The tool should show different line colors for the different kV lines and it should show direction of flow on lines.
o Show rankings/priorities with the contingencies to help the operator see the most critical contingencies on which to focus.
• Specific recommendations for improving the PSE tool include: o Incorporate a more salient alarm indication with audio and visual alarms. o Show line loading and line phase angles on the display.
• There is a need for tight coupling of the contingency analysis program with the operator’s mental
model/mental simulation process that requires the program to operate in near real time (response times of seconds and not minutes). It is important to view the flows on major interfaces as well as the changes in the flows on major interfaces, and the possible effects of actions that have been taken, with sufficient time to take corrective actions before deleterious effects occur or time runs out (leading to financial sanctions).
• There is a need for operators to receive effective training on Contingency Analysis and use of a Contingency Analysis program within the regular training courses.
• The experiment should be replicated. Recommended improvements in the experimental methodology include:
o Replication of the experiment should use a larger sample size. o Replication of the experiment should utilize a more effective integration and utilization of
EIOC displays (e.g.,the Mapboard and multiple screens) to create a more realistic environment.
o Replication of the experiment should put more priority on appropriate training prior to experimental manipulations to help participants acquire a proper mindset in adopting more proactive strategies relevant to normal operating conditions.
o Replication of the study should include more training on the tools used during the studies. o Replication of the study should utilize scenarios with longer durations so the consequences of
decision can also be included in the scenario.
In conclusion, it is hoped that the demonstrated human factors and test/evaluation methodology, applied within the PNNL EIOC, will lead to the deployment of more effective tools and visualizations. The effective utilization of these tools may improve the performance of power grid operators, supervisory personnel, and regulatory policy makers through enhanced situation awareness and cognitive decision support, and create more reliable and secure electric power grid interconnection and operations.

x
THIS PAGE INTENTIONALLY LEFT BLANK
1
1. Introduction
This report presents the results of an experiment conducted by the Pacific Northwest National Laboratory (PNNL) and Incremental Systems Corporation (IncSys) at the PNNL Electricity Infrastructure Operations Center (EIOC). The objective of the experiment was to evaluate the ability of new visualization tools, developed by PNNL, to improve the performance of real power grid Operators engaged in realistic scenarios, as well as to conduct a human factors analyses based on the Operator Decision Model (Greitzer, Podmore, Robinson & Ey, 2009; Greitzer, Dauenhauer, Wierks, & Podmore, 2009).
The Operator Decision Model (ODM) (Greitzer et al., 2008a; 2009), more extensively described in Section 2, serves as a basis for the human factors analysis of the effectiveness of power grid operational decision making tools and visualizations. Based on the Recognition-Primed Decision Model (Klein, 1993), the ODM model provides a framework for understanding how Operators make decisions. According to Greitzer et al. (2008a), Operators make decisions by recognizing cues and then using these cues to build a story about the state of the system. The cues are used to validate Mental and Computer Simulations based on mental models that are stored in memory. These mental models may be based on similar situations and reflect the cause of the situation. After constructing a complete and consistent story, the Operator constructs an action script. Prior to implementing an action, the operator conducts a Mental Simulation of the impact of this Action Script again by using Mental Models that are drawn from memory. If the correct story and the correct Action Script are used, than the Operator’s actions will improve the state of the electrical system.
Two visualization tools developed at PNNL were tested: the Graphical Contingency Analysis (GCA) and Phasor State Estimator (PSE). These tools are intended to improve situation awareness (SA) of the Operator. As mentioned above, the goal of the study was to test if these visualization tools facilitate operator performance. The following research question is posed:
How do these visualization tools affect (a) the overall performance of System Operators; (b) their ability to recognize and use the correct cues and mental models; and (c) the ability of System Operators to create correct action scripts resulting in positive effects on the electrical grid?
Greitzer, Dauenhauer, Wierks, & Podmore (2009) examined the GCA and the PSE and offered the following assessment of the potential impacts of these tools and the best approaches for empirically testing such impacts.
1.1 Graphical Contingency Analysis System operators tend to have a very good understanding of the system state after a single contingency. However, when multiple outages occur, operators are far less prepared to handle the specific situation, especially if this particular set of outages has never occurred before. The GCA tool provides the Operator with a graphical view of all N-1 and Double Contingencies that could potentially cause a problem for the reliability of the electrical grid. In contrast, the traditional contingency analysis methodology requires the Operator to examine a list of all contingencies. By providing a graphical representation, the GCA tool is expected to positively impact SA, especially when the operator is in an unfamiliar situation that involves several outages simultaneously. The GCA tool should decrease the time required to select and locate contingencies that need to be addressed. Specifically, the GCA tool should help the operator more quickly recognize a contingency or emergency state and more quickly identify effective preventative measures.
2
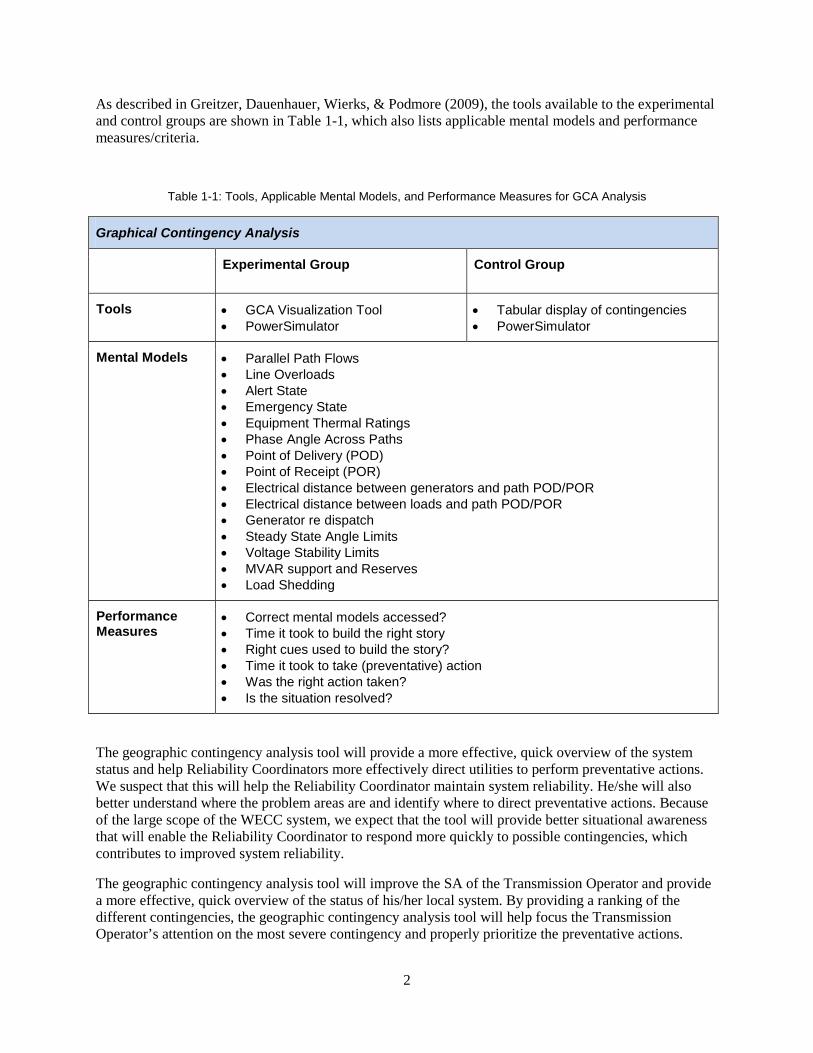
As described in Greitzer, Dauenhauer, Wierks, & Podmore (2009), the tools available to the experimental and control groups are shown in Table 1-1, which also lists applicable mental models and performance measures/criteria.
Table 1-1: Tools, Applicable Mental Models, and Performance Measures for GCA Analysis
Graphical Contingency Analysis
Experimental Group Control Group
Tools • GCA Visualization Tool • PowerSimulator
• Tabular display of contingencies • PowerSimulator
Mental Models • Parallel Path Flows • Line Overloads • Alert State • Emergency State • Equipment Thermal Ratings • Phase Angle Across Paths • Point of Delivery (POD) • Point of Receipt (POR) • Electrical distance between generators and path POD/POR • Electrical distance between loads and path POD/POR • Generator re dispatch • Steady State Angle Limits • Voltage Stability Limits • MVAR support and Reserves • Load Shedding
Performance Measures
• Correct mental models accessed? • Time it took to build the right story • Right cues used to build the story? • Time it took to take (preventative) action • Was the right action taken? • Is the situation resolved?
The geographic contingency analysis tool will provide a more effective, quick overview of the system status and help Reliability Coordinators more effectively direct utilities to perform preventative actions. We suspect that this will help the Reliability Coordinator maintain system reliability. He/she will also better understand where the problem areas are and identify where to direct preventative actions. Because of the large scope of the WECC system, we expect that the tool will provide better situational awareness that will enable the Reliability Coordinator to respond more quickly to possible contingencies, which contributes to improved system reliability.
The geographic contingency analysis tool will improve the SA of the Transmission Operator and provide a more effective, quick overview of the status of his/her local system. By providing a ranking of the different contingencies, the geographic contingency analysis tool will help focus the Transmission Operator’s attention on the most severe contingency and properly prioritize the preventative actions.

3
Because of the wide-area view that this tool can provide, a Transmission Operator can also get a better sense of the impact that neighboring systems have on his/her own system and how the different systems react to each other. Thus, overall it should improve the Transmission Operator’s speed in assessing the status of the system, taking preventative actions and increasing his/her situational awareness. Outages and other severe contingencies can be prevented more effectively with this tool.
1.2 The PSE Tool The PSE tool provides the Operator with information about the reliability of measurements that originate from the field. Currently, no tool is available to inform Operators if status data are correct or if there are problems with measuring equipment. Operators rely heavily on data coming in from the field. Providing Operators with a way of detecting bad data will avoid loss of SA.
More specifically, the PSE has value not only to human operators but also to a variety of power system applications such as contingency analysis, protection systems, and bad data determination. The ideal situation in which to demonstrate the impact of the PSE is a scenario that involves bad data; the expected impact of the visualization tool would be to facilitate tracking down and recognition of bad data and the resultant improvement in the operation of the system.
As described in Greitzer, Dauenhauer, Wierks, & Podmore (2009), the tools available to the experimental and control groups are shown in Table 1-2, which also lists applicable mental models and performance measures/criteria.
Table 1-2: Tools, Applicable Mental Models, and Performance Measures for GCA Analysis
Phasor State Estimator
Experimental Group Control Group
Tools • PSE Visualization • PowerSimulator
• PowerSimulator
Mental Models • Electrical Distance • Path power angle relationship • Substation breaker/switch configuration • SCADA telemetry configuration • PMU accuracy • Voltage and current transformers • Weighted least squares method • Measurement accuracies • Parallel Path Flows • Generator Re dispatch • Line outage distribution factors • Phase Angle • Generator Shift Factors
Performance Measures
• Correct mental models accessed • Time it took to build the right story • Right cues used to build the story • Time it took to take (preventative) action • Was the right action taken? • Is the situation resolved?
4
2. Theory
2.1 An Operator Decision Model The goal of the visualization tools developed for critical decision making is to provide system operators with tools that will trigger mental models and simulations that will make it possible to assess the situation and devise or identify an action script to resolve or improve the state of the electrical system.
This section describes a theory-based methodology to design experiments that test if Operators use the right mental models and if this leads to better operator decision making. As a theoretical background, this report describes and advances the Operator Decision Model (Greitzer et al., 2008a; 2009) that integrates concepts of SA (Endsley, 1995; 1997), recognition-primed decision making (RPD) (Klein, 1993), and meta-cognition (Cohen et al., 1997).
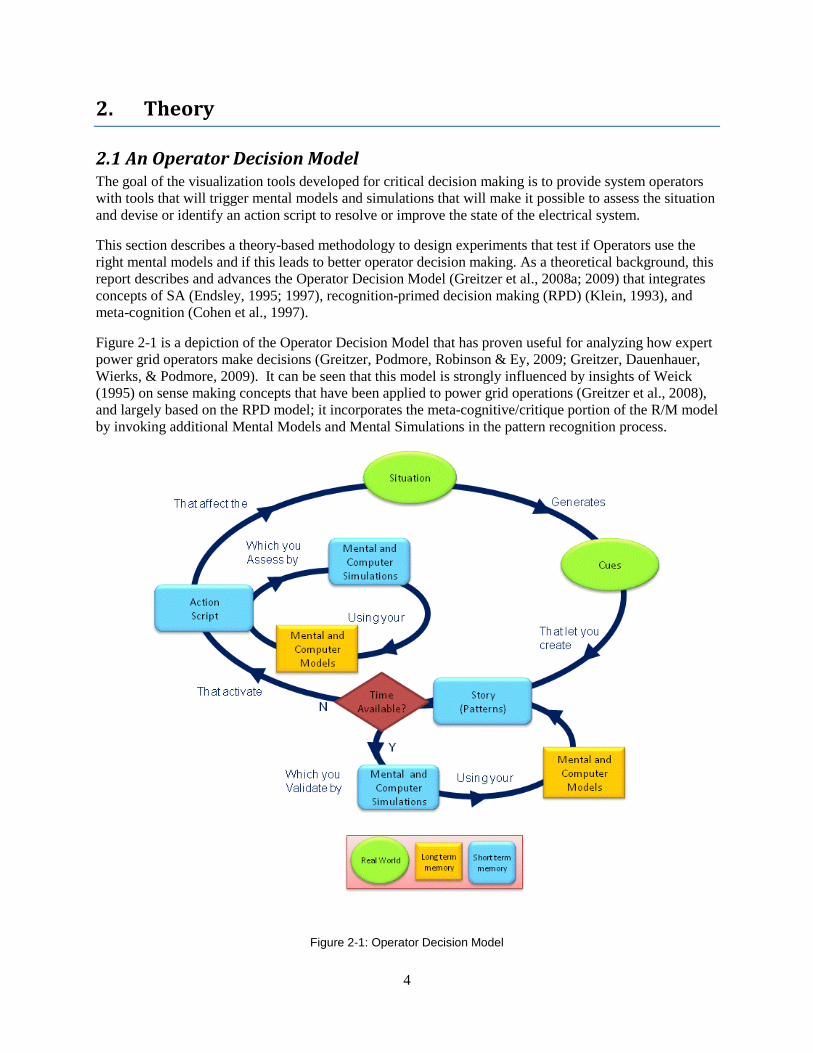
Figure 2-1 is a depiction of the Operator Decision Model that has proven useful for analyzing how expert power grid operators make decisions (Greitzer, Podmore, Robinson & Ey, 2009; Greitzer, Dauenhauer, Wierks, & Podmore, 2009). It can be seen that this model is strongly influenced by insights of Weick (1995) on sense making concepts that have been applied to power grid operations (Greitzer et al., 2008), and largely based on the RPD model; it incorporates the meta-cognitive/critique portion of the R/M model by invoking additional Mental Models and Mental Simulations in the pattern recognition process.
Figure 2-1: Operator Decision Model

5
The initial processing of cues and patterns may be modulated by a critiquing process (using mental models and simulations) that occurs early in the recognition-primed process of situation assessment. Additional mental simulation processes occur following selection of a course of action (action script), as the decision maker examines or tests whether the proposed response action work as anticipated. The main advantage of this characterization is that it acknowledges the role of mental models in the situation awareness component of decision making as well as in response selection.
Concepts of Cues, Mental and Computer Models, Mental and Computer Simulations, Patterns, Stories and Action Scripts will be used at all phases of the effort for evaluating the Visualization Tools.
2.2 Research Questions As described in the introduction, this study examines the impact of visualization tools on performance of System Operators, by inferring the use of Mental and Computer Models and Mental and Computer Simulations by the Operators. The model developed by Greitzer and colleagues (Greitzer, Podmore, Robinson & Ey, 2009; Greitzer, Dauenhauer, Wierks, & Podmore, 2009) is used to design and develop the research questions and experiment. As is shown in the model, System Operators process cues to develop a story; this story is used to develop actions that will improve the situation. System Operators use a number of tools to process all the cues and develop the correct story. Not all the tools have been proven effective; and visualizations employed with these tools still require improvement in order to more effectively promote SA and good decisions. PNNL has developed a set of analytic and visualization tools to improve the processing of cues by System Operators, which in turn should improve story creation and ultimately Operator performance.
Therefore, the research question that is used in this study is:
How do these visualization tools affect (a) the overall performance of System Operators; (b) their ability to recognize and use the correct cues and mental models and simulations; and (c) the ability of System Operators to create correct action scripts resulting in positive effects on the electrical grid?
This can be shown in a conceptual model as follows:
Visualization Tools Cues Mental Mental Action Scripts Performance Models Simulations
A fundamental challenge for this study is to determine if the visualization tools provide the participants with the information to accurately identify a potential problem in the system. Can be participants use information produced by the tools in their evaluation of the state of the system?
The first hypothesis is therefore as follows:
H1: Compared to performance in the absence of the GCA and PSE tools, operators who use the GCA and PSE visualization tools will demonstrate superior problem recognition.
A critical factor for problem recognition is identification of relevant cues; thus we are interested in determining if the visualization tools provide the participants with appropriate cues that trigger the right mental and computer models and mental and computer simulations.
The second hypothesis is as follows:

6
H2. Compared to performance in the absence of the GCA and PSE tools, operators who use the visualization tools will demonstrate increased ability to identify the complete and correct set of relevant cues associated with system problems.
Another element of the problem solving process is to use these cues in the evaluation of the state of the system and to build the correct story. Thus our research question is to determine if the visualization tools help the operators construct a correct, complete and timely story of the problem, using the correct and complete set of relevant mental models in creating the story. The third hypothesis is as follows:
H3: Compared to performance in the absence of the GCA and PSE tools, operators who use the visualization tools will create more accurate and complete stories of the identified problems.
Finally, we ask if the story that Operators build using cues and mental models triggers the right action scripts. By looking at the state of the system, the Operator will come up with an action script, and then test the action script by invoking mental and computer simulations and mental and computer models, to determine if the action script is expected to improve the system state. The ultimate question is whether or not the responses described by the action scripts lead to a more secure and reliable system; i.e., if the action taken by the operator is effective in improving the system state.
The fourth hypothesis is:
H4: Compared to performance in the absence of the GCA and PSE tools, operators who use the GCA and PSE tools will perform more effective actions to increase system security and reliability.
If all the above hypotheses can be demonstrated, we may conclude that the visualization tools increase Operator performance.
The next section discusses the scenario used for the experiment and identifies critical cues and mental models that are needed to solve the problem.
7
3. Scenario Analysis
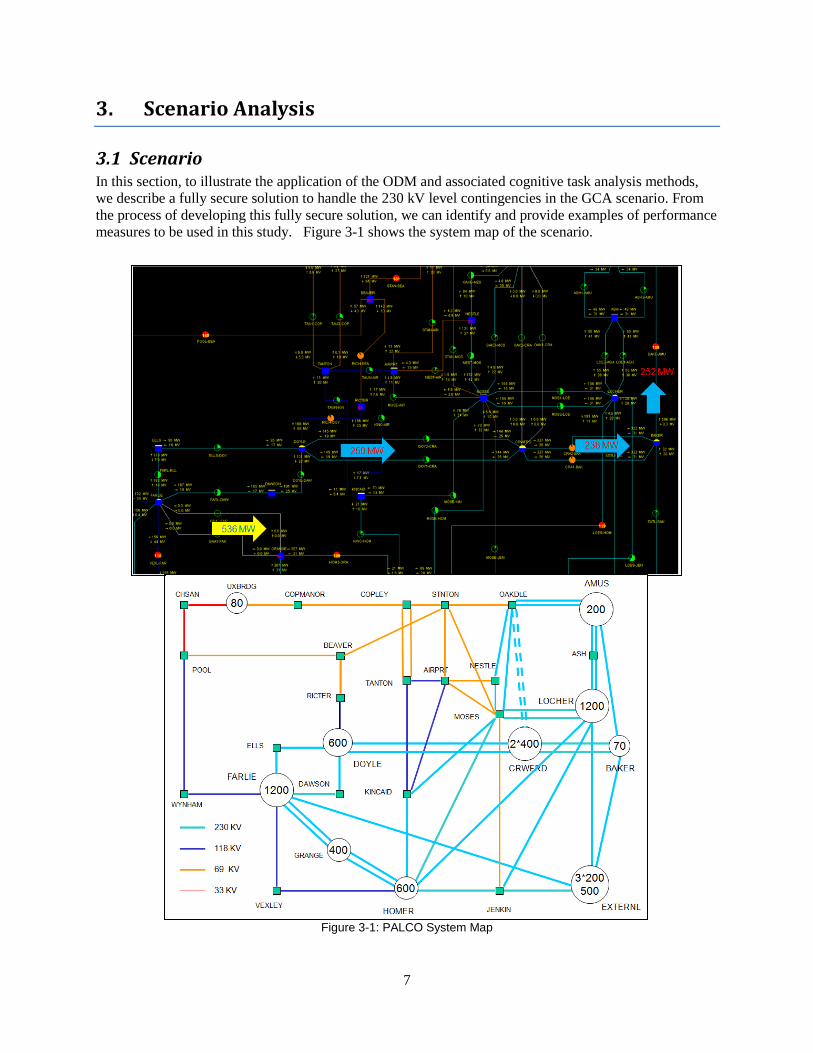
3.1 Scenario In this section, to illustrate the application of the ODM and associated cognitive task analysis methods, we describe a fully secure solution to handle the 230 kV level contingencies in the GCA scenario. From the process of developing this fully secure solution, we can identify and provide examples of performance measures to be used in this study. Figure 3-1 shows the system map of the scenario.
Figure 3-1: PALCO System Map
8
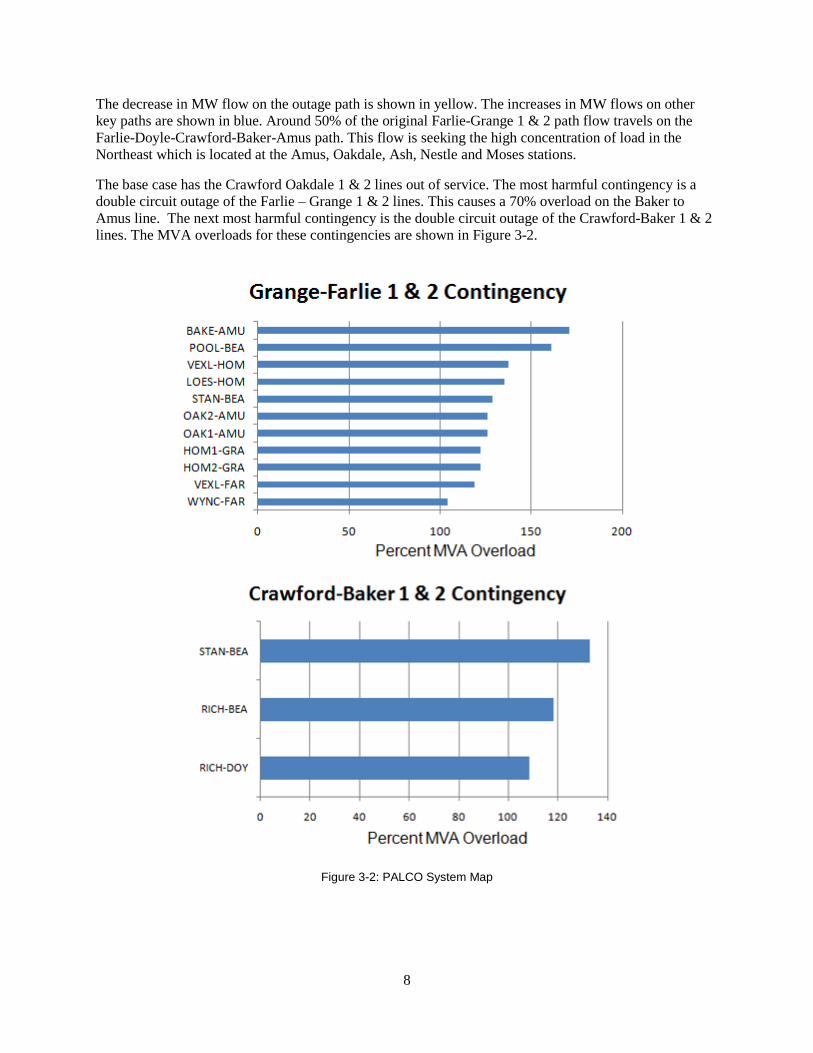
The decrease in MW flow on the outage path is shown in yellow. The increases in MW flows on other key paths are shown in blue. Around 50% of the original Farlie-Grange 1 & 2 path flow travels on the Farlie-Doyle-Crawford-Baker-Amus path. This flow is seeking the high concentration of load in the Northeast which is located at the Amus, Oakdale, Ash, Nestle and Moses stations.
The base case has the Crawford Oakdale 1 & 2 lines out of service. The most harmful contingency is a double circuit outage of the Farlie – Grange 1 & 2 lines. This causes a 70% overload on the Baker to Amus line. The next most harmful contingency is the double circuit outage of the Crawford-Baker 1 & 2 lines. The MVA overloads for these contingencies are shown in Figure 3-2.
Figure 3-2: PALCO System Map
9
Two action scripts are appropriate to offset the flow on the Farlie-Doyle-Crawford-Baker-Amus path:
• Start the Grange combined cycle unit and ramp this to its maximum output of 400 MW. Decrease the Farlie unit by 400 MW. Decreasing generation at the sending end of the overloaded Farlie-Doyle-Crawford-Baker-Amus path will unload the path. Increasing generation at Grange will serve the load in the northeast via the Grange-Homer-Moses and Grange-Homer-Locher paths which are not heavily loaded.
• Start the Uxbridge gas turbine and ramp this to it maximum capacity of 80 MW. Decrease the Crawford 1 unit by 80 MW. Decreasing the Crawford unit will help unload the overloaded Crawford-Baker-Amus path. Starting the Uxbridge gas turbine will help supply the northeast load on the Uxbridge-Copmanor-Copley-Stanton-Oakdale path. This will also help support the low voltages at the Uxbridge, Cheshan and Pool stations.
Rationale for expected advantage of GCA visualization: The ability to visualize the increased path flows resulting from the contingency enables the user to estimate which pairs of generators can be used to re-dispatch the system and reduce the increased path flows. It is valuable to be able to see the flows for the harmful contingencies on a system map diagram. It is also valuable to see the increased major path flows due to a contingency shown on a system map.
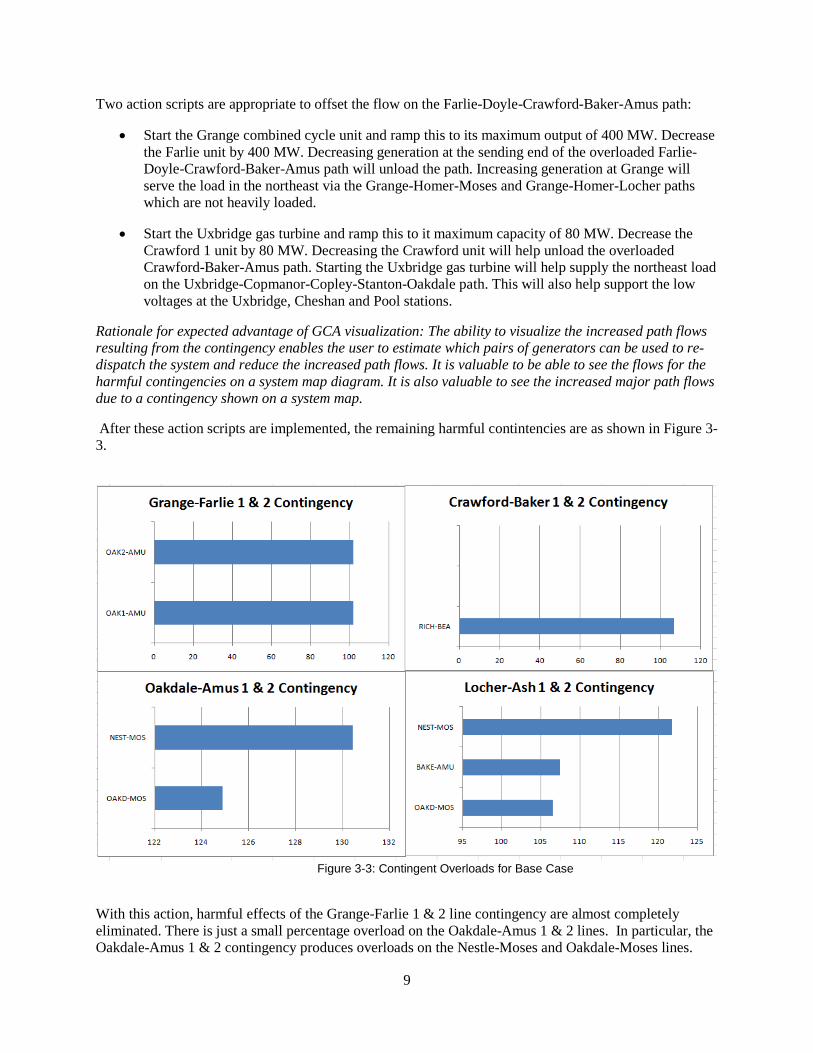
After these action scripts are implemented, the remaining harmful contintencies are as shown in Figure 3-3.
Figure 3-3: Contingent Overloads for Base Case
With this action, harmful effects of the Grange-Farlie 1 & 2 line contingency are almost completely eliminated. There is just a small percentage overload on the Oakdale-Amus 1 & 2 lines. In particular, the Oakdale-Amus 1 & 2 contingency produces overloads on the Nestle-Moses and Oakdale-Moses lines.

10
The Locher-Ash 1 & 2 contingency cause overloads on the Nestle-Moses, Baker-Amus and Oakdale-Moses lines. At this point, there are few if any options for generation redispatch. As additional lines that feed the northeast lines are taken out of service, the other lines become overloaded. There is no other generation in the northeast that can be increased. Therefore, the only way to mitigate overloads is to shed load. An effective action script is to shed load at Nestle station and decrease generation at Locher. Reducing the Locher unit output by 235 MW and shedding 235 MW of load at Nestle is sufficient to eliminate any overloads due to Oakdale-Amus 1 & 2 and Locher-Ash 1 & 2 contingencies. The Ricter-Beaver overload due to the Crawford-Baker 1 & 2 line contingency is eliminated by decreasing the output of the Doyle unit by 50 MW and increasing the output of the Homer unit by 50 MW. Doyle is at the sending end of the Ricter-Beaver path. After these actions, the system is fully secure due to 230 kV outages. There are contingency violations for 138 kV and 69 kV lines outages; these are localized and can be corrected with load shedding after they occur. A similar analysis may be performed for the scenario used in the PSE experiment.
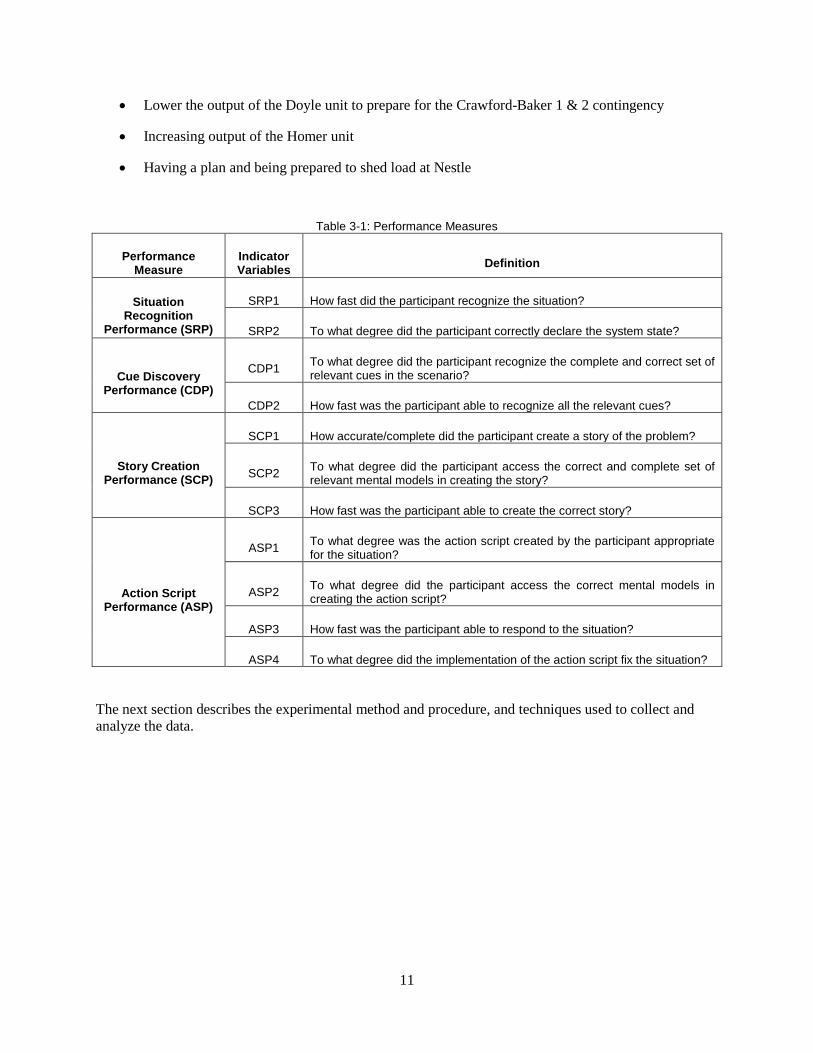
3.2 Performance Measures The challenge in setting up the experiment is to identify and recognize when critical cues, mental models, and actions are taken by the operators and/or to extract that information from interviews with the operators following the scenario. Performance measures based on the Operator Decision Model have been defined for this purpose, as shown in Table 3-1. Four key areas are represented: Situation Recognition Performance (SRP), Cue Discovery Performance (CDP), Story Creation Performance (SCP), and Action Script Performance (ASP).
Objective measures for performance evaluation on this scenario would include:
• Awareness that Farlie-Grange 1 & 2 is the most severe contingency
• Awareness that Crawford-Baker 1 & 2 is a harmful contingency
• Awareness that Oakdale-Amus 1 & 2 is a harmful contingency
• Awareness that Locher-Ash 1 & 2 is a harmful contingency
• Awareness that contingencies cause low voltages in the Northwest around Uxbridge
• Awareness that there is high load in the Northeast and the Crawford-Oakdale 1 & 2 line outage in the base case creates a bottleneck to serving this load.
Control actions that help include:
• Start the Grange unit and ramp it to full output of 400 MW
• Start the Uxbridge unit and ramp it to full output of 80 MW
• Lowering output of the Farlie unit
• Lowering output of the Crawford unit
11
• Lower the output of the Doyle unit to prepare for the Crawford-Baker 1 & 2 contingency
• Increasing output of the Homer unit
• Having a plan and being prepared to shed load at Nestle
Table 3-1: Performance Measures
Performance Measure
Indicator Variables Definition
Situation Recognition
Performance (SRP)
SRP1 How fast did the participant recognize the situation?
SRP2 To what degree did the participant correctly declare the system state?
Cue Discovery Performance (CDP)
CDP1 To what degree did the participant recognize the complete and correct set of relevant cues in the scenario?
CDP2 How fast was the participant able to recognize all the relevant cues?
Story Creation Performance (SCP)
SCP1 How accurate/complete did the participant create a story of the problem?
SCP2 To what degree did the participant access the correct and complete set of relevant mental models in creating the story?
SCP3 How fast was the participant able to create the correct story?
Action Script Performance (ASP)
ASP1 To what degree was the action script created by the participant appropriate for the situation?
ASP2 To what degree did the participant access the correct mental models in creating the action script?
ASP3 How fast was the participant able to respond to the situation?
ASP4 To what degree did the implementation of the action script fix the situation? The next section describes the experimental method and procedure, and techniques used to collect and analyze the data.
12
4. Method
This section describes the design of the experiment conducted to address the research questions and hypotheses described earlier. We describe the rationale for the experiment using the Operator Decision Model and then the procedure, including the population participating in the experiment, the experimental design, data gathering techniques and statistical analyses.
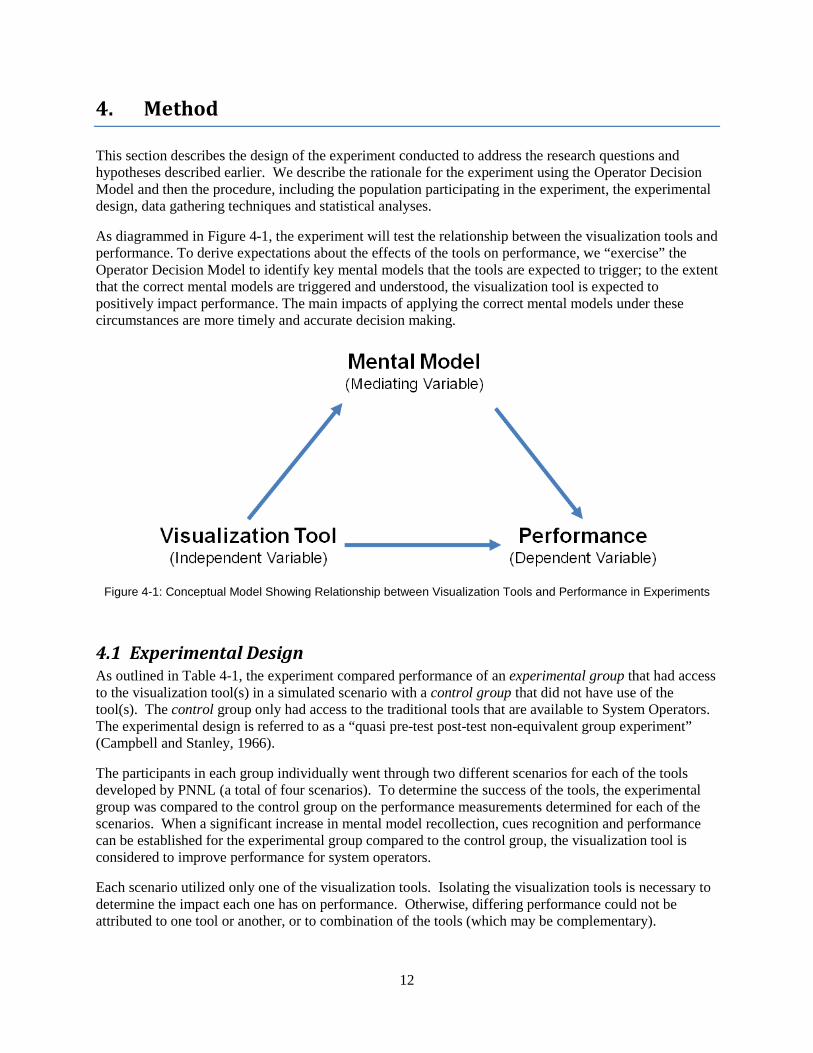
As diagrammed in Figure 4-1, the experiment will test the relationship between the visualization tools and performance. To derive expectations about the effects of the tools on performance, we “exercise” the Operator Decision Model to identify key mental models that the tools are expected to trigger; to the extent that the correct mental models are triggered and understood, the visualization tool is expected to positively impact performance. The main impacts of applying the correct mental models under these circumstances are more timely and accurate decision making.
Figure 4-1: Conceptual Model Showing Relationship between Visualization Tools and Performance in Experiments
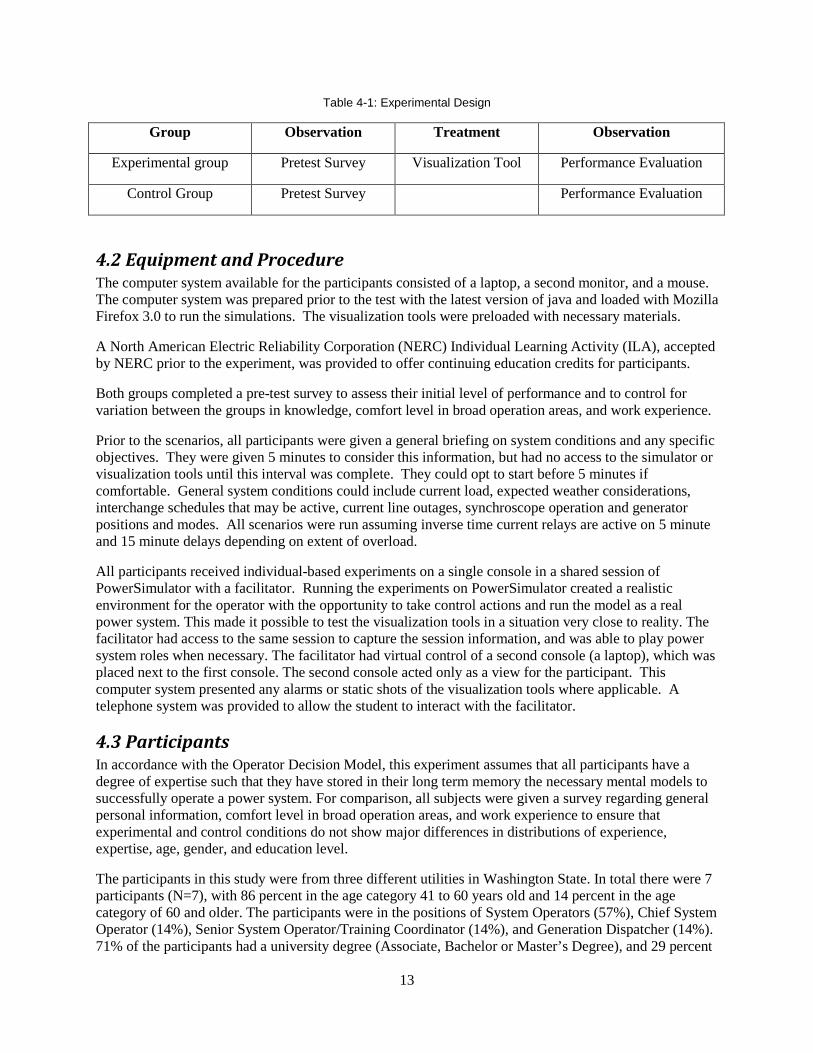
4.1 Experimental Design As outlined in Table 4-1, the experiment compared performance of an experimental group that had access to the visualization tool(s) in a simulated scenario with a control group that did not have use of the tool(s). The control group only had access to the traditional tools that are available to System Operators. The experimental design is referred to as a “quasi pre-test post-test non-equivalent group experiment” (Campbell and Stanley, 1966).
The participants in each group individually went through two different scenarios for each of the tools developed by PNNL (a total of four scenarios). To determine the success of the tools, the experimental group was compared to the control group on the performance measurements determined for each of the scenarios. When a significant increase in mental model recollection, cues recognition and performance can be established for the experimental group compared to the control group, the visualization tool is considered to improve performance for system operators.
Each scenario utilized only one of the visualization tools. Isolating the visualization tools is necessary to determine the impact each one has on performance. Otherwise, differing performance could not be attributed to one tool or another, or to combination of the tools (which may be complementary).
13
Table 4-1: Experimental Design
Group Observation Treatment Observation
Experimental group Pretest Survey Visualization Tool Performance Evaluation
Control Group Pretest Survey Performance Evaluation
4.2 Equipment and Procedure The computer system available for the participants consisted of a laptop, a second monitor, and a mouse. The computer system was prepared prior to the test with the latest version of java and loaded with Mozilla Firefox 3.0 to run the simulations. The visualization tools were preloaded with necessary materials.
A North American Electric Reliability Corporation (NERC) Individual Learning Activity (ILA), accepted by NERC prior to the experiment, was provided to offer continuing education credits for participants.
Both groups completed a pre-test survey to assess their initial level of performance and to control for variation between the groups in knowledge, comfort level in broad operation areas, and work experience.
Prior to the scenarios, all participants were given a general briefing on system conditions and any specific objectives. They were given 5 minutes to consider this information, but had no access to the simulator or visualization tools until this interval was complete. They could opt to start before 5 minutes if comfortable. General system conditions could include current load, expected weather considerations, interchange schedules that may be active, current line outages, synchroscope operation and generator positions and modes. All scenarios were run assuming inverse time current relays are active on 5 minute and 15 minute delays depending on extent of overload.
All participants received individual-based experiments on a single console in a shared session of PowerSimulator with a facilitator. Running the experiments on PowerSimulator created a realistic environment for the operator with the opportunity to take control actions and run the model as a real power system. This made it possible to test the visualization tools in a situation very close to reality. The facilitator had access to the same session to capture the session information, and was able to play power system roles when necessary. The facilitator had virtual control of a second console (a laptop), which was placed next to the first console. The second console acted only as a view for the participant. This computer system presented any alarms or static shots of the visualization tools where applicable. A telephone system was provided to allow the student to interact with the facilitator.
4.3 Participants In accordance with the Operator Decision Model, this experiment assumes that all participants have a degree of expertise such that they have stored in their long term memory the necessary mental models to successfully operate a power system. For comparison, all subjects were given a survey regarding general personal information, comfort level in broad operation areas, and work experience to ensure that experimental and control conditions do not show major differences in distributions of experience, expertise, age, gender, and education level.
The participants in this study were from three different utilities in Washington State. In total there were 7 participants (N=7), with 86 percent in the age category 41 to 60 years old and 14 percent in the age category of 60 and older. The participants were in the positions of System Operators (57%), Chief System Operator (14%), Senior System Operator/Training Coordinator (14%), and Generation Dispatcher (14%). 71% of the participants had a university degree (Associate, Bachelor or Master’s Degree), and 29 percent

14
had vocational education. All participants had experience working as a Balancing Authority (100%), none of the participants had experience working as a Reliability Coordinator, 71% had experience as a Transmission Operator, 29% and 71% had experience as a Lineman and Generator Operator, respectively.
4.4 Data Gathering Techniques Performance of the participants in both groups was evaluated by subject matter experts (SMEs). Two SMEs analyzed the data that were collected during the scenarios; they rated all the participants according to the Operator Decision Model. In order to capture relevant information on the performance of the subjects during the experiment we used the following data gathering techniques:
• A pre-scenario survey was used to capture all the background information that was used as control variables during the statistical analyses.
• Video and Audio capture for each experiment, focused on the subject.
• Screen capture for each experiment
• Video capture to capture their actions and thoughts – the subjects were asked to explain their thoughts and actions out loud for the duration of the experiment.
• Post scenario interview – an interview was conducted immediately after the experiment. Questions were carefully constructed as to not lead the subject in the correct answer, but instead were clarifying and focused on determining which mental models were accessed, at what times, and why. The interview was recorded with video and audio.
To support the post-scenario interview, the screens used by the participants during the scenario were recorded using the Snagit dynamic screen capture software. These screen shots were replayed to the participants following the scenarios. The participants were debriefed using questions such as:
• Describe the state of the system at this point
• What were your main concerns about this area of the system?
• What cues were you looking at on this display?
• What was the worst contingency?
• What control action did you take?
• What other control actions did you consider?
• Why did you choose the increase the XYZ unit
15
5. Results
This section addresses the overall research question:
How do these visualization tools affect (a) the overall performance of System Operators; (b) their ability to recognize and use the correct cues and mental models; and (c) the ability of System Operators to create correct action scripts resulting in positive effects on the electrical grid?
To assess the research question, we test the hypotheses stated in the Theory section by looking at correlation matrices of specific performance measures as well as differences in performance between experimental and control conditions. First, however, we examine the agreement between the SMEs who rated operator performance.
5.1 Assessment of Inter-rater Reliability and Performance Measures Inter-Rater Reliability. The data collected during the experiment were evaluated by SMEs who rated all the participants on a number of performance measures as outlined in Section 3. An inter-rater reliability analysis was performed to assess the consistency between the raters’ ratings. We used Spearman’s rho (ρ) to compute the inter-rater agreement for ordinal/ranking data (Wuensch, 2007). The results show a fairly high correlation between the two sets of ratings (ρ = 0.6574, p < 0.001). When we calculated the Spearman’s rank correlation coefficients for the two experiments separately, the correlation coefficient for the experiment with the PSE tool was higher (ρ = 0.7194 , p < 0.001) than for the experiment with the GCA tool (ρ = 0.5204, p < 0.001). Since the experiment with the GCA tool preceded the experiment with PSE, this increase in raters’ agreement may be indicative of an improvement in the raters’ understanding and application of the rating techniques over time.
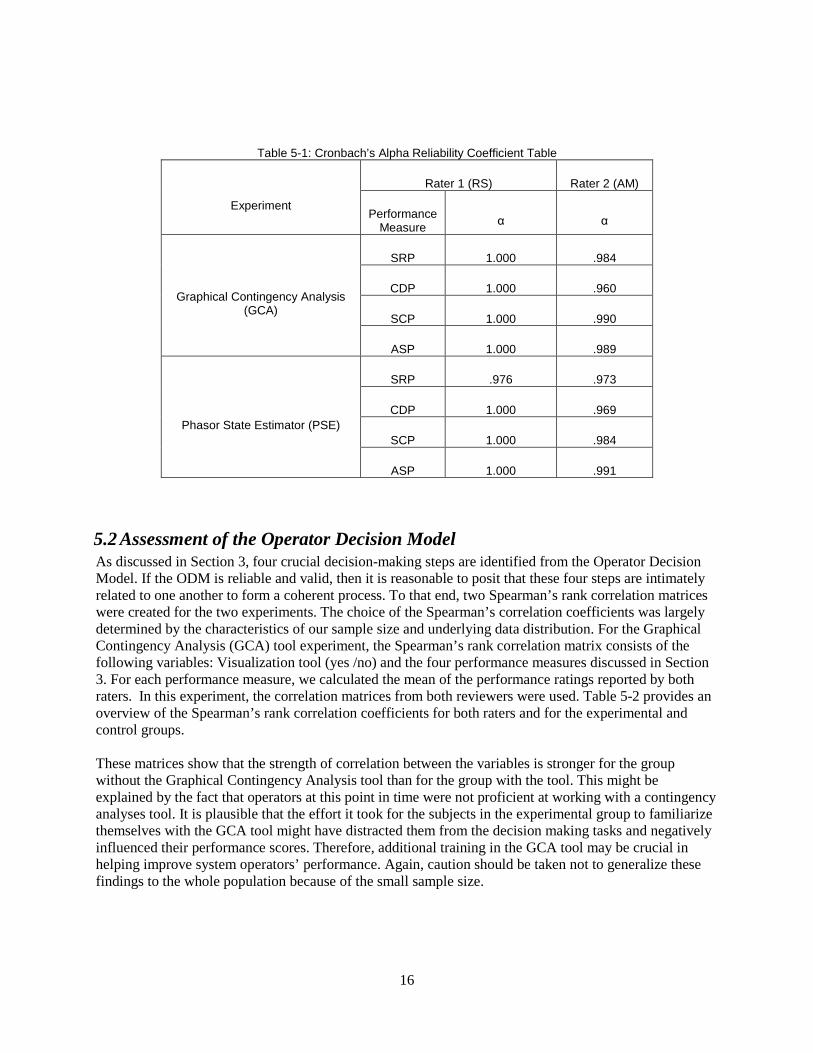
Performance Measures. As described in Section 3, we identified four key performance measures that reflect the Operator Decision Model (refer to Figure 2-1 and Table 3-1: Situation Recognition Performance (SRP), Cue Discovery Performance (CDP), Story Creation Performance (SCP), and Action Script Performance (ASP). We calculated Cronbach’s alpha to measure the degree to these indicator variables measure the respective performance areas identified in the Operator Decision Model. For instance, the alpha will measure how well the two indicators, SRP1 and SRP2, measure situation recognition performance (SRP); and how well CDP1 and CDP2 measure cue discovery performance (CDP). Cronbach’s α reliability coefficients are presented in Table 5-1. The high alpha coefficient values suggest that the indicators are reliable and consistent measures of each of the four performance variables.
The hypotheses as described in the Theory were tested by looking at the correlation matrices as well as the Wilcoxon-Mann-Whitney test, a nonparametric equivalent to the independent t-test. The Wilcoxon-Mann-Whitney test is appropriate for the given data due to the small sample size and the possible lack of normal distributions for our data. As described in Pallant (2001), the non-parametric technique is ideal when analyzing data with a limited sample size or when the data does not meet the strict requirements of parametric tests (e.g., t-test). The results of these analyses are described next.
16
Table 5-1: Cronbach’s Alpha Reliability Coefficient Table
Experiment
Rater 1 (RS) Rater 2 (AM)
Performance Measure α α
Graphical Contingency Analysis (GCA)
SRP 1.000 .984
CDP 1.000 .960
SCP 1.000 .990
ASP 1.000 .989
Phasor State Estimator (PSE)
SRP .976 .973
CDP 1.000 .969
SCP 1.000 .984
ASP 1.000 .991
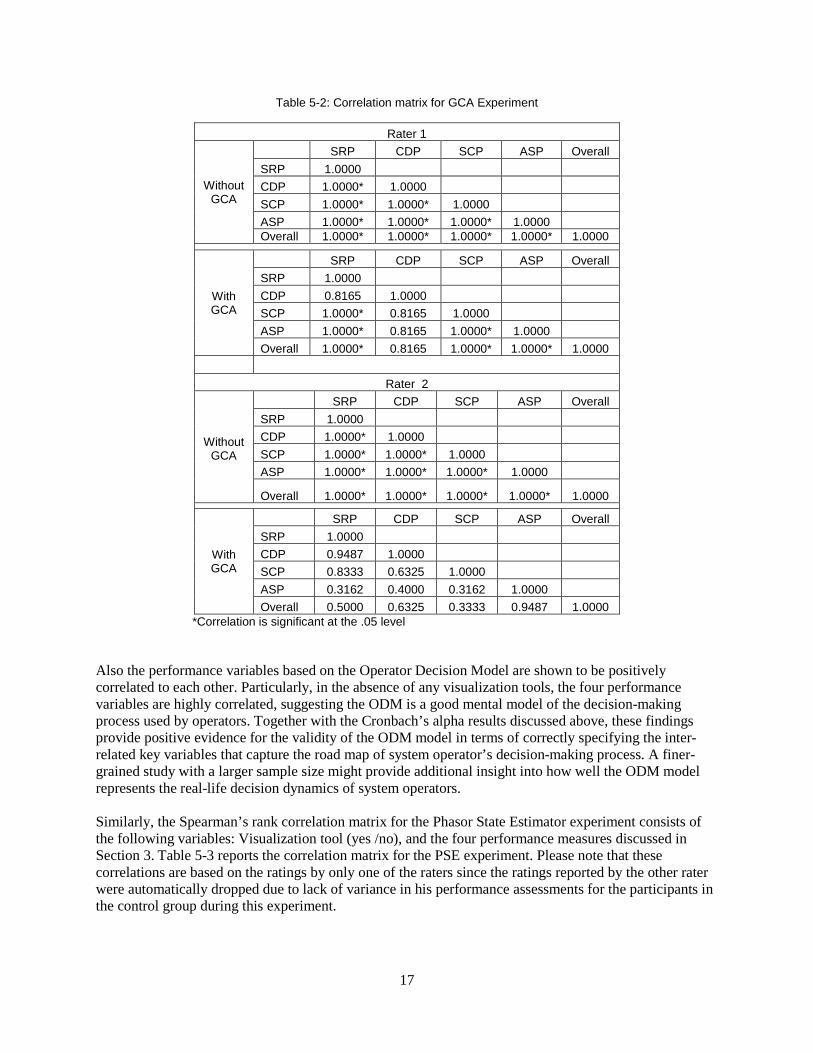
5.2 Assessment of the Operator Decision Model As discussed in Section 3, four crucial decision-making steps are identified from the Operator Decision Model. If the ODM is reliable and valid, then it is reasonable to posit that these four steps are intimately related to one another to form a coherent process. To that end, two Spearman’s rank correlation matrices were created for the two experiments. The choice of the Spearman’s correlation coefficients was largely determined by the characteristics of our sample size and underlying data distribution. For the Graphical Contingency Analysis (GCA) tool experiment, the Spearman’s rank correlation matrix consists of the following variables: Visualization tool (yes /no) and the four performance measures discussed in Section 3. For each performance measure, we calculated the mean of the performance ratings reported by both raters. In this experiment, the correlation matrices from both reviewers were used. Table 5-2 provides an overview of the Spearman’s rank correlation coefficients for both raters and for the experimental and control groups. These matrices show that the strength of correlation between the variables is stronger for the group without the Graphical Contingency Analysis tool than for the group with the tool. This might be explained by the fact that operators at this point in time were not proficient at working with a contingency analyses tool. It is plausible that the effort it took for the subjects in the experimental group to familiarize themselves with the GCA tool might have distracted them from the decision making tasks and negatively influenced their performance scores. Therefore, additional training in the GCA tool may be crucial in helping improve system operators’ performance. Again, caution should be taken not to generalize these findings to the whole population because of the small sample size.
17
Table 5-2: Correlation matrix for GCA Experiment
Rater 1
Without GCA
SRP CDP SCP ASP Overall SRP 1.0000
CDP 1.0000* 1.0000
SCP 1.0000* 1.0000* 1.0000
ASP 1.0000* 1.0000* 1.0000* 1.0000 Overall 1.0000* 1.0000* 1.0000* 1.0000* 1.0000
With GCA
SRP CDP SCP ASP Overall SRP 1.0000
CDP 0.8165 1.0000
SCP 1.0000* 0.8165 1.0000
ASP 1.0000* 0.8165 1.0000* 1.0000 Overall 1.0000* 0.8165 1.0000* 1.0000* 1.0000
Rater 2
Without GCA
SRP CDP SCP ASP Overall SRP 1.0000 CDP 1.0000* 1.0000 SCP 1.0000* 1.0000* 1.0000 ASP 1.0000* 1.0000* 1.0000* 1.0000
Overall 1.0000* 1.0000* 1.0000* 1.0000* 1.0000
With GCA
SRP CDP SCP ASP Overall SRP 1.0000 CDP 0.9487 1.0000 SCP 0.8333 0.6325 1.0000 ASP 0.3162 0.4000 0.3162 1.0000 Overall 0.5000 0.6325 0.3333 0.9487 1.0000
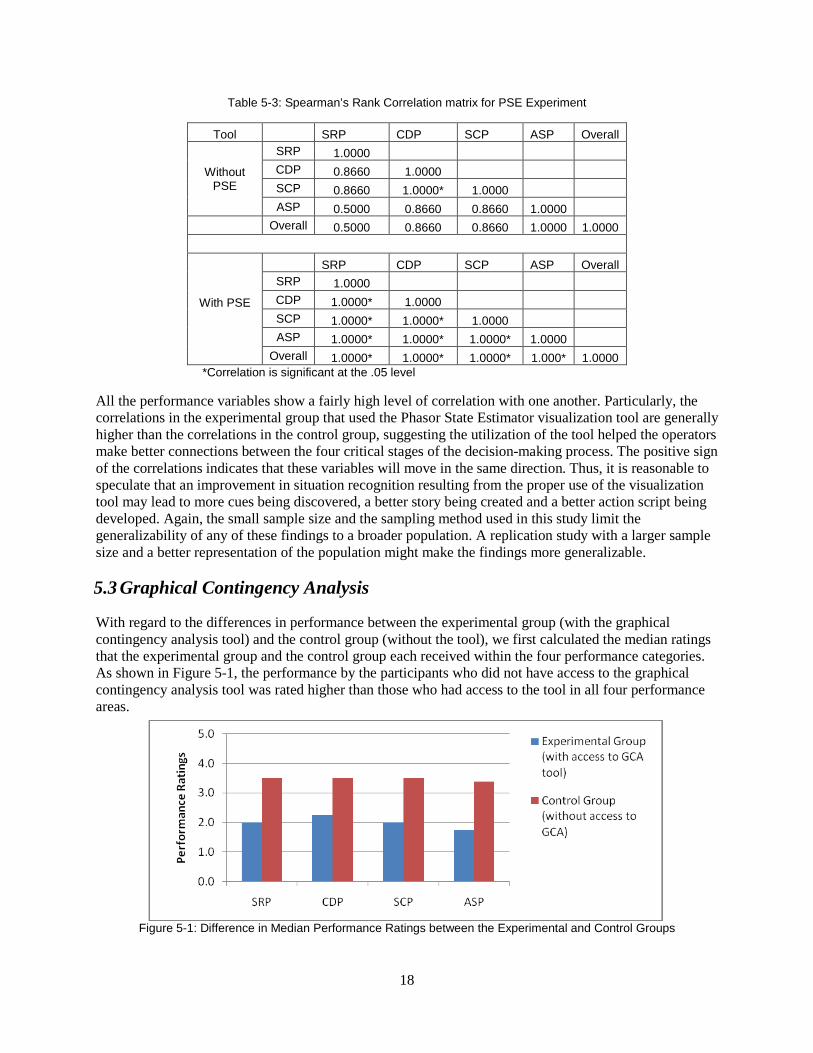
*Correlation is significant at the .05 level Also the performance variables based on the Operator Decision Model are shown to be positively correlated to each other. Particularly, in the absence of any visualization tools, the four performance variables are highly correlated, suggesting the ODM is a good mental model of the decision-making process used by operators. Together with the Cronbach’s alpha results discussed above, these findings provide positive evidence for the validity of the ODM model in terms of correctly specifying the inter-related key variables that capture the road map of system operator’s decision-making process. A finer-grained study with a larger sample size might provide additional insight into how well the ODM model represents the real-life decision dynamics of system operators. Similarly, the Spearman’s rank correlation matrix for the Phasor State Estimator experiment consists of the following variables: Visualization tool (yes /no), and the four performance measures discussed in Section 3. Table 5-3 reports the correlation matrix for the PSE experiment. Please note that these correlations are based on the ratings by only one of the raters since the ratings reported by the other rater were automatically dropped due to lack of variance in his performance assessments for the participants in the control group during this experiment.
18
Table 5-3: Spearman’s Rank Correlation matrix for PSE Experiment
Tool SRP CDP SCP ASP Overall
Without PSE
SRP 1.0000
CDP 0.8660 1.0000
SCP 0.8660 1.0000* 1.0000
ASP 0.5000 0.8660 0.8660 1.0000
Overall 0.5000 0.8660 0.8660 1.0000 1.0000
With PSE
SRP CDP SCP ASP Overall SRP 1.0000
CDP 1.0000* 1.0000
SCP 1.0000* 1.0000* 1.0000
ASP 1.0000* 1.0000* 1.0000* 1.0000 Overall 1.0000* 1.0000* 1.0000* 1.000* 1.0000
*Correlation is significant at the .05 level
All the performance variables show a fairly high level of correlation with one another. Particularly, the correlations in the experimental group that used the Phasor State Estimator visualization tool are generally higher than the correlations in the control group, suggesting the utilization of the tool helped the operators make better connections between the four critical stages of the decision-making process. The positive sign of the correlations indicates that these variables will move in the same direction. Thus, it is reasonable to speculate that an improvement in situation recognition resulting from the proper use of the visualization tool may lead to more cues being discovered, a better story being created and a better action script being developed. Again, the small sample size and the sampling method used in this study limit the generalizability of any of these findings to a broader population. A replication study with a larger sample size and a better representation of the population might make the findings more generalizable.
5.3 Graphical Contingency Analysis
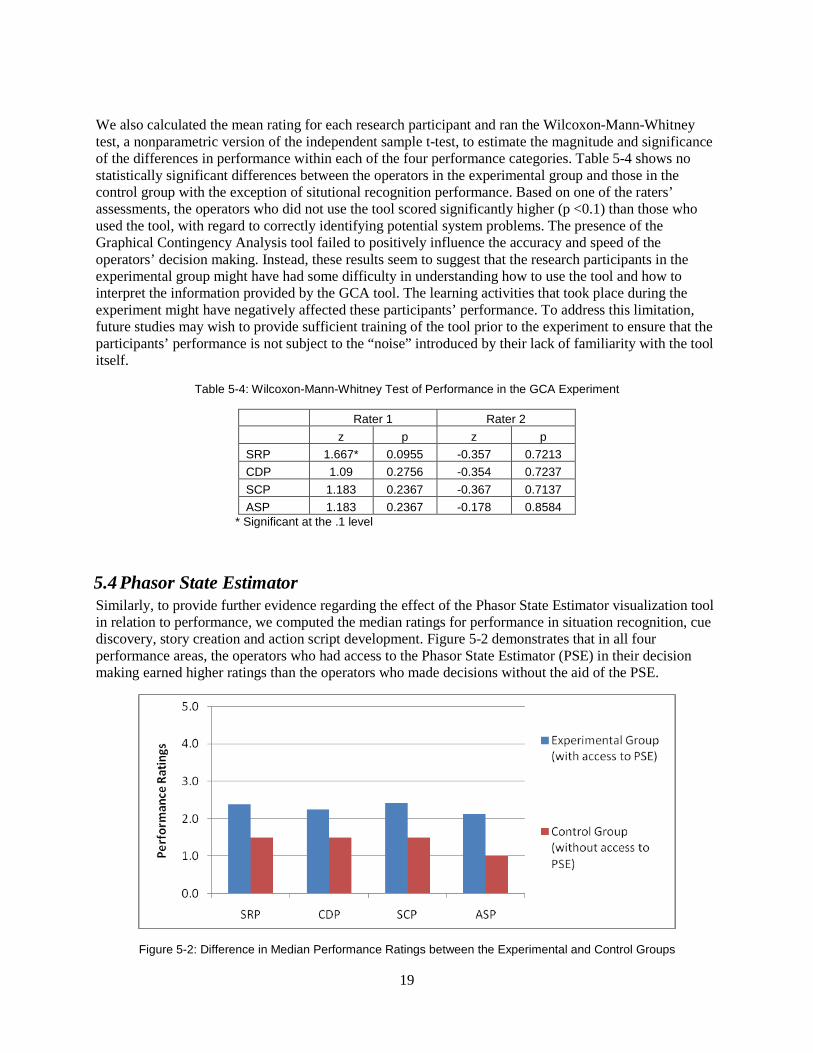
With regard to the differences in performance between the experimental group (with the graphical contingency analysis tool) and the control group (without the tool), we first calculated the median ratings that the experimental group and the control group each received within the four performance categories. As shown in Figure 5-1, the performance by the participants who did not have access to the graphical contingency analysis tool was rated higher than those who had access to the tool in all four performance areas.
Figure 5-1: Difference in Median Performance Ratings between the Experimental and Control Groups
19
We also calculated the mean rating for each research participant and ran the Wilcoxon-Mann-Whitney test, a nonparametric version of the independent sample t-test, to estimate the magnitude and significance of the differences in performance within each of the four performance categories. Table 5-4 shows no statistically significant differences between the operators in the experimental group and those in the control group with the exception of situtional recognition performance. Based on one of the raters’ assessments, the operators who did not use the tool scored significantly higher (p <0.1) than those who used the tool, with regard to correctly identifying potential system problems. The presence of the Graphical Contingency Analysis tool failed to positively influence the accuracy and speed of the operators’ decision making. Instead, these results seem to suggest that the research participants in the experimental group might have had some difficulty in understanding how to use the tool and how to interpret the information provided by the GCA tool. The learning activities that took place during the experiment might have negatively affected these participants’ performance. To address this limitation, future studies may wish to provide sufficient training of the tool prior to the experiment to ensure that the participants’ performance is not subject to the “noise” introduced by their lack of familiarity with the tool itself.
Table 5-4: Wilcoxon-Mann-Whitney Test of Performance in the GCA Experiment
Rater 1 Rater 2 z p z p SRP 1.667* 0.0955 -0.357 0.7213 CDP 1.09 0.2756 -0.354 0.7237 SCP 1.183 0.2367 -0.367 0.7137 ASP 1.183 0.2367 -0.178 0.8584
* Significant at the .1 level
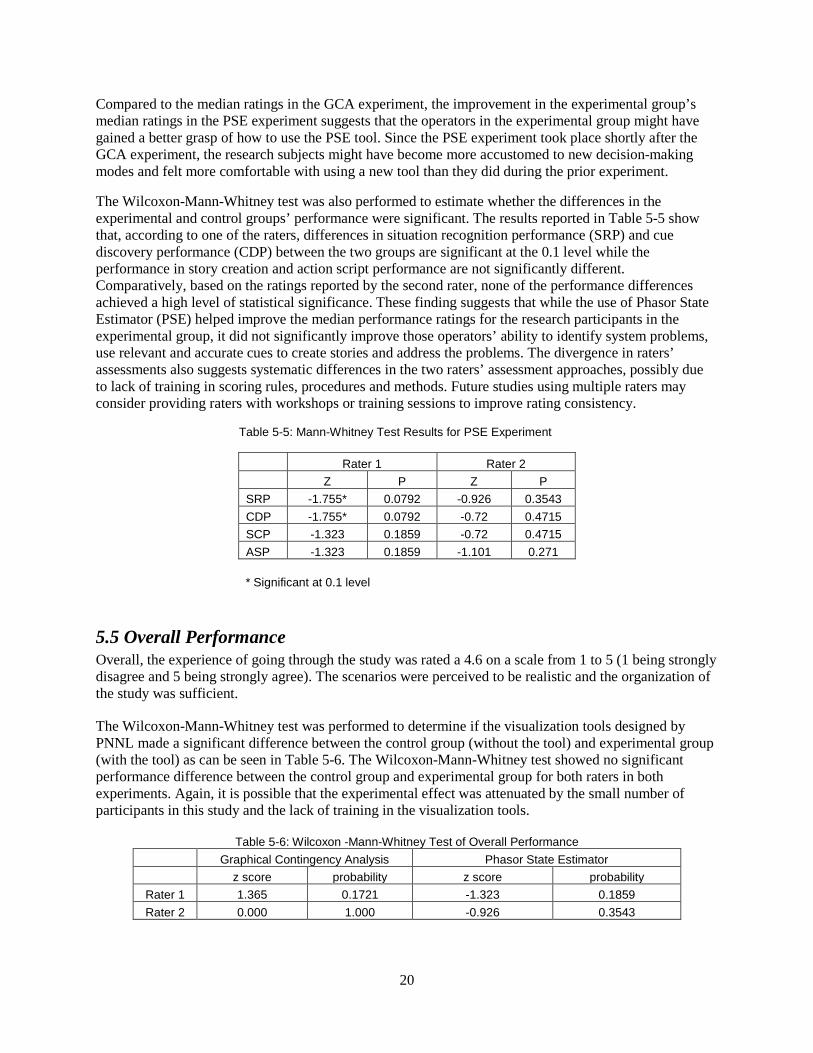
5.4 Phasor State Estimator Similarly, to provide further evidence regarding the effect of the Phasor State Estimator visualization tool in relation to performance, we computed the median ratings for performance in situation recognition, cue discovery, story creation and action script development. Figure 5-2 demonstrates that in all four performance areas, the operators who had access to the Phasor State Estimator (PSE) in their decision making earned higher ratings than the operators who made decisions without the aid of the PSE.
Figure 5-2: Difference in Median Performance Ratings between the Experimental and Control Groups
20
Compared to the median ratings in the GCA experiment, the improvement in the experimental group’s median ratings in the PSE experiment suggests that the operators in the experimental group might have gained a better grasp of how to use the PSE tool. Since the PSE experiment took place shortly after the GCA experiment, the research subjects might have become more accustomed to new decision-making modes and felt more comfortable with using a new tool than they did during the prior experiment.
The Wilcoxon-Mann-Whitney test was also performed to estimate whether the differences in the experimental and control groups’ performance were significant. The results reported in Table 5-5 show that, according to one of the raters, differences in situation recognition performance (SRP) and cue discovery performance (CDP) between the two groups are significant at the 0.1 level while the performance in story creation and action script performance are not significantly different. Comparatively, based on the ratings reported by the second rater, none of the performance differences achieved a high level of statistical significance. These finding suggests that while the use of Phasor State Estimator (PSE) helped improve the median performance ratings for the research participants in the experimental group, it did not significantly improve those operators’ ability to identify system problems, use relevant and accurate cues to create stories and address the problems. The divergence in raters’ assessments also suggests systematic differences in the two raters’ assessment approaches, possibly due to lack of training in scoring rules, procedures and methods. Future studies using multiple raters may consider providing raters with workshops or training sessions to improve rating consistency.
Table 5-5: Mann-Whitney Test Results for PSE Experiment
Rater 1 Rater 2 Z P Z P SRP -1.755* 0.0792 -0.926 0.3543 CDP -1.755* 0.0792 -0.72 0.4715 SCP -1.323 0.1859 -0.72 0.4715 ASP -1.323 0.1859 -1.101 0.271
* Significant at 0.1 level
5.5 Overall Performance Overall, the experience of going through the study was rated a 4.6 on a scale from 1 to 5 (1 being strongly disagree and 5 being strongly agree). The scenarios were perceived to be realistic and the organization of the study was sufficient.
The Wilcoxon-Mann-Whitney test was performed to determine if the visualization tools designed by PNNL made a significant difference between the control group (without the tool) and experimental group (with the tool) as can be seen in Table 5-6. The Wilcoxon-Mann-Whitney test showed no significant performance difference between the control group and experimental group for both raters in both experiments. Again, it is possible that the experimental effect was attenuated by the small number of participants in this study and the lack of training in the visualization tools.
Table 5-6: Wilcoxon -Mann-Whitney Test of Overall Performance
Graphical Contingency Analysis Phasor State Estimator
z score probability z score probability
Rater 1 1.365 0.1721 -1.323 0.1859 Rater 2 0.000 1.000 -0.926 0.3543

21
Next we present conclusions that may be drawn from these studies and we discuss limitations as well as recommendations for future research.
5.6 Detailed Review of Selected Operators’ Performance Here we examine performance of two operators in the GCA experiment based on the post-experiment interview. Participant 5 and Participant 6 gave the comments that were most insightful on describing their level of situation awareness. These were also the participants that took the most definitive control actions. The participants that took few definitive control actions in general had a difficult time explaining their situation awareness.
Some of the key comments from Experimental Participant 6 are listed below:
1. The Farlie-Grange path was one of the major transmission paths as far as generation. (Participant has correctly identified the worst contingency. Participant 6 figured out how to use the Graphical Contingency Analysis program and spent most of the time looking at the results of overloads due to this contingency).
2. It has been my experience that loss of multiple lines in the same right of way is more of a situation than loss of single multiple right of way lines.
3. In my situation we do not have tornados that go through and clear out broad swathes, we have concentrated winds storms, ice storms or lightning storms that tend to take out a large number of lines in a small area.
4. I wanted to see where my overloads were going to be, and I started formulating a plan. Where I was going to have to back generation down to alleviate overloads and where I was going to have to pick generation up. Basically re-dispatch and maybe down the road drop load if I had to.
5. I was particularly interested in the Farlie-Grange the Grange-Homer. Maybe the Crawford-Baker and the Crawford-Doyle outages. That was not a huge concern for me. (The Crawford-Baker and Crawford-Doyle outages are harmful but not as severe as Farlie-Grange)
6. The Crawford-Baker 1 & 2 contingency is a bit of a problem but it was not terrifying for me. I kind of skipped on to the next. (The Crawford-Baker and Crawford-Doyle outages are harmful but not as severe as Farlie-Grange)
7. Now the Farlie-Grange 1 & 2 contingency is ugly. I thought that this was probably going to be my biggest problem - that is why I started to re-dispatch. I was going to back Farlie down bring up Doyle a little bit. Doyle is in a situation where it has got some excess transmission capacity. (Doyle has excess 240 kV transmission capacity but it is overloading the138 kV circuits).
8. I wanted to import some power from external got some lines to alleviate the loading down here and all back off at farlie in the event that we lose the lines - Then I do not have so much load to shed in order to get under my overloads -
9. I have got some voltage problems up at Uxbridge. I can start that CT and take care of that situation. We have a nasty overload between Pool and Beaver. Hopefully some of that generation at Uxbridge will alleviate that too. (Good observation)
10. You tend to not want to start the quick start CTs unless you absolutely have to. My experience was that you always got questioned when you did a quick start on your CTs. I was waiting to see if the lines actually did trip out before I was going to start that. (Good explanation. But starting CTs is required to make the system secure.)

22
11. I was looking at where I had room to ramp generators up - were I had generator resources. This was one of the reasons I ramped up Doyle. It is in a situation where the lines connected to it are not overloaded. (Doyle has excess 240 kV transmission capacity but it is overloading the138 kV circuits).
The following are comments from Control Participant 5.
1. Locher was the only concern, it is a 1200 megawatt unit – you lose that and it is hard to make up that from in the system. (Participant 5 opened the Tabular Contingency Analysis program, but closed it after a few seconds. Participant 5 did not recognize that the Farlie-Grange 1 & 2 line outage was a harmful contingency. Participant 5 was aware that loss of the Farlie unit would be a harmful contingency.)
2. I looked at Oakdale to see where the flows were going. They were not going to Stanton. It was not going down toward Nestle. It was not going down to Moses. They were really running up to Oakdale. So the problem was my load at Oakdale. So that’s why I dropped load there. (Participant 5 scrolled around the System Map and traced theMW flows out of the Locher and Amus units.)
3. It was hard because you don’t know what it means. (Participant 5 explains that Tabular Contigency Analysis Program results were not clear).
4. I know from experience before on this thing that there is a weak loop from Farlie all the way up to Uxbridge – and I saw that we had pretty good megawatts coming across. (Participant 5 has prior knowledge of the PALCO system.)
5. Beaver through Nestle is a bad area. It is so far away from any generation. All the generation is down south. It can get pretty bad pretty fast. Especially with the Oakdale Crawford lines out that go directly north. (Participant 5 has prior knowledge of the PALCO system.)
6. I am thinking I can fix this but what if this. So I was thinking what if I lose Farlie but I do not have Grange on. If I have Grange on then I only have to boost these up a couple. So I am not depleted in the Farlie – Grange – Homer area. (Participant 5 puts the system in a much more secure position by just focusing on the Farlie unit outage.)
7. After I shed the load at Oakdale, I thought I probably should have waited because the system was not that bad. It is hard when you don’t know the system. (Participant 5 explains that shedding load was not required.)
8. You don’t know if I should do this now or if I will be in trouble. The bad thing with a simulator you know some thing is going to happen. (Participant 5 explains the extra level of tension and anticipation of trouble that exists when running the simulator).
9. Just to get the voltage back. In real life unless it is a dedicated load that you can drop off you are not going to drop off a load unless you absolutely have too. (Participant 5 explains that it easier to shed load with the simulator compared to the real system.)
10. Going through the simulator some-times you do it a little more premature. (Participant 5 explains that with the simulator you tend to anticipate the trouble that is going to occur.)
The most secure dispatch was implemented by P5, a control participant. The overloads for the Farlie-Grange 1 & 2 double circuit are shown in Figure 5-3.
23
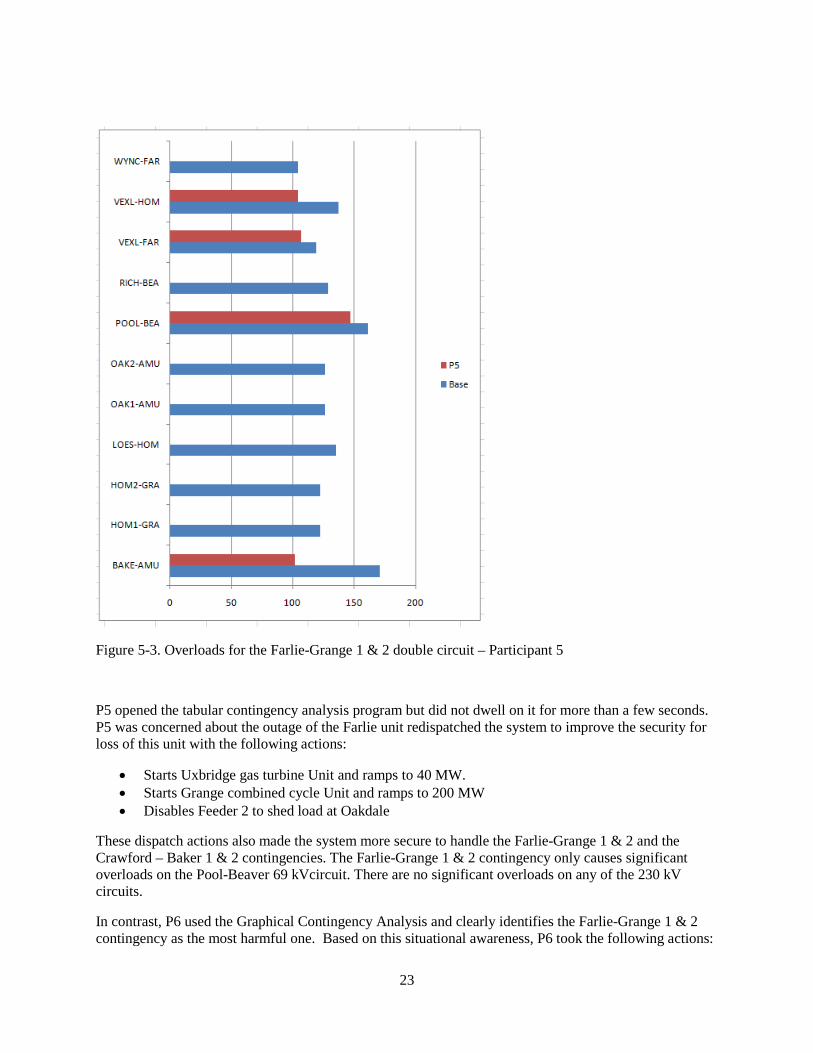
Figure 5-3. Overloads for the Farlie-Grange 1 & 2 double circuit – Participant 5
P5 opened the tabular contingency analysis program but did not dwell on it for more than a few seconds. P5 was concerned about the outage of the Farlie unit redispatched the system to improve the security for loss of this unit with the following actions:
• Starts Uxbridge gas turbine Unit and ramps to 40 MW. • Starts Grange combined cycle Unit and ramps to 200 MW • Disables Feeder 2 to shed load at Oakdale
These dispatch actions also made the system more secure to handle the Farlie-Grange 1 & 2 and the Crawford – Baker 1 & 2 contingencies. The Farlie-Grange 1 & 2 contingency only causes significant overloads on the Pool-Beaver 69 kVcircuit. There are no significant overloads on any of the 230 kV circuits.
In contrast, P6 used the Graphical Contingency Analysis and clearly identifies the Farlie-Grange 1 & 2 contingency as the most harmful one. Based on this situational awareness, P6 took the following actions:
24
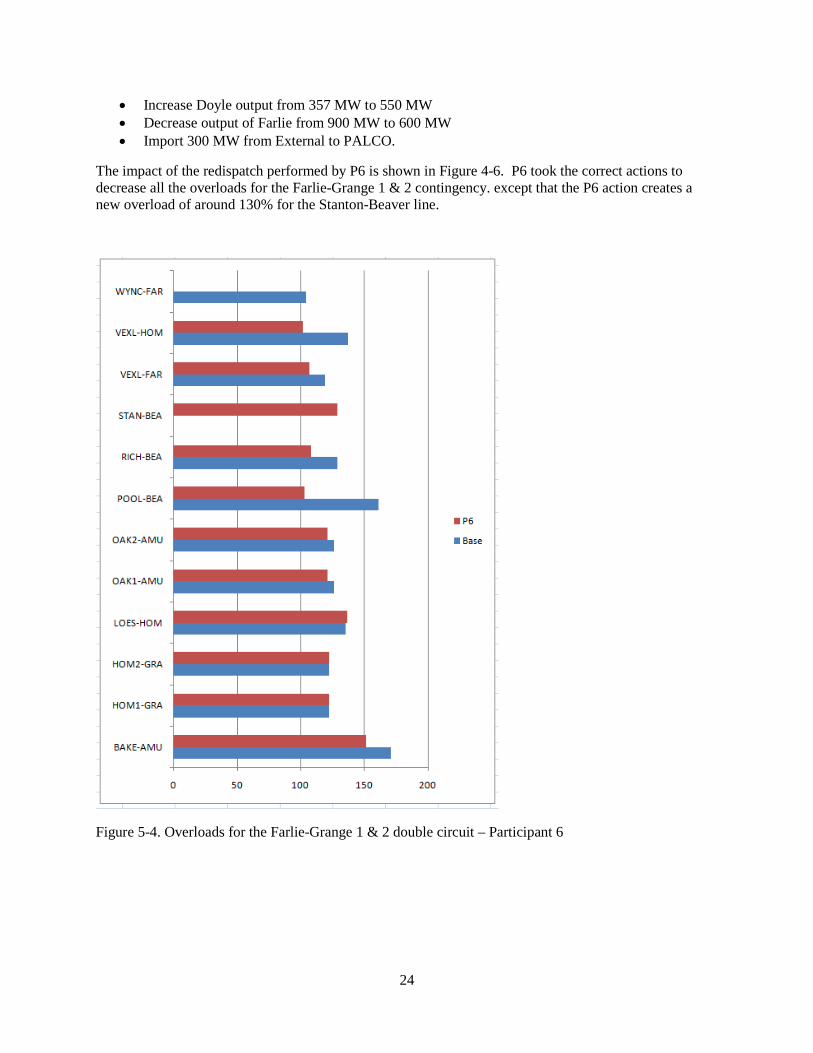
• Increase Doyle output from 357 MW to 550 MW • Decrease output of Farlie from 900 MW to 600 MW • Import 300 MW from External to PALCO.
The impact of the redispatch performed by P6 is shown in Figure 4-6. P6 took the correct actions to decrease all the overloads for the Farlie-Grange 1 & 2 contingency. except that the P6 action creates a new overload of around 130% for the Stanton-Beaver line.
Figure 5-4. Overloads for the Farlie-Grange 1 & 2 double circuit – Participant 6
25
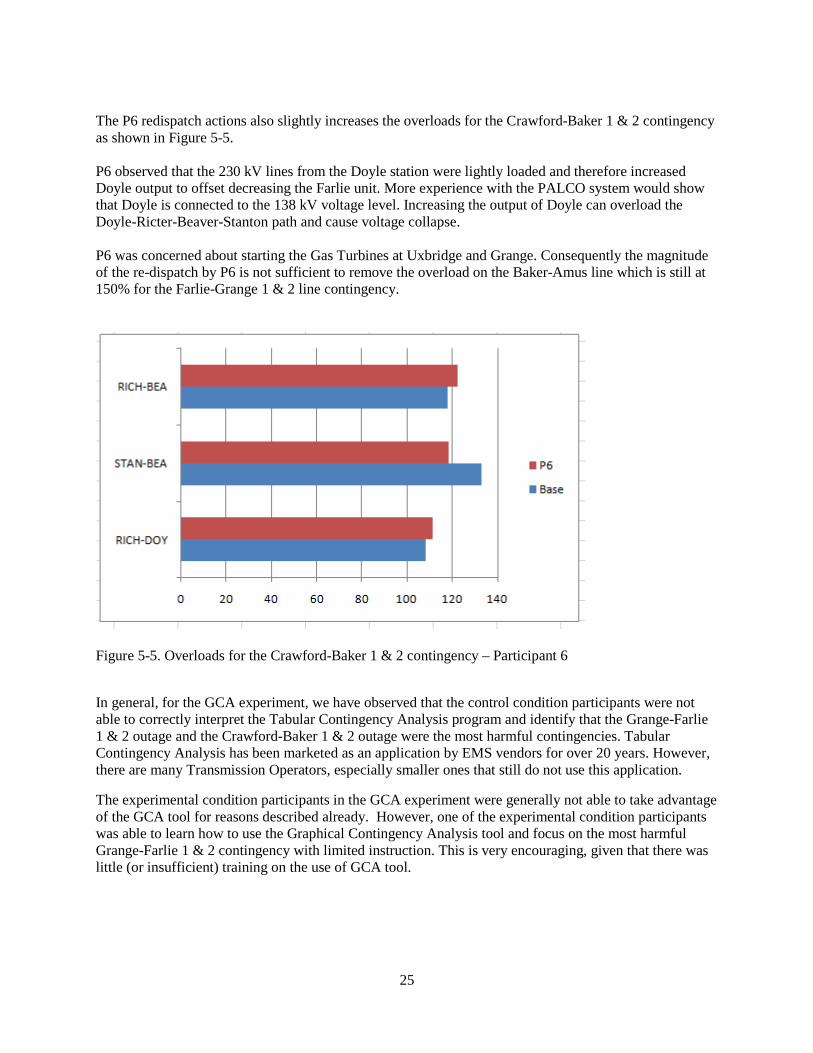
The P6 redispatch actions also slightly increases the overloads for the Crawford-Baker 1 & 2 contingency as shown in Figure 5-5. P6 observed that the 230 kV lines from the Doyle station were lightly loaded and therefore increased Doyle output to offset decreasing the Farlie unit. More experience with the PALCO system would show that Doyle is connected to the 138 kV voltage level. Increasing the output of Doyle can overload the Doyle-Ricter-Beaver-Stanton path and cause voltage collapse. P6 was concerned about starting the Gas Turbines at Uxbridge and Grange. Consequently the magnitude of the re-dispatch by P6 is not sufficient to remove the overload on the Baker-Amus line which is still at 150% for the Farlie-Grange 1 & 2 line contingency.
Figure 5-5. Overloads for the Crawford-Baker 1 & 2 contingency – Participant 6
In general, for the GCA experiment, we have observed that the control condition participants were not able to correctly interpret the Tabular Contingency Analysis program and identify that the Grange-Farlie 1 & 2 outage and the Crawford-Baker 1 & 2 outage were the most harmful contingencies. Tabular Contingency Analysis has been marketed as an application by EMS vendors for over 20 years. However, there are many Transmission Operators, especially smaller ones that still do not use this application.
The experimental condition participants in the GCA experiment were generally not able to take advantage of the GCA tool for reasons described already. However, one of the experimental condition participants was able to learn how to use the Graphical Contingency Analysis tool and focus on the most harmful Grange-Farlie 1 & 2 contingency with limited instruction. This is very encouraging, given that there was little (or insufficient) training on the use of GCA tool.
26
6. Conclusions and Recommendations
6.1 Summary of Findings This study examined the process of decision making by system operators of the electrical grid based on the Operator Decision Model. Operators were evaluated on the mental and computer models, mental and computer simulations, action plans and the overall performance in a simulation-based exercise. This section reviews the findings and discusses conclusions and recommendations that can be drawn based on the results.
Assessment of Observational Scoring Method
The data gathering techniques used in this study proved to be a valid method for applying cognitive task analysis to inform experimental/evaluation studies of electric power grid decision aids. The screen and video capture of the participants used in post-scenario reviews with the participants proved to be useful in verifying the thought processes of the operators while working on the scenarios. The SME’s who were used for rating performance were able to review the material off-site for a more thorough analysis. This method differs from current practice in human factors evaluations of situation awareness and operational decision making performance, which typically involves pausing a scenario to ask the decision maker questions directed at identifying whether or not certain cues or concepts have been apprehended (e.g., Endsley’s Situation Awareness Global Assessment Technique, or SAGAT). Our experimental assessment method has been shown to complement this practice by attempting to examine the operator’s use of requisite mental models and associated mediating variables by defining observable responses as proxies for these variables.
Impact of Phasor State Estimator Visualization
The results described in Section 5 showed that for the Phasor State Estimator experiment the median performance ratings were higher in the group that had the Phasor State Estimator tool than the group without the tool. Based on one raters’ assessment, these differences were significant for situation recognition and cue discovery. This means that the tool appeared to have had a positive effect on performance. As explained, these findings cannot be generalized to the whole population. Therefore it is advised to repeat this experiment with a larger sample to confirm the positive correlations between the different variables in the Operator Decision Model as well as the increase in performance.
The Mann-Whitney U Test showed no significant differences between the control group and the experimental group with regard to Overall Performance. As mentioned in the results section, this can partly be explained by the small amount of people included in this study which makes difficult to see significant results. Moreover, the lack of training in the tools can be explained as a reason for a non-significant difference between the two groups. If the participants had been trained in using the tools and interpreting their results, there might have been a significant difference between the two groups.
Impact of Graphical Contingency Analysis Visualization
For the Graphical Contingency Analysis Experiment, the median performance ratings were lower for the operators who used the GCA tool than for those without the tool. The differences, however, were not statistically significant. This might be explained by the lack of training that operators had with the GCA tool. Currently, most operators do not use or have access to Contingency Analysis tools; they do not know how to make use of the results of Contingency Analysis tools or how to work with the tool in ways that enhance their situation awareness and decision making. If operators are provided with more training, it may be anticipated that these limitations can be avoided and the expected positive effect of the GCA tool might be observed. The GCA tool did show a high correlation between the different variables of the
27
Operator Decision Model, which again suggests a strong relationship between the different factors involved in this model. A replication of this study is needed to enable a more robust test of the impact of the GCA tool on performance.
The GCA tool has potential to alleviate operator workload. To make the workload manageable, the system operator will usually select the most harmful contingency and develop control actions for this contingency. The system operator is able to use his / her pattern recognition abilities to determine the candidate list of control actions to improve the system security for a given contingency. However, it is difficult to assess which of these possible actions should be the most fruitful. To do this, the system operator needs to be able to quickly rerun the contingency analysis to see how his / her proposed control actions will affect the security of the system. It is difficult for the operator to select the amount of generation redispatch or the amount of load shed needed to make the system secure without program assistance. This step is best done iteratively, where the system operator guesses an amount, the contingency analyisis program is rerun, and based on the results the operator adjusts the amount. The system can support the operator by automating this process to indicate which of the possible control actions should be dismissed because they are likely to aggravate another contingency. To make this type of support most useful, it must be fast—the best way to dramtically improve the speed of contingency analysis is to implement the program on a parallel processor system.
6.2 Operator Feedback on the Visualization Tools Interviews with the participants revealed that operators like the ability afforded by the GCA tool to see which lines were overloaded. The perceived main benefit of the tool was easier and faster assessment of the state of the system. Some suggestions for improvement in the GCA tool include:
• Make voltage problems and line overloads appear in different colors. • Also display megawatts and powerflow direction. • The tool should not open up with all contingencies selected, but rather with only current conditions
displayed. • The tool should show different line colors for the different kV lines and it should show direction of
flow on lines. • A major improvement would be expected if rankings/priorities are shown with the contingencies; and
if the top five contingencies could be shown in a drop-down menu. Showing contingencies in ranked order will help the operator see the most critical contingencies on which to focus.
Interviews with the participants revealed that operators feel that the PSE tool helps to quickly see a line outage on the system and to determine a bad EMS indication. Some recommendations on how the tool could be improved include: • Incorporate a more salient alarm indication with audio and visual alarms. The alarm message should
give some more information about what the system found (some participants felt that the alarm message displayed was not totally clear).
• Show line loading and line phase angles on the display (or reveal following a click on the line).
6.3 Expert Operator Decision Model The results of this study prompted an evolution of the Expert Operator Decision Model. In the original model published by Greitzer, Podmore, Robinson and Ey (2009), the feedback loop to create the story consisted of:
Which you validate by mental simulations using mental models

28
The feedback loop to assess the Action Script consisted of:
Which you assess with mental simulaton using mental models
Based upon the results of this study, the Expert Operator Decision Model has been updated to add further emphasis to more integrated mental and computer models/simulations. Thus:
• The feedback loop to validate the story is extended…
Which you validate by mental and computer simulations using mental and computer models
• The feedback loop to assess the Action Script is extended…
Which you assess with mental and computer simulatons using mental and computer models.
This is a critical observation. The computer simulations must be performed in a tightly coupled loop with the operator’s mental simulations.
In a traditional EMS design, the contingency analysis program is considered to be part of the external environment—it runs at relatively slow time cycles of several minutes. This study suggests that development of the operator’s SA and assessment of the action scripts may be improved if the computer simulations and mental simulations can be peformed in a tightly coupled loop. With this tight coupling, the system operator’s strengths at pattern recognition are complemented with the computer’s strengths at numerical computations.
An implication of this observation is that the need for tight coupling requires that the contingency analysis program operate in near real time (response times of seconds and not minutes).
Contingency analysis programs generally do not store the full solution with all the bus voltages and angle and all the MW and MVAR flows for every contingency. This study has shown the importance of being able to view the flows on major interfaces as well as the changes in the flows on major interfaces. This is an example of the Contingency Analysis program being run in a tight loop with the system operator’s mental simulations.
6.4 Need for More Training on Contingency Analysis As we have noted, a possible reason for a lack of a positive effect of the GCA tool is insufficient training (another reason is insufficient sample size). More complete training on use of Tabular Contingency Analysis methods in general, and the Graphical Contingency Analysis in particular, should be provided to the participants in planned replication of the study. The participants in general had been accustomed to PALCO scenarios where they had to respond to events introduced by the instructor. In this case no new events were introduced once the 2:00 pm base case was started.
Training on Contingency Analysis and use of a Contingency Analysis program within the regular training courses that are given with the PALCO system will enhance these courses and make the simulations more realistic. Operators will be trained to use Contingency Analysis to make sure the system is secure for all N-1 and probable N-2 contingencies. Operators will learn to not react prematurely and shed load.
6.5 Limitations The conclusions that can be drawn based on the results have some limitations that have been noted throughout this report. One of the limitations is sample size. This study had only seven participants (in
29
both conditions combined), which is too small to provide a reasonable statistical power to detect experimental effects. With few participants, it is also more likely that outliers might skew the data. Replication of the experiment should use a larger sample size.
To create a realistic environment for the participants and to keep the benefit of having a controlled environment, the study was conducted in the EIOC at the facility of PNNL on the PowerSimulator. A limitation of this study was that not all the equipment available in the EIOC could be used for this study. The participants used laptops to operate the PowerSimulator which limited the participants from using multiple screens and a Mapboard. To create a more realistic environment, a more effective integration and utilization of EIOC displays (e.g.,the Mapboard and multiple screens) is needed.
The mindset of the participants was another limitation of this study. Participants are used to training on simulators that put them in a training mindset and not in a normal operating mindset. In most training scenarios, operators are exposed to extreme emergency situations in which the system will blackout or the reliability of the system will be gravely jeopardized. This study attempted to capture normal operating behavior and not emergency overload. It is likely that the training mindset caused the operators to take actions that in normal situations they might not have taken. For future studies it will be important to prepare the operators more by reinforcing more proactive strategies and actions that are desired in monitoring of normal operations.
The study can also benefit from providing more training on the tools used during the studies. The participants were not familiar enough with the PowerSimulator, the electrical system that was used, or the visualization tools developed by PNNL to be able to use the tools to their full capacity. By providing training on the tools, a better evaluation of the tools can be made. Some participants in this study showed some more trouble with the general concept behind the visualization tools, i.e. were not exposed to contingency analysis before in their career, which limited their understanding and therefore the usefulness of the tool for them. This may have contributed to the lack of positive results.
The duration of the scenarios was fairly short. A recommendation for future studies is to make the duration of the scenarios longer so the consequences of decision made can also be included in the scenario.
6.6 Recommendations • We have demonstrated a a performance evaluation method that complements current practice that
conducts post-scenario interviews, by analyzing and monitoring the operator’s use of requisite mental models and associated mediating variables. The results were limited partly because SMEs who rated performance may not have been sufficiently trained in recognizing when such mental models are invoked by experimental participants. It is recommended that future experiments both (a) provide more effective training/preparation for raters and (b) incorporate additional objective performance measures.
• Experiment results suggest that the Phasor State Estimator had a positive effect on situation recognition and cue discovery performance. Lack of strong statistical significance leads to the recommendation to repeat this experiment with a larger sample to confirm the positive correlations between the different variables in the Operator Decision Model as well as the suggested improvement in performance.
• For the Graphical Contingency Analysis Experiment, no significant effect of the GCA tool was obtained. We interpreted this in terms of a lack of training and incompatible mindset of operators who encounter contingency analysis problems in a training situation. A replication of this study is
30
needed, with a proper focus on training, to enable a more robust test of the impact of the GCA tool on performance.
• The GCA tool has potential to alleviate operator workload by automating the action alternative analysis process to indicate which of many possible control actions should be most effective. To be most useful, this automated support must be fast—the best way to dramtically improve the speed of contingency analysis is to implement the program on a parallel processor system.
• Specific recommendations for improving the GCA tool include: o Make voltage problems and line overloads appear in different colors. o Display megawatts and powerflow direction. o The tool should not open up with all contingencies selected, but rather with only current
conditions displayed. o The tool should show different line colors for the different kV lines and it should show
direction of flow on lines. o Show rankings/priorities with the contingencies to help the operator see the most critical
contingencies on which to focus.
• Specific recommendations for improving the PSE tool include: o Incorporate a more salient alarm indication with audio and visual alarms. o Show line loading and line phase angles on the display.
• There is a need for tight coupling of the contingency analysis program with the operator’s mental
model/mental simulation process that requires the program to operate in near real time (response times of seconds and not minutes). It is important to view the flows on major interfaces as well as the changes in the flows on major interfaces, and the possible effects of actions that have been taken, with sufficient time to take corrective actions before deleterious effects occur or time runs out (leading to financial sanctions).
• The study brought to light a need for operators to receive effective training on Contingency Analysis and use of a Contingency Analysis program within the regular training courses. Such training topics are currently lacking; including this training in operator will enhance these courses and better prepare operators to not react prematurely by shedding load, and to more effectively deal with N-1 and probable N-2 contingencies.
• The experiment should be replicated. Recommended improvements in the experimental methodology include:
o Replication of the experiment should use a larger sample size. o Replication of the experiment should utilize a more effective integration and utilization of
EIOC displays (e.g.,the Mapboard and multiple screens) to create a more realistic environment.
o Replication of the experiment should put more priority on appropriate training prior to experimental manipulations to help participants acquire a proper mindset in adopting more proactive strategies relevant to normal operating conditions.
o Replication of the study should include more training on the tools used during the studies. o Replication of the study should utilize scenarios with longer durations so the consequences of
decision can also be included in the scenario.
31
7. References
Campbell, D. T., & Stanley, J. C. (1966). Experimental and quasi-experimental designs for research. Chicago: Rand McNally.
Cohen, M. S., Freeman, J. T. & Thompson, B. B. (1997). Training the Naturalistic Decision Maker (Chapter 25), in C.E. Zsambok & G. Klein (eds.), Naturalistic Decision Making. Mahwah, NJ: Lawrence Erlbaum Associates.
Endsley, M. R. (1995). Measurement of situation awareness in dynamic systems. Human Factors, 37, 32-64.
Endsley, M. R. (1997). The role of situation awareness in naturalistic decision making (Chapter 26), in C.E. Zsambok & G. Klein (eds.), Naturalistic Decision Making. Mahwah, NJ: Lawrence Erlbaum Associates.
Greitzer, F. L., Dauenhauer, P., Wierks, T. D. G., & Podmore, R. (2009). Human Factors Evaluation of Advanced Electric Power Grid Visualization Tools. Technical Report PNNL-18386 . Richland, WA: Pacific Northwest National Laboratory.
Greitzer, F. L., Podmore, R., Robinson, M., & Ey, P. (2009). Naturalistic Decision Making for Power System Operators. Paper presented to the Ninth Annual Naturalistic Decision Making Conference, London, England. Also to be published in the International Journal of Human-Computer Interaction (in press).
Greitzer, F. L., Schur, A., Paget, M., & Guttromson, R. T. (2008). A sensemaking perspective on situation awareness in power grid operations. Proceedings, IEEE Power & Energy Society Annual Meeting, 20-24 July 2008, Pittsburgh, PA. PNNL-SA-58145
Klein, G. A. (1993). A Recognition Primed Decision (RPD) Model of Rapid Decision Making. In G.A. Klein, J. Orasanu, R. Calderwood & C.E. Zsambok (eds.), Decision Making in Action: Models and Methods. Norwood, NJ: Ablex Publishing.
Pallant, J. (2001). SPSS Survival Manual. Chicago, IL: Open University Press
Weick, K. E. (1995), Sensemaking in organizations. Thousand Oaks, CA: Sage Publications.
Wuensch, K.L. (2007). Inter-Rater Agreement. Wuensch’s Statistics Lessons (retrieved from http://core.ecu.edu/psyc/wuenschk/StatsLessons.htm on Dec., 09), East Carolina University Department of Psychology, Greenville, NC.
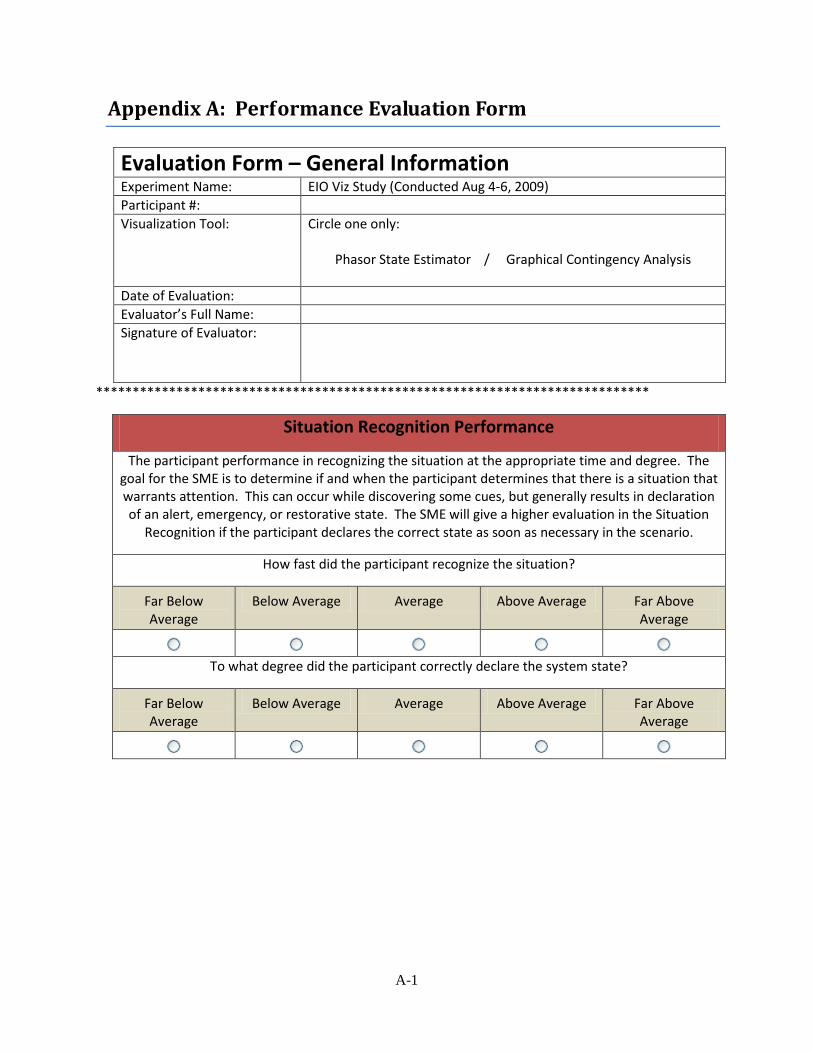
A-1
Appendix A: Performance Evaluation Form
Evaluation Form – General Information Experiment Name: EIO Viz Study (Conducted Aug 4-6, 2009) Participant #: Visualization Tool: Circle one only:
Phasor State Estimator / Graphical Contingency Analysis
Date of Evaluation: Evaluator’s Full Name: Signature of Evaluator:
****************************************************************************
Situation Recognition Performance
The participant performance in recognizing the situation at the appropriate time and degree. The goal for the SME is to determine if and when the participant determines that there is a situation that warrants attention. This can occur while discovering some cues, but generally results in declaration of an alert, emergency, or restorative state. The SME will give a higher evaluation in the Situation
Recognition if the participant declares the correct state as soon as necessary in the scenario.
How fast did the participant recognize the situation?
Far Below Average
Below Average Average Above Average Far Above Average
To what degree did the participant correctly declare the system state?
Far Below Average
Below Average Average Above Average Far Above Average
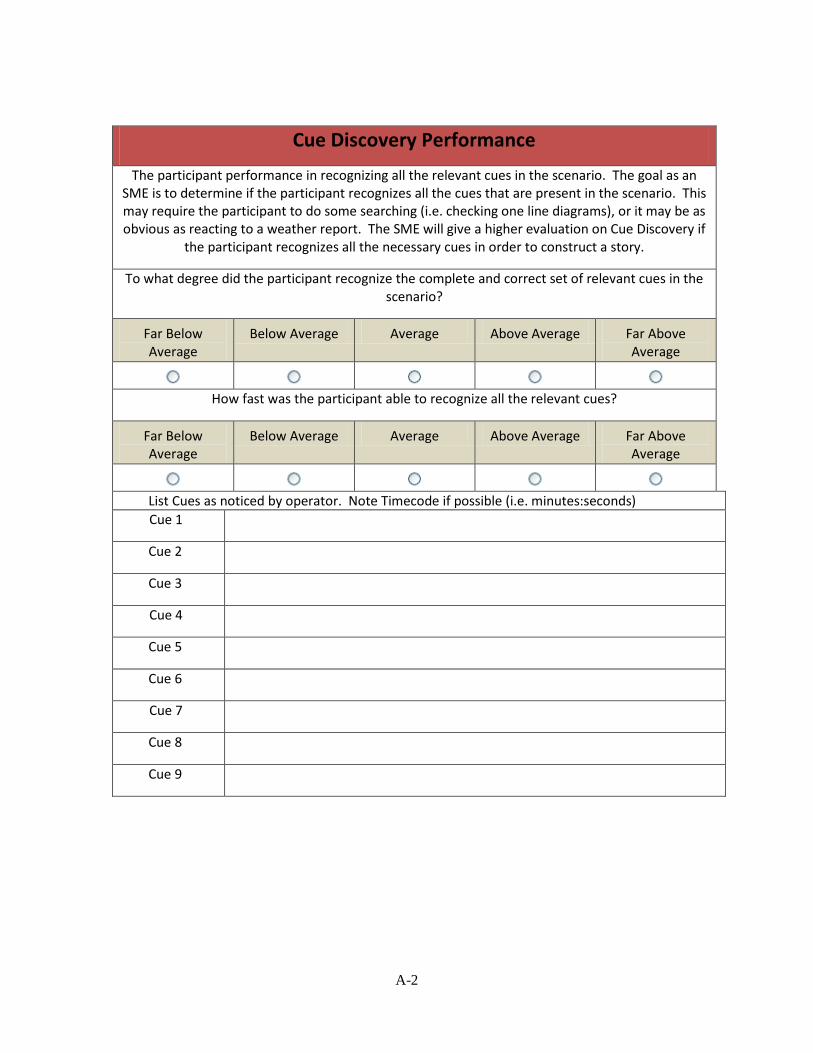
A-2
Cue Discovery Performance
The participant performance in recognizing all the relevant cues in the scenario. The goal as an SME is to determine if the participant recognizes all the cues that are present in the scenario. This may require the participant to do some searching (i.e. checking one line diagrams), or it may be as obvious as reacting to a weather report. The SME will give a higher evaluation on Cue Discovery if
the participant recognizes all the necessary cues in order to construct a story.
To what degree did the participant recognize the complete and correct set of relevant cues in the scenario?
Far Below Average
Below Average Average Above Average Far Above Average
How fast was the participant able to recognize all the relevant cues?
Far Below Average
Below Average Average Above Average Far Above Average
List Cues as noticed by operator. Note Timecode if possible (i.e. minutes:seconds)
Cue 1
Cue 2
Cue 3
Cue 4
Cue 5
Cue 6
Cue 7
Cue 8
Cue 9

A-3
More
(list as many as necessary)
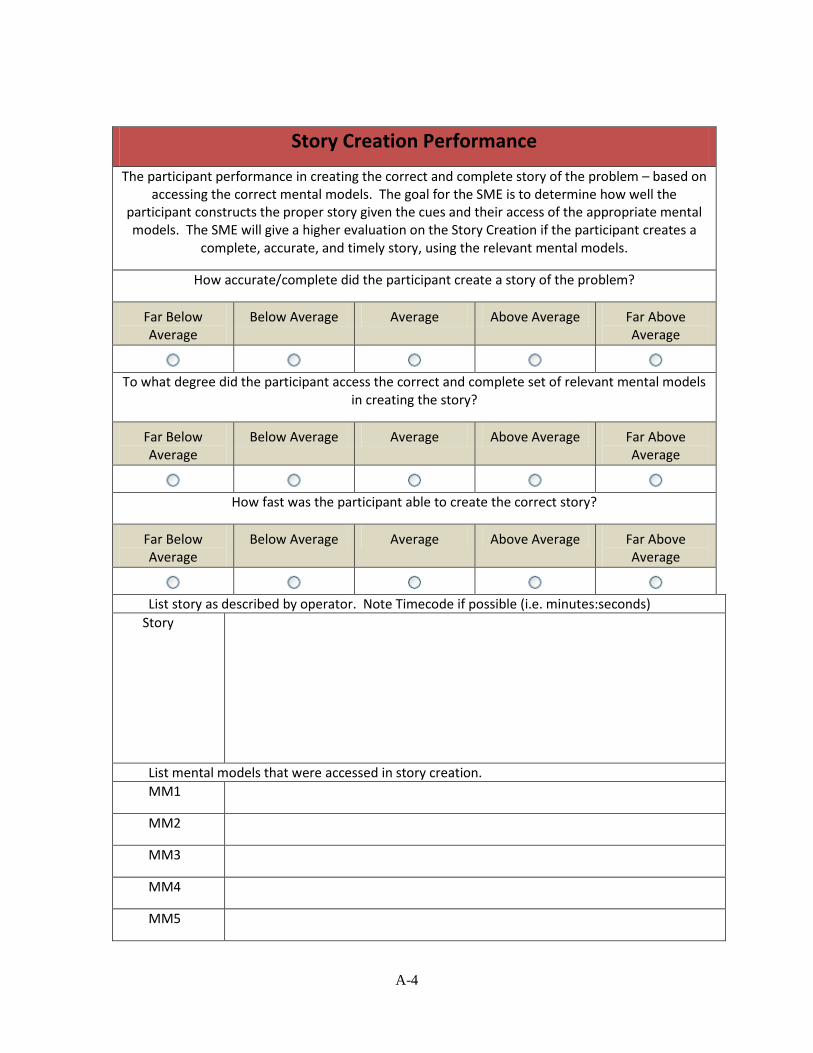
A-4
Story Creation Performance
The participant performance in creating the correct and complete story of the problem – based on accessing the correct mental models. The goal for the SME is to determine how well the
participant constructs the proper story given the cues and their access of the appropriate mental models. The SME will give a higher evaluation on the Story Creation if the participant creates a
complete, accurate, and timely story, using the relevant mental models.
How accurate/complete did the participant create a story of the problem?
Far Below Average
Below Average Average Above Average Far Above Average
To what degree did the participant access the correct and complete set of relevant mental models
in creating the story?
Far Below Average
Below Average Average Above Average Far Above Average
How fast was the participant able to create the correct story?
Far Below Average
Below Average Average Above Average Far Above Average
List story as described by operator. Note Timecode if possible (i.e. minutes:seconds)
Story
List mental models that were accessed in story creation. MM1
MM2
MM3
MM4
MM5
A-5
MM6
MM7
MM8
MM9
More
(list as many as necessary)
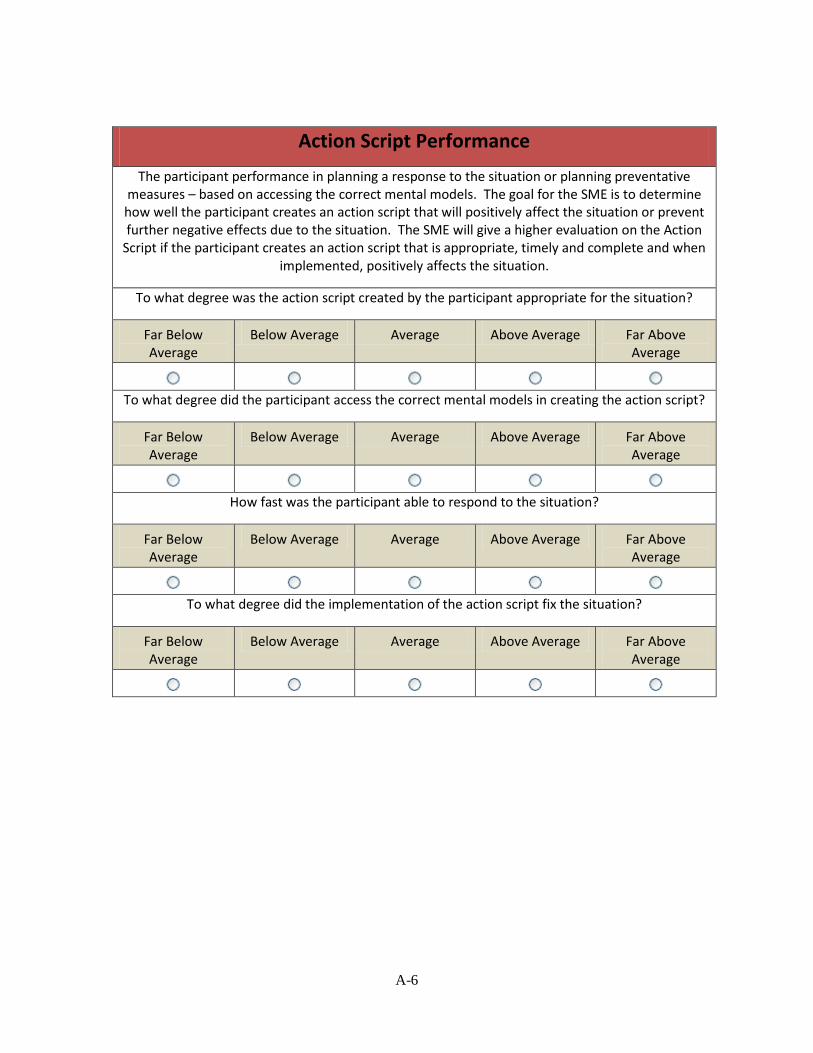
A-6
Action Script Performance
The participant performance in planning a response to the situation or planning preventative measures – based on accessing the correct mental models. The goal for the SME is to determine how well the participant creates an action script that will positively affect the situation or prevent further negative effects due to the situation. The SME will give a higher evaluation on the Action
Script if the participant creates an action script that is appropriate, timely and complete and when implemented, positively affects the situation.
To what degree was the action script created by the participant appropriate for the situation?
Far Below Average
Below Average Average Above Average Far Above Average
To what degree did the participant access the correct mental models in creating the action script?
Far Below Average
Below Average Average Above Average Far Above Average
How fast was the participant able to respond to the situation?
Far Below Average
Below Average Average Above Average Far Above Average
To what degree did the implementation of the action script fix the situation?
Far Below Average
Below Average Average Above Average Far Above Average
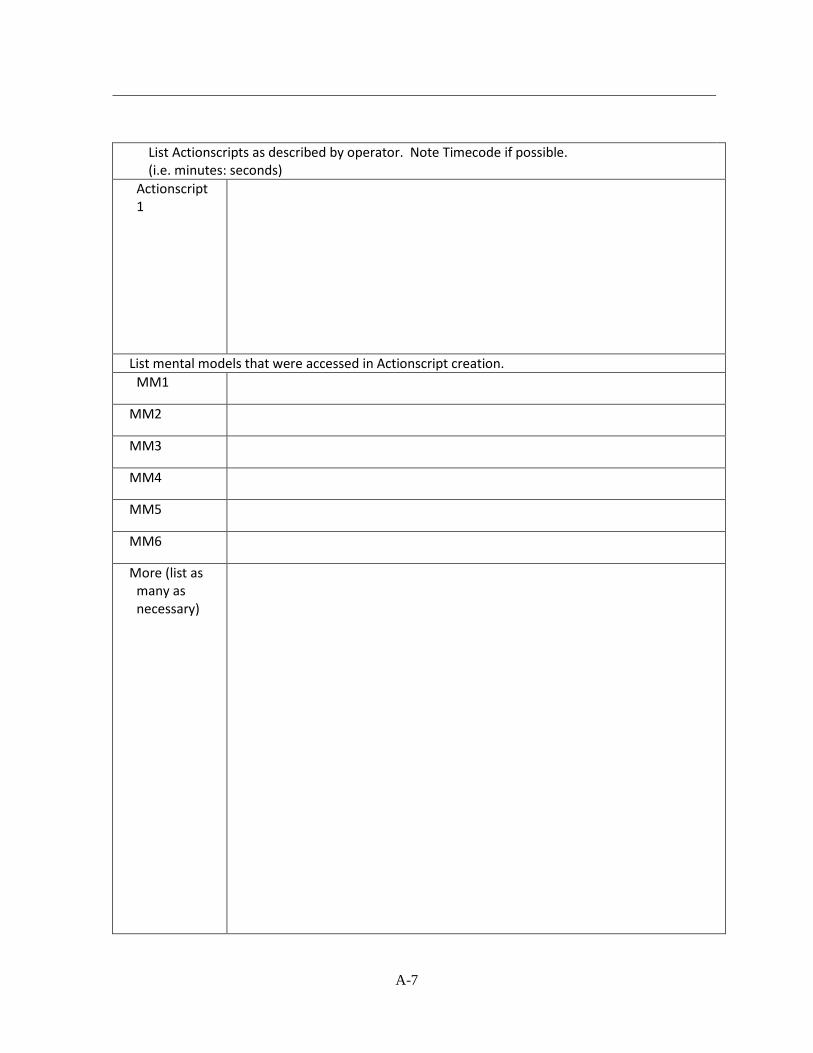
A-7
List Actionscripts as described by operator. Note Timecode if possible. (i.e. minutes: seconds)
Actionscript 1
List mental models that were accessed in Actionscript creation. MM1
MM2
MM3
MM4
MM5
MM6
More (list as many as necessary)
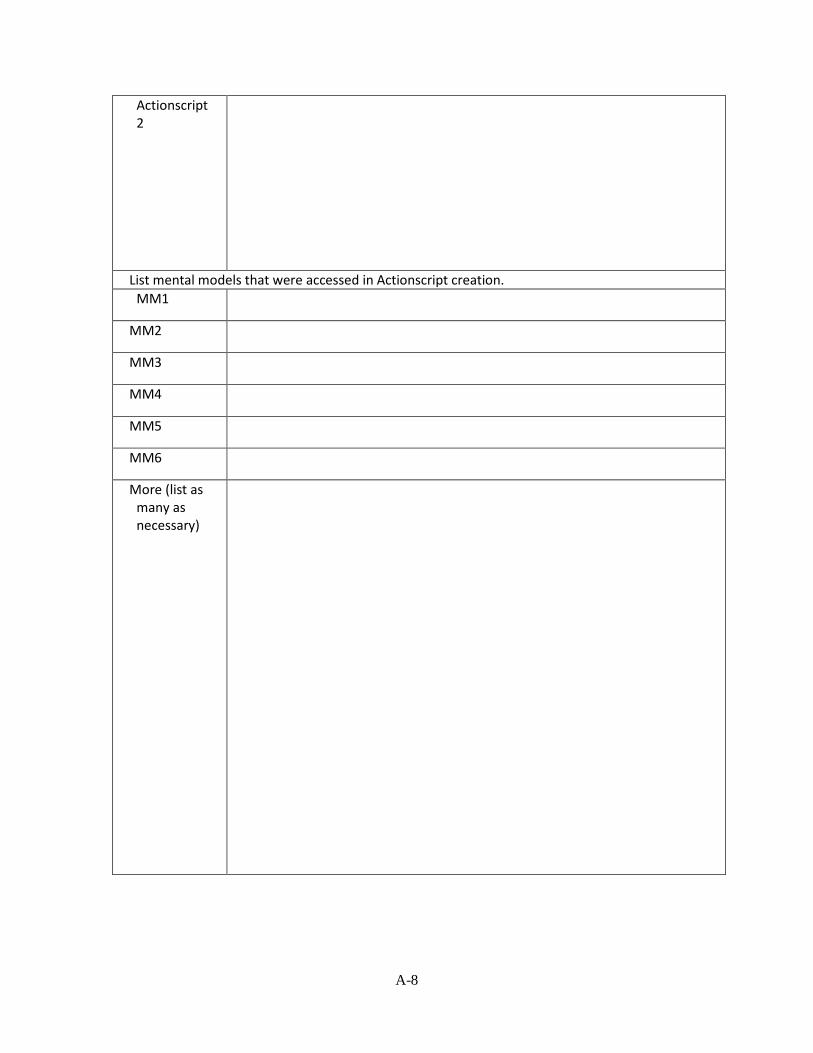
A-8
Actionscript 2
List mental models that were accessed in Actionscript creation. MM1
MM2
MM3
MM4
MM5
MM6
More (list as many as necessary)
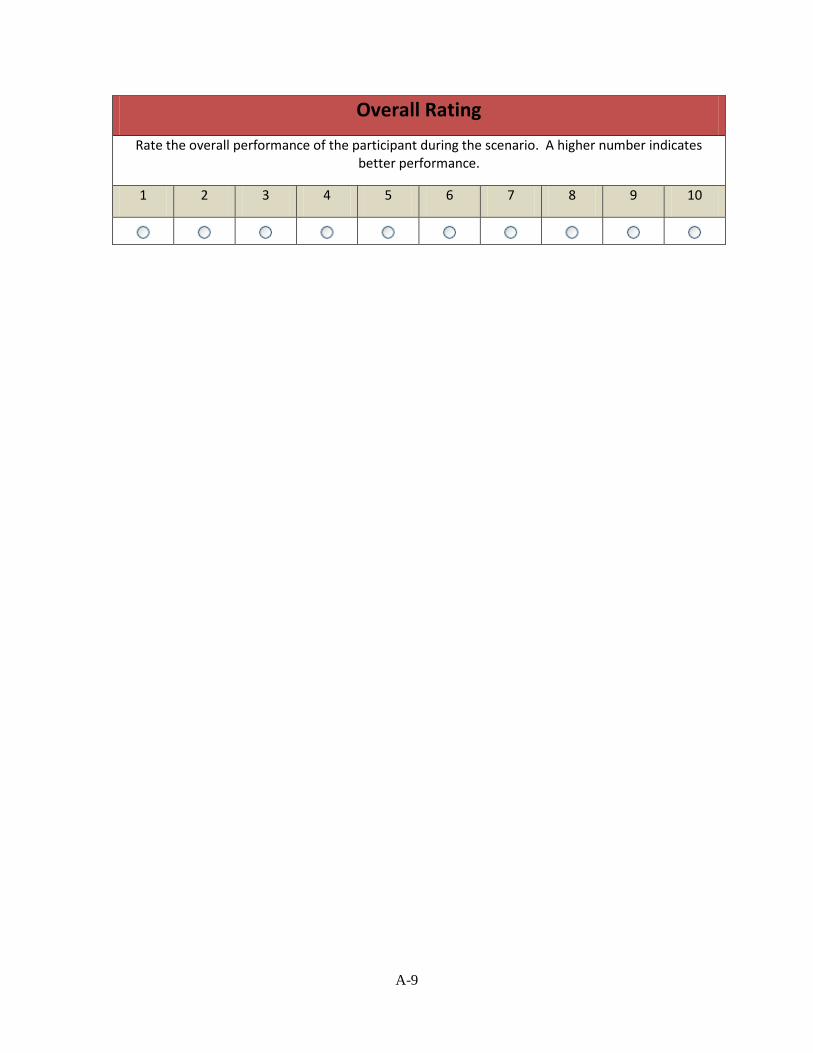
A-9
Overall Rating
Rate the overall performance of the participant during the scenario. A higher number indicates better performance.
1 2 3 4 5 6 7 8 9 10