Embed Size (px)
Citation preview

IEEWACM TRANSACTIONS ON NETWORKING, VOL. I , NO. 2. APRIL 1993 199
Experimental Evaluation of SUNOS IPC and TCP/IP Protocol Implementation
Christos Papadopoulos, Senior Member, IEEE, and Gurudatta M. Parulkar, Member, IEEE
Abstract-Progress in the field of high-speed networking and distributed applications has lead to a debate in the research community on the suitability of existing protocols such as TCP/IP for emerging applications over high-speed networks. Protocols have to operate in a complex environment comprised of various operating systems, host architectures, and a rapidly growing and evolving internet of several heterogeneous subnetworks. Thus, evaluation of protocols is definitely a challenging task that can- not be achieved by studying protocols in isolation. This paper presents results of a study which attempts to characterize the performance of SunOS Inter-Process Communication (IPC) and TCPDP protocol implementation for distributed high-bandwidth applications. Components studied include queueing in different layers, protocol control mechanisms (such as flow and error con- trol), per-packet processing, buffer requirements, and interaction with the operating system.
I. INTRODUCTION
ONSIDERABLE research and development efforts are C being spent in the design and deployment of high- speednetworks. Many of these efforts suggest that networks supporting data rates of hundreds of Mb/s will become avail- able soon [ 5 ] . Target applications for these networks in- clude distributed computing involving remote visualization, collaborative multimedia, medical imaging, teleconferencing, and video distribution. Progress in high-speed networking suggests that raw data rates will be available to support such applications. However, these applications require not only high-speed networks but also carefully engineered end-to-end protocols implemented efficiently within the constraints of various operating systems and host architectures. There has been considerable debate in the research community regarding suitability of existing protocols such as TCP/IP [3], [ 1 11, [ 121 for emerging applications over high-speed networks. Some researchers believe that existing protocols such as TCP/IP are suitable and can be adopted for use in high-speed environments [4], 191. Others claim that these protocols are complex and their control mechanisms are not suitable for high-speed networks and applications [l], [2], [15], [16]. It is important, however, to note that both groups agree that appropriate operating
Manuscript received July 9, 1992; revised January 1993; approved by IEEWACM TRANSACTIONS ON NETWORKING Editor Larry Peterson. This work was supported in part by the National Science Foundation and an industrial consortium of Bellcore, BNR, DEC, Italtel SIT, NEC, NTT, and SynOptics. This work was presented in part at IEEE INFOCOM '93, San Francisco, CA.
The authors are with the Computer and Communications Research Cen- ter, Department of Computer Science, Washington University, St. Louis, MO 63130-4899. (email: [email protected])(email: gury@flora. wustl.edu)
IEEE Log Number 9208273.
system support and efficient protocol implementation are es- sential to support high-bandwidth applications on high-speed networks.
Inter-Process Communication (IPC), which includes proto- cols, is quite complex. The underlying communication sub- strate, for example, is a constantly evolving internet of many heterogeneous networks with varying capabilities and per- formance. Moreover, protocols often interact with operating systems which are also complex and have additional inter- acting components such as memory management, interrupt processing, process scheduling, and others. Furthermore, the performance of protocol implementations may be affected by the underlying host architecture. Thus, evaluation of IPC models and protocols such as TCPDP is definitely a chal- lenging task and cannot be achieved by studying protocols in isolation.
This paper presents the results of a study aimed at character- izing the performance of TCP/IP protocols in the existing IPC implementation in SunOS for high-bandwidth applications. Components to be studied include the control mechanisms (such as flow and error control), per-packet processing, buffer requirements, and interaction with the operating system by systematic measurement. Two important reasons for using measurement to evaluate the performance of a complex system such as IPC in Unix are: 1) it allows the direct examination of the real system instead of a model; and 2 ) it can assess the performance of the system with all pieces in place and fully functional, thus revealing unexpected interactions (if any) that may not be observed by studying the components (or component models) individually.
The software examined is the SunOS 4.0.3' IPC using BSD stream sockets on top of TCP/IP. The hardware consisted of two Sun Sparcstation 1 workstations connected on the same Ethernet segment via the AMD Am7990 LANCE Ethernet Controller. Occasionally, two Sparcstation 2 workstations run- ning SunOS 4.1 were also used in the experiments. However, only SunOS 4.0.3 IPC could be studied in depth due to the lack of source code for SunOS 4.1.
The paper is organized as follows. Section I1 presents an overview of the IPC implementation in the Unix kernel. Section 111 describes two tools traditionally used for protocol evaluation and then presents a new tool used for many of the measurements reported in this paper. Section IV presents a series of experiments and measurements. Finally, Section V summarizes the conclusions of this paper.
' SunOS 4.0.3 is based on 4.3 BSD Unix. See [ 131 for further details.
10634692/93$03.00 0 1993 IEEE
T

200 IEEUACM TRANSACTIONS ON NETWORKING, VOL. 1, NO. 2, APRIL 1993
Socket Layer
Network Layer
Fig. I . Interprocess communication (IK) layering.
11. UNIX KERNEL BACKGROUND This section presents a brief overview of the IPC implemen-
tation in SunOS 4.0.3. The description focuses on the internal structure and organization of IPC and the underlying protocols. The overview is necessary in order to understand the operation of protocols, their interaction with the operating system, and identify the various queueing points during data transfer.
A. The Inter-Process Communication (IPC) Layers
IPC is organized in three layers, as shown in Fig. 1. The first layer is the socket layer, which is the 1PC interface to applications. The main functions of the socket layer are: 1) to identify different applications on the same host; and 2 ) to provide send and receive buffers for data transfer. The socket interface provides sockets, which are abstract objects that the applications can create, connect, and use for sending or receiving data. Sockets appear as file descriptors to the application, thus the usual system calls manipulating file descriptors were extended to operate on sockets. The sockets are typed, with each type providing different communication semantics. For example, a STREAM socket provides a reliable connection-based byte stream which may support out-of-band data, and a DATAGRAM socket provides connectionless and unreliable packet- oriented communication.
The protocol layer is composed of protocol families. A protocol family is a group of protocols belonging to the same domain. Each domain has its own addressing scheme. The pro- tocols in each family implement the various socket semantics. For example, the Internet family of protocols forms the Internet domain, whose main protocols are TCP, UDP, and IP.2 Other domains, like Xerox NS and DECNET domains, provide their own protocols which may be functionally equivalent but not compatible with the Internet domain protocols. Depending on requirements, the application can select the protocol it wishes to use from a family (domain) of protocols when creating a socket, or leave the choice to the socket layer which will
21P, however, is not accessed directly by the socket layer but through TCP and UDP, which use IP for Fending packets,
I m-dat (1 12 bytes) 112 Bytes for data I I Fig. 2. The MBUF data structure.
choose an appropriate protocol that implements the requested socket semantics.
The third IPC layer is tb- network interface layer, which sits directly on top of the hardware. It is composed of hardware device drivers and their interfaces (for example, the Ethernet driver and card). A host may be connected to more than one network and, thus, have more than one interface, as in the case of a gateway. The protocols choose a network interface to output packets as part of their routing decision.
To summarize, the Unix IPC facilities are implemented in three layers: 1 ) the socket layer, which manipulates endpoints that provide certain types of service; 2 ) the protocol layer, which consists of the protocols that implement those services; and 3) the network layer, which is a collection of interfaces to the networks which the host is attached to. When a socket is created, it is bound to a protocol appropriate to the socket semantics, and the protocol chooses an interface to send data. An example of configuration is the application creating a reliable (stream) socket in the Internet domain, the socket layer selecting the TCP/IP protocol stack, and packets routed over the local Ethernet interface.
B. IPC Memop Management: MBUF'S
Interprocess communication and network protocols impose special requirements on the memory management system.

PAPADOPOULOS AND PARULKAR: EXPERIMENTAL EVALUATION OF SUNOS IPC AND TCPAP PROTOCOL IMPLEMENTATION 20 1
APPLICATION SPACE
KERNEL SPACE
- ETHERNET
Fig. 3 . Function call sequence
The system must be capable of handling efficiently both fixed and variable size memory blocks. Fixed size memory is needed for data structures like control blocks, and variable size memory for storing packets. Efficient allocation and deallocation of such memory blocks is essential since these operations occur very frequently (at least once for every packet). These requirements motivated the developers of BSD 4.3 to create a new memory management scheme based on data structures called MBUF’s (Memory BUFfers).
The main components of MBUF memory management are the MBUF data structure, the MBUF memory, and a collection
of supporting routines that manipulate the MBUF memory. The memory is allocated during system initialization and is part of the kernel memory permanently reserved for MBUF’s. MBUF’s always reside in physical memory (i.e., they are never paged out). The structure of an MBUF is shown in Fig. 2. MBUF’s are 128 bytes long, out of which up to 112 bytes can be used for storing data. The remaining 16 bytes contain control fields which are used to manipulate both the MBUF’s and the data. These are called small (orplain) MBUF’s because the amount of data stored internally is limited to 112 bytes. When more space is required, an external page from a page

202 IEEWACM TRANSACTIONS ON NETWORKING, VOL. I , NO. 2, APRIL 1993
Application Buffer I r l Socket Queue
Logical copy* ___I)_
template
Network Queue Cluster mbuf containing data
Page containing data
Mbuf containing header Physical copy -. 4 Ethernet
*Physical copy ifplain mb@s are used
Fig. 4. Data distribution into (cluster) MBUFs.
pool (which is part of the MBUF memory) can be attached to a plain MBUF to form a cluster MBUF. These pages can store up to 1024 bytes. Data of a cluster MBUF is stored exclusively in the external page, never in the internal space ( I 12 bytes) of the MBUF. This facilitates an important optimization for copying: the data part of a cluster MBUF is never physically copied, rather each page is associated with a reference counter which keeps track of page usage. The page is free when the counter reaches zero. This optimization is not available for plain MBUF’s.
SunOS provides yet another type of MBUF which is not part of BSD Unix. These are similar to cluster MBUF’s, except that data is stored in an external buffer which is not a part of the MBUF memory. A program wishing to allocate such an MBUF must provide the external buffer and a pointer to a function to be used when deallocating this MBUF. This type of MBUF is used by the Ethernet interface driver to facilitate MBUF “loaning,” where an MBUF owned by the driver is loaned temporarily to higher-level protocol functions. The advantage of loaning is that it avoids data copy from the memory of the interface to MBUF space.
C. IPC Function Calls for Data Exchange
Several kernel functions are invoked for data exchange. Fig. 3 shows these functions in the order in which they get invoked. Also shown is each function’s location with regard to layering. Note that the arrows imply the sequence of the function invocation, not the data flow. The data flow is implied by the system call called at the application level on each side: write () sends the data, and read () receives it.
D. Queueing Model
Fig. 4 shows the data movement at the sending side.
Initially, data resides in the application space in a contiguous buffer. After a send request, data is copied (and, therefore, fragmented) into MBUF’s in kernel space, which are queued at the socket buffer. Protocols remove or copy3 MBUF’s from the socket queue and add headers to form packets, which are placed in the network queue.
Packets are queued at the network interface until the driver is able to transmit them. On the receiving side, packets are received by the network interface and placed in one or more MBUF’s. After the Ethernet header is stripped, the remaining packet is appended to the protocol receive queue (the IP queue, for example) and the protocol is notified via a software interrupt. After processing the packets, the protocol passes them to higher-layer protocols (TCP, for example). The top- layer protocol, after processing, appends the packets to the receive socket queue and wakes up the application’s read call if it is sleeping in the kernel. The call completes by copying data from MBUF’s to the application’s address space and returns. Thus, there are four queueing points in IPC as depicted in Fig. 5.
111. TOOLS FOR MEASURING IPc PERFORMANCE
This section first examines two well-known public domain tools used for IPC measurements, namely TCPDUMP and NETMON. It is argued that although these tools are very useful for their intended applications, they are not suitable for investigating the internals of IPC. The discussion is followed by the presentation of a new tool specifically developed for evaluating IPC.
‘MBUF’S are copied when data must be kept until acknowledged, as in the case of reliable transmission. However, for cluster MBUFs data copy is a logical copy.

PAPADOPOULOS AND PARULKAR: EXPERIMENTAL EVALUATION OF SUNOS IPC AND TCPnP PROTOCOL IMPLEMENTATION 203
aCknOWledgmenU 4 , data
I I
Socket Layer && = Socket Queue && TCPiIP Layer
Network Layer
I Ethernet
Fig. 5 . IPC queueing model
I I I m l
+I+ Host running Tcpdump
Fig. 6. Capturing packets with TCPDUMP.
A. TCPDUMP
TCPDUMP is a network monitoring tool that captures packet headers from the Ethernet. To avoid interference, the tool usually runs on a machine not involved in the monitored communication. The captured headers are filtered to display those of interest to the user; if desired, the packet traffic can be displayed unfiltered to monitor all activity on the network. TCPDUMP prints information extracted from the header of each packet and a timestamp. A typical TCPDUMP configuration is shown in Fig. 6.
TCPDUMP has two important advantages: 1 ) it does not interfere with communications since it runs on a separate machine; and 2) it does not require any changes to the kernels of the machines involved (some minor changes may be required to the kernel of the machine running TCPDUMP). The headers are dumped either in a file or on the screen. A sample trace generated by TCPDUMP is shown in Fig. 7.
Our experience’ has shown that, to obtain accurate time - stamps, the third machine must be at least as fast as the machines being monitored. Packet traces created by TCP- DUMP are very useful in examining protocol-to-protocol communication in order to detect any aberrations. The trace can be used to generate a graph to visualize packet activity on the network. However, no information about the internals of the IPC mechanism can be extracted from such traces. TCPDUMP presents only an external view of the commu- nication, which may be skewed by the underlying network,
4TCPDUMP was developed at Lawrence Berkeley Laboratory by V. Jacobson, S. McCanne, and G. Leres. It was inspired by Sun’s Etherfind.
and thus cannot provide information about the internal queues. For example, it is not clear whether the rate packets appearing on the network are determined by the speed of the hardware interface or of the protocol. In addition, although the time the acknowledgments reached the network can be observed, no information is available about when they were actually generated by the protoc01.~ Such information is necessary when evaluating the performance of the IPC implementation.
B. NETMON
NETMON6 is a tool running under Unix BSD 4.3 that records network protocol information for monitoring and/or analysis. NETMON employs probes in the kernel code to record information in memory about network protocol activity that a user process subsequently retrieves into a file. However, NETMON monitors only IP level and network interface queue information. No probes monitoring higher layers are available. A Netmon example output is shown in Fig. 7.
Netmon is very useful for providing information on network protocol activity. It can also be used to monitor gateway activity. Since its emphasis is on the network layer, it does not provide any information on the activity of higher layers like the socket layer. Moreover, it was designed to retrieve protocol information which is not relevant to IPC evaluation, thus incurring unnecessary overhead.
C. A New Probing Tool Tools like TCPDUMP and NETMON focus on monitoring
some specific layers of communication and, therefore, do not emphasize monitoring the mechanism as a whole. A tool that monitors all communication layers at the same time will provide more insight into the internals of IPC. Moreover, such a tool can be used to investigate the interaction among the different components and highlight aspects that are invisible when examining the components individually.
This section presents a tool, developed specifically to moni- tor the internals of IPC, which is based on probes. Others have used similar mechanisms to monitor different aspects of TCP [6]. A probe is a small segment of code placed strategically in the kernel code to record information during the execution of IPC. The probes are supplemented by data structures and routines that manipulate the recorded information. In the following description, each probe’s location is identified and the information retrieved is described. Then, the issue of minimizing probe overhead is discussed, followed by a description of how probes are activated. Finally, the internal structure of the probes is presented.
I ) Probe Location: Two probes are associated with each IPC queue (see Section 11): one monitoring data appended to the queue and another monitoring data removed from the queue. The selected probe locations are depicted in Fig. 8. Each probe when activated records a timestamp, the amount of
5 1 t is possible that there may be a difference between the time an acknowledgment was generated and the time it appeared on the wire. The LANCE chip, for example, will delay transmission of packets if it is receiving back-to-back packets from the network.
6Developed by A. Mankin of MITRE Corp.

204 IEEWACM TRANSACTIONS ON NETWORKING, VOL. 1, NO. 2, APRIL 1993
TCPDUMP Sample Output:
root_flora[4]# topQPp ip homt rm rad patti 23:12:40.911096 rm.1164 > patti.2000: S 589312000:589312000(0) win 4096 U U m 1460> 23:12:40.911780 prtti.2000 > xon.1164: S 1924864000:1924864000(0) aak 589312001 win 4096 -8 1460> 23:12:40.912218 Xm.1164 > pdti.2000: . ack 1 W i n 4096 23:12:40.914468 ~00.1164 > prtti.2000: . 1:1461(1460) aak 1 w i n 4096 23:12:40.915609 x.a.1164 > patti.2000: . 1461:2921(1460) ack 1 w i n 4096 23:12:40.916638 Xm.1164 > p&ti.2000: P 2921:4097(1176) 8ak 1 W i n 4096 23:12:40.916936 patti.2000 > r.n.1164: . ack 1461 w i n 4096 23:12:40.917213 patti.2000 > r.n.1164: . ack 2921 win 4096 23:12:40.918780 rm.1164 > patti.2000: . 4097:5557(1460) ack 1 w i n 4096 ... ... 23:12:40.949691 xm.1164 > patti.2000: . 14317:15777(1460) ack 1 w i n 4096 23:12:40.950123 patti.2000 > xm.1164: . a& 14317 w i n 4096 23:12:40.951360 patti.2000 > zm.1164: . .oL 15777 w i n 4096 23:12:40.952889 rm.1164 > patti.2000: P 15777:16385(608) aak 1 win 4096 23:12:40.956877 xm.1164 > patti.2000: P 16385:16385(0) aak 1 win 4096 23:12:40.957190 patti.2000 > x.n.1164: . ack 16386 w i n 4096 23:12:40.957579 p.tti.2000 > r.n.1164: r l:l(O) aak 16386 w i n 4096 23:12:40.958517 xm.1164 > patti.2000: . aak 2 w i n 4096 1637 paclutm rmoivmd by filtor 7 p8akOt. droppd by L.xnml
NETMON Sample Output:
Vxamplm of NBTNXViptraw Output’ 80202B00 06:57:35.57 oth-0 0 80202B00 06:57:35.57 ipIaUo-0 q.0 iplm 41 TCP(6) 128.29.1.12.1136 > 10.0.0.78.9
80202BOO 2 06:57:35.58 r25Out>l 1 + + + 80202800 2 06:57:36.76 r25Out-2 1
80202B00 06:57:35.58 ipoUtForr>-l dd.0 iplm 41 m ( 6 ) 128.29.1.12.1136 > 10.0.0-78.9
Fig. I .
Application (.p->@ii?j Send Socket Q
WPAP
Network Q
h b e 4
Recaive Socket Q
TCPAP
v Ethernet I ,
Fig. 8. IPC queues and probe location.
data passing through its checkpoint, and a type field to identify the location of the probe. The information recorded is minimal, but can nevertheless provide enough information about the behavior of each queue. For example, the timestamp difference provides queue delay, queue length, arrival rate, and departure rate. The data length provides throughput measurements, and helps identify where fragmentation occurs. The information collected by the probes is used to compute various important statistics.
On the sending side, probes 1 and 2 monitor the queue delay and length at the socket layer. The records produced by
probe 2 show how data is broken into protocol transmission requests. Probe 3 monitors packets reaching the interface queue. Rate packets entering the queue are essentially the protocol processing rate. This probe also monitors the window- ing and congestion avoidance mechanisms by recording bursts of packets produced by the protocol. The protocol processing delay can be obtained by the interpacket gap during a burst. Finally, probes 3 and 4 monitor the interface queue delay and length.
On the receiving side, the rate of packets arriving from the Ethernet is monitored by probe 5. Probes 5 and 6 monitor the delay and length of the IP queue. The difference in timestamps between probes 6 and 7 gives the protocol processing delay. Probes 7 and 8 monitor the delay and length of the receive socket queue. Packets arrive in the queue after the protocol has processed them, and depart as they get copied to application space.
The probes can also monitor acknowledgment activity. If the data flow is in one direction, the packets received by the data sender will be acknowledgments. Each application has all eight probes running, monitoring both incoming and outgoing packets. Therefore, in one-way communication some of the probes will be recording acknowledgments.
2) Probe Operation and Overhead: An issue of vital im- portance is that probes incur as little overhead as possible. There are three kinds of overhead associated with the probes:
PAPADOPOULOS AND PARULKAR: EXPERIMENTAL EVALUATION OF SUNOS IFC AND TCP/lP PROTOCOL IMPLEMENTATION
1) overhead due to probe execution time; 2) overhead due to the storing of measurements; and 3) overhead due to probe activation. To address the first source of overhead, any kind of processing besides logging a few important parameters in the probes was precluded. To address the second overhead, its was decided that probes should store records in the kernel. To accomplish this, a circular list of records residing in kernel space is used. The list is initialized at system startup by the TCP initialization routine, and two pointers, (one to the head, and one to the tail of the list) are made globally available to all probes. The head pointer points to the first empty record on the list, and the tail pointer to the last record in use. Since the records are linked during initialization, only the head pointer needs to be updated after using a record. The third source of overhead is incurred by the work required to determine if a packet should be logged. It is critical that probe activation should interfere as little as possible with normal operation since every packet needs to be examined to determine whether it should be logged or not. The developed activation mechanism is described next.
3) Probe Activation: To activate the probes, the application calls setsockopt(). The system call is part of the socket interface and is used by applications to set various properties on sockets, such as the size of the send and receive buffers, out-of-band message capability, etc. The setsockopt() call was extended by adding a socket option for logging, named SO-LOG. Setting the logging option on a socket has two effects: 1) a flag is set in the socket structure, marking the socket as logging; and 2) a flag is set in each packet’s IP header, marking the packets that need to be identified at the lower layers. The reason for this double marking is as follows. The flag set in the socket structure enables the socket and protocol layer routines to quickly determine if a socket is marked for logging, because both layers have direct access to the socket structure. The network layer, however, does not have direct access to this structure. One way of solving this problem is to use the same method the protocol uses to identify incoming packets, i.e., to first locate each packet’s corresponding protocol control block and then using it to locate the socket structure. However, this requires performing a search for each outgoing packet, which is too expensive to be practical. Instead, it was decided that the packet itself should cany the information to activate the probes. This allows easy identification of marked packets at the network layer of both the sending and receiving ends. The logging information is carried in the IP header in the “tos” (type of service) field, which has two bits currently unused. Existing IP implementations simply ignore them. One of those bits was chosen to carry the logging information. The network layer is able to easily access this field since the IP header is always contained in the first MBUF of the chain, either handed down by the protocol or up by the driver. Admittedly, this is a nonstandard approach and it does violate layering, but it has the advantage of incumng minimum overhead and being straightforward to incorporate.
In the current implementation, logging initiated at the send- ing end will automatically initiate logging at the receiving end. The reason for this is that sometimes the receiver was not able
205
#if&f LaccINc if (mo->so-optionm L S 0 - m )
f int s;
= splimp0: if (log-h08d->noxt != lOg-t8il)
I rogimtor mtruct logroc *lr; lr = log-hold; 1q-ho.d = log-he8d->noxt; uniqti” ( L (lr->tv) ) ; mplx(m) ; lr->typo = m - U V E L ; lr->lon = /* data longth */ 1
0180 8plX(E); 1
hndif LOCCINC
Fig. 9. Code for a typical probe
to activate its probes before the arrival of the initial packets, leading to the logging of incomplete data. To overcome this problem, the kernel was modified to set the socket logging option automatically if the connection request packet has the logging flag set.
4 ) Probe Intemal Structure: The code for a typical probe is shown in Fig. 9. It is very simple and efficient. The probe shown is activated if the socket option SO-LOG has been set, which is determined at the first “if’ statement. Probes having no access to the socket structure would test the IP header “tos” field. Then, the probe masks network device interrupts and makes sure that the next record on the list is indeed free. If it is free, its address is assigned to a local pointer, and the list head pointer is advanced. Next, the probe records the current time, the length of the data, and an identifier for the location of the probe. Determining the data length may involve traversal of an MBUF chain and adding up the length fields. The interrupts are unmasked after obtaining the timestamp since the remaining operations are not critical.
Iv. PERFORMANCE OF IPc
This section presents a number of experiments aimed at characterizing the performance of various IPC components, including the underlying TCP/IP protocols. The experiments were performed with a single user on the machines (but still in multiuser mode) to avoid interference from other users. During the experiments, the Ethernet was monitored using a tool capable of displaying the Ethernet utilization (Sun’s trufic or xenetload) to ensure that background Ethernet traffic was low (less than 5 % ) when the experiments were performed. The experiments were also repeated a number of times in order to reduce the degree of randomness inherent to experiments of this nature.
A. Experiment 1: Throughput
This experiment has two parts. In the first part, the effect of the socket buffer size on throughput is measured. The results suggest that it would be beneficial to increase the socket buffer size over the default, for applications running on the Ethernet

206 IEEWACM TRANSACTIONS ON NETWORKING, VOL. 1. NO. 2. APRIL 1993
10.0 Sparcl - loopback
Sparcl - Ethemet 1 Sparc2 - Ethernet
- . . . . . . - . . . 0.0 10.0 20.0 30.0 40.0 50.0 60.0
socket buffer (KB)
Fig. 10. Throughput versus socket buffer size
and applications that will be running on faster networks in the future. In the second part, the performance of two IPC configurations is compared: in the first, the communicating processes are running on two physically separate machines, and in the second the processes are running on the same machine. The observed local IPC performance suggests that the mechanism is capable of exceeding the Ethernet rate. However, the observed throughput across the Ethernet is about 75% of the maximum Ethernet rate.
I) Throughput versus Socket Buffer Size: The socket buffer size is a per-connection user-specified parameter that controls the amount of memory the kernel reserves for buffering. There are two distinct buffers associated with each socket: one for sending and one for receiving (represented by the socket layer queues in Fig. 5). The receive socket buffer is the last queue in the queueing network, and therefore may have a decisive effect on the performance of IPC. In addition, the buffer sizes affect TCP directly in that the minimum of the buffers is the maximum window TCP can use.
Fig. 10 shows throughput as a function of socket buffer size when both send and receive buffers are of equal size. The x-axis shows the buffer size, and the y-axis the observed throughput’. Plots are shown for three configurations: 1 ) processes on two Sparcstation 1’s communicating over the Ethernet; 2) processes on a single Sparcstation 1 communi- cating through the loopback interface; and 3) processes on two Sparcstation 2’s communicating over the Ethernet. The unexpected dive in throughput for the third plot could not be explained. It is believed to be a manifestation of a problem with SunOS 4.1. The same behavior was observed by other people, who also had no explanation of this phenomenon [ 141. The unavailability of source code for SunOS 4.1 prevented further investigation of this problem’.
The throughput of Sparcstation I machines over the Ethernet shows a significant improvement as the socket buffer size increases. The biggest increase in throughput is achieved by quadrupling the buffers (from 4 to 16 kbytes), followed by some smaller subsequent improvement as the buffers are increased further. These results suggest that increasing the
’The throughput measurements were obtained using custom software. ‘The problem has been fixed in later versions of SunOS.
socket buffer size is beneficial even for existing IPC. The increase is necessary in order to effectively use TCP over high- bandwidth networks since the TCP window is directly affected by the size of these buffers. Networks with high bandwidth- delay product store large amounts of data in transit and, hence, require a large window size to allow the transmitter to fill the pipe. Larger TCP windows are possible only if socket buffers are increased. With the default size, however, the window cannot exceed 4096 bytes-allowing at most four Ethernet packets to be transmitted with every window, which forces TCP to a kind of four-packet stop-and-wait protocol’.
Another potential problem is that the use of small socket buffers leads to a significant increase in acknowledgment traffic, since at least one acknowledgment for every window is required. Although this may be desirable during congestion window opening in TCP [7], generating acknowledgments too fast may lead to unnecessary overhead. The number of acknowledgments generated with 4K buffers was measured using the probes, and was found to be roughly double the number with maximum size buffers. Thus, more protocol processing is required to process the extra acknowledgments, which may contribute to the lower performance obtained with the default socket buffer size.
In light of the above observations, all experiments were performed with this implementation’s maximum allowable socket buffer size, which is approximately 5 1 kbytes. Any deviations will be clearly stated in the text. Note that current TCP can support a maximum window size of 64 kbytes.
2) Performance of Local versus Remote IPC: In most im- plementations, the IPC interface to the network is designed so that protocols are not aware whether their peer is a local process or a process on a different machine. A protocol’s routing decision simply involves choosing a network interface to output packets, meaning that the protocol is unaware whether the interface is connected to a real network. The local interface is not connected to any physical network, but instead it loops back the packets to the receiving end of the protocol. The protocol routes packets to the loopback interface the same way it would route to other network interfaces.
Fig. 10 shows the throughput over loopback interface ver- sus socket buffer size. Bigger socket buffers are shown to help, even without a real underlying network. The throughput reaches maximum rates close to 9 Mb/s. The result implies that a machine running only one side of the communication should comfortably reach rates higher than 9 Mb/s. However, the best observed throughput over the Ethernet was around 7.5 Mb/s.
To verify the rates higher than 7.5 Mb/s are possible on the Ethernet, throughput measurements were taken between two Sparcstation 2 workstations connected on the same Ethernet. The result, also shown in Fig. 10, shows that rates up to 8.7 Mb/s are indeed possible (it is important to note that, in this experiment, the Sparcstation 2 machines were also using 1 kbyte packets as opposed to 1460 bytes, which is the default, to ensure that the increase in throughput was not caused by the larger packet size). These results suggest that there is a bottleneck somewhere in the network layer in SunOS 4.0.3.
\
91n a stop-and-wait protocol, the transmitter sends a packet of data and waits for an acknowledgment before sending the next packet.

PAPAWPOULOS AND PARULKAR EXPERIMENTAL EVALUATION OF SUNOS IPC AND TCPOP PROTOCOL IMPLEMENTATION
T 200
100
1 0 0.10 0.20 0.30
Output to Application (probe 8)
0.40 0 o.io 0.20 0.30 0.r
Network Interface Output (probe 4) Input to Socket Buffer (probe 7)
200
100
0 o.io 0.20 0.30 0.40 o 0.10 0.20 0.30 0.40
elapsed time (seconds)
Fig. 1 1 . Packet trace with maximum socket buffers
207
3
The main bottleneck was traced to the interface driver, which was unable to transmit back-to-back packets and, thus, had to interrupt the operating system for every new packet. For more details, see [ 101.
3) Summary: In this experiment, it was shown that increas- ing the socket buffer size leads to improved IPC performance on the Ethernet. It was also shown that the socket and protocol layers on a single Sparcstation 1 are able to exceed the Ethernet rate and, therefore, two workstations should be able to achieve high Ethernet utilization. This, however, does not happen. The bottleneck was traced to the network interface driver, which was unable to sustain higher rates.
B. Experiment 2: Investigating IPC with Probes
In this experiment, the probes are used to get a better understanding of the behavior of IPC. The experiment has two parts: the first consists of setting up a connection, sending data as fast as possible in one direction and taking measurements. The data size used in this part is 256 KB. In the second part, a unidirectional connection is set up again, but packets are sent one at a time in order to isolate and measure the delay at each layer.
1) Part I: Continuous Unidirectional Data Transfer: The graphs presented are selected to show patterns that were con- sistent during the measurements. For this set of graphs, only measurements during which there were no retransmissions were considered in order to study the protocol at its best". The
lo Data collected with the probes allows the detection of retransmissions. These, however, were infrequent.
results are presented in sets of four graphs: 1) a packet trace; 2) queue length versus elapsed time; 3) queue delay versus elapsed time; and 4) per-packet protocol processing delay.
Packet traces: The first set of graphs shows packet traces as given by probes 3, 4, 7, and 8. Probes 3 and 4 are on the sending side and monitor the protocol output to the net- work interface and the network driver output to the Ethemet, respectively. Probes 7 and 8 are on the receiving side and monitor the receive socket queue. The input to this queue is from TCP, and the output is to the application. The graphs show elapsed time on the x-axis and the packet number on the y-axis. The packet number can also be thought of as a measure of the packet sequence number. Each packet is represented by a vertical bar to provide a visual indication of packet activity. For the sender, the clock starts ticking when the first SYN" packet is passed to the network and, for the receiver when this SYN packet is received. The offset introduced is less than 1 ms and does not affect the results in any significant manner.
The first packet trace (protocol output) in Fig. 11 shows the transmission bursts introduced by the windowing mechanism. The blank areas in the trace represent periods during which the protocol is idle, awaiting acknowledgment of the pending window. The dark areas contain a high concentration of packets and represent the periods the protocol is sending out a new window of data. The last two isolated packets are the FIN and FIN ACK packets that close the TCP connection.
The second trace (which is essentially the same as the one TCPDUMP would produce) is a trace of packets flowing to the
I I A SYN packet carries a connection request.

208 IEEEJACM TRANSACTIONS ON NETWORKING, VOL. 1 , NO. 2, APRIL 1993
Sending Socket Queue 3001 0.10 0.20 0.30 0.40
5 20 Interface Queue
15
10
5
0 0.10. 0.20 0.30 0.40
Receiving Socket Queue
0 0.10 0.20 0.30 0.40
0 0.10 0.20 0.30 0.40 elapsed time (seconds)
Fig. 12. Queue length during congestion window opening
Ethernet. It is immediately apparent that there is a degree of “smoothing” to the flow. The bursts produced by the protocol are dampened considerably, resulting in a much lower rate of packets on the Ethemet. The reason is that the protocol is able to produce packets faster than the network can absorb, which leads to queueing at the interface queue. As a result, the interface driver is kept busy most of the time.
On the receiving side, the trace of packets arriving at the re- ceive socket buffer appears to be similar to the trace produced by the Ethernet driver at the sending side. This indicates that there is not much variance in the delay introduced by the IP queue or the Ethernet. It also indicates that the protocol at the receive side is able to process packets at the rate they arrive, which is not surprising since the rate was reduced by the Ethemet. The output rate of the receive socket buffer appears similar to the input to the buffer. Note, however, that there is a noticeable idle period which seems to propagate back to the other traces. The source for this is presented after examining the queue-length graphs which are presented next.
Queue length: The second set of graphs in Fig. 12 shows the length of the four queues as a function of elapsed time (note the difference in scale in these graphs). The queue length is shown in number of bytes instead of packets for the sake of consistency, since the socket layer keeps the data as a stream of bytes and not as a queue of packets. Packetization of data is done at the protocol layer. There is no loss of information by displaying the data as bytes instead of packets, since for this experiment the packets were all the same size. It should also be made clear that the data shown in the graph do not actually reside in the socket queue since the queue size is only
51 kbytes. It is assumed that, after the application has called write (), the data belongs to the socket layer even if it was not actually copied in the buffer since the application is put to sleep and cannot access it. Data moves into the socket buffer as space becomes available, i.e., after data is acknowledged.
The length of the sending socket queue is shown to mono- tonically decrease as expected, but not at a constant rate since its draining is controlled by the window flow control (i.e., by the arrival of acknowledgments). Note that the point the queue becomes empty is the point where the last chunk of application data is moved into the socket buffer and not when all data was actually transmitted. The data remains in the socket buffer until transmitted and acknowledged by the protocol.
The interface queue holds the packets generated by the protocol. It is immediately apparent that the window bursts generated by the protocol result in peaks in the interface queue length. This was suggested by the packet trace graphs and is now clearly visible. Also, the queue length increases with every new burst, indicating that a new burst contains more packets than the previous one. This is an effect of the slow start strategy of the congestion control mechanism [7].
The third queue length graph, which shows the IP receive queue, confirms the earlier hypothesis that the receive side of the protocol can comfortably process packets at the rate delivered by the Ethernet. The low Ethernet rate is a key reason why packets are not queued in the IP queue. As the graph shows, the queue practically never builds up, each packet being removed and processed before the next one comes in.
The graph for the receive socket queue shows some queue- ing. It appears that there are instances during data transfer

PAPAWPOULOS AND PARULKAR EXPERIMENTAL EVALUATION OF SUNOS IPC AND TCPnP PROTOCOL IMPLEMENTATION
Send Socket Queue 1
209
Receive Socket Queue 8 - I
2 Network Send Queue IP Receive Queue a 40 -
30 - 20 - 10 -
0 - , ' . . . . . " ' O I . . " " "
0 .1 .2 .3 .4 0 .1 .2 .3 elapsed time (seconds)
Fig. 13. Queue length after congestion window has opened.
where data accumulates in the socket buffer, followed by a drain of the buffer. During these instances, the transmitter does not send more data since no acknowledgment was sent by the receiver. This leads to gaps in packet transmission, as witnessed earlier by the packet trace plots. These gaps are a result of the receiver delaying the acknowledgment until data is removed from the socket buffer. This is investigated further in Experiment 3.
Queue length a f e r congestion window opening: The pre- vious queue length graphs show the four queues at the beginning of data transfer in a new connection. During this period, the congestion window mechanism is in effect, and the queues show the window is still expanding. For this reason, a second set of queue-length graphs is given in Fig. 13, which shows the four queues after the congestion window has opened up. The graph shows that the IPC mechanism is performing quite well. The network queue is kept almost full because of the slow Ethernet, IP queueing is still nonexistent, and the receive socket queue shows moderate queueing.
Queue delay: The next set of graphs in Fig. 14 shows the packet delay. The x-axis again shows the elapsed time and the y-axis the delay. Each packet is again represented as a vertical bar. The position of the bar on the z-axis shows the time the packet entered the queue. The height of the bar shows the delay the packet experienced in the queue.
Since the sending socket queue contains a stream of bytes (as mentioned earlier), there are no packets in this queue and thus the delay graph simply shows the time it takes for the data in each application write call to pass from the application layer down to the protocol layer. For this experiment, there is a single transmit request (i.e., a single write () call), so there is only one entry in the graph. The second graph
r
shows the network interface queue delay. Packets entering an empty queue at the beginning of a window burst experience very small delay, while subsequent packets are queued and therefore delayed significantly. This leads to a wide range of delays, ranging from a few hundred microseconds to several milliseconds. The third graph shows the IP queue delay. This is essentially a measure of how fast the protocol layer can remove and process packets from the IP queue. The delay of packets appears very small, with the majority remaining in the queue for about 100-200 ps. Thus, most of the packets are removed from the queue well before the arrival of the next packet, which will take approximately 1 ms. The fourth graph shows the delay each packet experiences in the receive socket queue. Here, the delays are much higher because they include the time to copy data from MBUF's to user space. Since the receiving process is constantly trying to read new data, this graph is also an indication of how often the operating system allows the socket receive process to run. The fact that there are occasional data accumulations in the buffer shows that the process does not run often enough to keep up with the data arrival.
Protocol processing delay: The two histograms in Fig. 15 show protocol processing delay at the send and receive sides, respectively. The .x-axis is divided into bins which are 50 ps wide, and the y-axis shows the number of packets into each bin. For the sending side, the delay is measured from the gaps between packets during a window burst. The reason is that since the protocol fragments transmission requests larger than the maximum protocol segment, there are no well-defined boundaries as to where the protocol processing begins for a packet and where it completes. Therefore, packet interspersing was deemed more fair to the protocol. This problem does not
-_ .

t
210 IEEWACM TRANSACTIONS ON NETWORKING, VOL. 1 , NO. 2, APRIL 1993
400 Sending Socket Queue 1 "1 Receiving Socket Queue
0.10 0.20 0.30 0.40 0 0.10 0.20 0.30 0.40 4 r;l
Interface Queue
20 0.8
0.6
0.4
0.2
10
0 o.io 0.20 0.30 0.40 o 0.10 0.20 0.30 0.40 elapsed time (seconds)
Fig. 14. Queue delay during congestion window opening.
Receiving Side 60 150
Sending Side
protocol delay (ps) Fig. 15. Protocol processing delay histograms
exist at the receiving end, where the protocol receives and forwards distinct packets to the socket layer.
The protocol delays appear to be different at the two ends: on the sending end, processing delay divides the packets into two distinct groups (with the larger one taking about 250-400 ps to process, and the other about 500-650 ps). At the receiving end, protocol processing is more evenly distributed, taking about 250-300 ps for most packets. These graphs show that the receiving side is able to process packets faster than the sending side. The average delays for protocol processing are 370 ps for the sending side, and 260 ps for the receiving side. From these numbers, the theoretical maximum TCPAP can attain between Sparcstation 1's with the CPU devoted to communication, excluding data copying and network driver overhead, is estimated at about 22 Mb/s. It should be noted that the above numbers are approximate, but could be reproduced in several runs of the experiments.
Summary: Part 1 of Experiment 1 has shown that the IPC mechanism can achieve about 75% utilization of the Ethernet. Once the TCP congestion window has opened, the IPC mechanism works quite well. However, queueing is present at the interface queue and at the receive socket queue. The former is attributed to protocol processing being faster than the Ethernet, and the latter to the inability of IPC to transfer each packet to application space as it arrives. The effects of queueing at the socket layer are examined later in Experiment 3.
2 ) Part 2: incremental delay: The previous measurements have shown the behavior of the IPC queues during large data transfer. One problem with such measurements is that the individual contribution of each layer to the overall delay is hard to assess because layers have to share the CPU for their processing. Moreover, asynchronous interrupts due to packet reception or transmission may steal CPU cycles from

PAPADOPOULOS AND PARULKAR: EXPERIMENTAL EVALUATION OF SUNOS I F C AND TCPfiP PROTOCOL IMPLEMENTATION
Average delay with
transmission(pS) Location stop-and-wait
21 1
Average delay with continuous data transfer (pS)
Protocol - sending side
Interface queue
a I Send socket queue (with copy) I 280 I I 443 370
40 a
IP queue
Protocol - receiving side
113 124
253 260 a I Receive socket queue (with copy) I 412 I I I Bytecopy delayb (for 1024 bytes) I 130 130
higher layers. To isolate layer processing, a new experiment has been performed, where packets are sent one at a time after introducing some delay between them. The idea is to give the IPC mechanism enough time to send the previous packet and receive an acknowledgment before being supplied with the next.
The experiment is set up as follows: again, a pair of Sparcstation 1’s are used for unidirectional communication. The sending application is modified to send one 1024 byte packet and then sleep for 1 s to allow the packet to reach its destination and for the acknowledgment to return. To ensure that the packet is sent immediately, the TCP-NODELAY option was set. The socket buffers for both sending and receiving are set to 1 kbyte, effectively reducing TCP to a stop-and-wait protocol. The results of this experiment are summarized in Table I and are compared to the results obtained in the previous experiment, where 256 kbytes of data were transmitted.
The send socket queue delay shows the delay experienced by each packet before reaching the protocol is approximately 280 pS. This includes data copy from application to kernel space, which was measured to be about 130 pS as shown in the last row of Table I. Therefore, the socket layer processing takes about 150 pS. This delay includes locking the buffer, masking network device interrupts, doing various checks, allocating a plain and cluster MBUF, and calling the protocol. The protocol processing delay for the sending side has increased by about 73 pS (443 versus 370 pS). The extra overhead is due to some additional work performed. For example, the TCP output function must be called every time a packet is transmitted, whereas earlier it was called only a few times with a large transmission request. Appending the packet to the socket queue involves two additional function calls, out of which one attempts to do compaction and the probe at the output of the socket queue now records every packet adding a bit more overhead. The interface queue delay is very small. It takes about 40 pS for a packet to be removed from the
interface queue by the Ethernet driver, when the latter is idle. From experiments not reported in this paper, it was found that a packet takes about 1150 pS more to be transmitted (including the Ethernet transmission time) [lo]. The IP queue delay is also quite small. The delay has not changed significantly from the first part of the experiment. The protocol layer processing delay at the receiving end has not changed much from the earlier result. In this part, the delay is 253 pS while, in part 1, it was 260 pS. The receive socket queue delay is about 412 pS, out of which 130 pS is due to data copy. This means that the per-packet overhead is about 292 pS, which is about double the overhead at the sending side. The main source of this overhead appears to be the application wake-up delay.
Summary: Part 2 of the experiment measured the overhead of various components of IPC. Perhaps surprisingly, the socket layer overhead appears to be significant, especially on the receive side. The socket overhead is comparable to the protocol overhead.
C. Experiment 3: Effect of Queueing on the Protocol
The previous experiments have provided insight into the queueing behavior of the IPC mechanism. The experiments established that the TCP/IP layer in SunOS 4.0.3 running on a Sparcstation 1 has the potential of exceeding the Ethernet rate. As a result, the queue-length graphs show that noticeable queueing exists at the sending side at the network interface queue, which limits the IPC performance. At the receiving end, though the packet arrival rate is reduced by the Ethemet, there is queueing at the socket layer. This means that the socket layer on the receiving side is not able to keep up with the Ethernet rate in a burst mode. In this experiment, the effect of the receive socket queueing on the protocol is further investigated.
1 ) Effect of receive socket queueing: First, the actions taken at the socket layer in response to data amval are summarized briefly. The receive function enters a loop traversing the MBUF chain in the socket queue and copying data to the application space. The loop exits when either there is no
212 IEEWACM TRANSACTIONS ON NETWORKING, VOL. 1, NO. 2, APRIL 1993
more data left to copy, or the application request is satisfied. At the end of the copy loop, the protocol is notified via the user request function that data was received allowing protocol-specific actions like sending an acknowledgment to take place. Thus, any delay introduced at the socket queue will delay protocol actions. Next, the effect on the generation of acknowledgments by TCP is investigated.
The TCP acknowledgment mechanism: TCP sends ac- knowledgments during normal operation when the application removes data from the socket buffer. More specifically, during normal data transfer (no retransmissions) an acknowledgment is sent if the socket buffer is emptied after removing at least two maximum segments, or whenever a window update would advance the sender's window by at least 351%'~.
The TCP-delayed acknowledgment mechanism may also generate acknowledgments. This mechanism works as follows: upon reception of a segment, TCP sets the flag TF-DELACK in the transmission control block for that connection. Every 200 mS, a timer process is run which checks these flags for all connections. For each connection that has the TF-DELACK flag set, the timer routine changes it to TF-ACKNOW and the TCP output function is called to send an acknowledgment immediately. TCP uses this mechanism in an effort to min- imize both the network traffic and the sender processing of acknowledgments. The mechanism achieves this by delaying the acknowledgment of received data in order to accumulate more of the forthcoming data and send a cumulative acknowl- edgment. Additionally, the receiver may reply to the sender soon, in which case the acknowledgment may be piggybacked onto the reply back to the sender.
To summarize, if there are no retransmissions the protocol may acknowledge data in two ways: 1) whenever (enough) data are removed from the receive socket buffer and the TCP output function is called; and 2) when the delayed ACK timer process runs.
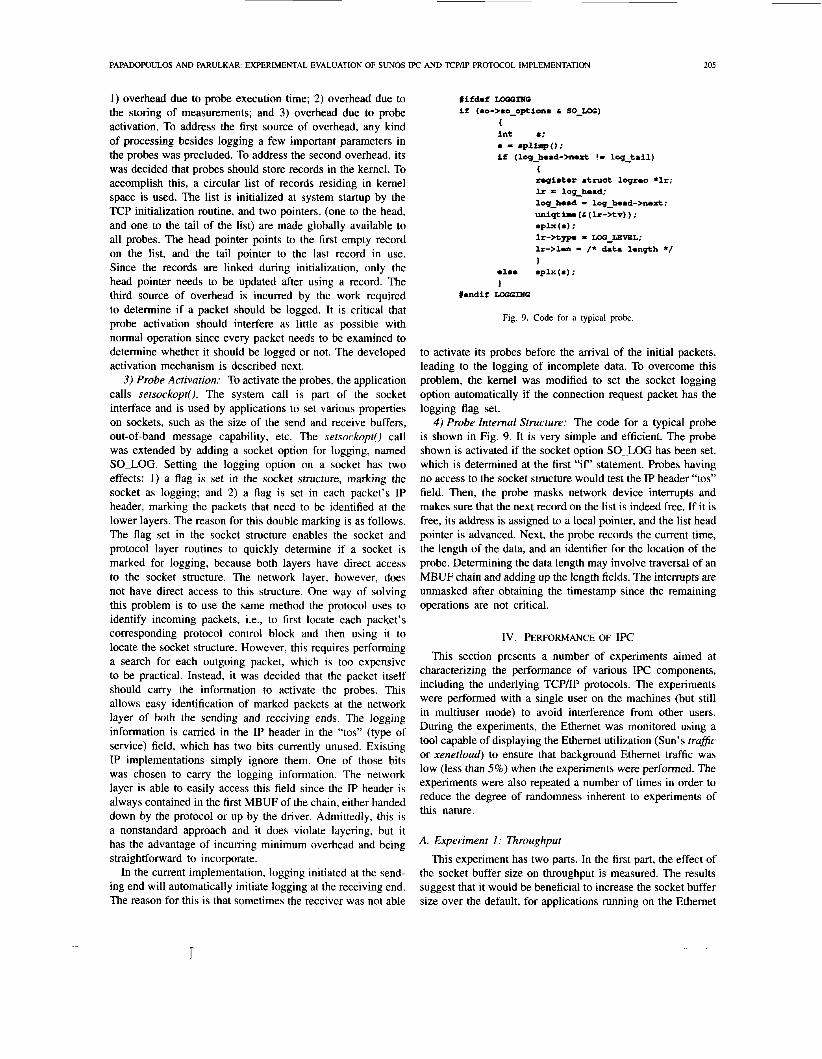
To verify the above, an experiment was performed monitor- ing the receive socket buffer and the generated acknowledg- ments. The experiment again had a unidirectional connection sending and receiving data as fast as possible. To isolate the protocol from the Ethernet, the experiment was conducted using the loopback interface. The data size sent was set to 1 Mbyte, and the result is shown in Fig. 16. This graph shows the length of a socket receive buffer and the generated acknowledgments throughout the connection's lifetime. The expansion of the congestion window can be seen very clearly with each new burst. Each window burst is exactly one segment larger than the previous one. Moreover, the socket queue grows by exactly the window size and then drops down to zero, where an acknowledgment is generated and a new window of data comes in shortly after. The peaks that appear in the graph are caused by the delayed acknowledgment timer process that runs every 200 mS. The effect of this timer is to send an ACK before the data in the receive buffer is completely removed, causing more data to arrive before the previous data was removed. However, during data transfer between different machines, more acknowledgments would
"As per the tcp-output ( ) of SunOS. See [IO] for details.
W I I A acknowledgment !z p 40
!j >
'l 2o
d .-
0 0 0.5 1 .o 1.5
elapsed time (sec)
Fig. 16. Receive socket queue length and acknowledgment generation with local communication.
be generated. The receive buffer becomes empty more often during remote transfer because the receive process is scheduled more often and has more CPU cycles to copy the data.
2) The effect of socket queue delay on the protocol: The above investigation shows how processing at the socket layer may slow down the protocol by affecting the acknowledgment generation. For a bulk data transfer, most acknowledgments are generated when the receive buffer becomes empty. If data arrives in fast bursts or if the receiving machine is slow, data may accumulate in the socket buffer. If a window mechanism is employed for flow control as in the case of TCP, the whole window burst may accumulate in the buffer. The window will be acknowledged after the data is passed to the application. Until this happens, the protocol will be idle awaiting the reception of new data, which will come only after the receive buffer is empty and the acknowledgment has gone back to the sender. So, there may be idle periods during data transfer which will be equal to the time it takes to copy out the buffer plus one round-trip delay for the acknowledgment.
The delayed acknowledgment timer may cause extra ac- knowledgments to be generated in addition to the acknowl- edgments generated when the socket buffer becomes empty. Such acknowledgments cause peaks at the socket buffer. These peaks occur only during the slow start period and could conceivably interfere with the slow start behavior. If many connections enter the slow start phase together, as in the case of multiple packet loss due to buffer overflow at a gateway, these peaks may cause some instability. This possibility, however, was not investigated in these experiments.
3) Summary: This experiment has shown that queueing at the receive socket layer affects the protocol acknowledgment generation. At its worst, this queueing interferes with the continuous packet flow the window mechanism attempts to produce, forcing the protocol to a stop-and-wait operation.
D. Experiment 4: Communication versus Computation
The previous experiments have studied the IPC mechanism when the machines were solely devoted to communication. However, it would be more useful to know how extra load present on the machine would affect the IPC performance. In a distributed environment (especially with single-processor ma- chines), computation and communication do affect each other.

PAPAWPOULOS AND PARULKAR EXPERIMENTAL EVALUATION OF SUNOS IPC AND TCP/IP PROTOCOL IMPLEMENTATION 213
8.0
6.0 -
4.0 -
2.0
~ 7.0 7 Workload on Server Workload on Client
y 3.0
2 4 6 8 lo O O 2 4 6 8 10 worklaad level workload level
Fig. 17. Throughput versus server and client background load.
This experiment investigates this interaction by observing the behavior of the various queues when the host machines are loaded with some artificial load, or running a real application. It is aimed at determining which parts of the IPC mechanism are affected when additional load is present on the machine.
1 ) EfSect o fa Background Load: In this part of the experi- ment, the machines are loaded with artificial background load. The main selection requirement for the workload is that it be CPU-intensive. The assumption is that if a task needs to be distributed, it will most likely be CPU-intensive. The chosen workload consists of a process that forks a specified number of child processes that calculate prime numbers. For the purposes of this experiment, the artiJicial workload level is defined as the number of prime number processes running at a particular instance on a single machine.
The experiment is performed by first starting the artifi- cial workload on the server machine, and then immediately performing a data transfer of 5 Mbytes. Fig. 17 shows the effect of the artificial workload on communication throughput when the machines run the workload. The graph shows that the throughput drops sharply as the workload level increases, which suggests that IPC requires a significant amount of CPU cycles. Thus, when computation and communication compete for CPU cycles, they both suffer-leading to poor overall performance.
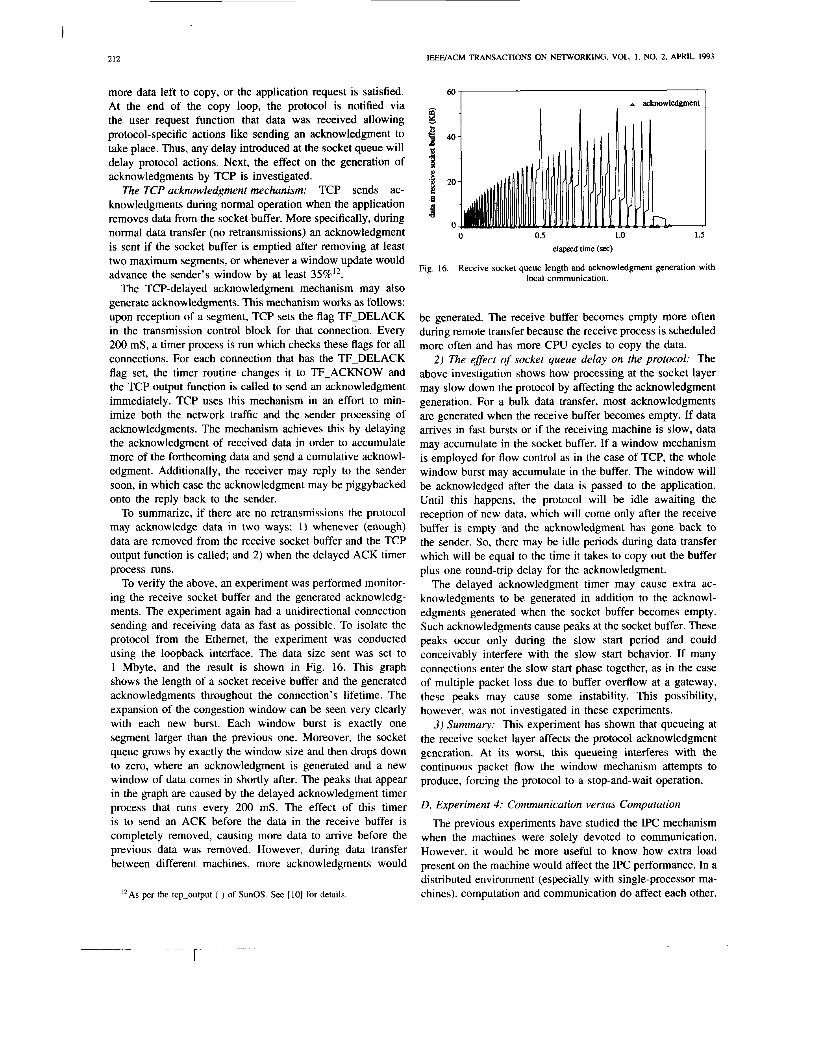
Fig. 18 shows the internal queues during data transfer with a loaded server. For these graphs, the data transferred is 1 Mbyte to keep the size of the graphs reasonable, and the workload level is set at 4. The x-axis shows the elapsed time, and the y-axis the queue length. The receive socket queue plot shows that data arriving at the queue is delayed significantly. The bottleneck is clearly shown to be in the application scheduling. The receiving process has to compete for the CPU with the workload processes thus forced to read the data slower. In addition, the extra load causes data to accumulate in the IP queue. In earlier experiments with no background computation, there would be no accumulation in the IP queue. The accumulation, however, is still very small compared to the other queues. On the sending side, the interface queue reflects the effect introduced by the delay of acknowledgments by the receiver. The queue builds up only after an acknowledgment reception triggers the transmission of a new window. When the workload is on the client, the
bottleneck is again at the socket layer on the sending side. The sending process is competing with the workload and its transmission requests are delayed, forcing the data to sit in the application buffer for a longer time.
The protocol processing delay was investigated in this experiment to determine if there was any increase due to the extra load. It was found that there was about 10% increase in the delay of protocol processing on either side. This was not surprising since the protocol routines are short and run in the kernel with the network device interrupts masked.
2 ) Running a Distributed Application: The second part of the experiment examines the effect of the Unix scheduling mechanism on a stage in a pipelined distributed application developed in a separate part of this study (details can be found in [IO]). Each application stage runs on a single host and consists of three processes: 1) receive data from the previous stage; 2) compute; and 3) transmit to the next stage. Fig. 19 depicts the duty cycles of the three processes. The z-axis shows the elapsed time, and the y-axis the process duty cycles as odoff states. A process is in the “on” state when it has work to do, and in the “off” state otherwise. The graph shows the activity of the three processes after steady state is reached. The processing cycle appears regular: first, there is a short read, followed by computation, and finally a short write. The write process appears to start immediately after the compute process, and the read process immediately after the write process. Thus, the short communication processes are scheduled immediately when they have work to do, while the long compute process gets less CPU cycles.
3) Summary: In the presence of background load, the Unix scheduling mechanism affects communication throughput con- siderably. The mechanism is designed to favor short processes at the expense of long intensive ones. The reason is that it is desirable to provide interactive processes with a short response time to avoid user frustration. This policy has con- siderable effect on response time as perceived by different user processes. The reason is that as a process accumulates CPU time, its priority is lowered in order to prevent it from monopolizing the CPU. If computation requires more CPU time than communication (which is a likely case), whenever data becomes available for transmission or reception, the communication process may run at a higher priority than the computing process. Thus, in the presence of extra computation,

IEEEJACM TRANSACTIONS ON NETWORKING, VOL. 1 , NO. 2, APRIL 1993
- 8
I 214
Network Send Queue
300 , 1 6 0 ,
I I I Send Socket Queue Receive Socket Queue
20
0 1 2 3 0 41 0
200
100
1 0 r=l
I 2 1
IP Receive Queue I
10 :1 0 0
4 -
I 0 1 2
time (sec) elap
Fig,. 18. Queue behavior with server background load.
V. CONCLUSIONS
In general, the performance of SunOS 4.0.3 IPC on Sparc- station 1 over the Ethemet is very good. Experiment 1 has shown that average throughput rates of up to 7.5 Mb/s are achievable. Further investigation has shown that this rate is not limited by protocol performance, but by driver perfor- mance. Therefore, a better driver implementation will increase throughput further.
Some improvements to the default IPC are still possible. Experiment 1 has shown that increasing the default socket buffer size from 4 to 16 kbytes or more leads to a sig- nificant improvement in throughput for large data transfers. Note, however, that increasing the default socket buffer size necessitates an increase in the limit of network interface queue size. The queue, shown in Fig. 5 , holds outgoing packets awaiting transmission. Currently, its size is limited to 50 packets and with the default buffers guarantees no overflow for 12 simultaneous connections (12 connections with a maximum window of 4). If the default socket buffers are increased to 16 kbytes, then the number of connections drops to 3.
transmit data
compute
receive data
. . . . . . 44.0 46.0 48.0 50.0 5i.O 54.0 5i.O 5g.O 66.0 6i.O
elapsed time (seconds)
Fig. 19. Process activity and send interface queue.
the CPU allocation policy favors the communication processes which run at near-maximum speed while the computation process suffers.

PAPADOPOULOS AND PARULKAR: EXPERIMENTAL EVALUATION OF SUNOS IPC AND TCPnP PROTOCOL IMPLEMENTATION 21s
copy data to application: 130 p!S pe!x 1024 bytes
Socket Buffer
TCPlIP processing/chksum: TCPP processing/chksum: 370 pS per 1024 bytes 260m per 1024 bytes
Driver processing and reception time (not measured)
Driver processing and transmission time: 1100 - 1200 pS per 1024 bytes
Ethernet
Fig. 20. Delays in IPC
The performance of IPC for local processes is estimated to be about 43% of the memory bandwidth. Copying 1 kbyte takes about 130 ps, meaning that memory-to-memory copy is about 63 Mb/s. Local IPC requires two copies and two checksums. Assuming that the checksum takes about half the cycles as memory copy (only reading the data is required), the maximum theoretical limit of local IPC is 63/3 = 21 Mb/s. The IPC performance measured was close to 9 Mb/s, which is about 43% of the memory bandwidth.
The sending side of IPC is able to process packets faster than the Ethernet rate, which leads to queueing at the network interface queue. The lower layers of the receiving side are able to process packets at the rate they arrive. At the socket layer, however, packets are queued before being delivered to the application. Fig. 20 shows the distribution of delays in the various IPC components. The estimated performance of TCPAP determined by the protocol processing and checksum, ignoring data copy, was measured to be about 22 Mbls.
While transferring large amounts of data, TCP relies on the socket layer for a notification that the application received the data before sending acknowledgments. The socket layer notifies TCP after all data has been removed from the socket buffer. This introduces delay in receiving new data, which is equal to the time to copy the data to application space plus one round-trip time to send the acknowledgment and for the new data to arrive. This is a small problem on the current implementation, where the socket queues are small but may be significant on future high bandwidth-delay networks where socket queues may be very large. As shown in Experiment 4, queueing at the receive socket queue can grow to fill the socket buffer, especially if the machine is loaded. This reduction in acknowledgments could degrade the performance of TCP, especially during congestion window opening or after a packet loss. The situation will be exacerbated if the TCP large windows extension is implemented. The congestion
window opens only after receiving acknowledgments, which may not be generated fast enough to open the window quickly, resulting in the slow-start mechanism becoming too slow.
The interaction of computation and communication is signif- icant. Experiment 4 has shown that the additional load on the machine dramatically affects communication. The throughput graphs show a sharp decrease in throughput as CPU contention increases, which means that IPC requires a major portion of the CPU cycles to sustain high Ethernet utilization. Even though machines with higher computational power are expected to become available in the future, network speeds are expected to scale even faster. Moreover, some of these cycles will not be easy to eliminate. For example, TCP calculates the checksum twice for every packet: once at the sending and once at the receiving end of the protocol. The fact that, in TCP, the checksum resides in the header and not at the end of the packet means that this time-consuming operation cannot be performed using hardware that calculates the checksum and appends it to the packet as data is sent to, or arrives from, the network. Conversely, the presence of communication affects computation by stealing CPU cycles from computation. The policy of favoring short processes adopted by the Unix sched- uling mechanism allows the communication processes to run at the expense of computation. This scheduling policy makes communication and computation performance unpredictable in the Unix environment.
Some areas of weakness have already been identified with existing TCP for high-speed networks, and extensions to TCP were proposed to address them [8]. The extensions are: 1) use of larger windows (greater than TCP’s current maximum of 65536 bytes) to fill a high-speed pipe end-to-end; 2) ability to send selective acknowledgments to avoid retransmission of the entire window; 3) inclusion of timestamps for better round-trip time estimation [6]. We, and other groups, are currently evalu- ating these options. Moreover, one may question the suitability
T

216 IEEWACM TRANSACTIONS ON NETWORKING, VOL. 1, NO. 2, APRIL 1993
of TCP’s Doint-to-Doint 100% reliable bvte Stream interface 1161 J. P. G. Sterbenz and G. M. Parulkar, “Axon: Application-oriented ~~
for multiparticipant collaborative applications with multimedia lightweight transport protocol design,” in Proc. Tenth Int. con5 compur. Commun. (ICCC’90), Nov. 1990, pp. 379-387.
streams. Additionally, if more and more underlying networks ~~
support statistical reservations for high bandwidth real-time applications, TCP’s pessimistic congestion control will have to be reconsidered.
161
REFERENCES
E. W. Beirsack and D. C. Feldmeier, “A timer-based connection management protocol with synchronized clocks and its verification,” to appear in Comput. N e w . and ISDN Syst. G. Chesson, “XTPPE design considerations,” in Proc. IFIP WG6.1/6.4 Workshop on Protocols for High-speed Netw., May 1989. D. Comer, Internetworking with TCP/IP. Englewood Cliffs, NJ: Pren- tice Hall, 1991. D. D. Clark, V. Jacobson, J. Romkey, and H. Salwen, “An analysis of TCP processing overhead,” I€EE Commun. Mag., vol. 27, no. 6, pp. 23-29, June 1989. C. Dhas, V. Konangi, and M. Sreetharan, Broadband Switching Archi- tectures, Protocols, Design, and Analysis. Los Alamitos, CA: IEEE Comput. Soc. Press, 1991. D. Sanghi et al. “A TCP instrumentation and its use in evaluating . _ roundtrip-time estimators,” Internetw.: Res. and Exper.. vol. I , pp. 79-99, 1990.
[7] V. Jackobson, “Congestion avoidance and control,” in Proc. SIGCOMM ’88, Aug. 1988, pp. 314-329.
(81 V. Jacobson, R. T. Braden, and L. Zhang, “TCP extensions for high- speed paths,’’ RFC 1185, 1990.
[9] A. Nicholson, J. Golio, D. Borman, J. Young, and W. Roiger, “High speed networking at Cray Research,’’ ACM SIGCOMM Comput. Com- mun. Rev., vol. 2, no. I , pp. 99-110.
[IO] C. Papadopoulos, “Remote visualization on campus network,” M.S. Thesis, Dept. Comput. Sci., Washington Univ., St. Louis, MO, 1992.
[ 1 I] J. Postel, “Internet protocol-DARPA internet program protocol specifi- cation,” U.S.C. Inform. Sci. Inst. Rep. RFC 791, Sept. 1981.
[I21 J. Postel, “Transmission control protocol,” U.S.C. Inform. Sci. Inst. Rep. RFC 793, Sept. 1981.
[I31 S. J. Leffler, M. K. McKusick, M. J. Karels, and J. S. Quarterman, The Design and Implementation of the 4.3 BSD Unix Operating Svstem. Reading, MA: Addison Wesley, 1989.
[I41 P. Liu, private email, Feb. 20, 1992. [I51 J. P. G. Sterbenz and G. M. Parulkar, “Axon: A high speed communica-
tion architecture for distributed applications,” in Proc. Ninth Ann. Joint Con$ IEEE Comput. and Commun. Soc. (INFOCOM’90), June 1990, pp. 415-425.
Christos Papadopoulos (SM‘93/ACM’90) was born in Nicosia, Cyprus. He received the B.A. degree from Queens College, New York, and the M.Sc. degree from Washington University, St. Louis, MO.
He is currently a Ph.D. student at Washington University, where he is working with Dr. G. Parulkar in the area of high-speed protocols. His interests include protocol implementation models, operating systems, and multimedia systems.
Gurudatta M. Parulkar (M’87/ACM’86) received the Ph.D. degree in computer science from the University of Delaware in 1987, the M.Tech. degree in electrical engineering from the Indian Institute of Technology, Bombay in 1983, and the B.E. degree in electronics and communications from the University of Indore in 198 1.
He was the recipient of the Frank A. Pehrson Graduate Student Achievement award in Computer and Information Sciences at the University of Delaware in 1987. Currently, he is an Assistant
Professor of Computer Science at Washington University in St. Louis. He has published his research work in major IEEE and ACM conferences, participated in a number of panels and workshops on high-speed networking, and participated in the Internet Engineering Task Force. He has also served on a number of IEEE and ACM conference program committees, and is a Technical Editor for the I€€€ Networks and a CO-Guest Editor of the IEEE JOURNAL ON SELECTED AREAS IN COMMUNICATIONS Special Issue on Protocols for Gigabit Networks. His research emphasis has been on the design, specification, and implementation of protocols to support distributed computing applications involving visualization, multimedia, and collaboration on high-speed networks.