Embed Size (px)
Citation preview
Experimental Evidence of Professor Engagement on Student Outcomes
Scott E. Carrell Michal Kurlaender
University of California - Davis
Monica P. Bhatt University of Michigan
Abstract
To test the effect of professor feedback on student success in higher education
classrooms, we conducted a small-scale randomized intervention in a large, introductory-level
microeconomics course at a comprehensive research university. The “light-touch” intervention
consisted of two strategically-timed e-mails to students from the professor indicating the
professor’s knowledge of the students’ current standing in the course, keys to success in the
class, and a reminder of when the professor is available. Results show that students in the
treatment group scored higher on exams, homework assignments, and final course grade,
compared to students in the control group. In addition, the results indicate positive, though
insignificant effects, on time spent on homework assignments and a lower likelihood of
dropout/failure.
1
Experimental Evidence of Professor Engagement on Student Outcomes
Abstract
To test the effect of professor feedback on student success in higher education
classrooms, we conducted a small-scale randomized intervention in a large, introductory-level
microeconomics course at a comprehensive research university. The “light-touch” intervention
consisted of two strategically-timed e-mails to students from the professor indicating the
professor’s knowledge of the students’ current standing in the course, keys to success in the
class, and a reminder of when the professor is available. Results show that students in the
treatment group scored higher on exams, homework assignments, and final course grade,
compared to students in the control group. In addition, the results indicate positive, though
insignificant effects, on time spent on homework assignments and a lower likelihood of
dropout/failure.
2
Experimental Evidence of Professor Engagement on Student Outcomes
Introduction
To date, much of the research on college success has been focused on barriers to entry
and on individual student determinants. Perhaps due to this robust body of research and policy
focus, a more diverse group of students is able to take advantage of the opportunities provided by
postsecondary institutions in the U.S. However, a consequence of this increased access is an
acknowledgement that institutions must learn more about better supporting students’ pathways to
academic success and degree completion. One potential lever for increased student success and
degree completion is professor engagement. In this paper we provide compelling evidence from
an experimental study of a light touch intervention of professor engagement. We frame the work
within the broader empirical and theoretical discussion of the determinants of student
postsecondary success, particularly degree completion.
Research Context
The rising value of a college degree has been well documented among social scientists
(Pew Research Center, 2014; Baum, Ma, & Payea, 2013), and more recently, in the popular press
(Leonhardt, New York Times, 2014). The benefits of a college degree for individuals and for
society include higher earnings, and, as a result, tax contributions, health outcomes, and a variety
of social outcomes (Baum et al., 2013). Despite increases in college attendance, however, college
completion has not kept up (Turner, 2004; Pew Research Center, 2014). Moreover, many
disparities by social origin and race/ethnicity exist in college access, type of college enrollment
(two-year versus four-year enrollment), college selectivity, and college completion. While a
substantial body of empirical work—including a growing number of randomized control trials—
3
exists on improving college access, particularly for low income and other underrepresented
groups (Castelman, Page, & Schooley, 2014; Carrell & Sacerdote, 2013; Hoxby & Turner, 2013;
Bettinger, Long, Oreopoulos, & Sanbonmatsu, 2012; Avery & Kane, 2004; Oreopoulos, Brown
& Laveccia, 2013), the research base is decidedly thin on how to keep students in college and on
improving degree completion. This lack of evidence is a problem that must be addressed given
low degree completion rates not only at community colleges, but also at many of the nation’s
broad-access, B.A.-granting, four-year institutions (Snyder & Dillow, 2013).
Determinants of College Persistence and Completion
Low graduation rates may be, in part, because of the rising complexity of higher
education enrollment. Today’s college students are substantially different than those from several
decades ago: They are more likely to be going to college part-time, to be working while in
college, to have attended multiple institutions on the road to the B.A., and to be the first in their
families to attend college (Horn, Peter, Rooney, & Malizio, 2002). Students who enter college
fail to complete a degree for many reasons. At the individual level, this may include lack of
preparation, financial constraints, and/or simply a loss of interest in college.
Institutional policies and practices may also play an important role in predicting degree
receipt. Colleges vary widely in the share of entering freshman they graduate within four, five or
six years. While the average four-year completion rate at four-year degree-granting institutions is
a modest 36.8%, many schools graduate fewer than 25% of their students in four years, while
others graduate nearly all of their students in four years (Knapp, Kelly-Reid, & Ginder, 2012).
College selectivity accounts for an appreciable share of the institutional variation in college
graduation overall (Melguizo, 2008; Small & Winship, 2007), though work focusing specifically
4
on community colleges has found less consistent evidence on the role of institutional quality
measures on students’ outcomes (Calcagno, Bailey, Jenkins, Kienzl, & Leinbach, 2008; Sandy,
Gonzalez, & Hilmer, 2006; Smith & Stange, 2013; Stange, 2012; Kurlaender, Carrell, &
Jackson, 2015). Reports by the American Association of State Colleges and Universities (2005)
and The Education Trust (Carey, 2005; Yeado, Haycock, Johnstone, & Chaplot, 2014) speculate
about why some public four-year colleges and universities are more successful than others at
retaining students. Although reports suggest that campus leadership on issues of retention may
influence graduation outcomes, even when holding constant the typical set of institutional
characteristics (e.g., size, sector, prestige, and average SAT/ACT scores), they do not provide
direct evidence of how specific institutional policies affect college completion. Several papers
have also suggested that cohort crowding and declining resources (particularly at less selective
public institutions) may also lead to reductions in rates of college completion and increases in
time to degree (Bound, Lovenheim, & Turner, 2010, 2012).
Interventions to Improve College Retention and Completion
What practices or programs lead to higher retention and degree receipt? Prior research
and theory suggests that student interaction with faculty and peers, sense of community, active
engagement with the institution, and mentoring may contribute to higher rates of persistence
(Astin, 1993; Habley, Bloom, & Robbins, 2012; Lotkowski, Robbins, & Noeth, 2004; Braxton,
2000; Tinto, 1993). More recent correlational analyses of student surveys reveal that students
had more positive perceptions of their experiences in campuses where faculty also perceived
higher levels of engagement with students (Umbach & Wawrzynski, 2005). Although these
provide promising directions for higher education institutions, many of these studies fail to
5
adequately control for observable and unobservable differences between students who select
different kinds of colleges or collegiate experiences. Consequently, these studies likely conflate
the contributions of student characteristics to institutional rates of postsecondary persistence with
those of institutional practices.
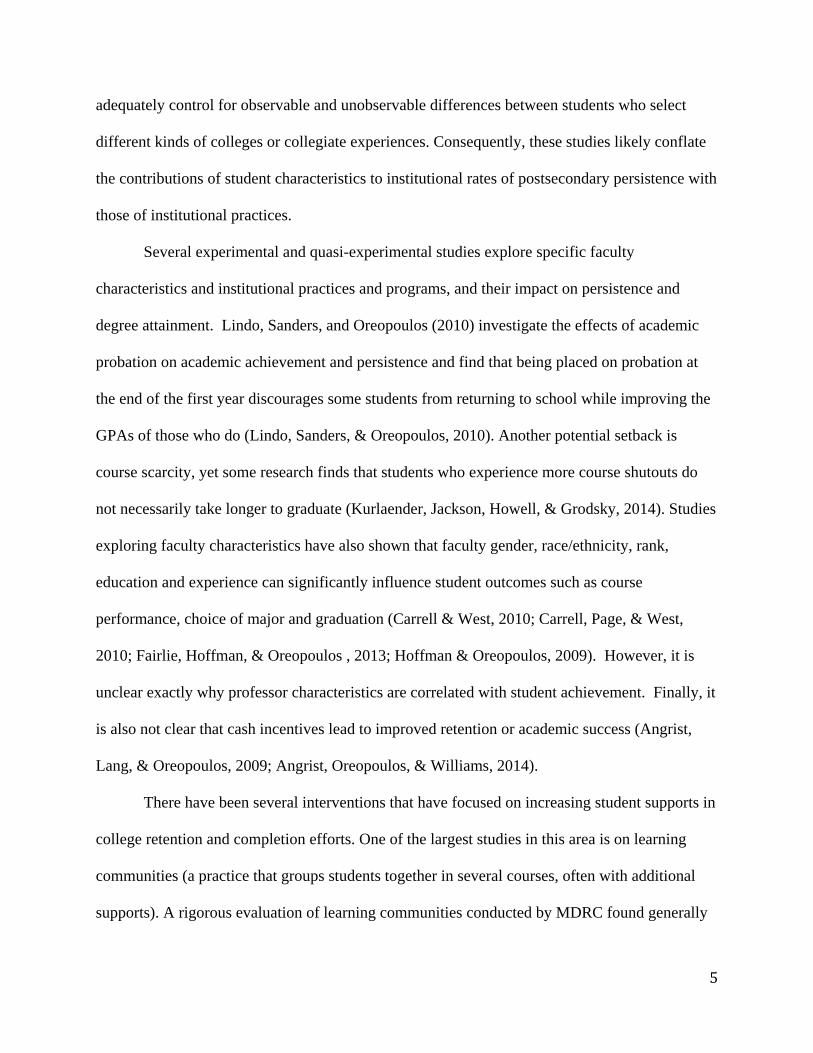
Several experimental and quasi-experimental studies explore specific faculty
characteristics and institutional practices and programs, and their impact on persistence and
degree attainment. Lindo, Sanders, and Oreopoulos (2010) investigate the effects of academic
probation on academic achievement and persistence and find that being placed on probation at
the end of the first year discourages some students from returning to school while improving the
GPAs of those who do (Lindo, Sanders, & Oreopoulos, 2010). Another potential setback is
course scarcity, yet some research finds that students who experience more course shutouts do
not necessarily take longer to graduate (Kurlaender, Jackson, Howell, & Grodsky, 2014). Studies
exploring faculty characteristics have also shown that faculty gender, race/ethnicity, rank,
education and experience can significantly influence student outcomes such as course
performance, choice of major and graduation (Carrell & West, 2010; Carrell, Page, & West,
2010; Fairlie, Hoffman, & Oreopoulos , 2013; Hoffman & Oreopoulos, 2009). However, it is
unclear exactly why professor characteristics are correlated with student achievement. Finally, it
is also not clear that cash incentives lead to improved retention or academic success (Angrist,
Lang, & Oreopoulos, 2009; Angrist, Oreopoulos, & Williams, 2014).
There have been several interventions that have focused on increasing student supports in
college retention and completion efforts. One of the largest studies in this area is on learning
communities (a practice that groups students together in several courses, often with additional
supports). A rigorous evaluation of learning communities conducted by MDRC found generally
6
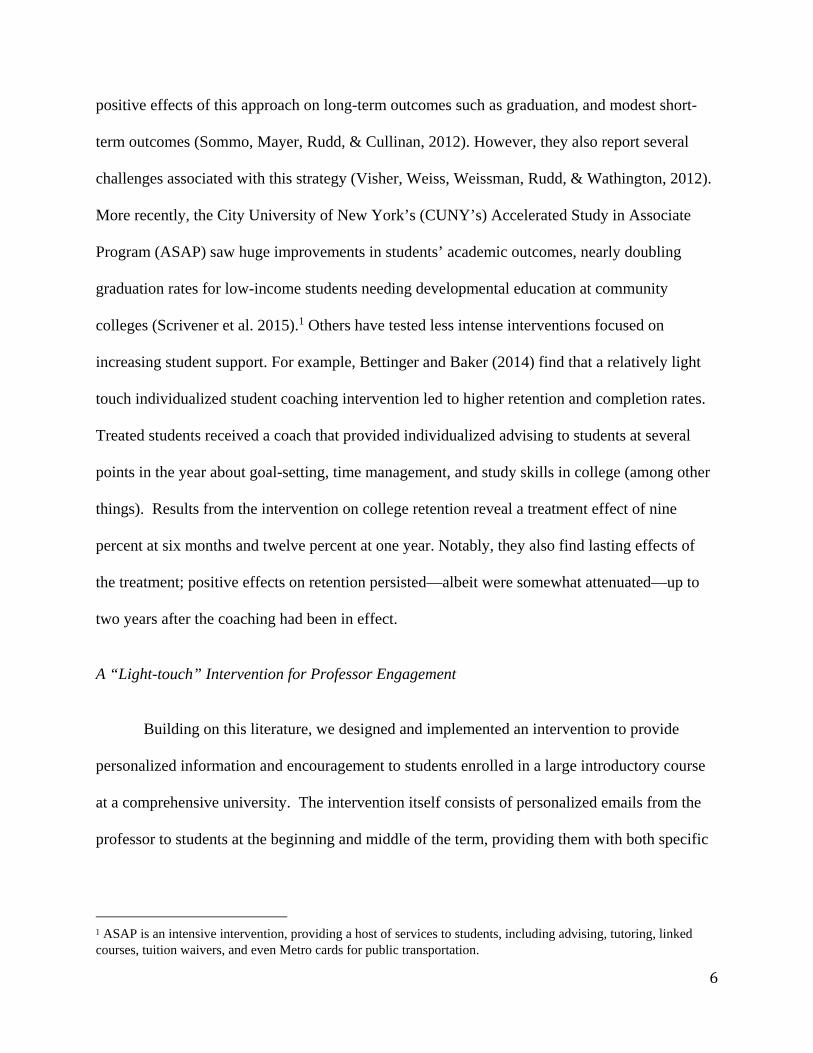
positive effects of this approach on long-term outcomes such as graduation, and modest short-
term outcomes (Sommo, Mayer, Rudd, & Cullinan, 2012). However, they also report several
challenges associated with this strategy (Visher, Weiss, Weissman, Rudd, & Wathington, 2012).
More recently, the City University of New York’s (CUNY’s) Accelerated Study in Associate
Program (ASAP) saw huge improvements in students’ academic outcomes, nearly doubling
graduation rates for low-income students needing developmental education at community
colleges (Scrivener et al. 2015).1 Others have tested less intense interventions focused on
increasing student support. For example, Bettinger and Baker (2014) find that a relatively light
touch individualized student coaching intervention led to higher retention and completion rates.
Treated students received a coach that provided individualized advising to students at several
points in the year about goal-setting, time management, and study skills in college (among other
things). Results from the intervention on college retention reveal a treatment effect of nine
percent at six months and twelve percent at one year. Notably, they also find lasting effects of
the treatment; positive effects on retention persisted—albeit were somewhat attenuated—up to
two years after the coaching had been in effect.
A “Light-touch” Intervention for Professor Engagement
Building on this literature, we designed and implemented an intervention to provide
personalized information and encouragement to students enrolled in a large introductory course
at a comprehensive university. The intervention itself consists of personalized emails from the
professor to students at the beginning and middle of the term, providing them with both specific
1 ASAP is an intensive intervention, providing a host of services to students, including advising, tutoring, linked courses, tuition waivers, and even Metro cards for public transportation.
7
information about the necessary steps to succeed in the course and encouragement about how to
be successful in college more generally.
Intervention
Students in the treatment condition received two e-mails with the explicit purpose of
providing information about (1) how they are progressing in the class; (2) how to be successful
in the class; and (3) the availability of the professor and other supports. Specifically, we tested
whether these personalized messages from faculty influenced short-term outcomes such as
homework and midterm exam performance, and medium-run outcomes, such as course
completion and final performance. We also test potential mechanisms for the interpretation of
results by surveying students on their perception of the professor and the course after the
submission of the final exam.
The intervention is “light touch” in that it requires a modest amount of extra time on the
part of the faculty member to implement. The specific treatment is built upon theories from
behavioral economics about information, from education on the role of feedback and student
outcomes, and from social psychology on self-efficacy and affirmation. Moreover, the
intervention rests upon one key premise: Faculty are an important and (potentially) under-
utilized resource to increase student success more generally and retention and completion more
specifically. Our hypothesis is that receiving additional information about course performance
and positive directions and encouragement regarding college success can improve students’
sense of self-efficacy and influence their decision to persist towards, and ultimately complete,
the degree.
8
Theoretical Framing
At the heart of our treatment is the notion that increased information provided by faculty
to students regarding their performance and direction and encouragement for future success. We
know from human capital theory that the individual decision to invest in education (i.e. persist in
college) should be based on an interaction of students’ resources (financial or otherwise) to
enroll, tastes for the college experience, and ability to do the work. Students rely on many
sources of information to make these decisions, and rational choice theory assumes that
individuals will use all available information to make the best decisions in order to reap the
greatest benefit. That is, students will use information about the cost of college, their experience
in college (grades, friends, etc.), and, arguably, some knowledge about the long-term benefit of
having a college degree to make the optimal decision about whether to stay in school (Avery &
Kane, 2004).2 However, recent work in behavioral economics is more critical of rational choice,
and posits that human behavior is more psychologically driven. Hence, decisions are heavily
influenced by factors such as how the information is conveyed, by whom, and in what context
(Thaler & Sunstein, 2008). Here, we hypothesize that a small increase in information from
faculty while students are enrolled in a course can influence performance in that course, and
ultimately, their persistence in college. We note that this increase in information is above and
beyond normal information sources available to students such as performance on course exams
or overall course grades.
We also conceive of the information being provided to students as a form of personalized
feedback, given that it happens after faculty have some indication of student performance in the
2 Students may display hyperbolic discounting (Laibson, 1997) in evaluating the costs and benefits of staying in college. That is, short sightedness causes them to highly discount the benefits of increased earnings, which are likely years away.
9
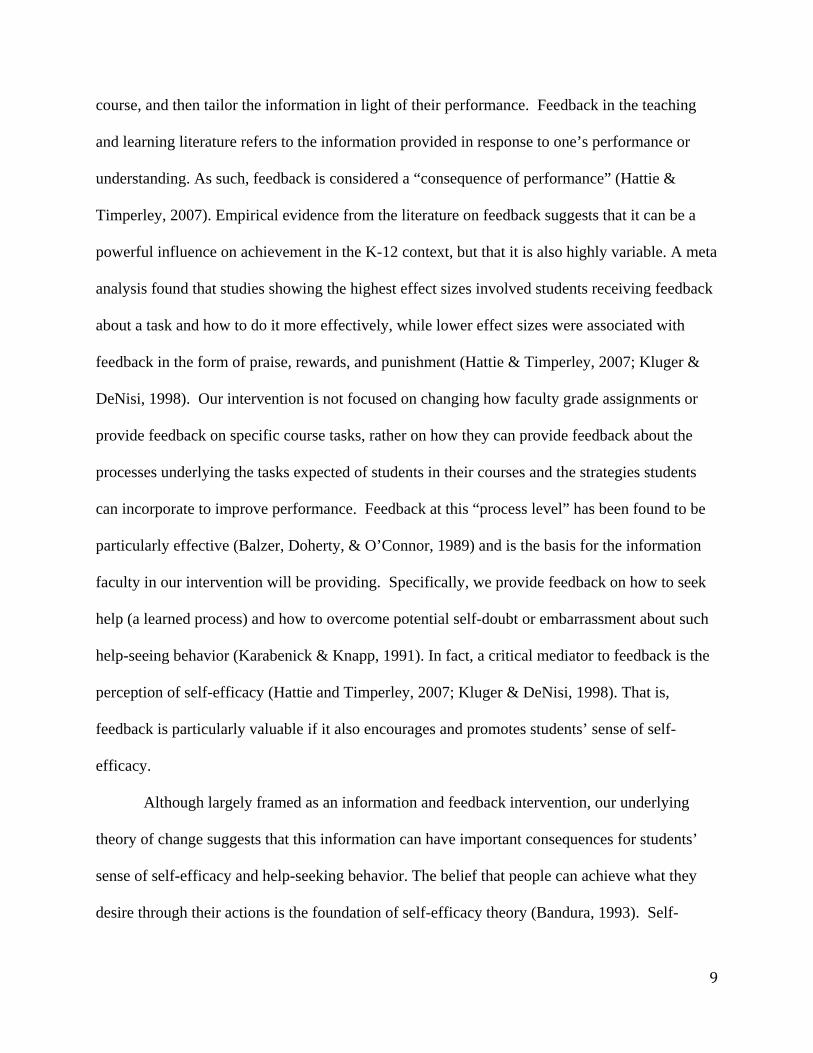
course, and then tailor the information in light of their performance. Feedback in the teaching
and learning literature refers to the information provided in response to one’s performance or
understanding. As such, feedback is considered a “consequence of performance” (Hattie &
Timperley, 2007). Empirical evidence from the literature on feedback suggests that it can be a
powerful influence on achievement in the K-12 context, but that it is also highly variable. A meta
analysis found that studies showing the highest effect sizes involved students receiving feedback
about a task and how to do it more effectively, while lower effect sizes were associated with
feedback in the form of praise, rewards, and punishment (Hattie & Timperley, 2007; Kluger &
DeNisi, 1998). Our intervention is not focused on changing how faculty grade assignments or
provide feedback on specific course tasks, rather on how they can provide feedback about the
processes underlying the tasks expected of students in their courses and the strategies students
can incorporate to improve performance. Feedback at this “process level” has been found to be
particularly effective (Balzer, Doherty, & O’Connor, 1989) and is the basis for the information
faculty in our intervention will be providing. Specifically, we provide feedback on how to seek
help (a learned process) and how to overcome potential self-doubt or embarrassment about such
help-seeing behavior (Karabenick & Knapp, 1991). In fact, a critical mediator to feedback is the
perception of self-efficacy (Hattie and Timperley, 2007; Kluger & DeNisi, 1998). That is,
feedback is particularly valuable if it also encourages and promotes students’ sense of self-
efficacy.
Although largely framed as an information and feedback intervention, our underlying
theory of change suggests that this information can have important consequences for students’
sense of self-efficacy and help-seeking behavior. The belief that people can achieve what they
desire through their actions is the foundation of self-efficacy theory (Bandura, 1993). Self-
10
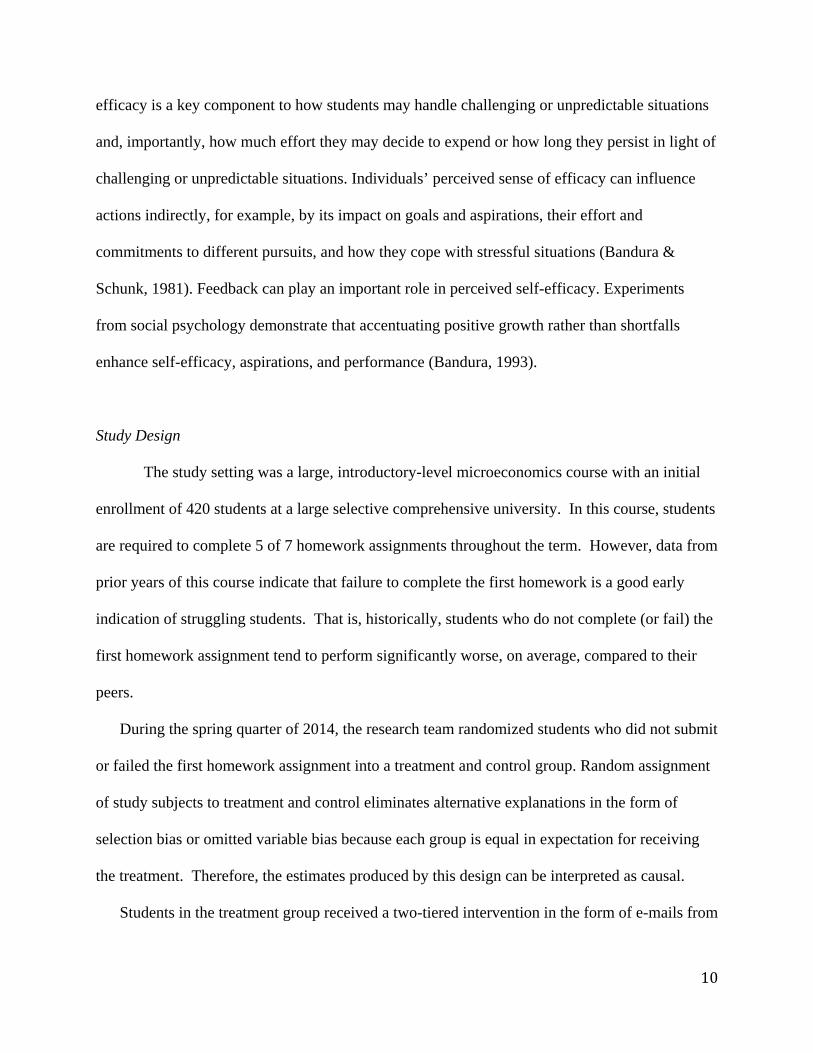
efficacy is a key component to how students may handle challenging or unpredictable situations
and, importantly, how much effort they may decide to expend or how long they persist in light of
challenging or unpredictable situations. Individuals’ perceived sense of efficacy can influence
actions indirectly, for example, by its impact on goals and aspirations, their effort and
commitments to different pursuits, and how they cope with stressful situations (Bandura &
Schunk, 1981). Feedback can play an important role in perceived self-efficacy. Experiments
from social psychology demonstrate that accentuating positive growth rather than shortfalls
enhance self-efficacy, aspirations, and performance (Bandura, 1993).
Study Design
The study setting was a large, introductory-level microeconomics course with an initial
enrollment of 420 students at a large selective comprehensive university. In this course, students
are required to complete 5 of 7 homework assignments throughout the term. However, data from
prior years of this course indicate that failure to complete the first homework is a good early
indication of struggling students. That is, historically, students who do not complete (or fail) the
first homework assignment tend to perform significantly worse, on average, compared to their
peers.
During the spring quarter of 2014, the research team randomized students who did not submit
or failed the first homework assignment into a treatment and control group. Random assignment
of study subjects to treatment and control eliminates alternative explanations in the form of
selection bias or omitted variable bias because each group is equal in expectation for receiving
the treatment. Therefore, the estimates produced by this design can be interpreted as causal.
Students in the treatment group received a two-tiered intervention in the form of e-mails from
11
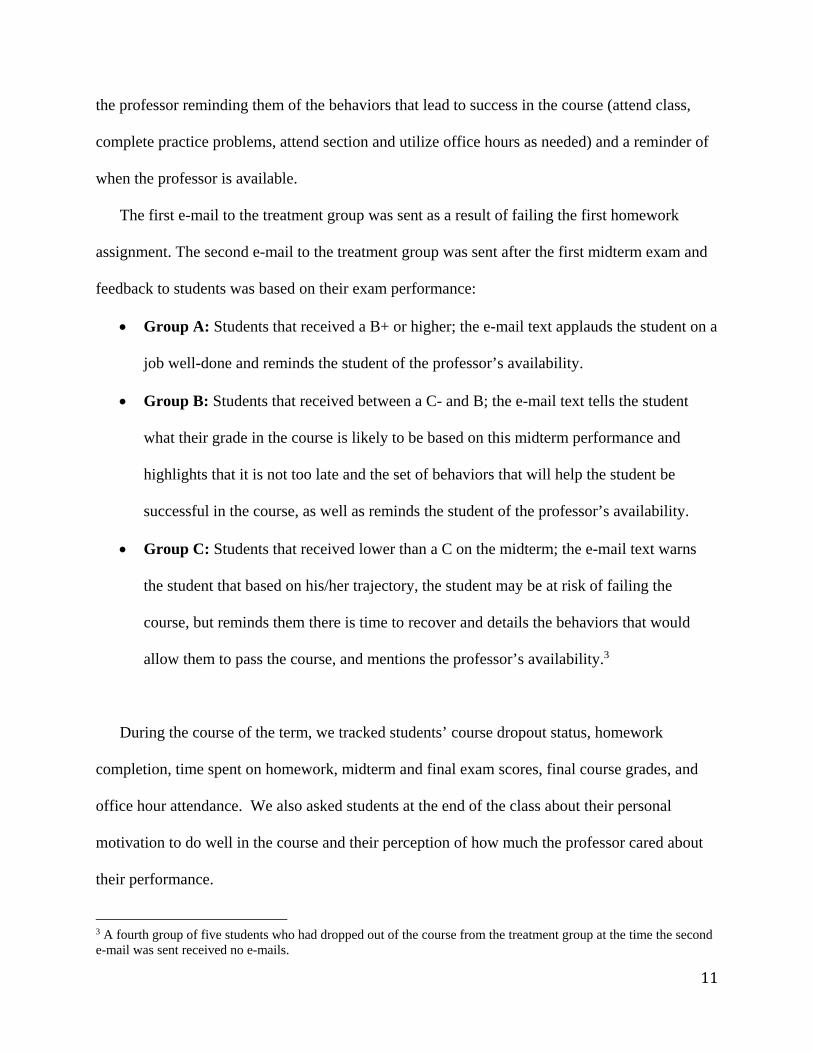
the professor reminding them of the behaviors that lead to success in the course (attend class,
complete practice problems, attend section and utilize office hours as needed) and a reminder of
when the professor is available.
The first e-mail to the treatment group was sent as a result of failing the first homework
assignment. The second e-mail to the treatment group was sent after the first midterm exam and
feedback to students was based on their exam performance:
Group A: Students that received a B+ or higher; the e-mail text applauds the student on a
job well-done and reminds the student of the professor’s availability.
Group B: Students that received between a C- and B; the e-mail text tells the student
what their grade in the course is likely to be based on this midterm performance and
highlights that it is not too late and the set of behaviors that will help the student be
successful in the course, as well as reminds the student of the professor’s availability.
Group C: Students that received lower than a C on the midterm; the e-mail text warns
the student that based on his/her trajectory, the student may be at risk of failing the
course, but reminds them there is time to recover and details the behaviors that would
allow them to pass the course, and mentions the professor’s availability.3
During the course of the term, we tracked students’ course dropout status, homework
completion, time spent on homework, midterm and final exam scores, final course grades, and
office hour attendance. We also asked students at the end of the class about their personal
motivation to do well in the course and their perception of how much the professor cared about
their performance.
3 A fourth group of five students who had dropped out of the course from the treatment group at the time the second e-mail was sent received no e-mails.
12
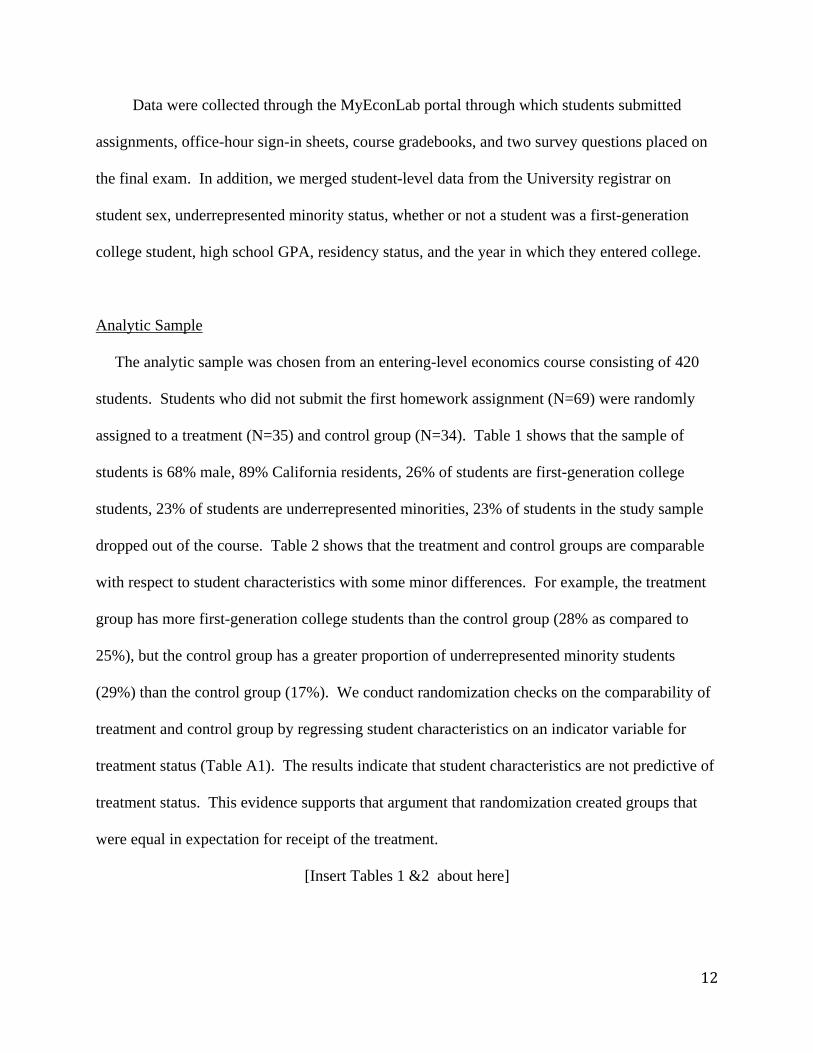
Data were collected through the MyEconLab portal through which students submitted
assignments, office-hour sign-in sheets, course gradebooks, and two survey questions placed on
the final exam. In addition, we merged student-level data from the University registrar on
student sex, underrepresented minority status, whether or not a student was a first-generation
college student, high school GPA, residency status, and the year in which they entered college.
Analytic Sample
The analytic sample was chosen from an entering-level economics course consisting of 420
students. Students who did not submit the first homework assignment (N=69) were randomly
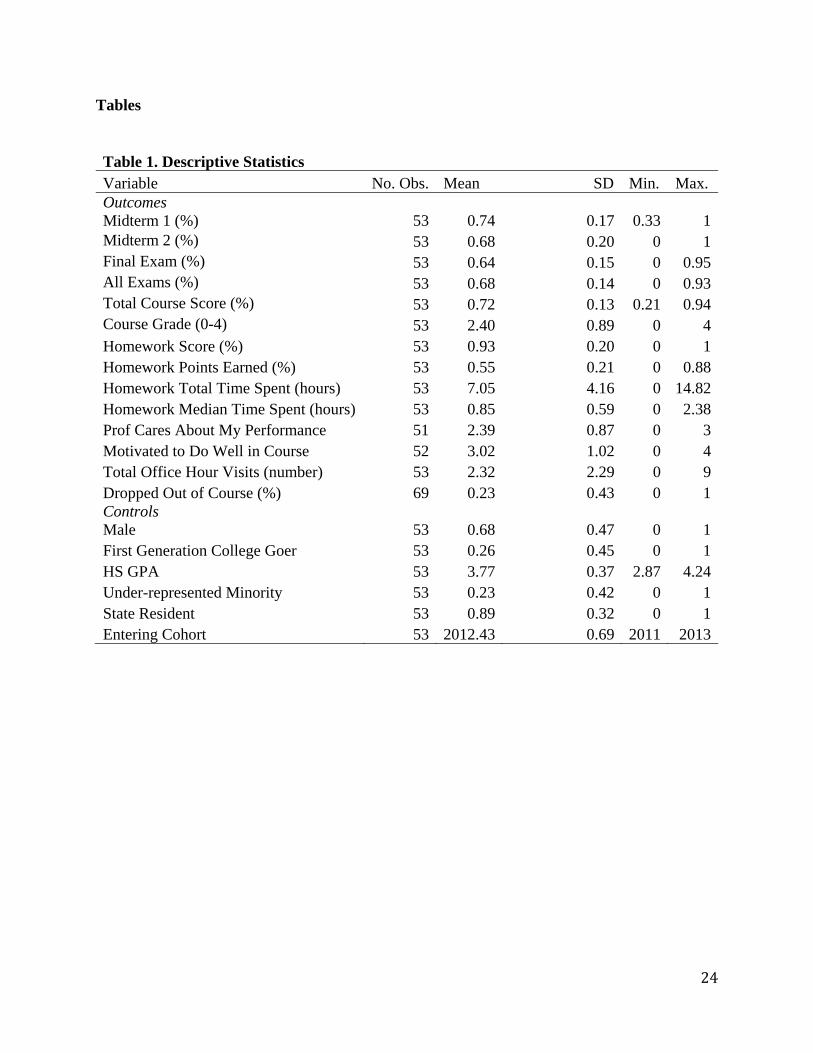
assigned to a treatment (N=35) and control group (N=34). Table 1 shows that the sample of
students is 68% male, 89% California residents, 26% of students are first-generation college
students, 23% of students are underrepresented minorities, 23% of students in the study sample
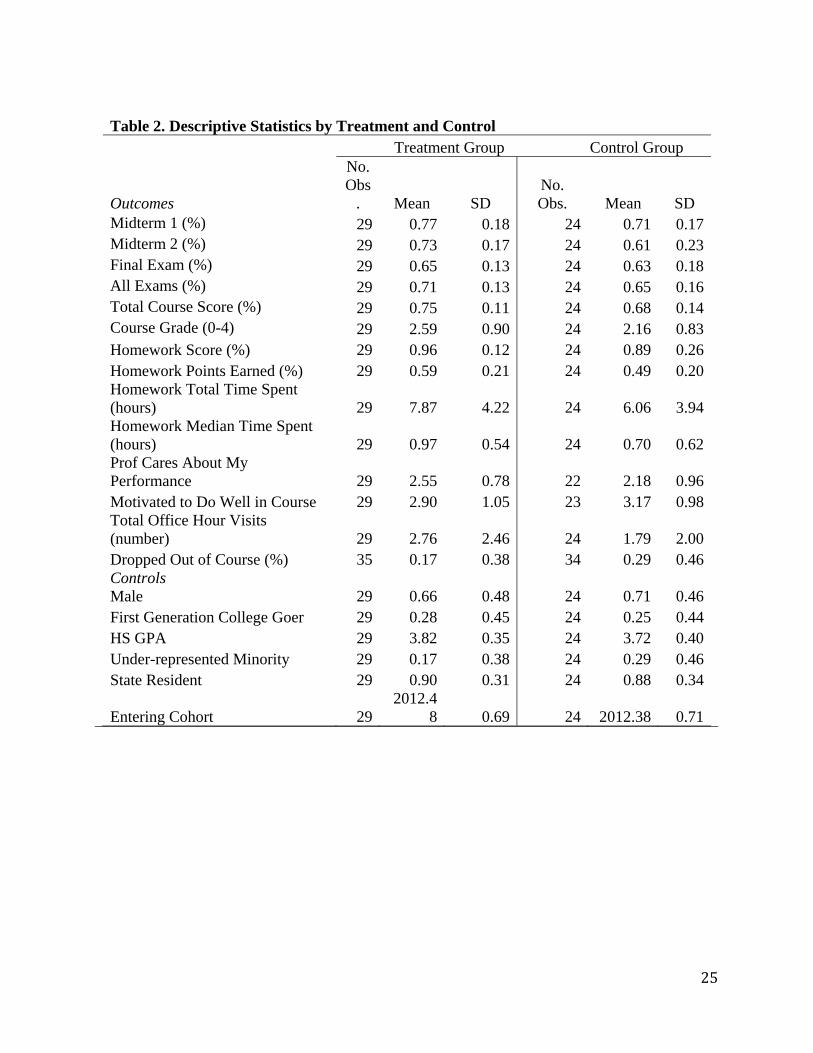
dropped out of the course. Table 2 shows that the treatment and control groups are comparable
with respect to student characteristics with some minor differences. For example, the treatment
group has more first-generation college students than the control group (28% as compared to
25%), but the control group has a greater proportion of underrepresented minority students
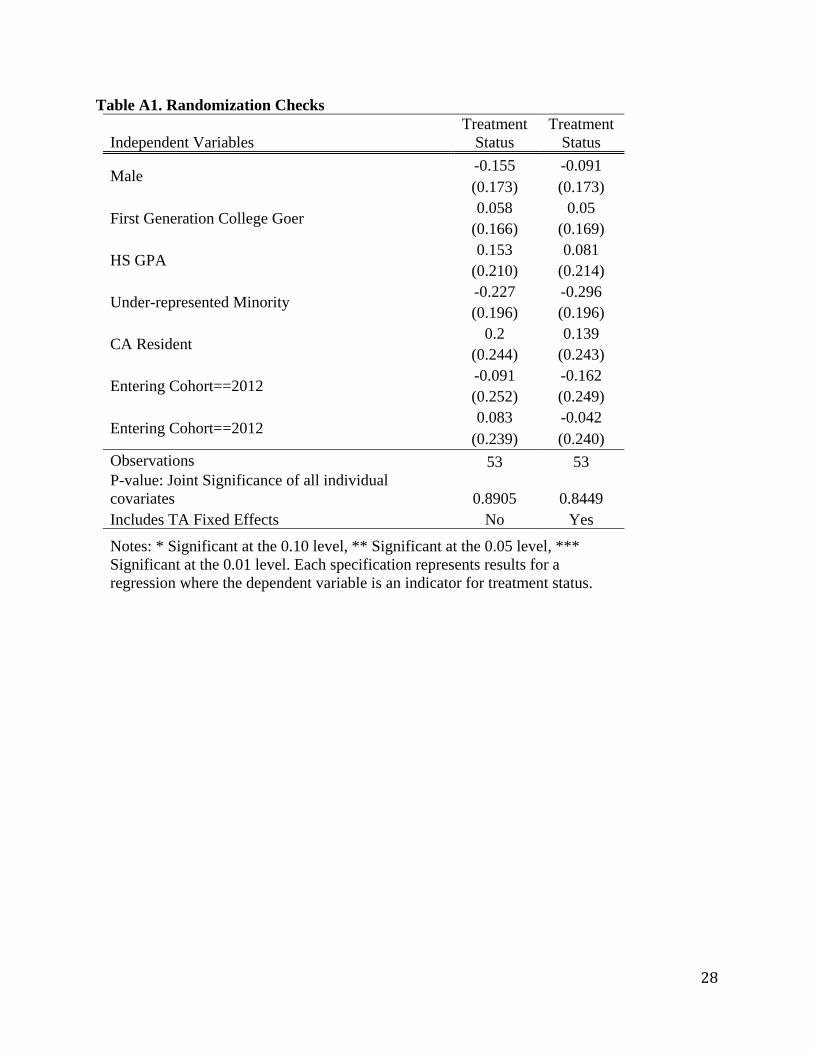
(29%) than the control group (17%). We conduct randomization checks on the comparability of
treatment and control group by regressing student characteristics on an indicator variable for
treatment status (Table A1). The results indicate that student characteristics are not predictive of
treatment status. This evidence supports that argument that randomization created groups that
were equal in expectation for receipt of the treatment.
[Insert Tables 1 &2 about here]
13
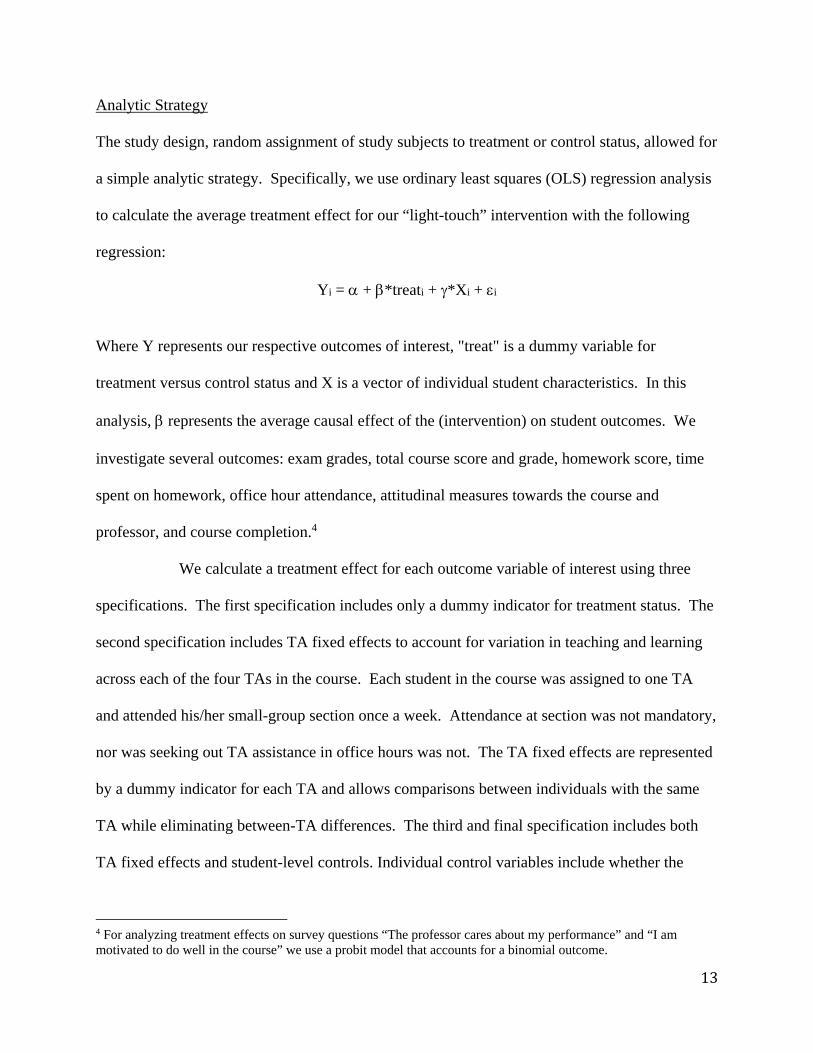
Analytic Strategy
The study design, random assignment of study subjects to treatment or control status, allowed for
a simple analytic strategy. Specifically, we use ordinary least squares (OLS) regression analysis
to calculate the average treatment effect for our “light-touch” intervention with the following
regression:
Yi = + *treati + *Xi + i
Where Y represents our respective outcomes of interest, "treat" is a dummy variable for
treatment versus control status and X is a vector of individual student characteristics. In this
analysis, represents the average causal effect of the (intervention) on student outcomes. We
investigate several outcomes: exam grades, total course score and grade, homework score, time
spent on homework, office hour attendance, attitudinal measures towards the course and
professor, and course completion.4
We calculate a treatment effect for each outcome variable of interest using three
specifications. The first specification includes only a dummy indicator for treatment status. The
second specification includes TA fixed effects to account for variation in teaching and learning
across each of the four TAs in the course. Each student in the course was assigned to one TA
and attended his/her small-group section once a week. Attendance at section was not mandatory,
nor was seeking out TA assistance in office hours was not. The TA fixed effects are represented
by a dummy indicator for each TA and allows comparisons between individuals with the same
TA while eliminating between-TA differences. The third and final specification includes both
TA fixed effects and student-level controls. Individual control variables include whether the
4 For analyzing treatment effects on survey questions “The professor cares about my performance” and “I am motivated to do well in the course” we use a probit model that accounts for a binomial outcome.
14
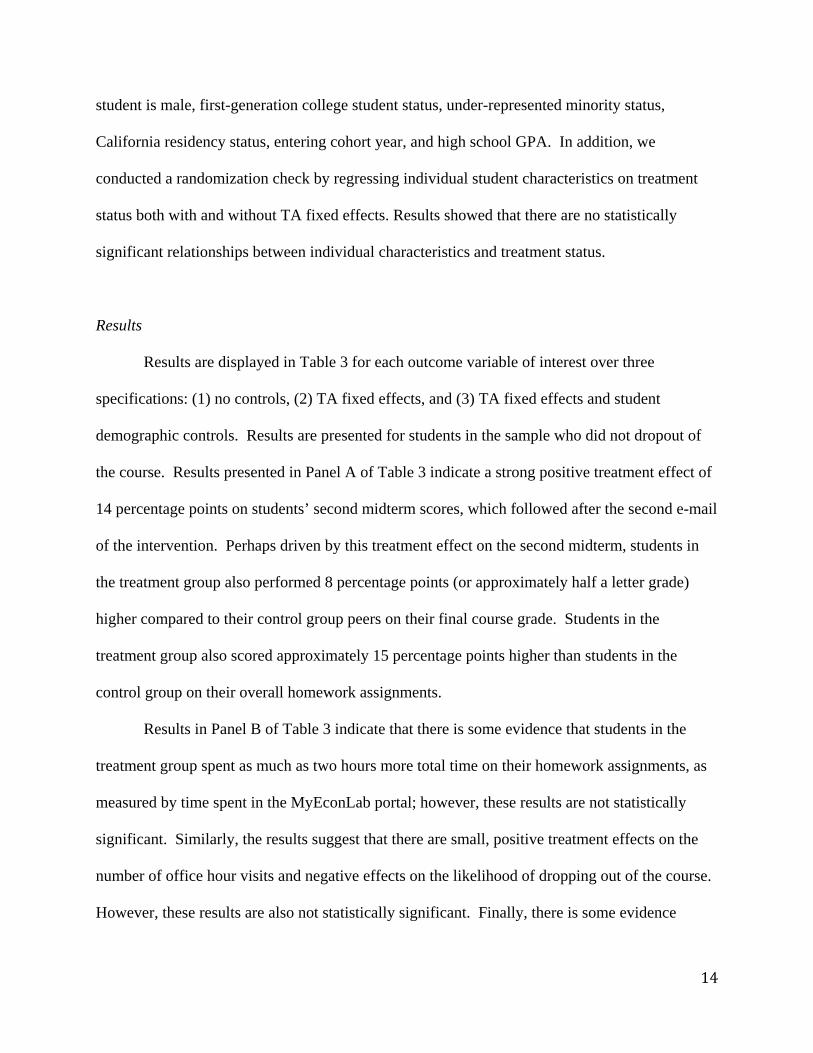
student is male, first-generation college student status, under-represented minority status,
California residency status, entering cohort year, and high school GPA. In addition, we
conducted a randomization check by regressing individual student characteristics on treatment
status both with and without TA fixed effects. Results showed that there are no statistically
significant relationships between individual characteristics and treatment status.
Results
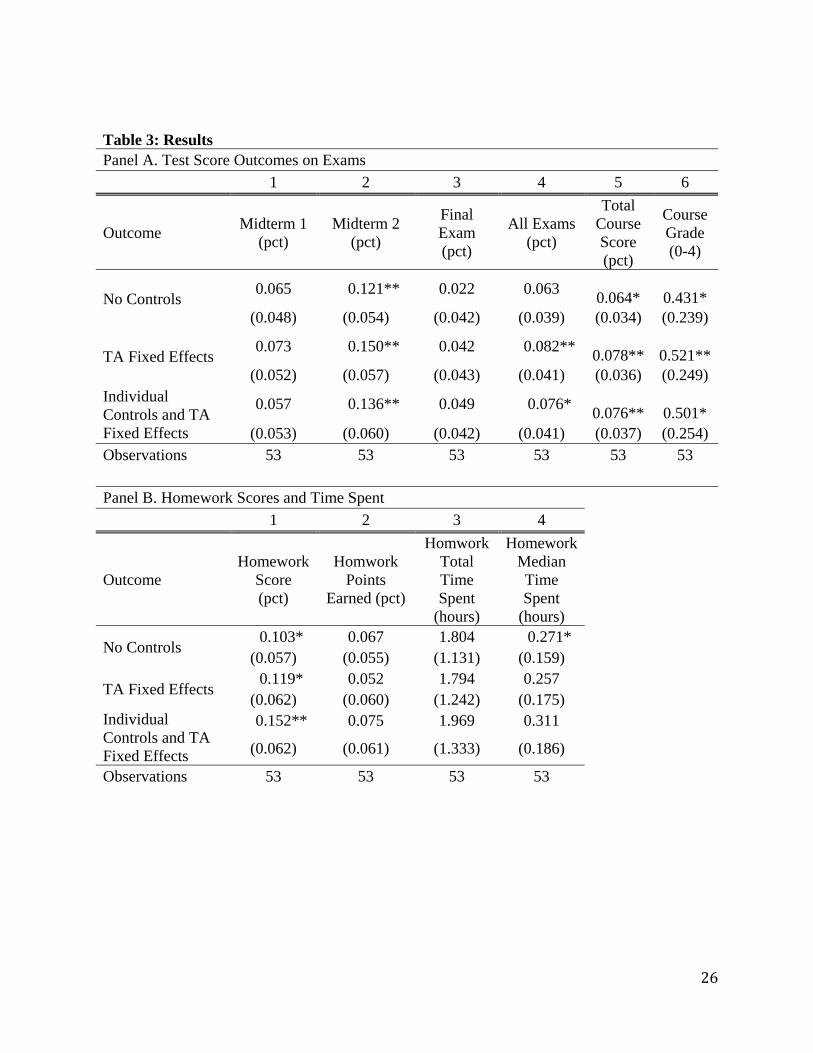
Results are displayed in Table 3 for each outcome variable of interest over three
specifications: (1) no controls, (2) TA fixed effects, and (3) TA fixed effects and student
demographic controls. Results are presented for students in the sample who did not dropout of
the course. Results presented in Panel A of Table 3 indicate a strong positive treatment effect of
14 percentage points on students’ second midterm scores, which followed after the second e-mail
of the intervention. Perhaps driven by this treatment effect on the second midterm, students in
the treatment group also performed 8 percentage points (or approximately half a letter grade)
higher compared to their control group peers on their final course grade. Students in the
treatment group also scored approximately 15 percentage points higher than students in the
control group on their overall homework assignments.
Results in Panel B of Table 3 indicate that there is some evidence that students in the
treatment group spent as much as two hours more total time on their homework assignments, as
measured by time spent in the MyEconLab portal; however, these results are not statistically
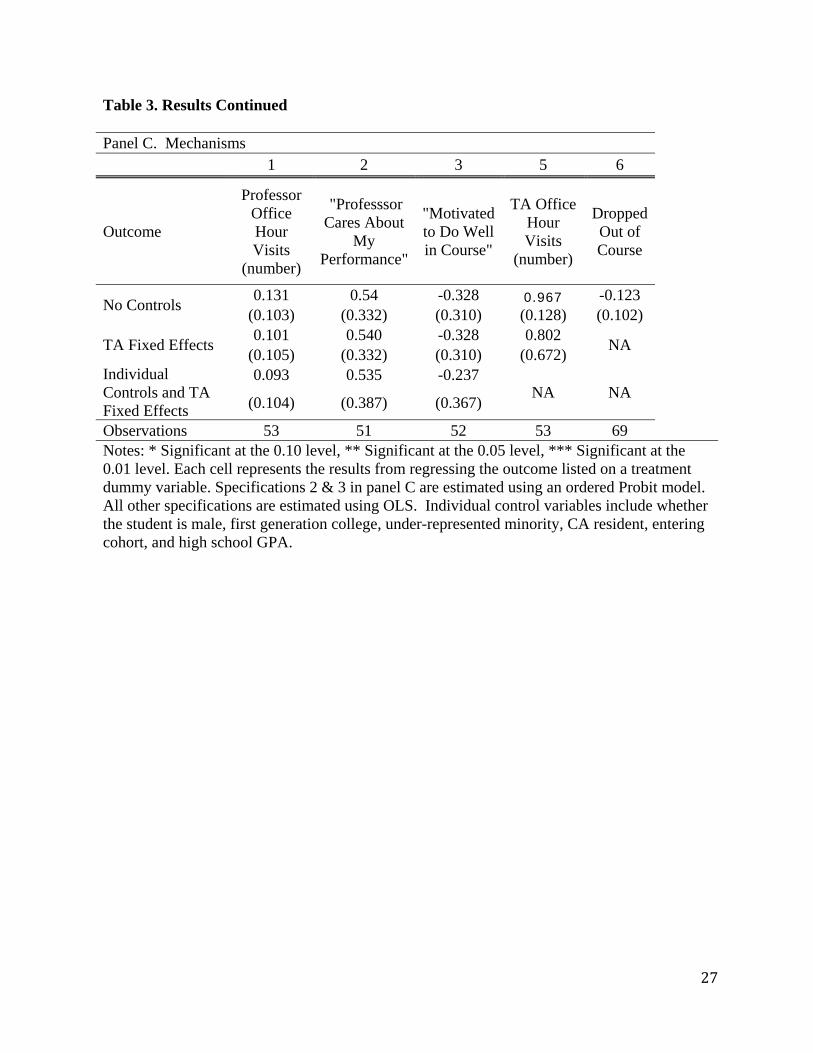
significant. Similarly, the results suggest that there are small, positive treatment effects on the
number of office hour visits and negative effects on the likelihood of dropping out of the course.
However, these results are also not statistically significant. Finally, there is some evidence
15
(Panel C) that students in the treatment group are more likely to report that their professor cares
about their performance but less likely to report that they are motivated to do well in the course.
Again, these results are not statistically significantly different from zero.
[Insert Table 3 about here]
These results suggest that a light-touch intervention that demonstrates professor engagement
can significantly affect students’ course performance. Potential mechanisms for this treatment
effects may be that students spend more time on assignments and devote more time on course
material. Alternatively, students may feel more comfortable seeking help from the professor or
TA and therefore understand the material better. A third reason may be that students feel the
professor cares about their experiences, causing them to be more motivated and engaged.
Although this study does not provide quantitative support for these plausible explanations, (due
in part to the small sample size), we do, however, have qualitative feedback that may indicate
that the third explanation, that students value the professor’s engagement and concern for their
well-being, was an important feature of the course for students in the treatment group. Several
students from the treatment group wrote e-mails expressing their gratitude towards this
individual attention. Examples of this feedback include:
I'd…like to thank you for offering your help in such a kind manner, I've rarely seen
teachers at this school respond to missed assignments the way you have. I'll be sure
to complete future assignments in a timely manner, the first practice homework was
indeed pretty helpful.
Thanks for talking to me about my homework and test scores. Even though you have a
couple hundred students, I really appreciate the effort you put into making it personal
16
for your students. I would have gone to office hours the first time you emailed me, but
I simply forgot by the end of the week.
This class is fulfilling a GE for me and my other classes do rank higher on my list.
While I do enjoy microeconomics and usually aim to only take GE's that interest me,
I'm just too busy to spend too much time on the homework. I definitely plan to study
and practice extensively for the tests, but not make it a priority, which I know is not
ideal but a reality for this quarter. But once again, thanks for the email, I really
appreciate what you're doing and I do wish more professors do what you are doing.
It is worth noting that each of these comments suggest that students are appreciative primarily of
the contact between them and the professor, rather than the information provided itself. These e-
mails indicate that students are not accustomed to receiving individualized attention from their
professors in large, introductory courses and that they are appreciative of such gestures.
Unfortunately, given the small-scale nature of the study, we were not able to fully interrogate the
mechanisms by which the treatment effects were found.
Discussion & Conclusion
The results of this study provide experimental evidence that professor feedback to students at
early stages in their course-taking in college has significant effects on course performance. We
also have limited evidence from student feedback that students recognize and appreciate this
targeted approach on behalf of the professor in a positive light. These contributions are
important as they provide avenues for further research along this often overlooked but important
dimension of student retention in higher education.
17
By conveying beliefs in students’ abilities to succeed in the course and in college more
generally, college instructors have an important way to directly and indirectly contribute to
college success: directly through the intended transfer of content knowledge and/or skills and
indirectly through boosting students’ sense of self-efficacy. Students’ beliefs about college and
how they process early difficulties can influence their postsecondary trajectory. These notions
are not unrelated to the now popularized self-affirmation theory, which suggests that people are
inherently motivated to see themselves as competent and in control of their future. When this is
threatened, people work to restore their self-worth (Yeager & Walton 2011; Steele 1988;
Sherman & Cohen 2006). There are a variety of interventions testing self-affirmation theory in
the field, including one described in Paul Tough’s New York Times magazine article, Who Gets
to Graduate (May 15, 2014). Although our intervention does not include activities that directly
test self-affirmation theory, we nevertheless know that validation at a challenging transition
could improve an individual’s trajectory (Cohen et al. 2009). Thus, we hypothesize that
feedback and encouragement earlier in an academic transition, particularly from a faculty
member, could trigger a host of positive effects (e.g. improved self-efficacy), or avert a
downward cycle of self-doubt that may lead to premature departure from college.
As this is a small-scale study with a small sample size, we were unable to more fully
identify the mechanisms by which such large positive effects occur, or to test different methods
of delivery of the intervention (e.g., texting or written feedback). As a result, we can only
speculate from the direct student feedback that the identification and contact with students was
perhaps more important than the content of the e-mails per se; however, we cannot confirm this
hypothesis. In addition, we were unable to explore heterogeneity of effects by different types of
students (e.g., freshman vs. seniors, or first-generation students vs. peers with college-educated
18
parents), differences which are likely to exist, given the psychological nature of the intervention
and the importance of such factors in higher education retention and success. Future studies may
also want to explore whether there is variation in effect size by university or course type. Still,
from the large and robust effects presented using a rigorous empirical strategy, we can be certain
that professors can play an important role in the retention and success of students in large,
introductory courses, and that early interventions that target students should be continued to be
developed and studied.
This intervention provided students with, at minimum, a “nudge” 5 from faculty in two
critical areas: recognition of their performance in the class and encouragement and direction for
further success. Our hypothesis is that having direct feedback from faculty that is both
individualized in knowledge of the student’s progress in the course and encouraging about their
potential success could be a powerful motivator. Faculty are often an untapped source of
(dis)encouragement and/or support for college students aspiring to obtain a degree. Despite
considerable conjecture about the role of faculty, we have very limited evidence about their
potential influence; this study suggests they can play a critical role in improving student success,
even in a “light touch” way.
5 Recent experiments in behavioral economics also suggest that individuals can benefit from a “nudge” to complete tasks (Thaler & Sunstein, 2009).
19
REFERENCES American Association of State Colleges and Universities. (2005). Student success in state
colleges and universities: A matter of culture and leadership. Report of the American Assocation of State Colleges and Universities. Retrieved from http://www.aascu.org.
Angrist, J., Lang, D., & Oreopoulos, P.( 2009). Incentives and services for college achievement: Evidence from a randomized trial. American Economic Journal: Applied Economics, 1(1), 136-63.
Angrist, J. Oreopoulos, P. & Williams, T. (2014). When Opportunity Knocks, Who Answers? New Evidence on College Achievement Awards. Forthcoming, Journal of Human Resources.
Astin, A. W. (1993). What matters in college? Four Critical Years revisited. San Francisco:
Jossey-Bass. Avery, C. & Kane, T. (2004). Student Perceptions of College Opportunities. The Boston
COACH Program. In Caroline Hoxby ed, College Choices: The Economics of Where to Go, When to Go, and How to Pay For It, Chicago: University of Chicago Press, pages 355-394.
Balzer, W. K., Doherty, M. E., & O’Connor, R., Jr. (1989). Effects of cognitive feedback on performance. Psychological Bulletin, 106(3), 410–433.
Bandura, A. (1993). Perceived Self-Efficacy in Cognitive Development and Functioning. Educational Psychologist, 28(2), 117-148.
Bandura, A., & Schunk, D. H. (1981). Cultivating Competence, Self-Efficacy, and Intrinsic Interest Through Proximal Self-Motivation. Journal of Personality and Social Psychology, 41(3), 586-598.
Baum, S., Ma, J., & Payea, K. (2013) Education pays: The benefits of higher education for individuals and society. Retrieved from The College Board website: http://trends.collegeboard.org/sites/default/files/education-pays-2013-full-report.pdf
Bettinger, E. P., & Baker, R. B. (2014). The effects of student coaching: An evaluation of a randomized experiment in student advising. Educational Evaluation and Policy Analysis, 36(1), 3-19.
Bettinger, E. P., Long, B. T., Oreopoulos, P., & Sanbonmatsu, L. (2012) The role of application assistance and information in college decisions: From the H&R Block FAFSA experiment. The Quarterly Journal of Economics 127(3), 1205-1242.
20
Bound, J., Lovenheim, M. F., & Turner, S. (2010). Why have college completion rates declined? An analysis of changing student preparation and collegiate resources. American Economic Journal: Applied Economics, 2(3), 129-57.
Bound, J., Lovenheim, M. F., & Turner, S. (2012). Increasing time to baccalaureate degree in the United States. Education Finance and Policy, 7(4), 375-424.
Braxton, J. M. (2000). Reworking the student departure puzzle. Nashville, TN: Vanderbilt University Press.
Calcagno, J.C., Bailey, T., Jenkins, D., Kienzl, G., & Leinbach, T. (2008). Community college student success: What institutional characteristics make a difference? Economics of Education Review, 27, 632–645.
Carey, K. (2005). One step from the finish line: Higher college-graduation rates are within our reach. Washington, D.C.: The Education Trust.
Carrell, S., & Sacerdote, B. (2013). Late interventions matter too: The case of college coaching New Hampshire (NBER Working Paper 19031). Cambridge, MA: National Bureau of Economic Research. Retrieved from http://www.nber.org
Carrell, S. E., Page, M. E., & West, J. E. (2010). Sex and Science: How Professor Gender
Perpetuates the Gender Gap. The Quarterly Journal of Economics, 125(3): 1101-1144. Carrell, S.E. & West, J.E. (2010). Does professor quality matter? Evidence from random
assignment of students to professors. Journal of Political Economy, 118(3): 409-432.
Castleman, B.L., Page, L.C., & Schooley, K. (2014). The forgotten summer: Mitigating summer attrition among college-intending low-income high school graduates. The Journal of Policy Analysis and Management
Cohen, G. L., Garcia, J., Purdie-Vaughns, V., Apfel, N., & Brzustoski, P. (2009). Recursive processes in self-affirmation: Intervening to close the minority achievement gap. Science, 324, 400-403.
Fairlie, Hoffman, & Oreopoulos, P. (2013). A community college instructor like me: Race and
ethnicity interactions in the classroom. American Economic Review.
Habley, W. R., Bloom, J. L., & Robbins, S. (2012). Increasing persistence: Research-based strategies for college student success. San Franciscoo, CA: Jossey-Bass.
Hattie, J., & Timperley, H. (2007). The power of feedback. Review of Educational Research, 77(1), 81-112.
Hoffmann, F. & Oreopoulos, P. (2009). A Professor Like Me: The Influence of Instructor Gender on College Achievement, Journal of Human Resources, 44(2).
21
Horn, L., Peter, K., Rooney, K., & Malizio, A. G. (2002, July). Profile of undergraduates in U.S. postsecondary institutions. Retrieved from National Center for Education Statistics: http://nces.ed.gov/pubs2002/2002168.pdf
Hoxby, C., & Turner, S. (2013). Expanding college opportunities. Education Next, 13(4). Retrieved from http://educationnext.org/expanding-college-opportunities/
Karabenick, S. A., & Knapp, J. R. (1991). Relationship of academic help seeking to the use of learning strategies and other instrumental achievement behavior in college students. Journal of Educational Psychology, 83, 221–230.
Kluger, A. N., & DeNisi, A. (1998). Feedback interventions: Towards the understanding of a double-edge sword. Current Directions in Psychological Science, 7(3) 67–72.
Knapp, L.G., Kelly-Reid, J.E., and Ginder, S.A. (2012). Enrollment in Postsecondary Institutions, Fall 2010; Financial Statistics, Fiscal Year 2010; and Graduation Rates, Selected Cohorts, 2002-07 (NCES 2012-280). U.S. Department of Education. Washington, DC: National Center for Education Statistics
Kurlaender, M., Carrell, S., & Jackson, J. (2015). Exploring Institutional Effects of Community Colleges: Evidence from California. For Russell Sage Foundation.
Kurlaender, M., Jackson, J., Howell, J. and Grodsky, E. (2014) College Course Scarcity and Time to Degree. Economics of Education Review, 41: 24-39. Laibson D. (1997). Golden Eggs and Hyperbolic Discounting. Quarterly Journal of
Economics;112(2):443-477.
Leonhardt, D. (2014, May 27). Is College Worth It? Clearly, New Data Say. The New York Times. Retrieved from http://www.nytimes.com
Lindo, J. M., Sanders, N. J., & Oreopoulos, P. (2010). Ability, gender, and performance standards: Evidence from academic probation. American Economic Journal: Applied Economics, 2(2): 95-117.
Lotkowski, V. A., Robbins, S. B., & Noeth, R. J. (2004). The role of academic and non-academic factors in improving college remediation. Retrieved from the ACT website: www.act.org/research/policy/index.html
Melguizo, T. (2008). Quality matters: Assessing the impact of selective institutions on minority
college completion rates. Research in Higher Education 49(3), 214-236.
Oreopoulos, P. Brown, R. S., & Lavecchia, A. (2013) Pathways to Education: An Integrated Approach to Helping At-Risk High School Students. Working Paper
Pew Research Center. (2014, February). The Rising Cost of Not Going to College. Retrieved from http://www.pewsocialtrends.org/2014/02/11/the-rising-cost-of-not-going-to-college/
22
Sandy, J., Gonzalez, A., & Hilmer, M. J. (2006). Alternative paths to college completion: Effect of attending a 2-year school on the probability of completing a 4-year degree. Economics of Education Review, 25(5), 463-471.
Scrivener, S., Weiss, M.J., Ratledge, A., Rudd, T., Sommo, C. & Fresques, H. (2015 February). Doubling Graduation Rates: Three-Year Effects of CUNY’s Accelerated Study in Associate Programs (ASAP) for Developmental Education Students. MDRC Report.
Sherman, D. K., & Cohen, G. L. (2006). The psychology of self-defense: Self-affirmation theory. In M. P. Zanna (Ed.) Advances in experimental social psychology, 38, 183-242. San Diego, CA: Academic Press.
Small, M. L., & Winship, C. (2007). Black students’ graduation from elite colleges: Institutional characteristics and between-institution differences. Social Science Research, 36(3), 1257-1275.
Smith, J. I. & Stange, K. (2013). The Effects of College Sector and Peers on Degree Attainment. Working Paper.
Snyder, T.D., & Dillow, S.A. (2013). Digest of Education Statistics 2012 (NCES 2014-015). National Center for Education Statistics, Institute of Education Sciences. Washington, D.C.: U.S. Department of Education.
Sommo, C., Mayer, A., Rudd, T., & Cullinan, D. (2012). Six-Year Effects of a Freshman Learning Community Program at Kingsborough Community College. MDRC Report.
Stange, K. (2012). An empirical investigation of the option value of college enrollment. American Economic Journal: Applied Economics, 4(1), 49-84.
Steele, C. M. (1988). The psychology of self-affirmation: Sustaining the integrity of the self. In
L.Berkowitz (Ed.), Advances in experimental social psychology. NewYork: Academic Press.
Thaler, R. H., & Sunstein, C. R. (2008). Nudge: Improving Decisions about Health, Wealth, and Happiness. New London, CN: Yale University Press.
Thaler, R.H. & Sunstein, C.R. (2009). Nudge: Improving Decisions About Health, Wealth and Happiness. Penguin Books: London, England.
Tinto, V. (1993). Leaving College: Rethinking the Causes and Cures of Student Attrition. (2nd ed.). Chicago: University of Chicago Press.
Tough, P. (2014, May, 15). Who gets to graduate? New York Times Magazine. Retrieved from http://www.nytimes.com/2014/05/18/magazine/who-gets-to-graduate.html?_r=0
Turner, S. E. (2004). Going to college and finishing college. Explaining different educational outcomes. In C. Hoxby (Ed.), College choices: The economics of where to go, when to go, and how to pay for it (pp. 13–62). Chicago, IL: University of Chicago Press.
23
Umbach, P. D., & Wawrzynski, M. R. (2005). Faculty do matter: The role of college faculty in student learning and engagement. Research in Higher Education, 46(2), 153-184.
Visher, M. G., Weiss, M. J., Weissman, E., Rudd, T., & Wathington, H. D. (2012). The Effects of Learning Communities for Students in Developmental Education: A Synthesis of Findings from Six Community Colleges. MDRC Report.
Yeado, J., Haycock, K., Johnstone, R. & Chaplot, P. (2014). Learning From High-Performing and Fast-Gaining Institutions, The Education Trust. Retrieved from http://www.edtrust.org/ higher_ ed_practice_guide
Yeager, D. S. & Walton, G. M. (2011). Social-psychological interventions in education: They’re not magic. Review of Educational Research, 81, 267-301.
24
Tables
Table 1. Descriptive Statistics Variable No. Obs. Mean SD Min. Max. Outcomes Midterm 1 (%) 53 0.74 0.17 0.33 1Midterm 2 (%) 53 0.68 0.20 0 1Final Exam (%) 53 0.64 0.15 0 0.95All Exams (%) 53 0.68 0.14 0 0.93Total Course Score (%) 53 0.72 0.13 0.21 0.94Course Grade (0-4) 53 2.40 0.89 0 4Homework Score (%) 53 0.93 0.20 0 1Homework Points Earned (%) 53 0.55 0.21 0 0.88Homework Total Time Spent (hours) 53 7.05 4.16 0 14.82Homework Median Time Spent (hours) 53 0.85 0.59 0 2.38Prof Cares About My Performance 51 2.39 0.87 0 3Motivated to Do Well in Course 52 3.02 1.02 0 4Total Office Hour Visits (number) 53 2.32 2.29 0 9Dropped Out of Course (%) 69 0.23 0.43 0 1Controls Male 53 0.68 0.47 0 1First Generation College Goer 53 0.26 0.45 0 1HS GPA 53 3.77 0.37 2.87 4.24Under-represented Minority 53 0.23 0.42 0 1State Resident 53 0.89 0.32 0 1Entering Cohort 53 2012.43 0.69 2011 2013
25
Table 2. Descriptive Statistics by Treatment and Control
Treatment Group Control Group
Outcomes
No. Obs
. Mean SD No. Obs. Mean SD
Midterm 1 (%) 29 0.77 0.18 24 0.71 0.17Midterm 2 (%) 29 0.73 0.17 24 0.61 0.23Final Exam (%) 29 0.65 0.13 24 0.63 0.18All Exams (%) 29 0.71 0.13 24 0.65 0.16Total Course Score (%) 29 0.75 0.11 24 0.68 0.14Course Grade (0-4) 29 2.59 0.90 24 2.16 0.83Homework Score (%) 29 0.96 0.12 24 0.89 0.26Homework Points Earned (%) 29 0.59 0.21 24 0.49 0.20Homework Total Time Spent (hours) 29 7.87 4.22 24 6.06 3.94Homework Median Time Spent (hours) 29 0.97 0.54 24 0.70 0.62Prof Cares About My Performance 29 2.55 0.78 22 2.18 0.96Motivated to Do Well in Course 29 2.90 1.05 23 3.17 0.98Total Office Hour Visits (number) 29 2.76 2.46 24 1.79 2.00Dropped Out of Course (%) 35 0.17 0.38 34 0.29 0.46Controls Male 29 0.66 0.48 24 0.71 0.46First Generation College Goer 29 0.28 0.45 24 0.25 0.44HS GPA 29 3.82 0.35 24 3.72 0.40Under-represented Minority 29 0.17 0.38 24 0.29 0.46State Resident 29 0.90 0.31 24 0.88 0.34
Entering Cohort 292012.4
8 0.69 24 2012.38 0.71
26
Table 3: Results Panel A. Test Score Outcomes on Exams 1 2 3 4 5 6
Outcome Midterm 1 (pct)
Midterm 2 (pct)
Final Exam (pct)
All Exams (pct)
Total Course Score (pct)
Course Grade (0-4)
No Controls 0.065 0.121** 0.022 0.063 0.064*
0.431*
(0.048) (0.054) (0.042) (0.039) (0.034) (0.239)
TA Fixed Effects 0.073 0.150** 0.042 0.082** 0.078**
0.521**
(0.052) (0.057) (0.043) (0.041) (0.036) (0.249) Individual Controls and TA Fixed Effects
0.057 0.136** 0.049 0.076* 0.076**
0.501*
(0.053) (0.060) (0.042) (0.041) (0.037) (0.254) Observations 53 53 53 53 53 53
Panel B. Homework Scores and Time Spent 1 2 3 4
Outcome Homework
Score (pct)
Homwork Points
Earned (pct)
Homwork Total Time Spent
(hours)
Homework Median Time Spent
(hours)
No Controls 0.103* 0.067 1.804 0.271*
(0.057) (0.055) (1.131) (0.159)
TA Fixed Effects 0.119* 0.052 1.794 0.257
(0.062) (0.060) (1.242) (0.175) Individual Controls and TA Fixed Effects
0.152** 0.075 1.969 0.311
(0.062) (0.061) (1.333) (0.186)
Observations 53 53 53 53
27
Table 3. Results Continued
Panel C. Mechanisms 1 2 3 5 6
Outcome
Professor Office Hour Visits
(number)
"Professsor Cares About
My Performance"
"Motivated to Do Well in Course"
TA Office Hour Visits
(number)
Dropped Out of Course
No Controls 0.131 0.54 -0.328 0.967 -0.123 (0.103) (0.332) (0.310) (0.128) (0.102)
TA Fixed Effects 0.101 0.540 -0.328 0.802 NA (0.105) (0.332) (0.310) (0.672)
Individual Controls and TA Fixed Effects
0.093 0.535 -0.237 NA NA
(0.104) (0.387) (0.367) Observations 53 51 52 53 69 Notes: * Significant at the 0.10 level, ** Significant at the 0.05 level, *** Significant at the 0.01 level. Each cell represents the results from regressing the outcome listed on a treatment dummy variable. Specifications 2 & 3 in panel C are estimated using an ordered Probit model. All other specifications are estimated using OLS. Individual control variables include whether the student is male, first generation college, under-represented minority, CA resident, entering cohort, and high school GPA.
28
Table A1. Randomization Checks
Independent Variables Treatment
Status Treatment
Status
Male -0.155 -0.091 (0.173) (0.173)
First Generation College Goer 0.058 0.05 (0.166) (0.169)
HS GPA 0.153 0.081 (0.210) (0.214)
Under-represented Minority -0.227 -0.296 (0.196) (0.196)
CA Resident 0.2 0.139 (0.244) (0.243)
Entering Cohort==2012 -0.091 -0.162 (0.252) (0.249)
Entering Cohort==2012 0.083 -0.042
(0.239) (0.240) Observations 53 53 P-value: Joint Significance of all individual covariates 0.8905 0.8449 Includes TA Fixed Effects No Yes
Notes: * Significant at the 0.10 level, ** Significant at the 0.05 level, *** Significant at the 0.01 level. Each specification represents results for a regression where the dependent variable is an indicator for treatment status.