Embed Size (px)
Citation preview

Article
Experimental evolution of magnetite nanoparticle resistance in
Escherichia coli.
Akamu J. Ewunkem1, LaShunta Rodgers2, Daisha Campbell3, Constance Staley4, Kiran Subedi5, Sada Boyd6, and Jo-
seph L. Graves Jr7,*
1Department of Nanoscience, University of North Carolina at Greensboro,
2Department of Biology University of North Carolina at Greensboro,
3Department of Chemical, Biological, and Bioengineering, North Carolina A&T State.
University, [email protected].
4Department of Chemistry, Bennett College, [email protected].
5College of Agricultural and Environmental Sciences (CAES), North Carolina A&T State
University, [email protected].
6Department of Ecology and Evolutionary Biology, University of California, Los Angeles,
7Department of Biology, North Carolina A&T State University, [email protected]
* Correspondence: [email protected]; Tel.: 01-336-285-2858.
Abstract: Experimental evolution was utilized to produce 5 magnetite nanoparticle-resistant
(FeNP1-5) populations of Escherichia coli. The control populations were not exposed to magnetite
nanoparticles. The 24-hour growth of these replicates was evaluated in the presence of increasing
concentrations magnetite NPs as well as other ionic metals (gallium III, iron II, iron III, silver I) and
antibiotics (ampicillin, chloramphenicol, rifampicin, sulfanilamide, tetracycline). Scanning electron
microscope was utilized to determine cell size and shape in response to magnetite nanoparticle se-
lection. Whole genome sequencing was carried out to determine if any genomic changes that re-
sulted from magnetite nanoparticle resistance. After 25 days of selection magnetite resistance was
evident in the FeNP treatment. The FeNP populations also showed a highly significantly (p < 0.0001)
greater 24-growth as measured by optical density in metals (Fe (II), Fe (III), Ga (III), Ag and Cu II);
as well as antibiotics (ampicillin, chloramphenicol, rifampicin, sulfanilamide, and tetracycline).
The FeNP resistant populations also showed a significantly greater cell length compared to controls
(p < 0.001). Genomic analysis of FeNP identified both polymorphisms and hard selective sweeps in
the RNA polymerase genes rpoA, rpoB, and rpoC. Collectively, our results show that E. coli can
rapidly evolve resistance to magnetite nanoparticles and that this result is correlated resistances to
other metals and antibiotics. There were also changes in cell morphology resulting from adapta-
tion to magnetite NPs. Thus, the various applications of magnetite nanoparticles could result in
unanticipated changes in resistance to both metal and antibiotics.
Keywords: Escherichia coli, magnetite nanoparticles, metals, antibiotics, genomics, pleiotropy, cell
morphology.
Citation: Ewunkem, J.; Rodger, L.;
Campbell, D.; Staley, C.; Subedi K.;
et al. Title. Nanomaterials 2021, 11, x.
https://doi.org/10.3390/xxxxx
Preprints (www.preprints.org) | NOT PEER-REVIEWED | Posted: 1 February 2021 doi:10.20944/preprints202102.0060.v1
© 2021 by the author(s). Distributed under a Creative Commons CC BY license.

1. Introduction
Both ionic and nanoparticle iron have been proposed as a method to control multidrug resistant (MDR)
bacteria [1—3]. This idea may seem contradictory in that all organisms require iron as an essential micronu-
trient. It often serves as an enzymatic co-factor, and therefore its intracellular concentration must be tightly
regulated in order to maintain cell viability [4]. Iron is one of the most important micronutrients as it ful-
fills many biological roles [5]. Iron containing proteins (heme-proteins, iron-sulfur cluster proteins, and di-
iron and mononuclear enzymes) play roles in nitrogen fixation, metabolism and serve as electron carriers for
respiration [6]. However, despite its critical role in bacterial metabolism, acquiring iron is the greatest chal-
lenge for bacterial growth [4, 7]. Therefore, iron deficiency is one of the most common nutritional stress es-
pecially in aquatic environments [8]. The fundamental requirement for iron plays a crucial role in microbial
pathogenesis, thus many organisms utilize iron sequestration as a defense against infection [9, 10].
Yet despite iron being an essential metal, it can also be extremely toxic under aerobic conditions
[11]. There are multiple mechanisms of excess iron toxicity (see Table 1). For this reason, iron homeosta-
sis is tightly regulated. Such tight regulation associated with the bacterial requirement to acquire iron
from its environment can potentially be used as an evolutionary trap. Evolutionary traps are defined as a
situation in which an organism prefers resources that reduces its fitness [12]. Thus, in an environment where
iron is present in excess we can ask the question whether bacteria have the capacity to control either the
uptake, storage, or efflux of iron at rates sufficient to avoid toxicity? Alternatively, it is important to ask:
can and how do bacteria evolve resistance to excess iron? In addition, if they can what correlated traits will
result from the adaptation? We have already answered some of these questions in a series of experi-
ments utilizing ionic iron II, iron III, and the iron analog gallium III [13—15]. These studies utilized experi-
mental evolution and examined mechanisms of iron and gallium resistance through the evaluation of phe-
notypic and genomic changes in E. coli K-12 MG1655. We found that this strain of E. coli was capable of
evolving resistance to excess iron and gallium primarily through changes in the uptake of iron (or gallium).
Our results suggested that E. coli K-12 could respond to excess iron by both physiological acclimation and
evolutionary adaptation [13]. This was manifested by both patterns of genomic and gene expression
changes exhibited in the iron (II), iron (III), and Gallium (III)-resistant populations compared to their ances-
tors and controls (grown in the absence of excess iron or gallium).
Table 1. Mechanisms of excess iron and silver toxicity: Mechanisms of cellular damage are listed resulting
from excess iron toxicity. As these systems are common to virtually all bacteria there is a strong potential
that resistance mechanisms might be conserved across wide varieties of taxa.
Mechanism Fe
Reactive oxygen species +
Disruption of transcription/translation +
Damage to cell wall/membrane +
Interfering with respiration +
Release of cellular components +
Binding to thiol groups +
Preprints (www.preprints.org) | NOT PEER-REVIEWED | Posted: 1 February 2021 doi:10.20944/preprints202102.0060.v1

In this study we examine whether experimental evolution against spherical magnetite nanoparti-
cles (FeNPs) will result in similar outcomes as those observed resulting from selection for ionic iron (II, III)
resistance. Nanoparticles (NPs) are particles between 1 and 100 nanometers in size [16]. NPs are broadly
classified into various categories depending on their morphology, size, and chemical properties [17, 18].
Metallic ferrous nanoparticles are one of the most studied nanomaterials against multidrug-resistant bacte-
ria [19]. The three most common naturally occurring forms of metallic ferrous NPs are hematite (α-Fe2O3),
maghemite (γ-Fe2O3) and magnetite (Fe3O4 or FeO.Fe2O3). Magnetite is a black iron oxide, commonly
called Hercules stone and possesses the strongest magnetic behavior [20]. Magnetite is considered as a
charge frustrated iron oxide due to the distribution of both iron (II) and (III) in crystallographic sublattice
sites [21].
Magnetite NP’s exist in nature and engineered FeNPs are widely used in a range of applications due
to their advanced optical properties [18]. FeNPs can be used to determine oxygen concentrations [22—24].
FeNPs are involved in orientation, navigation, and iron metabolism in prokaryotic and eukaryotic cells [22,
25]. FeNPs are extensively used for applications in biomedicine and bioanalytics [26—31]. FeNPs are also
now use for antimicrobial applications due to their very small in size and high surface area to volume [32,
33]. FeNPs disseminate ionic iron II and iron III species with low toxicity to eukaryotic host cells minimizing
undesirable side effects [29, 34—36]. The antibacterial properties of the FeNPs have been tested against Ba-
cillus cereus, Escherichia coli, and Candida albicans, Staphylococcus aureus and Pseudomonas aeruginosa
and Serratia marcescens [34, 37].
However, none of these studies considered the possibility that bacteria could evolve resistance to
FeNPs. Therefore, it is of paramount importance to describe mechanisms by which bacteria can become re-
sistant to magnetite NP’s and determine if resistance to magnetite nanoparticles confers resistance to ionic
metals and antibiotics in order to fill gaps in our knowledge. In this study, we investigated how rapidly
bacteria can evolve resistance to FeNPs; and evaluated the nature of the genomic changes responsible for
that resistance. In addition, we wanted to determine is magnetite resistance conferred correlated resistances
to ionic metals and antibiotics. Finally, we wished to determine the similarity of phenotypic and genomic
changed due to magnetite to those produced by ionic iron (II) and (III) resistance.
2. Materials and Methods
Bacterial strains
E. coli MG1655 (ATCC #47076) was used in this study because it does not have plasmids and its circular
chromosome is composed of 4,641,652 nucleotides (GenBank: NC_000913.3; Riley et al. 2006). All of our
previous studies of ionic and nanoparticle resistance have used this strain [13—15]. This strain is the ances-
tor of all the selection treatments (FeNP and Controls) evaluated in this study.
Evolution experiment
E. coli MG1655 (ATCC #47076) was routinely cultured in Davis Minimal Broth (DMB, Difco™Sparks, MD) with
1 gram per liter of Dextrose (Dextrose, Fisher Scientific, Fair Lawn, NJ) as the sole carbon source. The broth
was supplemented with thiamine hydrochloride 10 L in a final volume of 10 ml of total culture maintained
in 50 ml Erlenmeyer flasks. The Bacteria were incubated at 37 °C in broth at 150 rpm overnight and propagated
by transferring 0.1 ml into 9.9 ml of fresh sterile DMB daily. We established 5 populations within the magnetite
NP-selection treatment. Each population was founded from a unique colony resulting from serial
Preprints (www.preprints.org) | NOT PEER-REVIEWED | Posted: 1 February 2021 doi:10.20944/preprints202102.0060.v1

dilution after 24-hour growth of the ancestral E. coli K-12 MG1655 sample. These replicates were ex-
posed daily to 750mg/L 20 nm spherical PVP-coated FeNPs (designated FeNP1—5). The magnetite nano-
particles were obtained from Nanocomposix (San Diego, CA). The concentrations utilized to initiate the
selection experiment were determined by minimum inhibitory assay (MIC, described below). The controls
(designated C1–C5) were cultured in standard DMB medium without the addition of magnetite nanoparti-
cles.
Determination of Minimal inhibitory concentration (MIC) of Magnetite NPs
Minimum inhibitory concentration (MIC) values were assessed by measuring the growth rates of E. coli K-12
MG1655 by estimating their optical density at 625 nm (OD625). OD625 is an absorbance measurement at a
wavelength of 625 nm in an accuSkan Go spectrophotometer (Fisher Scientific, USA). MIC is defined as the
lowest concentration of an antimicrobial that will inhibit the visible growth by ~90% after 24 h of incubation
at 37°C compared with a growth control [38]. These values were determined by broth dilutions in a 96‐well
microtiter plate format consisting of ten concentrations (0-5000 mg/L) in triplicates of magnetite NPs. The
plates were incubated at 37°C and agitated at 600 rpm in an I2500 Series incubator shaker (New Brunswick
Scientific, USA). The OD625 was measured after incubation at 37°C for 24 h. The MIC was determined to be
1000.0 mg/L. A sub-MIC value (750 mg/L) was chosen to initiate the selection experiment. This value al-
lowed for the initial growth of cultures without causing their extinction.
Phenotypic assays: 24-hour growth
To determine if magnetite NP resistance confers correlated resistances to other metals and antibiotics, as-
says were conducted to assess 24-hour growth to different concentrations of ionic forms of metals [Ag (I),
Fe (II), Fe (III), Ga (III)] and the antibiotics [ampicillin, chloramphenicol, rifampicin, tetracycline]. These
heavy metals and antibiotics and are known to have different mechanisms of action. The ancestral strain
was grown for 24 hours in DMB broth and serial dilution was used to pick 5 independent colonies. These
in turn were used to found replicates grown for 24 hours and placed into the various phenotypic assays.
The FeNP and control populations were sampled at 25 days in their various media for use in these assays.
Bacterial growth was assessed by measuring at turbidity at 625 nm for hours 0 and 24h, using a 98-well
plate format accuSkan Go spectrophotometer (Fisher Scientific, USA) using clear polyester 98-well plates
Genomic analysis
Whole genome resequencing was utilized to identify genomic variants associated with FeNP and control
populations. DNA was extracted from each replicate population at 25 days of selection in magnetite NP us-
ing EZNA Bacterial DNA kit (OMEGA) following manufacturer instruction. DNA concentrations were deter-
mined fluorometrically using the QuantiFluor® ONE dsDNA System (Promega Corporation, Madison, WI,
USA) on a Quantus® fluorometer (Promega Corporation). Measurements were performed according to the
manufacturer’s recommendations. Genomic libraries were prepared using the standard protocol as de-
scribed in the manufacturer’s instructions (Illumina, Nextera DNA Flex Library Prep Reference Guide). All the
reagents used are included in the Nextera DNA Flex kit (Illumina, cat. Nos. 20,018,704, 20,018,705).
The quality of the final library was verified using D1000 Screen Tape (Agilent Technologies, CA, USA) follow-
ing the manufacturer’s instruction. Library concentration was measured using the fluorometric
Preprints (www.preprints.org) | NOT PEER-REVIEWED | Posted: 1 February 2021 doi:10.20944/preprints202102.0060.v1
quantification using the dsDNA binding dye as previously described and diluted 12pM with Resuspension
Buffer. The pooled libraries were then run on an Illumina MiSeq (Illumina, San Diego, CA) using the MiSeq
v3 reagent kit. The depth of coverage of the sequencing runs ranged from ~20X to ~80X, with most ex-
ceeding 40X coverage. The SRA accession number for sequencing data is PRJNA694183 (FeNP-resistant,
FeNP1—5_D28 and controls, C1—5_D28).
Sequence alignment and variant calling from the samples was achieved by use of the breseq 0.30.0 pipeline
set to polymorphism mode (-p) and default parameters [39]. The pipeline makes use of three types of
evidence to predict mutations, read alignments (RA), missing coverage (MC), and new junctions (JC) [40].
Reads that shows a distinction between the sample and the reference genome that cannot be resolved to
describe precise genetic changes are considered “unassigned” and would not be described nor interpreted.
Finally, we report here only genomic variants that were not present in the ancestral population. Variants
in our ancestral founding populations that differ from the E. coli K-12 MG1655 reference genome are re-
ported in our previous studies [41, 42].
Preparation of cells for scanning election microscope
Scanning electron microscopy (SEM) is widely used to measure changes in morphology of bacteria [43]. Af-
ter resistance to FeNPs was observed (at 25d of selection) the outer morphology of the bacterial cells was
examined using a Carl Zeiss Auriga-BU FIB FESEM (FESEM) (Carl Zeiss, Jona, Germany). Briefly, bacterial
samples from each population were placed on cover slips after 10 minutes of incubation at room tempera-
ture, the samples were gently removed. Thereafter, the bacteria were fixed with Karnovsky fixative and incu-
bated at 4°C overnight. Following incubation, the samples were dehydrated with graded ethanol and then
air-dried. The samples were then sputtered to avoid charging in the microscope. The images were acquired
at a working distance of 7mm and an accelerating voltage of 3kV.
Inductively Coupled Plasma Optical Emission Spectrometry (ICP-OES) Analysis
The amount of ionic materials released into solution by metallic nanoparticles vary considerably depending
upon conditions of the medium [44]. For this reason, an ICP-OES study was performed to determine or de-
fine the sublethal concentration of iron in samples utilized for MIC assays at 12 and 24h. Operating condi-
tions are shown in Appendix A Table A1. Each sample was carefully pipetted and transferred to digestion
tubes followed by the addition of concentrated nitric acid (67-70) % purchased from Fisher Scientific. After
allowing for a 15-minute pre-digestion procedure, the samples were digested in an automated sequential
microwave digester, MARS 5 (CEM Microwave Technology Ltd., North Carolina, USA). The final product
was a clean, transparent aqueous solution which was further diluted to a volume of 50ml using double DI
water. The concentration of acid in the final solution was <5%. A set of matrix matched standards were
prepared to set up a calibration curve. All the samples were analyzed by using Optima 8300 (PerkinElmer,
Inc. Shelton, CT, USA) in axial mode.
Statistical Analysis
Preprints (www.preprints.org) | NOT PEER-REVIEWED | Posted: 1 February 2021 doi:10.20944/preprints202102.0060.v1

Statistical analysis of the effect of selection regime and concentration (and their interaction) for all 24-hour
growth data was performed via General Linear Model utilizing SPSS version 26 (SPSS Inc, Armonk, NY, USA).
All graphs in this paper were made via Prism 9 software. Finally, the phenotypic data from these studies
will be submitted into DRYAD (https://datadryad.org/ ) upon acceptance of this manuscript for publication.
3. Results
Escherichia coli can rapidly evolve resistance to stressful levels of magnetite NPs:
The FeNP populations showed statistically significantly greater 24-hour growth compared to the controls
with increasing concentration in every substance tested as tested by general linear model that examined the
effect of population, concentration of substance, and their interaction. The F and p values for all pheno-
typic assays (antibiotics and metals) are given in Table 2a. The controls showed statistically significantly
greater growth compared to the ancestors for all substances tested except for ampicillin and rifampicin.
As the comparison for magnetite, silver (I), and chloramphenicol was not as clear, general linear model re-
sults are reported for these substances in Table 2b. The 24-hour growth after 25 days of selection in mag-
netite showed that FeNP populations exhibited a highly significantly superior growth compared to the con-
trol and ancestral populations across all concentration of magnetite NP (Figure 1). The FeNP populations
show statistically significant greater growth than either the controls or ancestors from 250—1750 mg/L.
The 24-hour growth of the FeNP population increased across this range while that of the control and ances-
tors decreased until there was very little growth from 500—1750 mg/L. There was no observable growth
for any population at 2500 mg/L (data not shown).
Table 2a. General Linear Model Results for Phenotypic assays, FeNP v. Control
Substance Pop. Effect (F, p) Conc. Effect (F, p) Interaction (F, p)
magnetite 383.9, 0.001 42.5, 0.001 25.9, 0.001
ampicillin 283.1, 0.001 17.1, 0.001 16.7, 0.001
chloramphenicol 71.1, 0.001 114.6, 0.001 7.9, 0.001
rifampicin 1,285.1, 0.001 16.3, 0.001 16.5, 0.001
tetracycline 62.9, 0.001 12.6, 0.001 5.7, 0.001
iron (II) 18.6, 0.001 88.0, 0.001 1.7, 0.116
iron (III) 42.9, 0.001 77.4, 0.001 2.7, 0.011
gallium (III) 29.8, 0.001 111.8, 0.001 1.2, 0.278
silver (I) 7.1, 0.009 15.8, 0.001 2.3, 0.029
Table 2b. General Linear Model Results for Phenotypic assays, Control v. Ancestor
Substance Pop. Effect (F, p) Conc. Effect (F, p) Interaction (F, p)
magnetite 9.5, 0.003 22.7, 0.001 12.8, 0.001
Preprints (www.preprints.org) | NOT PEER-REVIEWED | Posted: 1 February 2021 doi:10.20944/preprints202102.0060.v1

chloramphenicol 159.1, 0.001 25.7, 0.001 22.6, 0.001
silver (I) 243.1, 0.001 10.4, 0.001 15.6, 0.001
Metal resistance
Measurement of 24-hr growth in excess metal (iron (II), iron (III), gallium (III), silver (I)) was accessed for the
FeNP, control, and ancestral populations at 25 days of evolution (Figures 2a-d). The FeNP showed highly
statistically greater 24-hour growth across concentration compared to the controls which were greater than
the ancestors in magnetite, iron (II), iron (III), gallium (III), and silver (I) Table 2a. Iron (II) and iron (III) are
of particular interest to this study because in solution, magnetite nanoparticles release both iron (II) and
iron (III) ions into the medium. Measurements by ICP-OES determined how much of each of these spe-
cies was released relative to the measured mass of that species added to DMB medium (Appendix A Table
A2, figures A1—A3). These figures show that the actual amount of iron entering into solution was always
considerably less than the measured amounts initially added to the medium. The iron contents in these
solutions were in the following order magnetite NPs > iron (III) > iron (II). The method presented was as-
sessed by utilizing aliquots and dilutions of magnetite NPs, iron (II), and iron (III). The emission line used for
the quantification of Fe (II) was 259.9 nm. Results showed high precision with the relative standard deviation
(RSD) values for most of the samples < 2%. The plotted calibration curve was linear with a R2 value >
0.999.
The controls also showed statistically greater growth in all metals across concentration compared to the an-
cestor.
Preprints (www.preprints.org) | NOT PEER-REVIEWED | Posted: 1 February 2021 doi:10.20944/preprints202102.0060.v1

Antibiotic resistance
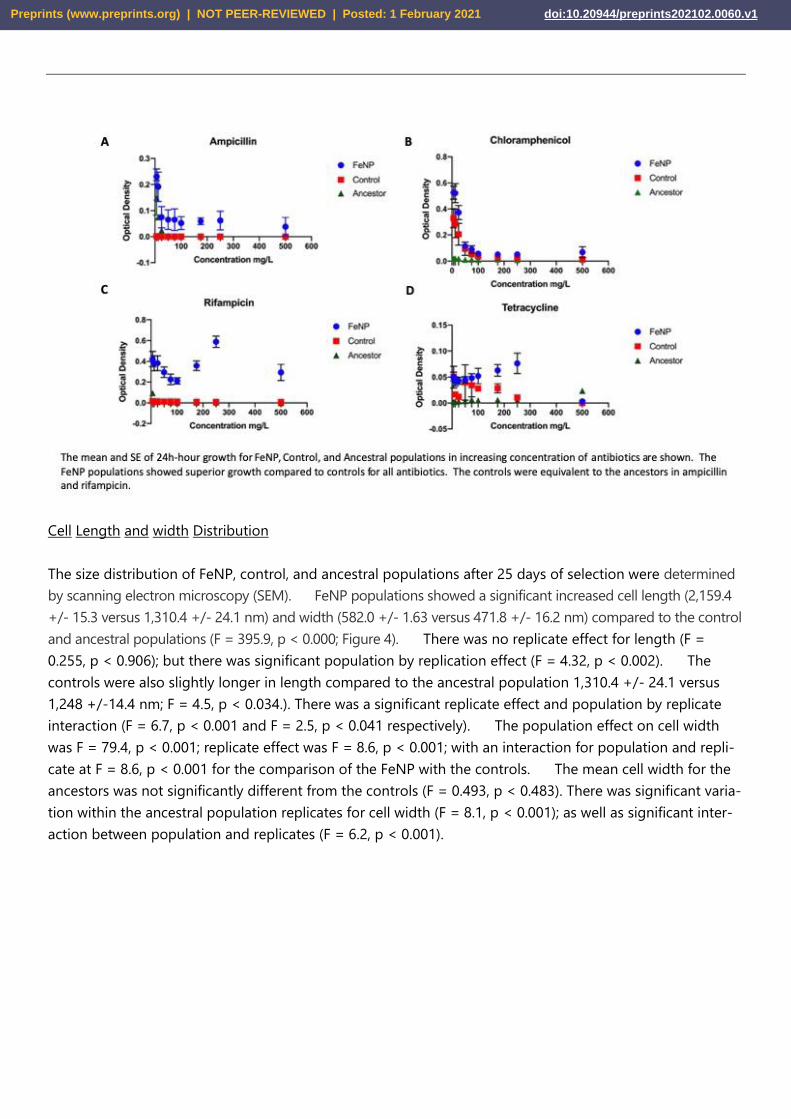
The FeNP populations, controls, and ancestors were evaluated at 25 days of evolution for general antibiotic
resistance (Fig. 3a-d). FeNP populations showed superior growth in ampicillin and rifampicin compared
to controls and the ancestral population at all concentrations (Figure 3a—d). FeNP populations showed
significantly greater growth compared to the controls and ancestors for variable ranges in (chloramphenicol
(6—12 mg/L); tetracycline (75—250 mg/L). The controls showed superior growth compared to the ancestral
population in chloramphenicol (6—50 mg/l); and tetracycline 6—175 mg/L). All populations showed a
reduction in growth with increasing concentration of antibiotics. All comparisons between FeNP and con-
trols in antibiotics showed a significant interaction effect, indicating that the functional response to the anti-
biotic differed between these populations (Table 2a). Similarly, in the comparison of the controls to the an-
cestors, significant interaction effects were also seen for all antibiotics (Table 2b).
Preprints (www.preprints.org) | NOT PEER-REVIEWED | Posted: 1 February 2021 doi:10.20944/preprints202102.0060.v1
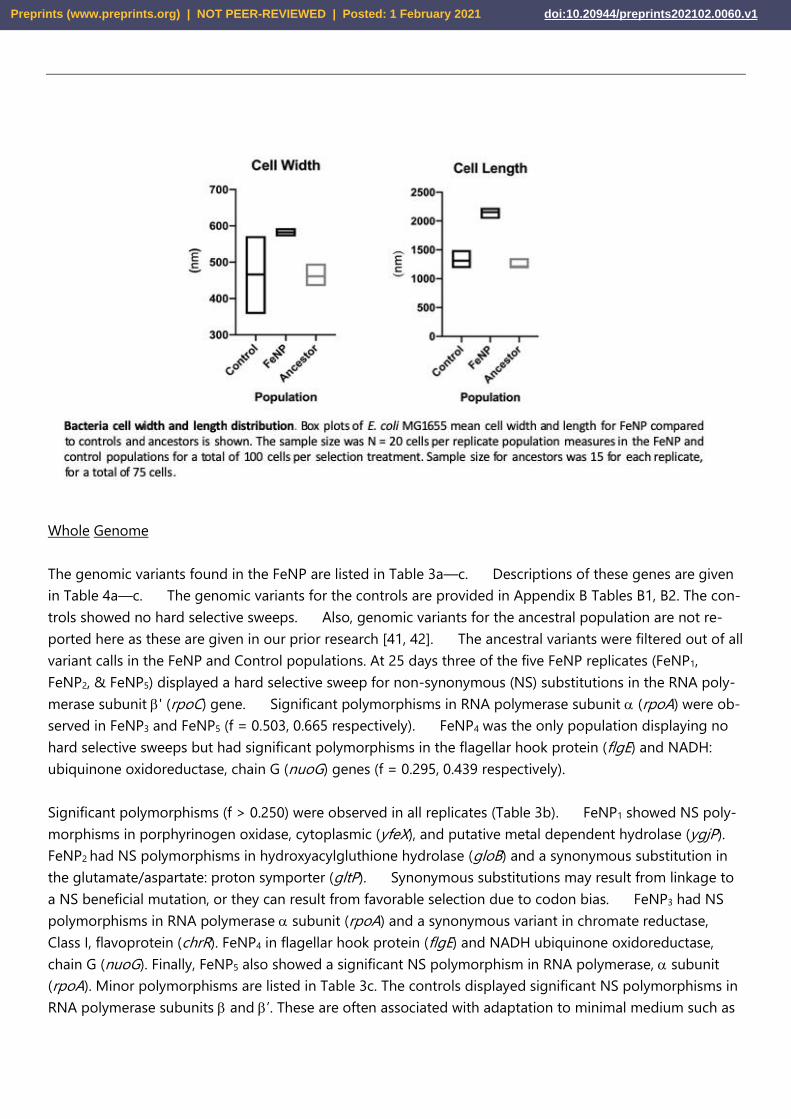
Cell Length and width Distribution
The size distribution of FeNP, control, and ancestral populations after 25 days of selection were determined
by scanning electron microscopy (SEM). FeNP populations showed a significant increased cell length (2,159.4
+/- 15.3 versus 1,310.4 +/- 24.1 nm) and width (582.0 +/- 1.63 versus 471.8 +/- 16.2 nm) compared to the control
and ancestral populations (F = 395.9, p < 0.000; Figure 4). There was no replicate effect for length (F =
0.255, p < 0.906); but there was significant population by replication effect (F = 4.32, p < 0.002). The
controls were also slightly longer in length compared to the ancestral population 1,310.4 +/- 24.1 versus
1,248 +/-14.4 nm; F = 4.5, p < 0.034.). There was a significant replicate effect and population by replicate
interaction (F = 6.7, p < 0.001 and F = 2.5, p < 0.041 respectively). The population effect on cell width
was F = 79.4, p < 0.001; replicate effect was F = 8.6, p < 0.001; with an interaction for population and repli-
cate at F = 8.6, p < 0.001 for the comparison of the FeNP with the controls. The mean cell width for the
ancestors was not significantly different from the controls (F = 0.493, p < 0.483). There was significant varia-
tion within the ancestral population replicates for cell width (F = 8.1, p < 0.001); as well as significant inter-
action between population and replicates (F = 6.2, p < 0.001).
Preprints (www.preprints.org) | NOT PEER-REVIEWED | Posted: 1 February 2021 doi:10.20944/preprints202102.0060.v1
Whole Genome
The genomic variants found in the FeNP are listed in Table 3a—c. Descriptions of these genes are given
in Table 4a—c. The genomic variants for the controls are provided in Appendix B Tables B1, B2. The con-
trols showed no hard selective sweeps. Also, genomic variants for the ancestral population are not re-
ported here as these are given in our prior research [41, 42]. The ancestral variants were filtered out of all
variant calls in the FeNP and Control populations. At 25 days three of the five FeNP replicates (FeNP1,
FeNP2, & FeNP5) displayed a hard selective sweep for non-synonymous (NS) substitutions in the RNA poly-
merase subunit ' (rpoC) gene. Significant polymorphisms in RNA polymerase subunit (rpoA) were ob-
served in FeNP3 and FeNP5 (f = 0.503, 0.665 respectively). FeNP4 was the only population displaying no
hard selective sweeps but had significant polymorphisms in the flagellar hook protein (flgE) and NADH:
ubiquinone oxidoreductase, chain G (nuoG) genes (f = 0.295, 0.439 respectively).
Significant polymorphisms (f > 0.250) were observed in all replicates (Table 3b). FeNP1 showed NS poly-
morphisms in porphyrinogen oxidase, cytoplasmic (yfeX), and putative metal dependent hydrolase (ygjP).
FeNP2 had NS polymorphisms in hydroxyacylgluthione hydrolase (gloB) and a synonymous substitution in
the glutamate/aspartate: proton symporter (gltP). Synonymous substitutions may result from linkage to
a NS beneficial mutation, or they can result from favorable selection due to codon bias. FeNP3 had NS
polymorphisms in RNA polymerase subunit (rpoA) and a synonymous variant in chromate reductase,
Class I, flavoprotein (chrR). FeNP4 in flagellar hook protein (flgE) and NADH ubiquinone oxidoreductase,
chain G (nuoG). Finally, FeNP5 also showed a significant NS polymorphism in RNA polymerase, subunit
(rpoA). Minor polymorphisms are listed in Table 3c. The controls displayed significant NS polymorphisms in
RNA polymerase subunits and ’. These are often associated with adaptation to minimal medium such as
Preprints (www.preprints.org) | NOT PEER-REVIEWED | Posted: 1 February 2021 doi:10.20944/preprints202102.0060.v1
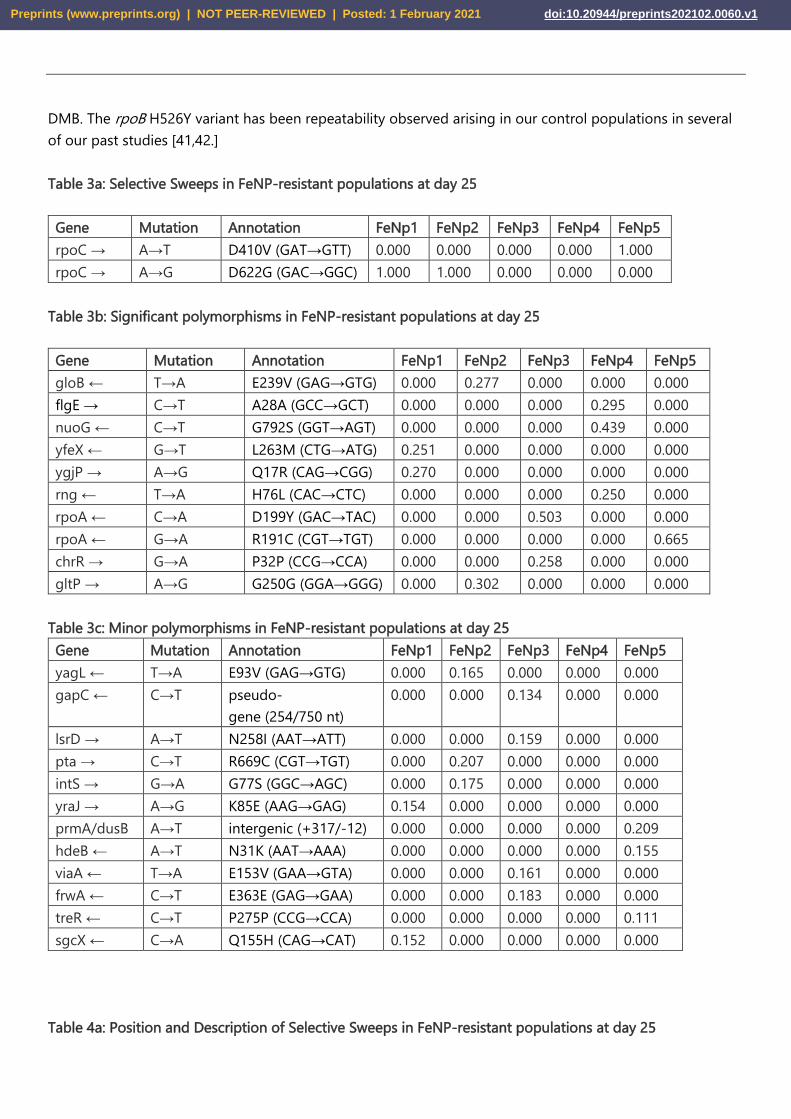
DMB. The rpoB H526Y variant has been repeatability observed arising in our control populations in several
of our past studies [41,42.]
Table 3a: Selective Sweeps in FeNP-resistant populations at day 25
Gene Mutation Annotation FeNp1 FeNp2 FeNp3 FeNp4 FeNp5
rpoC → A→T D410V (GAT→GTT) 0.000 0.000 0.000 0.000 1.000
rpoC → A→G D622G (GAC→GGC) 1.000 1.000 0.000 0.000 0.000
Table 3b: Significant polymorphisms in FeNP-resistant populations at day 25
Gene Mutation Annotation FeNp1 FeNp2 FeNp3 FeNp4 FeNp5
gloB ← T→A E239V (GAG→GTG) 0.000 0.277 0.000 0.000 0.000
flgE → C→T A28A (GCC→GCT) 0.000 0.000 0.000 0.295 0.000
nuoG ← C→T G792S (GGT→AGT) 0.000 0.000 0.000 0.439 0.000
yfeX ← G→T L263M (CTG→ATG) 0.251 0.000 0.000 0.000 0.000
ygjP → A→G Q17R (CAG→CGG) 0.270 0.000 0.000 0.000 0.000
rng ← T→A H76L (CAC→CTC) 0.000 0.000 0.000 0.250 0.000
rpoA ← C→A D199Y (GAC→TAC) 0.000 0.000 0.503 0.000 0.000
rpoA ← G→A R191C (CGT→TGT) 0.000 0.000 0.000 0.000 0.665
chrR → G→A P32P (CCG→CCA) 0.000 0.000 0.258 0.000 0.000
gltP → A→G G250G (GGA→GGG) 0.000 0.302 0.000 0.000 0.000
Table 3c: Minor polymorphisms in FeNP-resistant populations at day 25
Gene Mutation Annotation FeNp1 FeNp2 FeNp3 FeNp4 FeNp5
yagL ← T→A E93V (GAG→GTG) 0.000 0.165 0.000 0.000 0.000
gapC ← C→T pseudo-
gene (254/750 nt)
0.000 0.000 0.134 0.000 0.000
lsrD → A→T N258I (AAT→ATT) 0.000 0.000 0.159 0.000 0.000
pta → C→T R669C (CGT→TGT) 0.000 0.207 0.000 0.000 0.000
intS → G→A G77S (GGC→AGC) 0.000 0.175 0.000 0.000 0.000
yraJ → A→G K85E (AAG→GAG) 0.154 0.000 0.000 0.000 0.000
prmA/dusB A→T intergenic (+317/-12) 0.000 0.000 0.000 0.000 0.209
hdeB ← A→T N31K (AAT→AAA) 0.000 0.000 0.000 0.000 0.155
viaA ← T→A E153V (GAA→GTA) 0.000 0.000 0.161 0.000 0.000
frwA ← C→T E363E (GAG→GAA) 0.000 0.000 0.183 0.000 0.000
treR ← C→T P275P (CCG→CCA) 0.000 0.000 0.000 0.000 0.111
sgcX ← C→A Q155H (CAG→CAT) 0.152 0.000 0.000 0.000 0.000
Table 4a: Position and Description of Selective Sweeps in FeNP-resistant populations at day 25
Preprints (www.preprints.org) | NOT PEER-REVIEWED | Posted: 1 February 2021 doi:10.20944/preprints202102.0060.v1

Gene Position Description
rpoC → 4,186,578 & 4,187,214 RNA polymerase, beta prime subunit
Table 4b: Position and Description of Significant polymorphisms in FeNP-resistant populations at day 28
Gene Position Description
gloB ← 234,067 hydroxyacylglutathione hydrolase
flgE → 1,132,657 flagellar hook protein
nuoG ← 2397792 NADH: ubiquinone oxidoreductase, chain G
yfeX ← 2,549,759 porphyrinogen oxidase, cytoplasmic
ygjP → 3,236,009 putative metal dependent hydrolase
rng ← 3,397,569 ribonuclease G
rpoA ← 3,440,435 & 3,440,459 RNA polymerase, alpha subunit
chrR → 3,894,747 chromate reductase, Class I, flavoprotein
gltP → 4,295,230 glutamate/aspartate: proton symporter
Table 3c: Position and Description of Minor polymorphisms in FeNP-resistant populations at day 25
Gene Position Description
yagL ← 293,641 CP4-6 prophage; DNA-binding protein
gapC ← 1,490,460 pseudogene, GAP dehydrogenase; 1.
lsrD → 1,604,819 autoinducer 2 import system permease protein
pta → 2416751 phosphate acetyltransferase
intS → 2,466,773 CPS-53 (KpLE1) prophage; putative prophage CPS-53 integrase
yraJ → 3,289,066 putative outer membrane protein
prmA/dusB 3,410,268 methyltransferase for 50S ribosomal subunit protein L11/ 2.
hdeB ← 3,656,200 acid-resistance protein
viaA ← 3,929,146 stimulator of RavA ATPase activity; 3.
frwA ← 4,141,133 putative PTS enzyme, Hpr component/enzyme I component/ 4.
treR ← 4,466,422 trehalose 6-phosphate-inducible trehalose regulon 5.
sgcX ← 4,531,187 putative endoglucanase with Zn-dependent exopeptidase domain
1. glyceraldehyde-3-phosphate dehydrogenase (second fragment).
2. tRNA-dihydrouridine synthase B
3. von Willebrand factor domain protein
4. enzyme IIA component
5. transcriptional repressor
4. Discussion
The study examined the potential for E. coli K-12 MG1655 to evolve magnetite nanoparticle re-
sistance. It also examined the genomics changes associated with magnetite nanoparticle resistance.
Preprints (www.preprints.org) | NOT PEER-REVIEWED | Posted: 1 February 2021 doi:10.20944/preprints202102.0060.v1
We demonstrated that by day 25 increased magnetite NP resistance was apparent in populations cultured
in magnetite NPs (FeNP1—5). The FeNP replicates displayed highly statistically different increases (be-
tween 50—2 times greater) 24-hour growth across concentration in magnetite with a mean increase across
concentration of 8.5 times. They were highly statistically significantly higher in their capacity to grow in
magnetite compared to the controls by similar margins. The controls display adaptations to growth in
DMB medium that are not seen in the ancestors. As far as we know this is the first report of the experi-
mental evolution of magnetite resistance in the literature.
Resistance to magnetite NPs also conferred greater fitness in increasing concentrations to ionic met-
als iron (II), iron (III), gallium (III), and silver. The FeNP populations showed highly statistically significantly
greater resistance to all of these metals compared to controls and ancestors as well. Similarly, FeNP pop-
ulations showed significantly greater resistance to ampicillin, chloramphenicol, rifampicin, sulfanilamide and
tetracycline compared to controls and ancestors.
One of the most striking results of this study was the shift in cell proportions in the FeNP popula-
tions compared to the controls and ancestors. The FeNP populations increased in both their length and
width compared to both. As E. coli is a rod-shaped bacterium, a rough calculation of the increase in the
cell area is given by multiplying its length and width. On average FeNP area = 1.25 x 10⁶ nm2 ; control =
6.17 x 10⁵ nm2; and ancestor = 5.76 x 10⁵ nm2. This represents a 2.18-fold increase in cell area in the
FeNP populations compared to their ancestor. The magnitude of the cell size response suggests that this
may be playing an important role in FeNP adaptation to metal and antibiotic toxicity. On the primary
mechanisms by which magnetite is known to impact bacteria is via ROS [45, Table 1]. Table 1). There
is evidence that larger cell size is correlated to ROS resistance. A study of Lactobacillus species found
that greater cell size was positively associated with resistance to ROS [46]. Another study of Mycobacte-
rium isolates found that greater size variation was associated with antibiotic resistance [47]. In E. coli
MG1655 stress is known to cause an increased cell length; this has also been observed in M. tuberculosis
and M. smegmatis [48, 49]. Finally, it has been shown that increase in cell length is an adaptation associ-
ated with antibiotic resistance due to the synthesis of a modified nucleotide in response to stress (p) ppGpp
[50—53].
Genetics analysis identified selective sweeps in RNA polymerase subunit ' (rpoC ) in some repli-
cates. In addition, others displayed significant polymorphisms (f > 0.500) in RNA polymerase subunit
(rpoA). As RNA polymerase is involved in putting together all the RNA in the cell, mutations in this pro-
tein are known to be widely pleiotropic and play major roles in relieving stress and increasing metabolic ef-
ficiency in E. coli [54, 55]. This may explain why the FeNP populations displayed superior growth com-
pared to the control and ancestral populations in all the stresses applied to them in this study (magnetite,
ionic metals, and antibiotics).
Despite the fact that the FeNP populations displayed an increase in growth in magnetite, iron (II),
iron (III), and gallium (III, an iron III analog) we did not find selective sweeps of variants associated with iron
resistance in our prior studies [14—16]. These included mutations in genes such as fecA, fur, dnaK, murC,
ptsP and ilvG. Magnetite contains both iron (II) and iron (III) and these are released in solution [1]. In
this study the -magnetite particles were stabilized by a coating of tetramethylammonium hydroxide
(CH3)4NOH. In our study the magnetite nanoparticles were stabilized with PVP (polyvinylpyrrolidone).
Coating agents used to improve the stability of magnetite nanoparticles decrease the release of ionic
Fe2+ and Fe3+ in the medium [56, 57].
Preprints (www.preprints.org) | NOT PEER-REVIEWED | Posted: 1 February 2021 doi:10.20944/preprints202102.0060.v1

Resistance to magnetite NP conferred resistance to all the antibiotics tested. These antibiotics have
different modes of action due to the nature of their structures and degree of affinity to certain target sites
within bacterial cells. Ampicillin exerts bactericidal activity through inhibition of bacterial cell wall synthe-
sis by binding to penicillin binding proteins (PBPs) and by inhibiting certain PBPs related to the activation of
a bacterial autolytic process [58]. Tetracycline enters the cells and binds reversibly to the 30S arresting
translation and thus inhibiting protein synthesis which ultimately leads to a bacteriostatic effect [59]. Sul-
fanilamide prevents bacterial replication by inhibiting dihydropteroate synthetase [60]. Chloramphenicol
diffuses through the bacteria cell wall and reversibly bind to bacterial 50S ribosomal subunit interfering
peptidyl transferase activity and block peptide bond formation impeding bacterial cell proliferation [61]. Ri-
fampin specifically inhibits bacterial RNA polymerase arresting DNA-directed RNA synthesis of bacteria [62].
Resistance to these antibiotics may involve efflux systems that transport the antibiotics from inside to out-
side the bacterial cells or a ribosomal protection protein remove antibiotics from ribosomes. Resistance to
rifampicin has been linked to a variety of mutations in rpoB and rpoC [63—65].
Finally, while we did not measure changes in gene expression in this study, our past study of iron (II)
resistance in E. coli K-12 MG1655 found that there were large changes in gene expression associated with
general metal resistance and iron metabolism in general [19]. We suspect that this was the case here as
well and our future studies will examine this possibility.
5. Conclusions
This is the first study to utilize experimental evolution to investigate magnetite nanoparticle re-
sistance in E. coli or any other bacterium. E. coli K-12 MG1655 evolved resistance to magnetite nanopar-
ticles at 25 days of selection. Resistance to magnetite nanoparticles conferred resistance to both metals and
antibiotics. Increased cell length and wide resulted many have played a significant role in adaptation to
magnetite. Genomic analysis revealed hard selective sweeps in the rpoA and rpoC made important contri-
butions to magnetite nanoparticle resistance. These results have important consequences for the future use
of magnetite nanoparticles as antimicrobials as de-novo evolution against these materials resulted quickly
and occurred due to relatively simple genomic changes. This is an issue that will continue to be of signifi-
cance regarding the use of nanomaterials as antimicrobials as we outlined in an earlier review [66].
6. Patents
N/A
Supplementary Materials: The following are available online at www.mdpi.com/xxx/s1, Figure S1: title, Table
S1: title, Video S1: title.
Author Contributions: Conceptualization of this study was by JLG; methodology, AJE and KS; laboratory
culture maintenance and phenotypic assays LR, CS, DC; genomic library preparation and sequencing AJE, LR,
CS, DC, MT; software analysis JLG; validation of ICP-OES KS, formal analysis JLG, investigation JLG, AJE; re-
sources, JLG; data curation JLG; writing—original draft preparation AJE, JLG, X.X.; writing—review and editing,
JLG.; visualization, JLG; supervision AJE; project administration JLG; funding acquisition, JLG. All authors have
read and agreed to the published version of the manuscript.
Funding: This research was funded by BEACON: An NSF Center for the Study of Evolution in Action (Na-
tional Science Foundation Cooperative Agreement No. DBI-0939454), Characterizing the Evolutionary
Preprints (www.preprints.org) | NOT PEER-REVIEWED | Posted: 1 February 2021 doi:10.20944/preprints202102.0060.v1
Behavior of Bacteria in the Presence of Iron Nanoparticles, NSF No. CBET-1602593. And National Institutes
of Health, Maximizing Access to Research Careers (MARC USTAR: 1T34GM113860-01A1).
Data Availability Statement:
The SRA accession number for sequencing data is PRJNA694183 (FeNP-resistant, FeNP1—5_D28 and con-
trols, C1—5_D28). Finally, the phenotypic data from these studies will be submitted into DRYAD
(https://datadryad.org/ ) upon acceptance of this manuscript for publication.
Acknowledgments: Dr. Scott H. Harrison gave valuable aid in submitting the sequencing data to SRA. The
authors would like to thank Analytical Services Laboratory (ASL) at NCAT for elemental analysis using ICP.
Conflicts of Interest: The authors declare no conflict of interest.
Appendix A
Preprints (www.preprints.org) | NOT PEER-REVIEWED | Posted: 1 February 2021 doi:10.20944/preprints202102.0060.v1
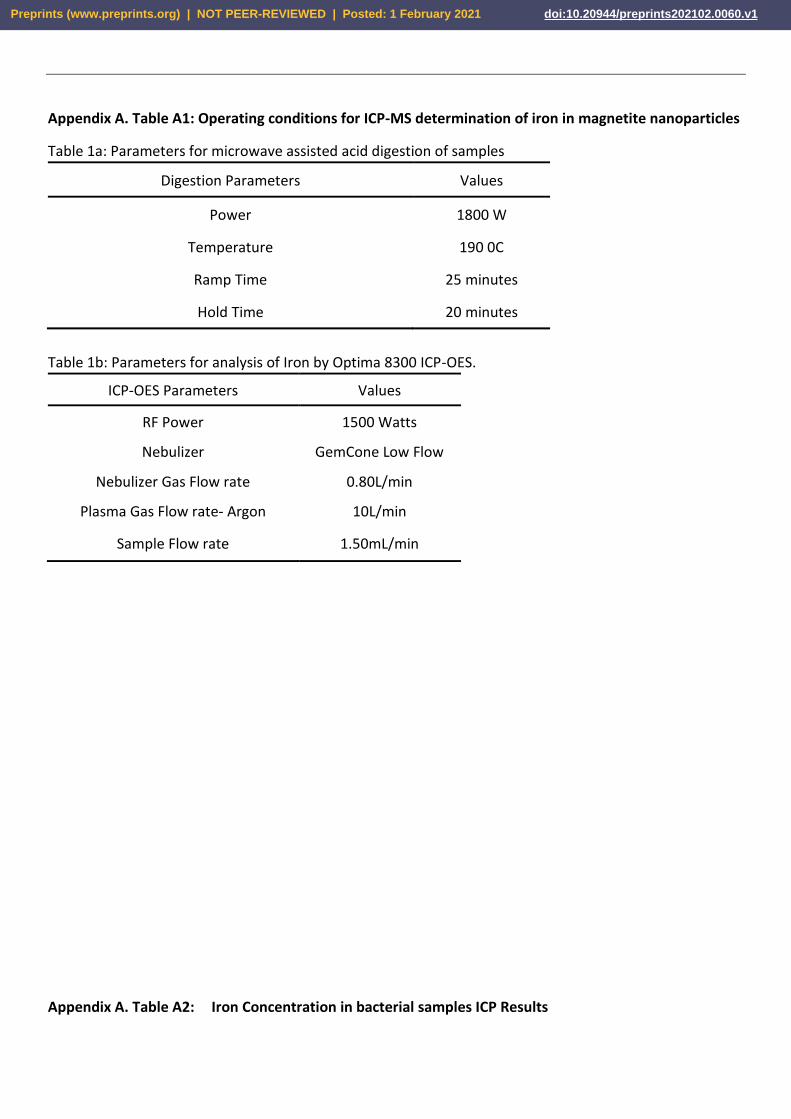
Appendix A. Table A1: Operating conditions for ICP-MS determination of iron in magnetite nanoparticles
Table 1a: Parameters for microwave assisted acid digestion of samples
Digestion Parameters Values
Power 1800 W
Temperature 190 0C
Ramp Time 25 minutes
Hold Time 20 minutes
Table 1b: Parameters for analysis of Iron by Optima 8300 ICP-OES.
ICP-OES Parameters Values
RF Power 1500 Watts
Nebulizer GemCone Low Flow
Nebulizer Gas Flow rate 0.80L/min
Plasma Gas Flow rate- Argon 10L/min
Sample Flow rate 1.50mL/min
Appendix A. Table A2: Iron Concentration in bacterial samples ICP Results
Preprints (www.preprints.org) | NOT PEER-REVIEWED | Posted: 1 February 2021 doi:10.20944/preprints202102.0060.v1

Iron (II)
O-hour
Theoretical Concentration
(mg/L)
Measured Concentration
(mg/L)
Measured Concentra-
tion (mg/L) (24hr)
0.00 0.00 0.00
60 12.39 17.23
120 33.14 35.83
250 58.89 64.01
500 91.88 124.62
750 169.57 181.90
1000 226.47 215.08
1750 371.56 328.35
2500 424.41 180.34
5000 1039.31 1325.78
Iron (III)
O-hour
0 0 0.00
60 13.10 10.70
120 32.00 28.78
250 71.12 58.34
500 98.87 108.72
750 208.18 167.00
1000 232.15 215.97
1750 406.15 354.42
2500 502.55 506.06
5000 1208.28 1897.90
Magnetite
O-hour
0 4.25 0.00
60 35.87 34.73
120 81.83 65.33
250 114.47 142.27
500 260.86 260.11
750 495.13 254.63
1000 577.89 384.57
1750 883.52 308.12
2500 1157.75 1199.82
5000 2474.32 2421.73
Preprints (www.preprints.org) | NOT PEER-REVIEWED | Posted: 1 February 2021 doi:10.20944/preprints202102.0060.v1

Appendix A Figure A1. This figure shows the actual amount of ionic iron (II) compared to the
theoretical amount of iron (II) at 0 and 24 hours in the bacterial medium.
Appendix A. Figure A2. This figure shows the amount of ionic iron (III) at 0 and 24 hours result-
ing from iron (III) in DMB medium.
Preprints (www.preprints.org) | NOT PEER-REVIEWED | Posted: 1 February 2021 doi:10.20944/preprints202102.0060.v1

Appendix A. Figure A3. This figure shows the amount of magnetite at 0 and 24 hours resulting
from magnetite in DMB medium.
Appendix B
Preprints (www.preprints.org) | NOT PEER-REVIEWED | Posted: 1 February 2021 doi:10.20944/preprints202102.0060.v1
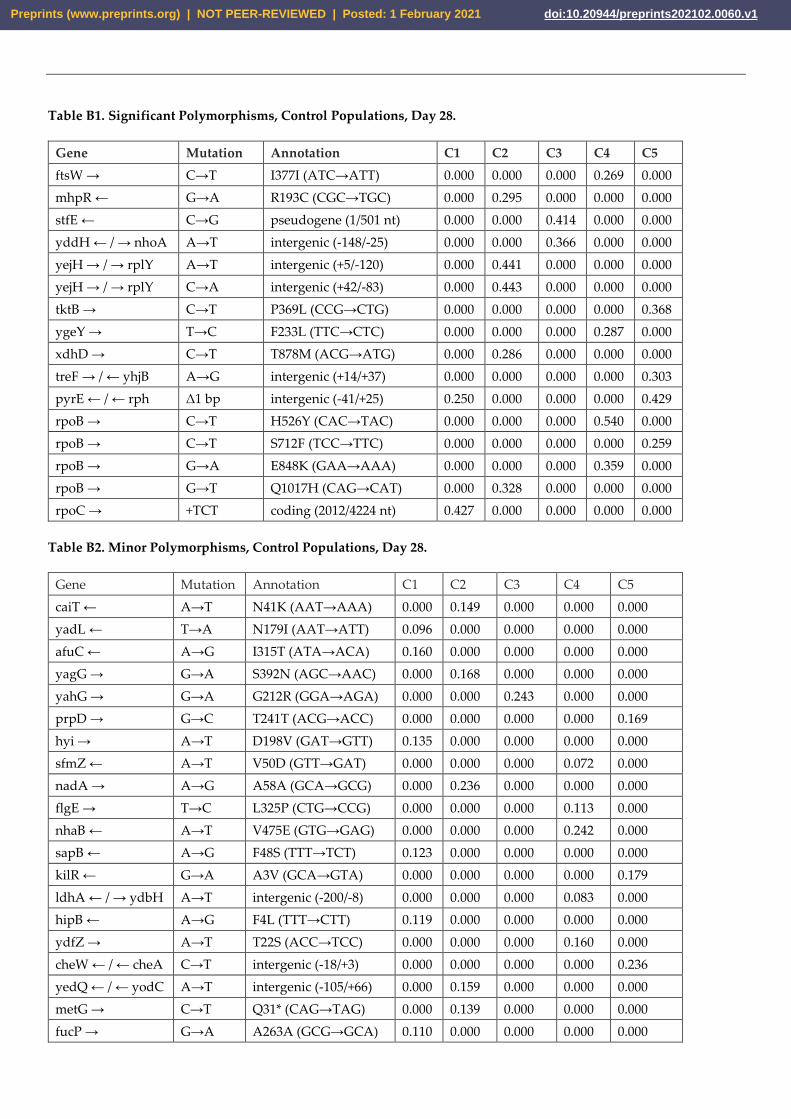
Table B1. Significant Polymorphisms, Control Populations, Day 28.
Gene Mutation Annotation C1 C2 C3 C4 C5
ftsW → C→T I377I (ATC→ATT) 0.000 0.000 0.000 0.269 0.000
mhpR ← G→A R193C (CGC→TGC) 0.000 0.295 0.000 0.000 0.000
stfE ← C→G pseudogene (1/501 nt) 0.000 0.000 0.414 0.000 0.000
yddH ← / → nhoA A→T intergenic (-148/-25) 0.000 0.000 0.366 0.000 0.000
yejH → / → rplY A→T intergenic (+5/-120) 0.000 0.441 0.000 0.000 0.000
yejH → / → rplY C→A intergenic (+42/-83) 0.000 0.443 0.000 0.000 0.000
tktB → C→T P369L (CCG→CTG) 0.000 0.000 0.000 0.000 0.368
ygeY → T→C F233L (TTC→CTC) 0.000 0.000 0.000 0.287 0.000
xdhD → C→T T878M (ACG→ATG) 0.000 0.286 0.000 0.000 0.000
treF → / ← yhjB A→G intergenic (+14/+37) 0.000 0.000 0.000 0.000 0.303
pyrE ← / ← rph Δ1 bp intergenic (-41/+25) 0.250 0.000 0.000 0.000 0.429
rpoB → C→T H526Y (CAC→TAC) 0.000 0.000 0.000 0.540 0.000
rpoB → C→T S712F (TCC→TTC) 0.000 0.000 0.000 0.000 0.259
rpoB → G→A E848K (GAA→AAA) 0.000 0.000 0.000 0.359 0.000
rpoB → G→T Q1017H (CAG→CAT) 0.000 0.328 0.000 0.000 0.000
rpoC → +TCT coding (2012/4224 nt) 0.427 0.000 0.000 0.000 0.000
Table B2. Minor Polymorphisms, Control Populations, Day 28.
Gene Mutation Annotation C1 C2 C3 C4 C5
caiT ← A→T N41K (AAT→AAA) 0.000 0.149 0.000 0.000 0.000
yadL ← T→A N179I (AAT→ATT) 0.096 0.000 0.000 0.000 0.000
afuC ← A→G I315T (ATA→ACA) 0.160 0.000 0.000 0.000 0.000
yagG → G→A S392N (AGC→AAC) 0.000 0.168 0.000 0.000 0.000
yahG → G→A G212R (GGA→AGA) 0.000 0.000 0.243 0.000 0.000
prpD → G→C T241T (ACG→ACC) 0.000 0.000 0.000 0.000 0.169
hyi → A→T D198V (GAT→GTT) 0.135 0.000 0.000 0.000 0.000
sfmZ ← A→T V50D (GTT→GAT) 0.000 0.000 0.000 0.072 0.000
nadA → A→G A58A (GCA→GCG) 0.000 0.236 0.000 0.000 0.000
flgE → T→C L325P (CTG→CCG) 0.000 0.000 0.000 0.113 0.000
nhaB ← A→T V475E (GTG→GAG) 0.000 0.000 0.000 0.242 0.000
sapB ← A→G F48S (TTT→TCT) 0.123 0.000 0.000 0.000 0.000
kilR ← G→A A3V (GCA→GTA) 0.000 0.000 0.000 0.000 0.179
ldhA ← / → ydbH A→T intergenic (-200/-8) 0.000 0.000 0.000 0.083 0.000
hipB ← A→G F4L (TTT→CTT) 0.119 0.000 0.000 0.000 0.000
ydfZ → A→T T22S (ACC→TCC) 0.000 0.000 0.000 0.160 0.000
cheW ← / ← cheA C→T intergenic (-18/+3) 0.000 0.000 0.000 0.000 0.236
yedQ ← / ← yodC A→T intergenic (-105/+66) 0.000 0.159 0.000 0.000 0.000
metG → C→T Q31* (CAG→TAG) 0.000 0.139 0.000 0.000 0.000
fucP → G→A A263A (GCG→GCA) 0.110 0.000 0.000 0.000 0.000
Preprints (www.preprints.org) | NOT PEER-REVIEWED | Posted: 1 February 2021 doi:10.20944/preprints202102.0060.v1
tcdA ← / ← mltA T→A intergenic (-118/+121) 0.000 0.000 0.000 0.123 0.000
ygeV ← / → ygeW A→G intergenic (-68/-408) 0.000 0.000 0.000 0.000 0.197
ygeV ← / → ygeW G→A intergenic (-344/-132) 0.000 0.000 0.000 0.182 0.000
serA ← C→T D43N (GAT→AAT) 0.000 0.160 0.000 0.000 0.000
ygiD ← / → zupT C→G intergenic (-39/-104) 0.000 0.000 0.000 0.000 0.098
gltB → T→C Y199Y (TAT→TAC) 0.136 0.000 0.000 0.000 0.000
crp → A→T M60L (ATG→TTG) 0.000 0.200 0.000 0.000 0.000
bcsE → A→G E243E (GAA→GAG) 0.000 0.000 0.000 0.094 0.000
yibG → G→A E28K (GAA→AAA) 0.084 0.000 0.000 0.000 0.000
metL → C→T A681V (GCG→GTG) 0.000 0.000 0.226 0.000 0.000
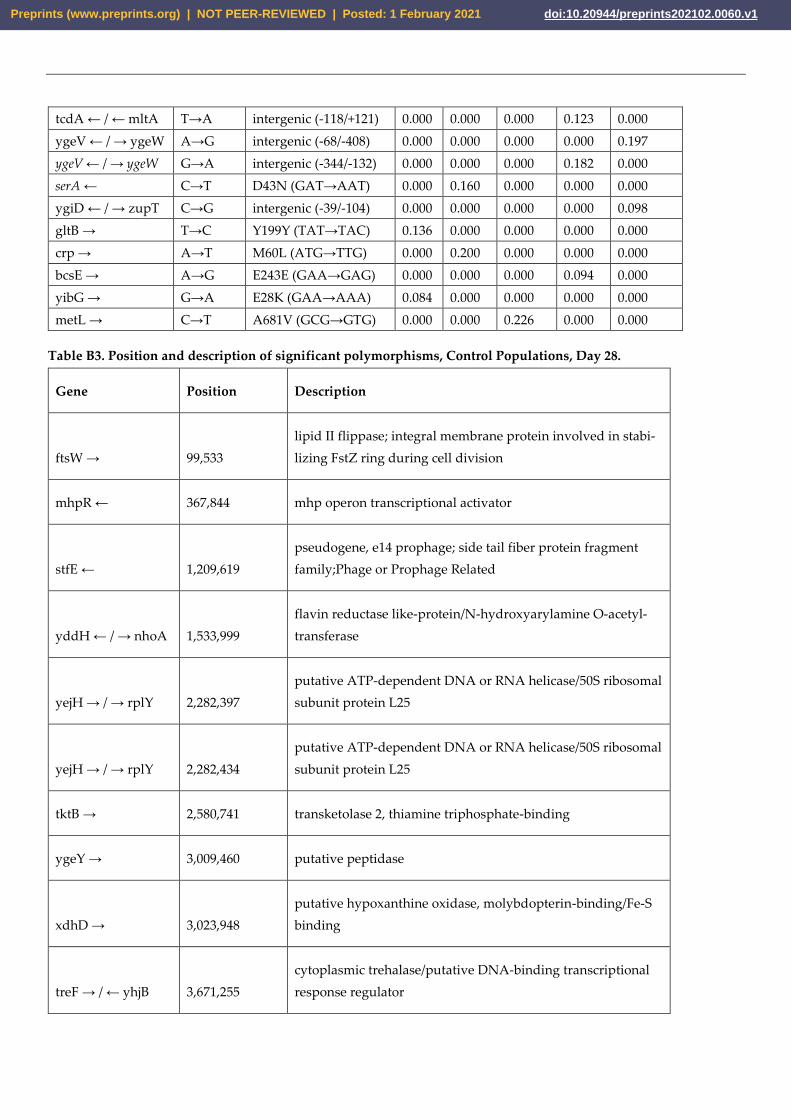
Table B3. Position and description of significant polymorphisms, Control Populations, Day 28.
Gene Position Description
ftsW → 99,533
lipid II flippase; integral membrane protein involved in stabi-
lizing FstZ ring during cell division
mhpR ← 367,844 mhp operon transcriptional activator
stfE ← 1,209,619
pseudogene, e14 prophage; side tail fiber protein fragment
family;Phage or Prophage Related
yddH ← / → nhoA 1,533,999
flavin reductase like-protein/N-hydroxyarylamine O-acetyl-
transferase
yejH → / → rplY 2,282,397
putative ATP-dependent DNA or RNA helicase/50S ribosomal
subunit protein L25
yejH → / → rplY 2,282,434
putative ATP-dependent DNA or RNA helicase/50S ribosomal
subunit protein L25
tktB → 2,580,741 transketolase 2, thiamine triphosphate-binding
ygeY → 3,009,460 putative peptidase
xdhD → 3,023,948
putative hypoxanthine oxidase, molybdopterin-binding/Fe-S
binding
treF → / ← yhjB 3,671,255
cytoplasmic trehalase/putative DNA-binding transcriptional
response regulator
Preprints (www.preprints.org) | NOT PEER-REVIEWED | Posted: 1 February 2021 doi:10.20944/preprints202102.0060.v1
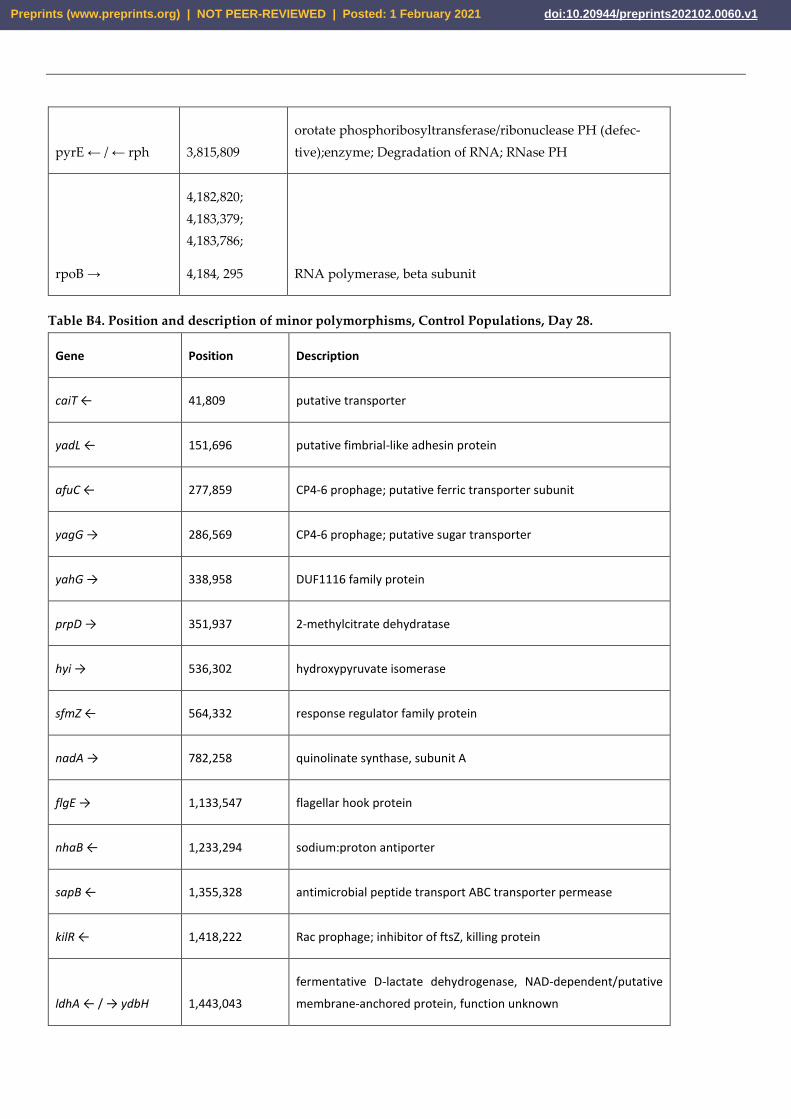
pyrE ← / ← rph 3,815,809
orotate phosphoribosyltransferase/ribonuclease PH (defec-
tive);enzyme; Degradation of RNA; RNase PH
rpoB →
4,182,820;
4,183,379;
4,183,786;
4,184, 295 RNA polymerase, beta subunit
Table B4. Position and description of minor polymorphisms, Control Populations, Day 28.
Gene Position Description
caiT ← 41,809 putative transporter
yadL ← 151,696 putative fimbrial-like adhesin protein
afuC ← 277,859 CP4-6 prophage; putative ferric transporter subunit
yagG → 286,569 CP4-6 prophage; putative sugar transporter
yahG → 338,958 DUF1116 family protein
prpD → 351,937 2-methylcitrate dehydratase
hyi → 536,302 hydroxypyruvate isomerase
sfmZ ← 564,332 response regulator family protein
nadA → 782,258 quinolinate synthase, subunit A
flgE → 1,133,547 flagellar hook protein
nhaB ← 1,233,294 sodium:proton antiporter
sapB ← 1,355,328 antimicrobial peptide transport ABC transporter permease
kilR ← 1,418,222 Rac prophage; inhibitor of ftsZ, killing protein
ldhA ← / → ydbH 1,443,043
fermentative D-lactate dehydrogenase, NAD-dependent/putative
membrane-anchored protein, function unknown
Preprints (www.preprints.org) | NOT PEER-REVIEWED | Posted: 1 February 2021 doi:10.20944/preprints202102.0060.v1

hipB ← 1,592,433 antitoxin of HipAB toxin-antitoxin system
ydfZ → 1,629,278 selenoprotein, function unknown
cheW ← / ← cheA 1,973,357
purine-binding chemotaxis protein/fused chemotactic sensory histi-
dine kinase in two-component regulatory system with CheB and
CheY: sensory histidine kinase/signal sensing protein
yedQ ← / ← yodC 2,028,122
putative membrane-anchored diguanylate cyclase/uncharacterized
protein
metG → 2,194,390 methionyl-tRNA synthetase
fucP → 2,935,023 L-fucose transporter
tcdA ← / ← mltA 2,945,960
tRNA threonylcarbamoyladenosine dehydratase; sulfur acceptor for
CsdA/membrane-bound lytic murein transglycosylase A
ygeV ← / → ygeW
3,005,854; 3,006,
130
putative sigma-54-interacting transcriptional activator/putative car-
bamoyltransferase
serA ← 3,058,284 D-3-phosphoglycerate dehydrogenase
ygiD ← / → zupT 3,182,446 4,5- DOPA-extradiol-dioxygenase/zinc transporter
gltB → 3,355,321 glutamate synthase, large subunit
crp → 3,486,297
cAMP-activated global transcription factor, mediator of catabolite
repression
bcsE → 3,697,186 cellulose production protein
yibG → 3,768,258 TPR-like repeat protein
metL → 4,131,876 Bifunctional aspartokinase/homoserine dehydrogenase 2
References
1. He, S.; Feng, Y.; Gu, N.; Zhang, Y.; and Lin, X.; The effect of -Fe2O3 nanoparticles on Escherichia coli
genome, Env. Pollution 2011, 159: 3468—3473.
Preprints (www.preprints.org) | NOT PEER-REVIEWED | Posted: 1 February 2021 doi:10.20944/preprints202102.0060.v1
2. Hong, S.; Lu, X.; and Gao, P.; The exploration of the antibacterial mechanism of Fe3+ against bacteria,
Brazilian J. Microbiology 2011, 42: 410—414.
3. Guan, G.; Pinochet-Barros, A.; Gaballa, A.; Patel, S.J.; Argüello, J.M.; Helmann, J.D.; PfeT, a P1B4 -type
ATPase, effluxes ferrous iron and protects Bacillus subtilis against iron intoxication, Mol. Microbiol.
2015, 98(4): 787-803. doi: 10.1111/mmi.13158.
4. Fillat MF.; The FUR (ferric uptake regulator) superfamily: diversity and versatility of key transcriptional
regulators. Arch. Biochem. Biophys. 2014, 546: 41-52. doi: 10.1016/j.abb.2014.01.029.
5. Perez-Martin Escolar, L.; Perez-Martin, J.; and Lorenzo, V.; Opening the Iron Box: Transcriptional
Metalloregulation by the Fur Protein, J. Bacteriology, 1999, 181(20): p. 6223-6229.
6. Lill, R.; Function and biogenesis of iron-sulphur proteins, Nature, 2009, 460(7257): 831-8. doi:
10.1038/nature08301.
7. Grass G.; Iron transport in Escherichia coli: All has not been said and done, BioMetals 2005, 19: 159—
172. DOI: 10.1007/s10534-005-4341-2.
8. Coale, K.H.; Johnson, K.S.; Fitzwater, S.E.; Gordon, R.M.; Tanner, S.; Chavez, F.P.; Ferioli, L.; Sakamoto,
C.; Rogers, P.; Millero, F.; Steinberg, P.; Nightingale, P.; Cooper, D.; Cochlan, W.P.; Landry, M.R.; Con-
stantinou, J.; Rollwagen, G.; Trasvina, A.; Kudela, R.; A massive phytoplankton bloom induced by an
ecosystem-scale iron fertilization experiment in the equatorial Pacific Ocean, Nature 1996, 383
(6600):495 – 501.
9. Konopka K.; Neilands J.B.; Effect of serum albumin on siderophore-mediated utilization of transferrin
iron. Biochemistry 1984, 23(10):2122-7.
10. Nakashige, T.G.; Zhang, B.; Krebs, C.; Nolan, E.M.; Human calprotectin is an iron-sequestering host-
defense protein, Nat. Chem. Biol. 2015, 11(10): 765-71. doi: 10.1038/nchembio.1891.
11. Seo, S.W.; Kim, D.; Latif, H.; O'Brien, E.J.; Szubin, R.; Palsson, B.O.; Deciphering Fur transcriptional
regulatory network highlights its complex role beyond iron metabolism in Escherichia coli. Nat
Commun. 2014, 5: 4910.
12. Hale, R.; Morrongiello, J.R.; Swearer, S.E.; Evolutionary traps and range shifts in a rapidly changing
world. Biol Lett. 2016 12(6):20160003. doi: 10.1098/rsbl.2016.0003. PMID: 27330167; PMCID:
PMC4938037.
13. Thomas, M.D.; Ewunkem, A.J.; Williams, D.K.; Moore, A.; Rhinehardt, K.; Van Beveren, E.; Yang, B.;
Boyd, B.; Tapia, A.; Han, J.; Harrison, S.H.; and Graves J.L. Too much of a good thing: Adaptation to
iron (II) in Escherichia coli, Evolution, Medicine & Public Health 2021, eoaa051,
https://doi.org/10.1093/emph/eoaa051.
14. Graves, J.L.; Ewunkem, A.J.; Thomas, M.D.; Han, J.; Rhinehardt, K.L.; Boyd, S.; Edmondson, R.; Jeffers-
Francis, L.; and Harrison, S.H. Experimental Evolution of Metal Resistance in Bacteria. In Banzhaf et al.
(Eds.) Evolution in Action—Past, Present, and Future, pp. 91—106, (Cham, Switzerland: Springer 2
International Publishing, AG) 2020.
15. Graves J.L.; Ewunkem, J.; Ward, J.; Staley, C.; Thomas, M.D.; Rhinehardt, K.L.; Han, J.; and Harrison,
S.H. Experimental evolution of gallium resistance in Escherichia coli, Evolution, Medicine, and Public
Health 2019, 10.1093/emph/eoz025.
16. Laurent, S.; Forge, D.; Port, M.; Roch, A.; Robic, C.; Vander Elst, L.; & Muller, R. N. Magnetic iron oxide
nanoparticles: synthesis, stabilization, vectorization, physicochemical characterizations, and biologi-
cal applications. Chemical reviews, 2008, 108(6), 2064-2110.
17. Hett, A.; Nanotechnology: small matter, many unknowns. Swiss Reinsurance Company, 2004.
Preprints (www.preprints.org) | NOT PEER-REVIEWED | Posted: 1 February 2021 doi:10.20944/preprints202102.0060.v1

18. Khan, I.; Saeed, K.; & Khan, I; Nanoparticles: Properties, applications and toxicities. Arabian journal of
chemistry, 2019, 12(7), 908-931.
19. Niño-Martínez, N.; Salas Orozco, M. F.; Martínez-Castañón, G. A.; Torres Méndez, F.; & Ruiz, F.; Mo-
lecular mechanisms of bacterial resistance to metal and metal oxide nanoparticles. Int. J. of Mol. Sci.
2019, 20(11), 2808.
20. Chamchoy, K.; Inprasit, T.; Vanichvattanadecha, C.; Thiangtrong, A.; Anukunwithaya, P.; and Pisitsak,
P; The Magnetic Properties and Dye Adsorption of Sericin-modified Magnetite Nanoparticles. J. Pol-
ymers and the Env. 2020, 1-8.
21. Siponen, M. I.; Legrand, P.; Widdrat, M.; Jones, S. R.; Zhang, W. J.; Chang, M. C.; Faivre, D; Arnoux,
P.; & Pignol, D; Structural insight into magnetochrome-mediated magnetite biomineralization. Na-
ture, 2013, 502(7473), 681-684.
22. Gieré, R.; Magnetite in the human body: Biogenic vs. anthropogenic. Proc. Nat. Acad. Sci. USA. 2016,
113(43), 11986-11987.
23. Peters, S. T.; Alibabaie, N.; Pack, A.; McKibbin, S. J.; Raeisi, D.; Nayebi, N.; Torab, F.; Ireland, T; & Leh-
mann, B.; Triple oxygen isotope variations in magnetite from iron-oxide deposits, central Iran, record
magmatic fluid interaction with evaporite and carbonate host rocks. Geology 2019, 48(3), 211-215.
24. Ayupova, N. R.; Novoselov, K. A.; Maslennikov, V. V.; Melekestseva, I. Y.; Hollis, S. P.; Artemyev, D. A.;
& Tessalina, S. G.; The formation of magnetite ores of the Glubochenskoe deposit, Turgai iron belt,
Russia: new structural, mineralogical, geochemical, and isotopic constraints. Mineralium Deposita
2020, 1-21.
25. Kirschvink, J. L.; Kobayashi-Kirschvink, A.; & Woodford, B. J.; Magnetite biomineralization in the hu-
man brain. Proc. Nat. Acad. Sci. USA 1992, 89(16), 7683-7687.
26. Kim, D. H.; Nikles, D. E.; & Brazel, C. S.; Synthesis and characterization of multifunctional chitosan-
MnFe2O4 nanoparticles for magnetic hyperthermia and drug delivery. Materials 2010, 3(7), 4051-
4065.
27. Alvarez-Berríos, M. P.; Castillo, A.; Rinaldi, C.; & Torres-Lugo, M.; Magnetic fluid hyperthermia en-
hances cytotoxicity of bortezomib in sensitive and resistant cancer cell lines. Int. J. Nanomedicine
2014, 9, 145.
28. Tokajuk, G.; Niemirowicz, K.; Deptuła, P.; Piktel, E.; Cieśluk, M.; Wilczewska, A. Z.; Dąbrowski, J.R.; &
Bucki, R.; Use of magnetic nanoparticles as a drug delivery system to improve chlorhexidine antimi-
crobial activity. International Journal of Nanomedicine 2017, 12, 7833.
29. de Toledo, L. D. A. S.; Rosseto, H. C.; & Bruschi, M. L.; Iron oxide magnetic nanoparticles as antimicro-
bials for therapeutics. Pharma. Develop. and Tech. 2018, 23(4), 316-323.
30. Wang, J.; Wu, H.; Yang, Y.; Yan, R.; Zhao, Y.; Wang, Y.; Chen A.; Shao, S.; Jiang, P.; & Li, Y; Bacterial
species-identifiable magnetic nanosystems for early sepsis diagnosis and extracorporeal photody-
namic blood disinfection. Nanoscale 2018, 10(1), 132-141.
31. Iqbal, J.; Abbasi, B. A.; Ahmad, R.; Shahbaz, A.; Zahra, S. A.; Kanwal, S.; Kanwal, S.; Munir, A.; Rabbani,
A.; & Mahmood, T.; Biogenic synthesis of green and cost-effective iron nanoparticles and evaluation
of their potential biomedical properties. J. Mol. Structure 2020, 1199: 126979.
32. Taimoory, S. M.; Rahdar, A.; Aliahmad, M.; Sadeghfar, F.; Hajinezhad, M. R.; Jahantigh, M.; Shahbazi,
P.; & Trant, J. F.; The synthesis and characterization of a magnetite nanoparticle with potent antibac-
terial activity and low mammalian toxicity. J. Mol. Liquids 2018, 265, 96-104.
Preprints (www.preprints.org) | NOT PEER-REVIEWED | Posted: 1 February 2021 doi:10.20944/preprints202102.0060.v1

33. Oliveira, A. M. D.; Mateus, G. A. P.; Santos, T. R. T. D.; Filho, B. A. D. A.; Gomes, R. G.; & Bergamasco,
R.;; Functionalized magnetite nanoparticles with Moringa oleifera with potent antibacterial action in
wastewater. Environmental Technology 2020, 1-10.
34. Ismail, R. A.; Sulaiman, G. M.; Abdulrahman, S. A.; & Marzoog, T. R.; Antibacterial activity of magnetic
iron oxide nanoparticles synthesized by laser ablation in liquid. Mat. Sci. Eng. C 2015, 53, 286-297.
35. Wilczewska, A. Z.; Niemirowicz, K.; Markiewicz, K. H.; & Car, H.; Nanoparticles as drug delivery sys-
tems. Pharma. Reports 2012, 64(5), 1020-1037.
36. Gabrielyan, L.; Hakobyan, L.; Hovhannisyan, A.; & Trchounian, A.; Effects of iron oxide (Fe3O4) nano-
particles on Escherichia coli antibiotic‐resistant strains. J. App. Micro. 2019, 126(4), 1108-1116.
37. International Organization for Standardization.; Clinical Laboratory Testing and in Vitro Diagnostic
Test Systems-Susceptibility Testing of Infectious Agents and Evaluation of Performance of Antimi-
crobial Susceptibility Test Devices: Reference Method for Testing the in Vitro Activity of Antimicro-
bial Agents Against Rapidly Growing Aerobic Bacteria Involved in Infectious Diseases. ISO, 2006.
38. Mabrouk, M.; Abd El-Wahab, R. M.; Beherei, H. H.; Selim, M. M.; & Das, D. B.; Multifunctional mag-
netite nanoparticles for drug delivery: Preparation, characterization, antibacterial properties and
drug release kinetics. Int. J. Pharmaceutics 2020, 587, 119658.
39. Deatherage, D.E.; & Barrick, J.E.; Identification of mutations in laboratory-evolved microbes from
next-generation sequencing data using breseq. Methods Mol. Biol. 2014, 1151: 165-88. doi:
10.1007/978-1-4939-0554-6_12.
40. Cao, J.; Woodhall, M.R.; Alvarez, J.; Cartron, M.L.; & Andrews, S.C.; EfeUOB (YcdNOB) is a tripartite,
acid-induced and CpxAR-regulated, low-pH Fe2+ transporter that is cryptic in Escherichia coli K-12
but functional in E. coli O157:H7. Mol. Microbiol. 2007, 65(4): p. 857-75.
41. Graves Jr, J. L.;Tajkarimi, M.; Cunningham, Q.; Campbell, A.; Nonga, H.; Harrison, S. H.; & Barrick, J. E.;
Rapid evolution of silver nanoparticle resistance in Escherichia coli. Frontiers in genetics 2015, 6:42
doi: 10.3389/fgene.2015.00042. PMID: 25741363; PMCID: PMC4330922.
42. Tajkarimi, M.; Rhinehardt, K.; Thomas, M.; Ewunkem, J.A.; Campbell, A.; Boyd, S.; Turner, D.; Harrison,
S.H.; & Graves, J.L.; Selection for ionic- confers silver nanoparticle resistance in Escherichia coli. JSM
Nanotechnology and Nanomedicine 2017, 5: 1047.
43. Kenzaka, T.; & Tani, K.; Scanning electron microscopy imaging of bacteria based on nucleic acid
sequences. In Scanning Electron Microscopy. Intech Open, 2012.
44. Barber, D.S.; Denslow, N.D.; Griffitt, R.J.; Martyniuk, C.J.; Sources, fate, and effects of engineered na-
nomaterials in the aquatic environment, in Sahu SC. and Casciano DA (Eds.) Nanotoxicity: From In
Vivo and In Vitro models to Health Risks, (West Sussex, UK: Wiley), 2009.
45. Wu, H.; Yin, J. J.; Wamer, W. G.; Zeng, M.; & Lo, Y. M.; Reactive oxygen species-related activities of
nano-iron metal and nano-iron oxides. J. Food and Drug Anal. 2014, 22(1), 86-94.
46. Rajab, S.; Tabandeh, F.; Shahraky, M.K.; & Alahyaribeik, S.; The effect of lactobacillus cell size on its
probiotic characteristics. Anaerobe. 2020 62: 102103. doi: 10.1016/j.anaerobe.2019.102103. Epub
2019 Sep 13. PMID: 31525452.
47. Vijay, S.; Vinh, D.N.; Hai, H.T.; Ha,V.T.N.; Dung V.T.M.; Dinh, T.D.; Nhung, H.N.; Tram, T.T.B.; Aldridge,
B.B.; Hanh, N.T.; Thu, D.D.A.; Phu, N.H.; Thwaites, G.E.; Thuong, N.T.T.; Influence of stress and antibi-
otic resistance on cell-length distribution in Mycobacterium tuberculosis clinical isolates. Front. Mi-
crobiol. 2017; 8:2296. doi: 10.3389/fmicb.2017.02296. PMID: 29209302; PMCID: PMC5702322.
Preprints (www.preprints.org) | NOT PEER-REVIEWED | Posted: 1 February 2021 doi:10.20944/preprints202102.0060.v1

48. Manina, G.; Dhar, N.; & McKinney, J. D.; Stress and host immunity amplify Mycobacterium tuberculo-
sis phenotypic heterogeneity and induce nongrowing metabolically active forms. Cell host & mi-
crobe 2015, 17(1), 32-46.
49. Priestman, M.; Thomas, P.; Robertson, B. D.; & Shahrezaei, V.; Mycobacteria modify their cell size
control under sub-optimal carbon sources. Frontiers in cell and developmental biology 2017, 5: 64.
50. Justice, S. S.; Hunstad, D. A.; Cegelski, L.; & Hultgren, S. J.; Morphological plasticity as a bacterial sur-
vival strategy. Nat. Reviews Micro. 2008, 6(2), 162-168.
51. Koch, A.; Mizrahi, V.; & Warner, D. F.; The impact of drug resistance on Mycobacterium tuberculosis
physiology: what can we learn from rifampicin? Emerging microbes & infections 2014, 3(1), 1-11.
52. Monds, R. D.; Lee, T. K.; Colavin, A.; Ursell, T.; Quan, S.; Cooper, T. F.; & Huang, K. C.; Systematic per-
turbation of cytoskeletal function reveals a linear scaling relationship between cell geometry and fit-
ness. Cell Reports 2014, 9(4): 1528-1537.
53. Bos, J.; Zhang, Q.; Vyawahare, S.; Rogers, E.; Rosenberg, S. M.; & Austin, R. H.; Emergence of antibi-
otic resistance from multinucleated bacterial filaments. Proc. Nat. Acad. Sci. USA 2015, 112(1), 178-
183.
54. Rodríguez-Verdugo, A.; Carrillo-Cisneros, D.; González-González, A.; Gaut B.S.; & Bennett, A.F. Differ-
ent tradeoffs result from alternate genetic adaptations to a common environment. Proc. Natl. Acad.
Sci. U S A. 2014, 111(33):12121-6. doi: 10.1073/pnas.1406886111. PMID: 25092325; PMCID:
PMC4143048.
55. Cheng, K. K.; Lee, B. S.; Masuda, T.; Ito, T.; Ikeda, K.; Hirayama, A., Deng, L.; Dong, J.; Shimizu, K.; Soga,
T.; Tomita, M.; Palsson, B.O.; & Tomita, M.; Global metabolic network reorganization by adaptive mu-
tations allows fast growth of Escherichia coli on glycerol. Nat. Comm. 2014, 5(1), 1-9.
56. Petcharoen, K.; & Sirivat, A.; Synthesis and characterization of magnetite nanoparticles via the chem-
ical co-precipitation method. Mat. Sci. Eng. B 2012, 177(5), 421-427.
57. Wei, L.; Lu, J.; Xu, H.; Patel, A.; Chen, Z. S.; & Chen, G.; Silver nanoparticles: synthesis, properties, and
therapeutic applications. Drug Discovery Today 2015, 20(5), 595-601.
58. Kaushik, D.; Mohan, M.; Bora De, D. M.; & Swami, O. C.; Ampicillin: rise fall and resurgence. JCDR
2014, 8(5), ME01.
59. Grossman, T. H.; Tetracycline antibiotics and resistance. Cold Spr. Harbor Pers. Med. 2016, 6(4),
a025387.
60. Samigulina, G. A.; & Samigulina, Z. I.; Drag design of sulfanilamide based on the technology of im-
mune network modeling and ontological approach. In 2016 IEEE 10th International Conference on
Application of Information and Communication Technologies 2016, (AICT) (pp. 1-5). IEEE.
61. Chandrasekaran, K.; Varaprasad, K.; Venugopal, S. K.; Arun, L.; & Hameed, A. S. H.; Synergistic anti-
bacterial effect of the magnesium-doped ZnO nanoparticles with chloramphenicol. BioNanoScience
2019, 1-6.
62. Somoskovi, A.; Parsons, L. M.; & Salfinger, M.; The molecular basis of resistance to isoniazid, rifam-
pin, and pyrazinamide in Mycobacterium tuberculosis. Respiratory Research 2001, 2(3), 164.
63. White-Ziegler, C. A.; Um, S.; Perez, N. M.; Berns, A. L.; Malhowski, A. J.; & Young, S.; Low temperature
(23 C) increases expression of biofilm-, cold-shock-and RpoS-dependent genes in Escherichia coli K-
12. Microbiology 2008, 154(1), 148-166.
Preprints (www.preprints.org) | NOT PEER-REVIEWED | Posted: 1 February 2021 doi:10.20944/preprints202102.0060.v1

64. Zaw, M.T.; Emran, N.A.; Lin, Z.; Mutations inside rifampicin-resistance determining region of rpoB
gene associated with rifampicin-resistance in Mycobacterium tuberculosis. J Infect Public Health.
2018 11(5): 605-610. doi: 10.1016/j.jiph.2018.04.005. PMID: 29706316.
65. Knöppel, A.; Näsvall, J.; & Andersson, D. I.; Evolution of antibiotic resistance without antibiotic expo-
sure. Antimicrobial Agents and Chemotherapy 2017, 61(11).
66. Graves, J.L.; Thomas, M.; Ewunkem, J.A.; Antimicrobial Nanomaterials: Why Evolution Matters. Nano-
materials (Basel). 2017, 7(10):283. doi: 10.3390/nano7100283. PMID: 28934114; PMCID:
PMC5666448.
Preprints (www.preprints.org) | NOT PEER-REVIEWED | Posted: 1 February 2021 doi:10.20944/preprints202102.0060.v1