Embed Size (px)
Citation preview
HAL Id: hal-01472719https://hal.archives-ouvertes.fr/hal-01472719
Submitted on 21 Feb 2017
HAL is a multi-disciplinary open accessarchive for the deposit and dissemination of sci-entific research documents, whether they are pub-lished or not. The documents may come fromteaching and research institutions in France orabroad, or from public or private research centers.
L’archive ouverte pluridisciplinaire HAL, estdestinée au dépôt et à la diffusion de documentsscientifiques de niveau recherche, publiés ou non,émanant des établissements d’enseignement et derecherche français ou étrangers, des laboratoirespublics ou privés.
Experimental flowloop study on methane hydrateformation and agglomeration in high water cut emulsion
systemsTrung-Kien Pham, Ana Cameirao, Jean-Michel Herri
To cite this version:Trung-Kien Pham, Ana Cameirao, Jean-Michel Herri. Experimental flowloop study on methanehydrate formation and agglomeration in high water cut emulsion systems. Assoc. Prof. Dr. Le HaiAn. INTERNATIONAL CONFERENCES ON EARTH SCIENCES AND SUSTAINABLE GEO-RESOURCES DEVELOPMENT -ESASGD 2016-, Nov 2016, Hanoï, Vietnam. TRANSPORT PUB-LISHING HOUSE, pp.187 à 198, 2016, Proceedings of the ESASGD 2016 - ISBN:978-604-76-1171-3.<http://geo.humg.edu.vn/attachments/article/347/First_Announcement_and_Call_for_Papers_last_updated__20160314143911.pdf>.<hal-01472719>
Available online at www.humg.edu.vn
ESASGD 2016 IPE (2016)
International Conference on Integrated Petroleum Engineering (IPE)
Experimental flowloop study on methane hydrate formation and
agglomeration in high water cut emulsion systems
Trung-Kien PHAMa,b
, Ana CAMEIRAOa,*
, Jean-Michel HERRIa
a Gas Hydrate Dynamics Centre, Ecole Nationale Supérieure des Mines de Saint-Etienne, 158 Cours Fauriel, Saint-Etienne
42023, France b Department of Oil Refining and Petrochemistry, Oil and Gas Faculty, Hanoi University of Mining and Geology, 18 Pho Vien,
Duc Thang, Bac Tu Liem, Ha Noi, Viet Nam
Abstract
As an oil or a gas field gradually matures, the amount of water produced (water cut) increases, and the hydrate risk
also increases. Especially in the offshore systems, operating at low temperature and high pressure, conditions are favourable
to the formation of gas hydrate, from the combination of liquid water and gas molecules, under the form of a solid phase. It
is a serious issue in the flow assurance; it may cause many troubles, up to plugging.
This work brings new understanding on hydrate kinetics of crystallization, nucleation and growth, agglomeration,
breakage and deposition under flowing. We focused on high water cut emulsion systems under flowing and we studied the
role of commercial anti-agglomerants or low dosage hydrate inhibitors (AA-LDHIs). These additives can disperse hydrate
particles to prevent plugging. More specifically, the topic of this study concerns methane hydrate crystallization,
agglomeration and hydrate slurry transportation in a flowloop at high water cut systems, with and without AA-LDHI. We
have been used up-to-date measurements and calculations among FBRM (Focused Beam Reflectance Measurement), PVM
(Particle Video Microscope), pressure, pressure drop, flowrate/density, hydrate conversion and hydrate volume fraction. In
this study, we performed the experiments at very high water volume fractions (80-90-100%) in laminar regime (150L/h)
with and without anti-agglomerants. The results showed that using gas-lift system (riser), dramatic events were witnessed
with a high rate of methane hydrate formation, followed with a quick agglomeration and leading to plugs, even with
additive. But we also observed a dramatic foaming event, even at low AA-LDHI concentration of 0.01%.
We concluded our work with a discussion of the agglomeration mechanisms, based on a quick hydrate formation
and agglomeration rates.
Keywords: Emulsion, Gas bubble, Gas hydrate formation, Agglomeration, Anti-agglomerants, Hydrate slurry transport, Suspension, Flow
assurance, and Multiphase flow.
1. Introduction
Gas hydrates (or clathrate hydrates) are ice-like crystalline structures composed of molecular water
cages stabilized by light hydrocarbon gases (methane, ethane, propane, etc) at low temperature and high
pressure conditions (Sloan and Koh, 2008). Gas hydrate formation is a great concern in flow assurance which
faces a potential hazard (plug) to oil and natural gas transportation once they form in deep-sea pipelines. There
are several strategies to manage this risk including: addition of thermodynamic inhibitors (THIs), kinetic hydrate
inhibitors (KHIs) and commercial anti-agglomerants or low dosage hydrate inhibitors (AA-LDHIs). The most
traditional method to prevent gas hydrates is thermodynamic inhibition which shifts the hydrate equilibrium
conditions to higher pressure and lower temperature. However, the severe conditions (higher pressures, lower
temperatures, higher acid gas contents, higher water cuts) in oil and gas transportation make thermodynamic
prevention less acceptable because of high amount of THIs used. To reduce the cost, KHIs and/or AA-LDHIs
are used at a very small amount compared to THIs. In fact, KHIs may delay the nucleation or growth of hydrate
formation while AA-LDHIs allow the hydrate formation but help to maintain hydrate particles dispersed in
flowlines.
Low water cut systems have been studied previously. Camargo and Palermo et al., (2002) developed a
rheological model for suspension and agglomeration of hydrate particles in an asphaltenic crude oil based on the
data obtained from laboratory and flow loop scales. In their work, water in oil emulsion was prepared at low
2
water cut (15-50%) and without anti-agglomerants. Turner et al., (2005) also studied gas hydrate formation in
emulsion, both autoclave and flowloop, and water cut of (5%-35%) and without anti-agglomerants. Other
publications concerning the understanding of kinetics and mechanisms of methane gas hydrate formation and
agglomeration, as well as flow characteristics and rheological properties of natural gas hydrate slurry, in low
water fraction, with and without anti-agglomerants are: Colombel et al., 2008; Lachance et al., 2008; Didier et
al., 2009; Bo-Hui Shi et al., 2011; Liang Mu et al., 2013; Ke-Le Yan et al., 2013.
In high water cut systems, insights into gas hydrate formation and dissociation in emulsion were
developed by Greaves et al., 2008. This contribution mainly focused on the effects of hydrate formation and
dissociation on the stability of high water content emulsion. Afterwards, the hydrate formation and
agglomeration and rheology of hydrate slurry were investigated in high water fraction with and without anti-
agglomerants by the following authors : Gao et al., 2009; Shiva Talatori et al., 2011; Hossein Moradpour et al.,
2011; Prasad et al., 2011; Joshi et al., 2013; Jun Chen et al., 2014, 2015.
The study concerning gas hydrate formation and agglomeration in the Archimede flowloop (this
apparatus simulates the actual pipeline conditions) at Ecole des Mine de Saint-Etienne was firstly conducted by
Fidel-Dufour et al.,(2006). This work showed the rheological properties of hydrate slurry of water in dodecane
emulsion at low water cuts (5-30%) and in the presence of anti-agglomerants (0-0.5%). A model was also
developed to describe crystallization and rheology based on the flow loop experimental data. Leba et al., (2010)
studied the formation and agglomeration of gas hydrate particles in water in oil (Kerdane®) emulsion with low
water cuts (5-30%) and with the presence of anti-agglomerants (0.5-1%) in flow loop using the Focused Beam
Reflectance Measurement (FBRM probe). Recently, Mendes-Melchuna et al., (2016) investigated gas hydrate
formation and agglomeration in emulsion with different water cuts (from low to high water cuts), flowrates and
different amount of additives (AA-LDHIs) by using FBRM and PVM measurements.
In general, most of the previous studies on gas hydrate formation and agglomeration and rheological
characteristics of hydrate slurry merely focused on the low water cut, in small scale (autoclave) and without
anti-agglomerants. In contrast, at high water cut, the gas hydrate formation and agglomeration mechanisms in
the presence of AA-LDHI in flowlines are poorly understood. The aim of this work is to go deeper in this
understanding of hydrate crystallization and agglomeration in pipelines at high water cut, with emulsion
systems, and effects of AA-LDHIs.
2. Experimental Methodology
2.1. Flowloop description
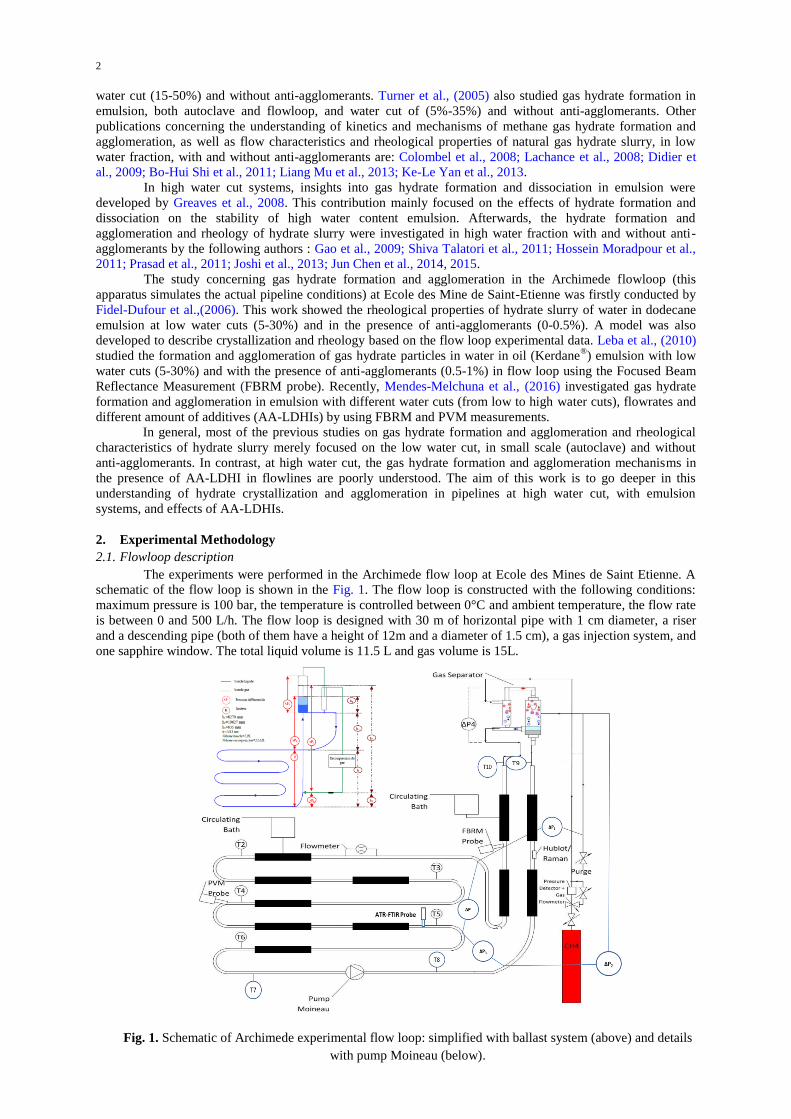
The experiments were performed in the Archimede flow loop at Ecole des Mines de Saint Etienne. A
schematic of the flow loop is shown in the Fig. 1. The flow loop is constructed with the following conditions:
maximum pressure is 100 bar, the temperature is controlled between 0°C and ambient temperature, the flow rate
is between 0 and 500 L/h. The flow loop is designed with 30 m of horizontal pipe with 1 cm diameter, a riser
and a descending pipe (both of them have a height of 12m and a diameter of 1.5 cm), a gas injection system, and
one sapphire window. The total liquid volume is 11.5 L and gas volume is 15L.
Fig. 1. Schematic of Archimede experimental flow loop: simplified with ballast system (above) and details
with pump Moineau (below).
3
In this experimental apparatus, some probes are equipped to monitor the gas hydrate formation and
agglomeration, including: the sensors of temperature (thermocouples) and pressure; the probes of pressure drop
(differential pressure transducer) for evaluating the viscosity afterwards, and identifying the plugging troubles;
the Focused Beam Reflectance Measurement (FBRM) probe for detecting particle size distribution of emulsion
droplets and hydrates (via their chord lengths); the Particle Video Microscope (PVM) probe to observe the
emulsion, the gas hydrate formation and agglomeration phenomena; the Attenuated Total Reflection (ATR)
probe for determining the concentration of methane and phase inversion of emulsion in fluid flow. Also, the
mass flow meter is installed for measuring the flow rate and density. A pump Moineau and/or a gas-lift system
are used to circulate the fluids in the flow loop. In this experimental set-up, we used a gas-lift or ballast system
which is described in Fidel-Dufour et al., 2006. The cooling systems control the temperature in the flow loop at
(4-5oC) by using the water/ethanol circulation jacket attached to the flowloop. The gas compensation system
(pressure controller) keeps the total pressure at a constant value (75 bar).
2.2. Materials and experimental procedure
Emulsions are formed by mixing water (ultrapure water, provided from Millipore filter) and oil
(Kerdane®, provided by TOTAL FLUID) with or without a small amount of commercial anti-agglomerants
(0.01%). The composition of Kerdane and anti-agglomerants is shown in Table A.1, Appendix A. Because of
foam formed in the mixture at 80%WC-0.01%AA-LDHI, 5 ppm of silicone oil (M.40.165.10 provided by
Huber) was added only for this experiment. The mixture was charged into the flow loop and circulated at the
flow rate of 150L/h to induce emulsification or dispersion. This circulation in the loop is carried out by a gas lift
by injecting the compressed air (at 4-5oC and atmospheric pressure) at the bottom of the riser. The flowloop
tests are shown in the Table 1.
Table 1. Experimental conditions for flowloop tests.
No. WC (%) Temp. (oC) Press. (bar) Flowrate (L/h) AA-LDHI (%wt)
1 100 4-5 75 150 0
2.rp 100 4-5 75 150 0
3 100 4-5 75 150 0.01
4 90 4-5 75 150 0
5 90 4-5 75 150 0.01
6 80 4-5 75 150 0
7 80 4-5 75 150 0.01
Firstly, the mixture in the flow loop system was circulated at a desired flowrate (150L/h) and cooled
down to 4-5oC. Then it was pressurized up to 75 bar by the injection of methane (99.99 % purity supplied by
AIR LIQUID) and ballast system was started. During the gas solubilization, we measured the total pressure
decrease versus time to evaluate the gas transfer rate. Then, we performed a second injection up to 75 bar, and
gas was consumed again by solubilization but in smaller quantity. Then, pressure stabilized and we waited for
the gas hydrate formation (and agglomeration) which will again consume gas. During the hydrate formation, we
monitored the gas consumption rate, the pressure drop in the horizontal section and in the separator, the
temperature, the FBRM and the PVM signals. At the end of experiment (when crystallization is finished or/and
pipe is plugged), the liquid and gas were depressurized to the ambient pressure and the cooling system was
stopped. Finally, the remaining mixture was taken out of flow loop, which was cleaned two times with tap water
and finally with pure water for the next experiment. All experimental data were online recorded by LABVIEW,
V819 PVM software from METTLER-TOLEDO, LASENTEC® products and LASENTEC® FBRM data
acquisition software. The experimental data were treated and analyzed on a computer.
3. Results and discussion
3.1. Emulsification
Fig. 2 shows the pressure drop and average chord length during emulsification for the experiments
without AA-LDHI. It can be concluded from Fig. 2 that the emulsion is quite homogeneous regarding its entire
volume. In fact, we observed a constant pressure drop, so the emulsion was not partitioned under sections of
different water cut. However, the droplet size of emulsion was fairly stable even if the signal had little
fluctuations at the beginning but it was steady at the end of experiment. It can be explained by an un-stationary
dispersion/agglomeration process. The size was controlled mechanically from the shear stress only. Chord
length distribution appeared in the mixture of 100%WC due to some oil still may stick in flowloop during
cleaning or/and the presence of gas bubble in the flow.

4
Fig. 2. Pressure drop (solid line) and average chord length (dashed line) during emulsification for the
experiments without AA-LDHI.
By addition of AA-LDHI (Fig. 3), although pressure drop measurements still remained stable, the
average chord length decreased significantly with the mixture at 100%WC. In contrast, a slight fluctuation of
mean droplet size was witnessed for mixture at 80%WC and 90%WC. This can be explained because oil attracts
AA-LDHI more than water and the formation of oil in water emulsion may reduce the AA-LDHI aggregation in
water. As a result, AA-LDHI dispersed more uniformly in water once oil is added and this helps emulsion more
stable (Minwei Sun et al., 2014). From Fidel-Dufour’s work, it can be concluded that concentration of
0.01%AA-LDHI in all mixtures is higher than critical micelle concentration (CMC). Furthermore, the
concentration of additives is very low, and it is not enough to stabilize the emulsion chemically.
Some foam was also formed in the mixtures with AA-LDHI. It is assumed that the low interfacial
tension between oil, water and compressed air leads to foaming.
Fig. 3. Pressure drop (solid line) and average chord length (dashed line) during emulsification for the
experiments with 0.01% AA-LDHI.
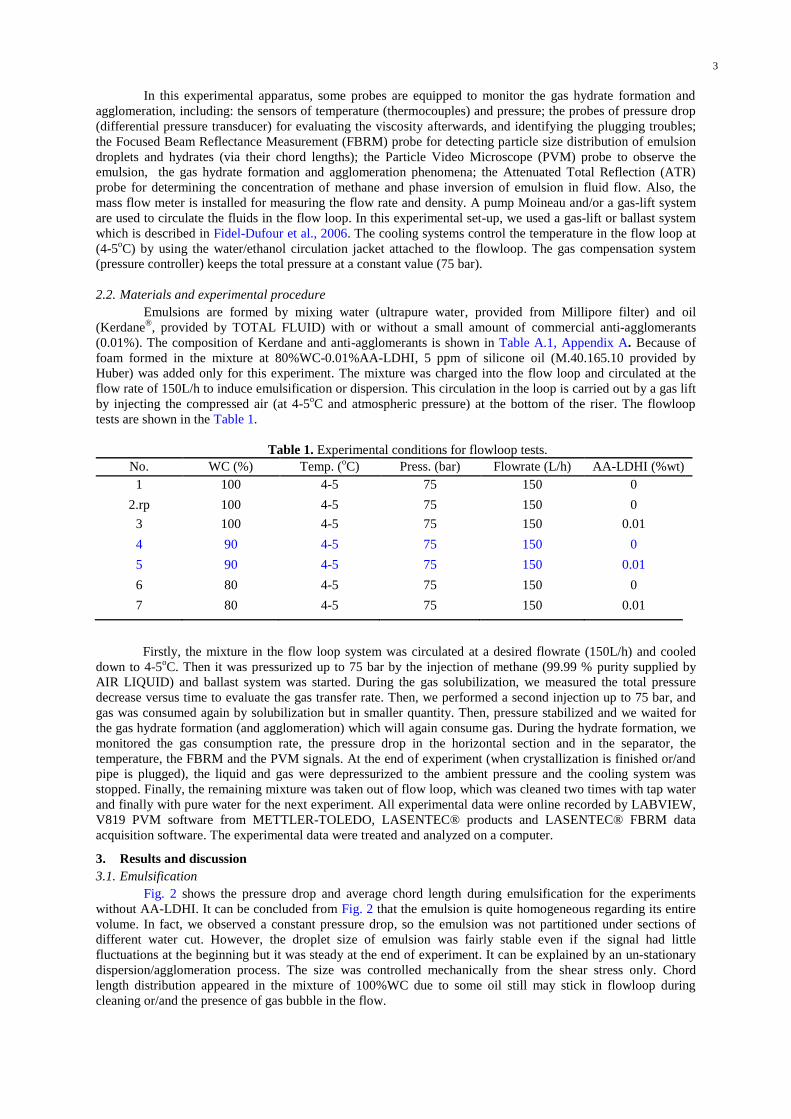
PVM images (Fig. 4) show numerous droplets in the emulsion during emulsification. In this case, in
very high water cut emulsion systems, it is supposed that they are oil droplets in a water continuous phase.
a) b)
0
2
4
6
8
10
12
0
0,1
0,2
0,3
0,4
0,5
0,6
0 10 20 30 40
Ave
rage
Ch
ord
Le
ngt
h (
µm
)
Pre
ssu
re D
rop
(b
ar)
Time (min)
PD 100%WC PD 90%WC
PD 80%WC ACL 100%WC
ACL 90%WC ACL 80%WC
0
2
4
6
8
10
12
0
0,1
0,2
0,3
0,4
0,5
0,6
0,7
0,8
0 10 20 30 40
Ave
rage
Ch
ord
Le
ngt
h (
µm
)
Pre
ssu
re D
rop
(b
ar)
Time (min)
PD 100%WC-0.01%AA PD 90%WC-0.01%AA
PD 80%WC-0.01%AA ACL 100%WC-0.01%AA
ACL 90%WC-0.01%AA ACL 80%WC-0.01%AA
5
c) d)
Fig. 4. PVM images of different mixtures during emulsification: (a) 90%WC without AA-LDHI; (b)
80%WC without AA-LDHI; (c) 90%WC with AA-LDHI; (d) 80%WC with AA-LDHI.
In general, addition of AA-LDHI caused foam and instable signals in terms of average chord length
and pressure drop but the average chord length is more stable at 80%WC and 90%WC thanks to oil. We assume
that it is due to lower interfacial tension between oil, water and compressed air. Mean droplet size of emulsion is
approximately 10 µm from the FBRM measurements in all experiments.
3.2. Crystallization
3.2.1. Onset of gas hydrate formation and plugging
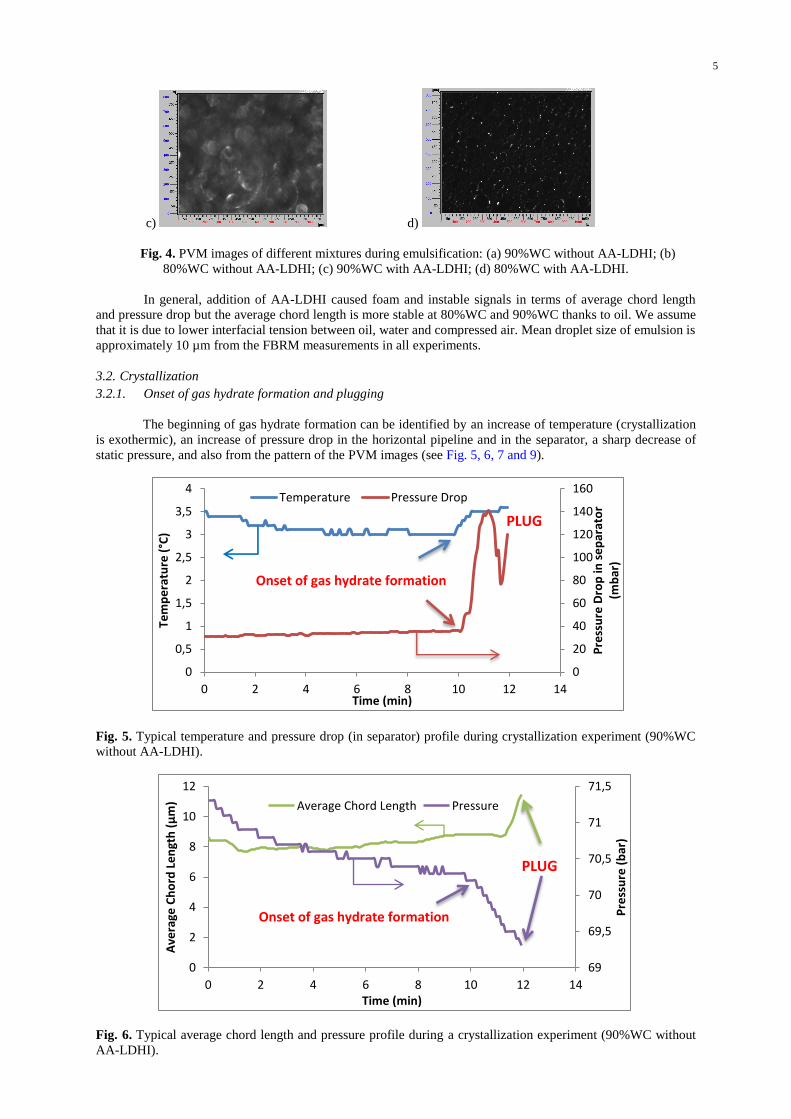
The beginning of gas hydrate formation can be identified by an increase of temperature (crystallization
is exothermic), an increase of pressure drop in the horizontal pipeline and in the separator, a sharp decrease of
static pressure, and also from the pattern of the PVM images (see Fig. 5, 6, 7 and 9).
Fig. 5. Typical temperature and pressure drop (in separator) profile during crystallization experiment (90%WC
without AA-LDHI).
Fig. 6. Typical average chord length and pressure profile during a crystallization experiment (90%WC without
AA-LDHI).
0
20
40
60
80
100
120
140
160
0
0,5
1
1,5
2
2,5
3
3,5
4
0 2 4 6 8 10 12 14
Pre
ssu
re D
rop
in s
ep
arat
or
(mb
ar)
Tem
pe
ratu
re (
°C)
Time (min)
Temperature Pressure Drop
Onset of gas hydrate formation
PLUG
69
69,5
70
70,5
71
71,5
0
2
4
6
8
10
12
0 2 4 6 8 10 12 14
Pre
ssu
re (
bar
)
Ave
rage
Ch
ord
Le
ngt
h (
µm
)
Time (min)
Average Chord Length Pressure
Onset of gas hydrate formation
PLUG

6
Results from Table 2 show that, despite the small hydrate volume in the flowloop, in each test the plug
happened very quickly (some tens of seconds) after the beginning of the gas hydrate formation. This time
elapsed between the nucleation and the plugging is named “flowing time” in this study. We observed a general
trend that the higher the amount of oil the longer the flowing time, both with and without AA-LDHI.
Table 2. Summary of the experimental results for high water cut flowloop tests.
No. WC
(%)
AA-LDHI
(%)
Conversion
(%)
Hydrate Volume
(%)
Nucleation time
(min)
Flowing time
(min)
1 100 0 1.27 1.59 1.30 1.60
2.rp 100 0 0.99 1.24 10.50 1.60
3 100 0.01 0.50 0.64 12.90 1.10
4 90 0 2.17 2.44 11.50 2.10
5 90 0.01 2.06 2.33 24.60 2.00
6 80 0 1.07 1.07 7.10 3.50
7 80 0.01 3.60 3.60 1.50 8.80
Fig. 7. Typical flowrate and pressure drop (horizontal line) profiles during crystallization experiments (80%WC
without AA-LDHI).
Plug time is defined in this work when the flow rate falls to zero (Fig. 7). At the same time, we
observed a dis-functioning of gas-lift system which began working abnormally. When hydrates form, they may
agglomerate and it is evidenced by an increase of pressure drop, and the increase of the average chord length.
The increases of both are observed on Fig. 6 and 7 and are also reported by (Leba et al., 2010; Jun Chen et al.,
2014). In all tests, there is a slight increase of pressure drop in horizontal sections (Fig. 7) once hydrate is
formed. The hydrate volume (shown in Table 2) is not important enough to yield to a big increase in pressure
drop in the horizontal parts of flowloop. Also, we know from previous work (Young hoon Sohn et al., 2015 and
Joshi et al., 2013) that agglomeration may not produce sharp increase in pressure drop but high pressure drops
were observed only once hydrate deposited on the wall of pipe.
3.2.2. Effect of water cut on gas hydrate formation and agglomeration
Fig. 5 and 6 showed the experimental results of mixture with 90%WC, without AA-LDHI. It is a
representative experimental test, showing a quick increase of pressure drop in separator, and also an important
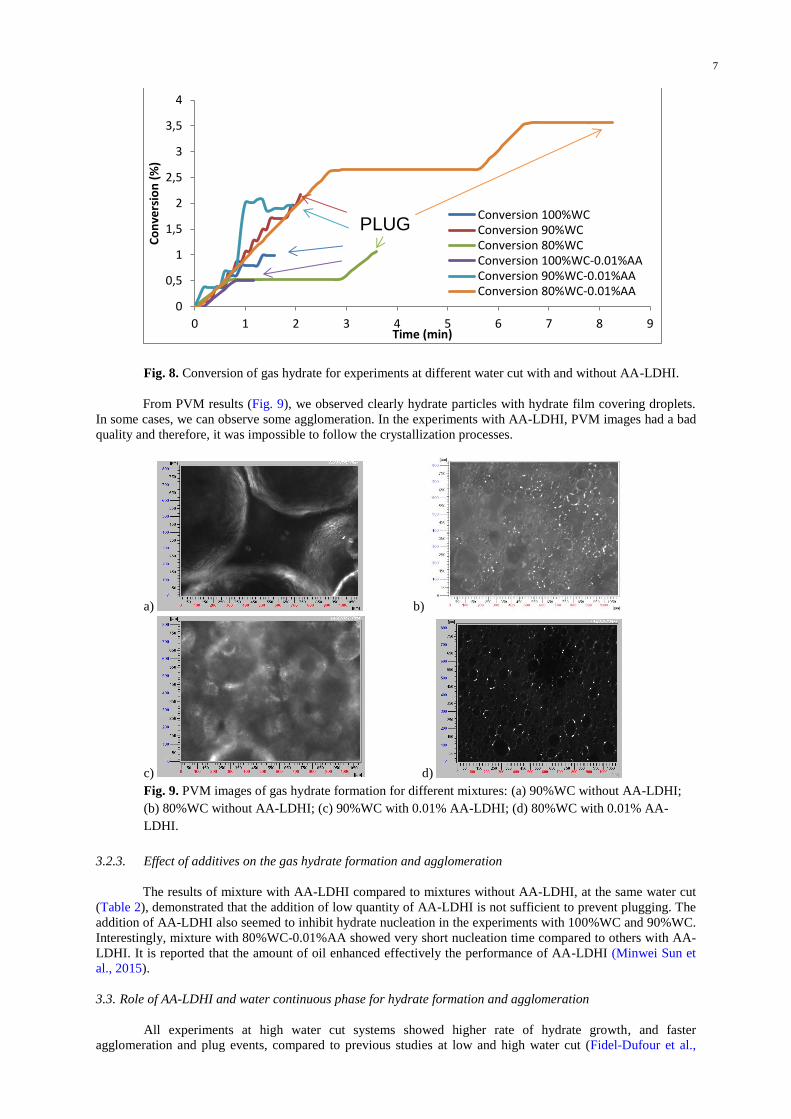
decline of static pressure once hydrate formation starts. Fig. 8 shows the hydrate conversion at different high
water cuts (80-90-100%) with and without AA-LDHI. On each curve, the end of plots corresponds to the plug
formation time. The longer the plot the longer the flowing time. The results illustrated that without AA-LDHI,
higher water cut mixtures exhibited lower capability to prevent plugs or higher risk of hydrate blockage. And it
is also observed for the mixtures in the presence of AA-LDHI. At the beginning, the rate of gas consumption is
almost equal in all experiments. But after approximately one minute, the conversion rate of mixture at 90%WC-
0.01%AA-LDHI increased sharply and remained nearly unchanged. On the contrary, hydrate conversion of the
mixture at 100%WC-0.01%AA-LDHI and 80%WC was stable and it had slight increment afterwards.
0
20
40
60
80
100
120
140
0
0,05
0,1
0,15
0,2
0,25
0,3
0,35
0,4
0,45
0 2 4 6 8 10
Flo
wra
te (
L/h
)
Pre
ssu
re D
rop
(b
ar)
Time (min)
Pressure Drop Flowrate
Onset of gas hydrate formation
PLUG
7
Fig. 8. Conversion of gas hydrate for experiments at different water cut with and without AA-LDHI.
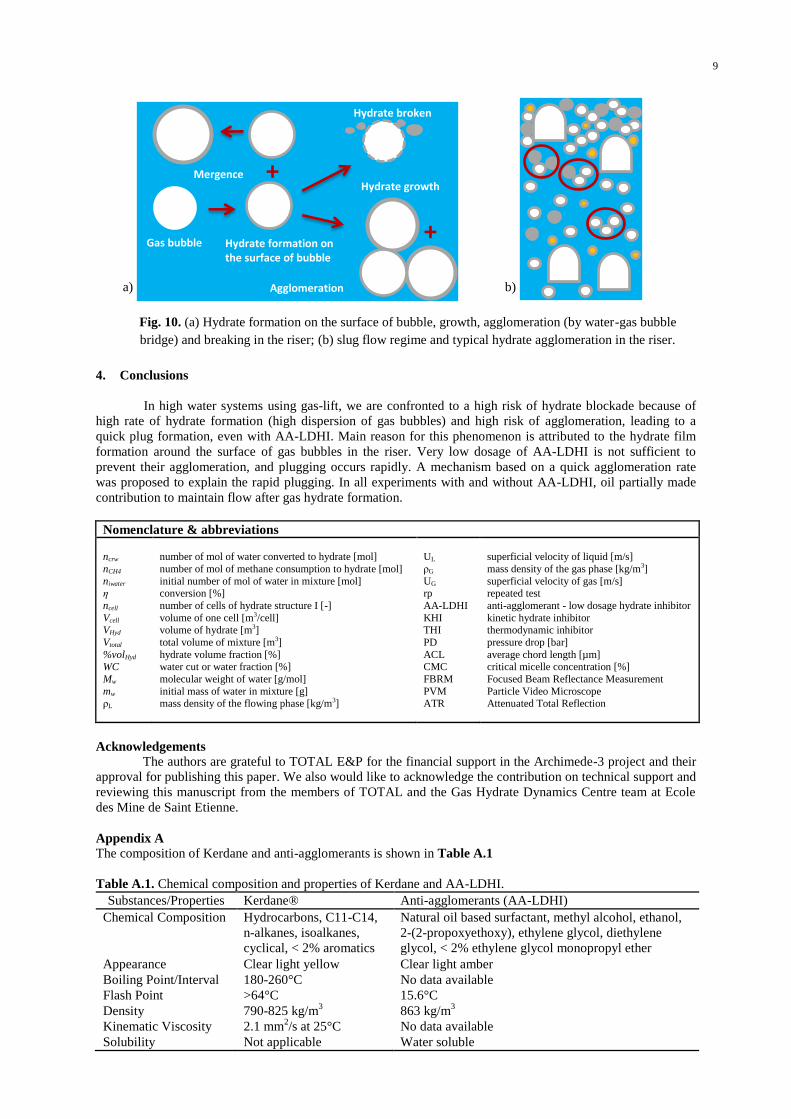
From PVM results (Fig. 9), we observed clearly hydrate particles with hydrate film covering droplets.
In some cases, we can observe some agglomeration. In the experiments with AA-LDHI, PVM images had a bad
quality and therefore, it was impossible to follow the crystallization processes.
a) b)
c) d)
Fig. 9. PVM images of gas hydrate formation for different mixtures: (a) 90%WC without AA-LDHI;
(b) 80%WC without AA-LDHI; (c) 90%WC with 0.01% AA-LDHI; (d) 80%WC with 0.01% AA-
LDHI.
3.2.3. Effect of additives on the gas hydrate formation and agglomeration
The results of mixture with AA-LDHI compared to mixtures without AA-LDHI, at the same water cut
(Table 2), demonstrated that the addition of low quantity of AA-LDHI is not sufficient to prevent plugging. The
addition of AA-LDHI also seemed to inhibit hydrate nucleation in the experiments with 100%WC and 90%WC.
Interestingly, mixture with 80%WC-0.01%AA showed very short nucleation time compared to others with AA-
LDHI. It is reported that the amount of oil enhanced effectively the performance of AA-LDHI (Minwei Sun et
al., 2015).
3.3. Role of AA-LDHI and water continuous phase for hydrate formation and agglomeration
All experiments at high water cut systems showed higher rate of hydrate growth, and faster
agglomeration and plug events, compared to previous studies at low and high water cut (Fidel-Dufour et al.,
0
0,5
1
1,5
2
2,5
3
3,5
4
0 1 2 3 4 5 6 7 8 9
Co
nve
rsio
n (
%)
Time (min)
Conversion 100%WCConversion 90%WCConversion 80%WCConversion 100%WC-0.01%AAConversion 90%WC-0.01%AAConversion 80%WC-0.01%AA
PLUG

8
2006; Leba et al., 2010; Mendes-Melchuna et al., 2015). Our experiments differ due to the presence of a gas lift
section. It can be hypothesized that gas hydrate is formed in the riser at a higher rate due to the good quality of
the gas dispersion. We also suspect an accumulation of the particles in the separator (once a significant surge in
the pressure drop of the separator was observed). Moreover, all of the experiments have been performed at high
water cut. Due to the gas-lift system, it can promote a different and quicker growth and agglomeration rates
when compared to literature at low water cut where the systems are mainly oil dominated. At high water cut, our
system becomes water continuous, and it modifies the activity of bubbles, and interaction between continuous
phase and the surface of pipelines. Furthermore, the formation of a water-gas bubble bridge between hydrate
particles may be more dynamic.
Firstly, it can be attributed to gas hydrate formation at the surface of gas bubbles which has been
previously observed by Hideo Tajima et al., 2009 and Y.-T.Luo et al., 2006. Moreover, we have to take into
account an un-expected formation of foam. For the experiment at 80%WC with AA-LHDI, we observed more
foam in comparison with other experiments with AA-LDHI, and also a very short time of nucleation. Both could
be attributed to the high contact surface area between oil, water and gas, because a dispersed and fine population
of gas bubbles and foam is formed.
Secondly, hydrate bridges between hydrate particles also contributes as one of principal reasons for a
rapid agglomeration. Here, hydrate film formed on the gas and/or foam surfaces perhaps favors links between
hydrate particles. In this explanation, we assumed that thanks to a lot of bubbles in the riser, hydrates can readily
form on the surface of bubbles, and these bubbles, surrounded by water, may play a vital role as the water-gas
bubble bridge, which later are transformed into hydrate-gas bubble easily. This created a higher rate of
agglomeration resulting in a blockage.
Thirdly, at high water cut, water is the continuous phase and it also means that water covers almost the
pipeline surface. As a result, when hydrate formed, in the presence of water film between the pipe surface and
hydrate particles, it modified the interaction between the hydrate particle and the pipe wall. It is a different case
when oil is the continuous phase at low water fraction. G.Aspenes et al., 2009 considered that the adhesion force
of hydrate particles and pipe surface with water droplets is much higher than hydrate-hydrate adhesion force or
hydrate-pipe wall interaction without water layer. It can explain that hydrates deposit on the pipe wall once they
formed leading to plug quickly.
In addition, low flow rate and small diameter of pipe may contribute to the gas hydrate deposition.
Moreover, from the average chord length results, using gas lift systems, mean droplet size of emulsion is quite
small (~10µm) compared to that of previous work (Mendes-Menchuna et al., 2016) using protocol with pump
Moineau. It is perhaps another reason which causes higher gas hydrate formation due to larger contact surface
between oil and water. Because of lower velocity of bubbles at higher height in the riser, hydrate covering
bubbles catch up at the top of riser and they agglomerate below the bulk gas-liquid interface in separator which
leads to a sudden increase of pressure drop in separator and causes plug (Y.-T.Luo et al., 2006). Beside, bubbles
in the riser not only enhance gas transfer to emulsion to reach faster gas saturation in emulsion but also promote
gas transfer once hydrate formed causing higher rate of gas hydrate formation.
The role of oil to prevent plugging in the presence of AA-LDHI has been enlightened by (Minwei Sun
et al., 2014, 2015). They supposed that surfactants absorbed on the hydrate surface, and they created
hydrophobic layers which attract oil to cover on the hydrate surface, thus it led to prevent plugging. The similar
explanation to the role of oil on emulsion stabilizing in the presence of AA-LDHI (discussed in section 3.1) may
be applied to anti-agglomeration capacity of AA-LDHI with the support of oil. By this way, more AA-LDHI can
absorb on hydrate particle surface and prevent agglomeration. In our case, the plug still happened because of
low dosage of AA-LDHI. In cases without AA-LDHI, perhaps, oil dispersed into water phase slightly hindered
adherence forces between hydrate particles.
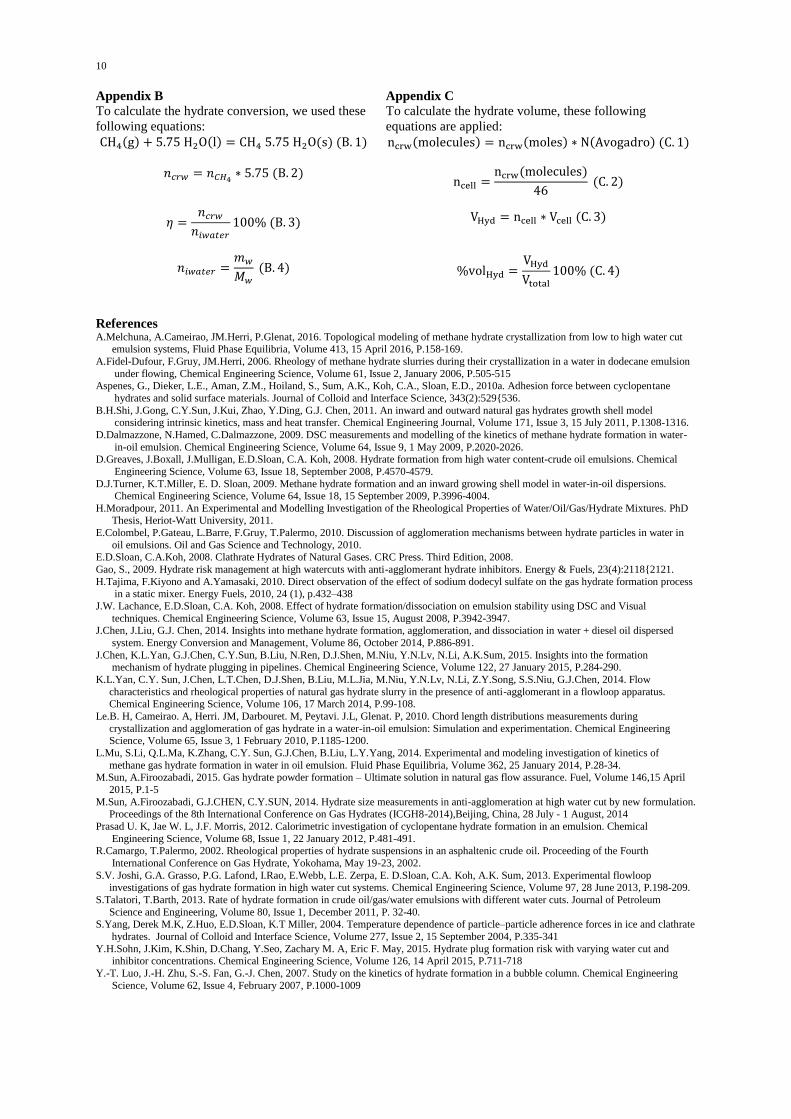
3.4. Proposed mechanism
According to (Fidel-Dufour et al., 2006), flow in the riser of our flowloop shows a slug flow pattern
(ρLUL2
=15 kg/m.s2; ρGUG
2=3 kg/m.s
2 with UG/(UG+UL)=0.64), which is encountered in small diameter riser
(<0.05 m). From proposed mechanism (Fig. 10), it is considered that once hydrate formed on the gas bubble
surface in the riser, it can merge with other hydrate covering bubbles, creating a bigger one. Also, hydrate film
covering gas bubbles can be broken into free hydrate particles and the free gas and it can be recovered itself by a
new hydrate film, and/or can agglomerate by dint of adherence forces between hydrate particles (Hideo Tajima
et al., 2009; Yang et al., 2004; Y.-T.Luo et al., 2006).
From experimental results, we witnessed very high rate of hydrate growth (gas consumption) at
different water cut experiments. It can be explained by the dominance of gas bubbles in the riser comparing to
oil droplets. The oil droplets may contain some dissolved gases which lead to the formation of a hydrate layer
covering their surface but maybe fewer and smaller than hydrate covering bubbles. The main reason explaining
the quick formation of plugs immediately after the nucleation may be the high rate of gas hydrate formation
around the gas bubble, cracks from hydrate shell (this helps promoting mass transfer) and their rapid
agglomeration due to water-gas bubble bridge between hydrate particles and hydrate deposition as described
above (section 3.3).
9
a) b)
Fig. 10. (a) Hydrate formation on the surface of bubble, growth, agglomeration (by water-gas bubble
bridge) and breaking in the riser; (b) slug flow regime and typical hydrate agglomeration in the riser.
4. Conclusions
In high water systems using gas-lift, we are confronted to a high risk of hydrate blockade because of
high rate of hydrate formation (high dispersion of gas bubbles) and high risk of agglomeration, leading to a
quick plug formation, even with AA-LDHI. Main reason for this phenomenon is attributed to the hydrate film
formation around the surface of gas bubbles in the riser. Very low dosage of AA-LDHI is not sufficient to
prevent their agglomeration, and plugging occurs rapidly. A mechanism based on a quick agglomeration rate
was proposed to explain the rapid plugging. In all experiments with and without AA-LDHI, oil partially made
contribution to maintain flow after gas hydrate formation.
Nomenclature & abbreviations ncrw
nCH4
niwater η
ncell
Vcell VHyd
Vtotal
%volHyd WC
Mw
mw ρL
number of mol of water converted to hydrate [mol]
number of mol of methane consumption to hydrate [mol]
initial number of mol of water in mixture [mol] conversion [%]
number of cells of hydrate structure I [-]
volume of one cell [m3/cell]
volume of hydrate [m3]
total volume of mixture [m3]
hydrate volume fraction [%] water cut or water fraction [%]
molecular weight of water [g/mol]
initial mass of water in mixture [g] mass density of the flowing phase [kg/m3]
UL
ρG
UG rp
AA-LDHI
KHI
THI
PD
ACL CMC
FBRM
PVM ATR
superficial velocity of liquid [m/s]
mass density of the gas phase [kg/m3]
superficial velocity of gas [m/s] repeated test
anti-agglomerant - low dosage hydrate inhibitor
kinetic hydrate inhibitor
thermodynamic inhibitor
pressure drop [bar]
average chord length [µm] critical micelle concentration [%]
Focused Beam Reflectance Measurement
Particle Video Microscope Attenuated Total Reflection
Acknowledgements
The authors are grateful to TOTAL E&P for the financial support in the Archimede-3 project and their
approval for publishing this paper. We also would like to acknowledge the contribution on technical support and
reviewing this manuscript from the members of TOTAL and the Gas Hydrate Dynamics Centre team at Ecole
des Mine de Saint Etienne.
Appendix A
The composition of Kerdane and anti-agglomerants is shown in Table A.1
Table A.1. Chemical composition and properties of Kerdane and AA-LDHI.
Substances/Properties Kerdane® Anti-agglomerants (AA-LDHI)
Chemical Composition Hydrocarbons, C11-C14,
n-alkanes, isoalkanes,
cyclical, < 2% aromatics
Natural oil based surfactant, methyl alcohol, ethanol,
2-(2-propoxyethoxy), ethylene glycol, diethylene
glycol, < 2% ethylene glycol monopropyl ether
Appearance Clear light yellow Clear light amber
Boiling Point/Interval 180-260°C No data available
Flash Point >64°C 15.6°C
Density 790-825 kg/m3
863 kg/m3
Kinematic Viscosity 2.1 mm2/s at 25°C No data available
Solubility Not applicable Water soluble
Gas bubble Hydrate formation on the surface of bubble
Hydrate growth + merge
Mergence
+ merge
Agglomeration
Hydrate broken
10
Appendix B Appendix C
To calculate the hydrate conversion, we used these
following equations:
To calculate the hydrate volume, these following
equations are applied:
CH4(g) + 5.75 H2O(l) = CH4 5.75 H2O(s) (B. 1)
ncrw(molecules) = ncrw(moles) ∗ N(Avogadro) (C. 1)
𝑛𝑐𝑟𝑤 = 𝑛𝐶𝐻4∗ 5.75 (B. 2)
ncell =ncrw(molecules)
46 (C. 2)
𝜂 =𝑛𝑐𝑟𝑤
𝑛𝑖𝑤𝑎𝑡𝑒𝑟
100% (B. 3)
VHyd = ncell ∗ Vcell (C. 3)
𝑛𝑖𝑤𝑎𝑡𝑒𝑟 =𝑚𝑤
𝑀𝑤
(B. 4) %volHyd =VHyd
Vtotal
100% (C. 4)
References A.Melchuna, A.Cameirao, JM.Herri, P.Glenat, 2016. Topological modeling of methane hydrate crystallization from low to high water cut emulsion systems, Fluid Phase Equilibria, Volume 413, 15 April 2016, P.158-169.
A.Fidel-Dufour, F.Gruy, JM.Herri, 2006. Rheology of methane hydrate slurries during their crystallization in a water in dodecane emulsion
under flowing, Chemical Engineering Science, Volume 61, Issue 2, January 2006, P.505-515 Aspenes, G., Dieker, L.E., Aman, Z.M., Hoiland, S., Sum, A.K., Koh, C.A., Sloan, E.D., 2010a. Adhesion force between cyclopentane
hydrates and solid surface materials. Journal of Colloid and Interface Science, 343(2):529{536.
B.H.Shi, J.Gong, C.Y.Sun, J.Kui, Zhao, Y.Ding, G.J. Chen, 2011. An inward and outward natural gas hydrates growth shell model considering intrinsic kinetics, mass and heat transfer. Chemical Engineering Journal, Volume 171, Issue 3, 15 July 2011, P.1308-1316.
D.Dalmazzone, N.Hamed, C.Dalmazzone, 2009. DSC measurements and modelling of the kinetics of methane hydrate formation in water-
in-oil emulsion. Chemical Engineering Science, Volume 64, Issue 9, 1 May 2009, P.2020-2026. D.Greaves, J.Boxall, J.Mulligan, E.D.Sloan, C.A. Koh, 2008. Hydrate formation from high water content-crude oil emulsions. Chemical
Engineering Science, Volume 63, Issue 18, September 2008, P.4570-4579.
D.J.Turner, K.T.Miller, E. D. Sloan, 2009. Methane hydrate formation and an inward growing shell model in water-in-oil dispersions. Chemical Engineering Science, Volume 64, Issue 18, 15 September 2009, P.3996-4004.
H.Moradpour, 2011. An Experimental and Modelling Investigation of the Rheological Properties of Water/Oil/Gas/Hydrate Mixtures. PhD Thesis, Heriot-Watt University, 2011.
E.Colombel, P.Gateau, L.Barre, F.Gruy, T.Palermo, 2010. Discussion of agglomeration mechanisms between hydrate particles in water in
oil emulsions. Oil and Gas Science and Technology, 2010. E.D.Sloan, C.A.Koh, 2008. Clathrate Hydrates of Natural Gases. CRC Press. Third Edition, 2008.
Gao, S., 2009. Hydrate risk management at high watercuts with anti-agglomerant hydrate inhibitors. Energy & Fuels, 23(4):2118{2121.
H.Tajima, F.Kiyono and A.Yamasaki, 2010. Direct observation of the effect of sodium dodecyl sulfate on the gas hydrate formation process in a static mixer. Energy Fuels, 2010, 24 (1), p.432–438
J.W. Lachance, E.D.Sloan, C.A. Koh, 2008. Effect of hydrate formation/dissociation on emulsion stability using DSC and Visual
techniques. Chemical Engineering Science, Volume 63, Issue 15, August 2008, P.3942-3947.
J.Chen, J.Liu, G.J. Chen, 2014. Insights into methane hydrate formation, agglomeration, and dissociation in water + diesel oil dispersed
system. Energy Conversion and Management, Volume 86, October 2014, P.886-891.
J.Chen, K.L.Yan, G.J.Chen, C.Y.Sun, B.Liu, N.Ren, D.J.Shen, M.Niu, Y.N.Lv, N.Li, A.K.Sum, 2015. Insights into the formation mechanism of hydrate plugging in pipelines. Chemical Engineering Science, Volume 122, 27 January 2015, P.284-290.
K.L.Yan, C.Y. Sun, J.Chen, L.T.Chen, D.J.Shen, B.Liu, M.L.Jia, M.Niu, Y.N.Lv, N.Li, Z.Y.Song, S.S.Niu, G.J.Chen, 2014. Flow
characteristics and rheological properties of natural gas hydrate slurry in the presence of anti-agglomerant in a flowloop apparatus. Chemical Engineering Science, Volume 106, 17 March 2014, P.99-108.
Le.B. H, Cameirao. A, Herri. JM, Darbouret. M, Peytavi. J.L, Glenat. P, 2010. Chord length distributions measurements during
crystallization and agglomeration of gas hydrate in a water-in-oil emulsion: Simulation and experimentation. Chemical Engineering Science, Volume 65, Issue 3, 1 February 2010, P.1185-1200.
L.Mu, S.Li, Q.L.Ma, K.Zhang, C.Y. Sun, G.J.Chen, B.Liu, L.Y.Yang, 2014. Experimental and modeling investigation of kinetics of
methane gas hydrate formation in water in oil emulsion. Fluid Phase Equilibria, Volume 362, 25 January 2014, P.28-34. M.Sun, A.Firoozabadi, 2015. Gas hydrate powder formation – Ultimate solution in natural gas flow assurance. Fuel, Volume 146,15 April
2015, P.1-5
M.Sun, A.Firoozabadi, G.J.CHEN, C.Y.SUN, 2014. Hydrate size measurements in anti-agglomeration at high water cut by new formulation. Proceedings of the 8th International Conference on Gas Hydrates (ICGH8-2014),Beijing, China, 28 July - 1 August, 2014
Prasad U. K, Jae W. L, J.F. Morris, 2012. Calorimetric investigation of cyclopentane hydrate formation in an emulsion. Chemical
Engineering Science, Volume 68, Issue 1, 22 January 2012, P.481-491. R.Camargo, T.Palermo, 2002. Rheological properties of hydrate suspensions in an asphaltenic crude oil. Proceeding of the Fourth
International Conference on Gas Hydrate, Yokohama, May 19-23, 2002.
S.V. Joshi, G.A. Grasso, P.G. Lafond, I.Rao, E.Webb, L.E. Zerpa, E. D.Sloan, C.A. Koh, A.K. Sum, 2013. Experimental flowloop investigations of gas hydrate formation in high water cut systems. Chemical Engineering Science, Volume 97, 28 June 2013, P.198-209.
S.Talatori, T.Barth, 2013. Rate of hydrate formation in crude oil/gas/water emulsions with different water cuts. Journal of Petroleum
Science and Engineering, Volume 80, Issue 1, December 2011, P. 32-40. S.Yang, Derek M.K, Z.Huo, E.D.Sloan, K.T Miller, 2004. Temperature dependence of particle–particle adherence forces in ice and clathrate
hydrates. Journal of Colloid and Interface Science, Volume 277, Issue 2, 15 September 2004, P.335-341
Y.H.Sohn, J.Kim, K.Shin, D.Chang, Y.Seo, Zachary M. A, Eric F. May, 2015. Hydrate plug formation risk with varying water cut and inhibitor concentrations. Chemical Engineering Science, Volume 126, 14 April 2015, P.711-718
Y.-T. Luo, J.-H. Zhu, S.-S. Fan, G.-J. Chen, 2007. Study on the kinetics of hydrate formation in a bubble column. Chemical Engineering
Science, Volume 62, Issue 4, February 2007, P.1000-1009